UrbanEmissions.Info stands for (a) sharing knowledge on air pollution (b) science based air quality analysis (c) advocacy and awareness raising on air quality management and (d) building partnerships among local, national, and international air-heads.
If individuals are poorly informed, confused, or downright inconsistent—as nearly all of us are, at times—the notion of “what we want” isn’t always so clear (Tyler Cowen, Stubborn Attachments).
 Latest in Publications

- Air quality management during the rush to the great indoors (2026) [link]
- Reading the air: A practical guide to air quality data and its uses (2026) [link]
- 40 by 2040: Cost of inaction and delays in reaching Delhi’s air quality target (2025) [link]
- Ten Essential Air Quality Research Areas That Need Support (2025) [link]
- Five reasons why Delhi’s air pollution problem is complex (2025) [link]
- Statistical Ambiguity: Was Delhi’s air quality in July 2025 the best in a decade? (2025) [link]
- Five institutional reforms needed to support the fight for better air quality in India (2025) [link]
- APnA City Program: Multi-Pollutant Emissions Inventory and PM2.5 Pollution Source Apportionment for Bandung, Indonesia (2025) [link]
- Fuel Station Survey (FuSS) to profile in-use vehicle characteristics (2025) [link]
- Browse all publications here
AQ-NEST: Air Quality Network Evaluation & Siting Tool
Do you access data from a monitoring network? How many monitors do you have access to? Do you feel it is representative of the state of the air in your city (or airshed or community)?
AQ-NEST, using thumb rules, helps understand how representative a station or network of stations is, taking into account population density and the spread of the network. The tool helps you place monitors in the best possible design for maximum representativeness to support health exposure assessment.
The tool can used to evaluate and study the placement of ambient monitoring networks for the following regions — Central Asia, South Asia, Southeast Asia, Africa, Central America, and South America.
Repository of gridded emission inventories for India and Indian cities

This open repository [link] distributes gridded emission inventories (national and urban) by UEinfo. These are not official inventories for India or for the individual city airsheds. These inventories were used internally for long-term air quality analysis (like APnA city program) and short-term air quality forecasting. The methodologies commonly employed to build emission inventories and establish this baseline information are explained under tools and in the beginners handbook. The modeling architecture is explained in a series of working papers. Supporting information for these inventories is documented under resources and publications (including journal articles).
What is missing from the air quality dialogues in India?
The answer is not what most people assume. The missing piece is not “more data”. What is truly absent goes deeper than data and changes the entire line of thinking. The missing piece is the pathway — a long-term (10-15 year) time-bound pathway from the current baseline to actionable targets for each sector. Without a defined pathway, line departments cannot make accountable decisions on how much needs to be done and what needs to be done. A pathway must translate from high-level ambition to department-level action.
Read the full blog here.
Link to working paper #SIM-63-2025 (cost of delays in addressing Delhi’s air pollution) and more.
India National Clean Air Programme (NCAP) – Data Repository
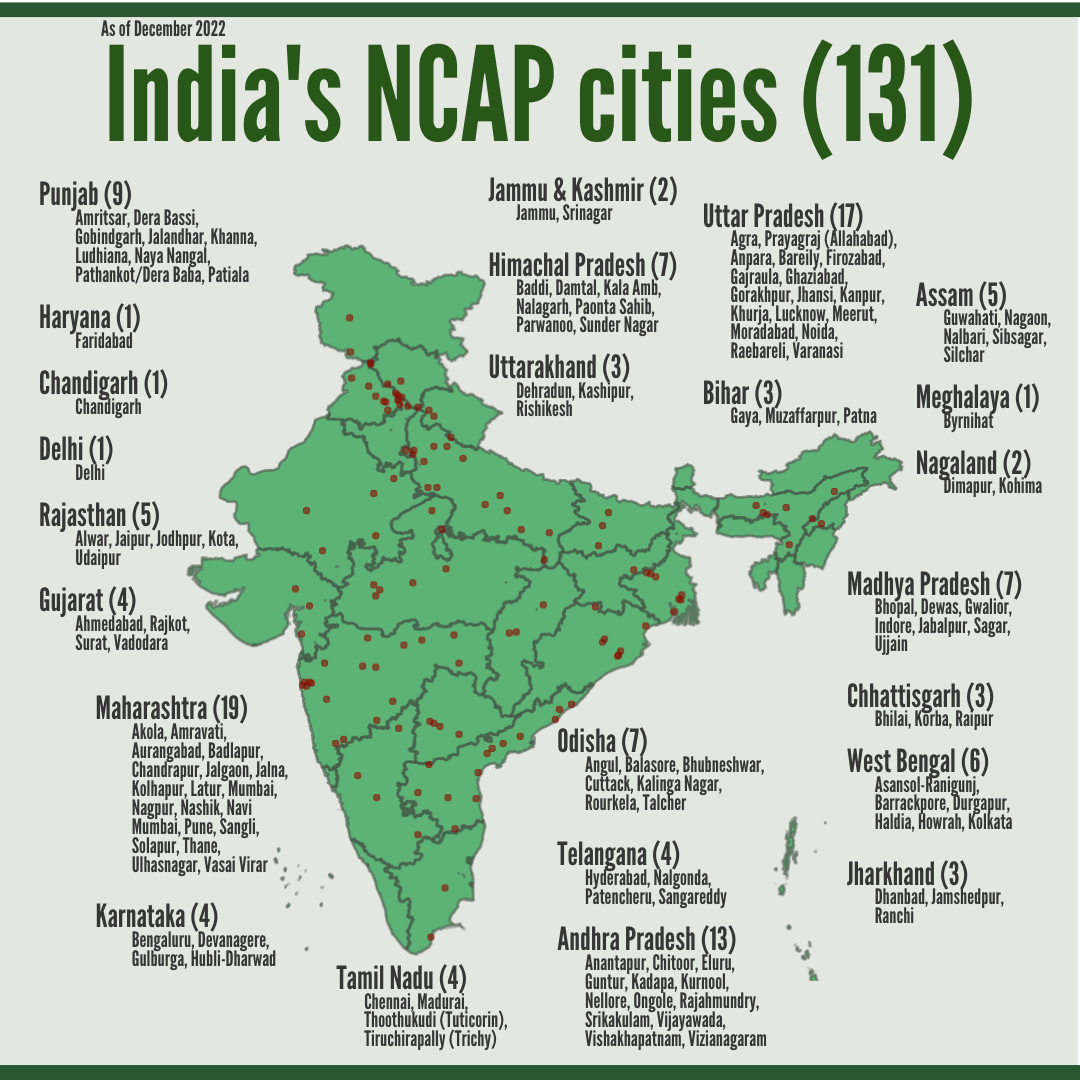
NCAP was introduced in 2019 to address air pollution in India’s non-attainment cities. The current list of 131 cities are required to document (1) emission and pollution load via monitoring and modelling (2) activities necessary for all the known sources to achieve the pollution target (3) plans to build institutional capacity to manage the information flow and (4) ways to oversee the progress of various components. In support of the program, here are the data resources and synthesis reports.
- List of the non-attainment cities and designated airsheds (here)
- A review of the approved action plans (here)
- Download ambient monitoring needs information by airshed (here)
- Download GIS information by airshed (road lines & road density) (urban built-up area)
- Download average TROPOMI extracts for the designated airsheds for 2019-2023 – NO2, SO2, O3, HCHO
- Download monthly average meteorological data from reanalysis fields for 1980-2023 – 2m-temp, rainfall
- Download city-wise official daily AQI data 2015-2023 (here)
- Download airshed-wise gridded reanalyzed PM2.5 concentrations data 1998-2022 (here)
- Air quality modeling tools – examples and reference notes (here)
- Explore more here
India-NCAP publications for reference (browse here)
- Ten Essential Air Quality Research Areas That Need Support (2025)
- Five institutional reforms needed to support the fight for better air quality in India (2025)
- Assessing Air Quality During India’s National Clean Air Programme (NCAP): 2019-2023 (2025)
- Landscape review of air quality modeling in India (2024)
- Designating Airsheds in India for Urban and Regional Air Quality Management (2024)
- Plugging the ambient air monitoring gaps in India’s national clean air programme (NCAP) airsheds (2023)
- Evolution of India’s PM2.5 pollution between 1998 and 2020 using global reanalysis fields coupled with satellite observations and fuel consumption patterns (2022)
- National Clean Air Programme (NCAP) for Indian cities: Review and outlook of clean air action plans (2020)
- Nature of air pollution, emission sources, and management in the Indian cities (2014)
Want to Learn the Basics of Air Quality Management?
When people do not understand the jargon, they cannot ask the right questions. When they do not understand how information flows through an air quality management system, they cannot spot where things go wrong. And when stakeholders are not aligned on the basics, even good plans stall. This course is conceptualized because the “gap in operational understanding of information” is real.
The course is not about turning everyone into a technical expert. It is about giving the audiences enough of a shared foundation that they can work together. The goal is simple: when people understand the information and can talk about it clearly, they make better decisions. And when better decisions get made on air quality, the outcomes improve for everyone.
Primers for Air Quality Managers
 |
 |
 |
 |
 |
 |
 |
 |
PM2.5 Pollution in India States and Districts
Reanalyzed PM2.5 concentrations and modelled source contributions were analyzed to present (a) India’s % area exposed to various pollution bins in 1998-2020 (b) India’s % population exposed to various pollution bins in 1998-2020 (c) All India pollution maps for 1998-2020 (d) State and Union Territory maps for 1998-2020 (e) State pollution rank among the 36 States and Union Territories for 1998-2020 and (f) Average % source contributions at State level for 2017. All the maps, extracted data files, infographs, and animations are available here.
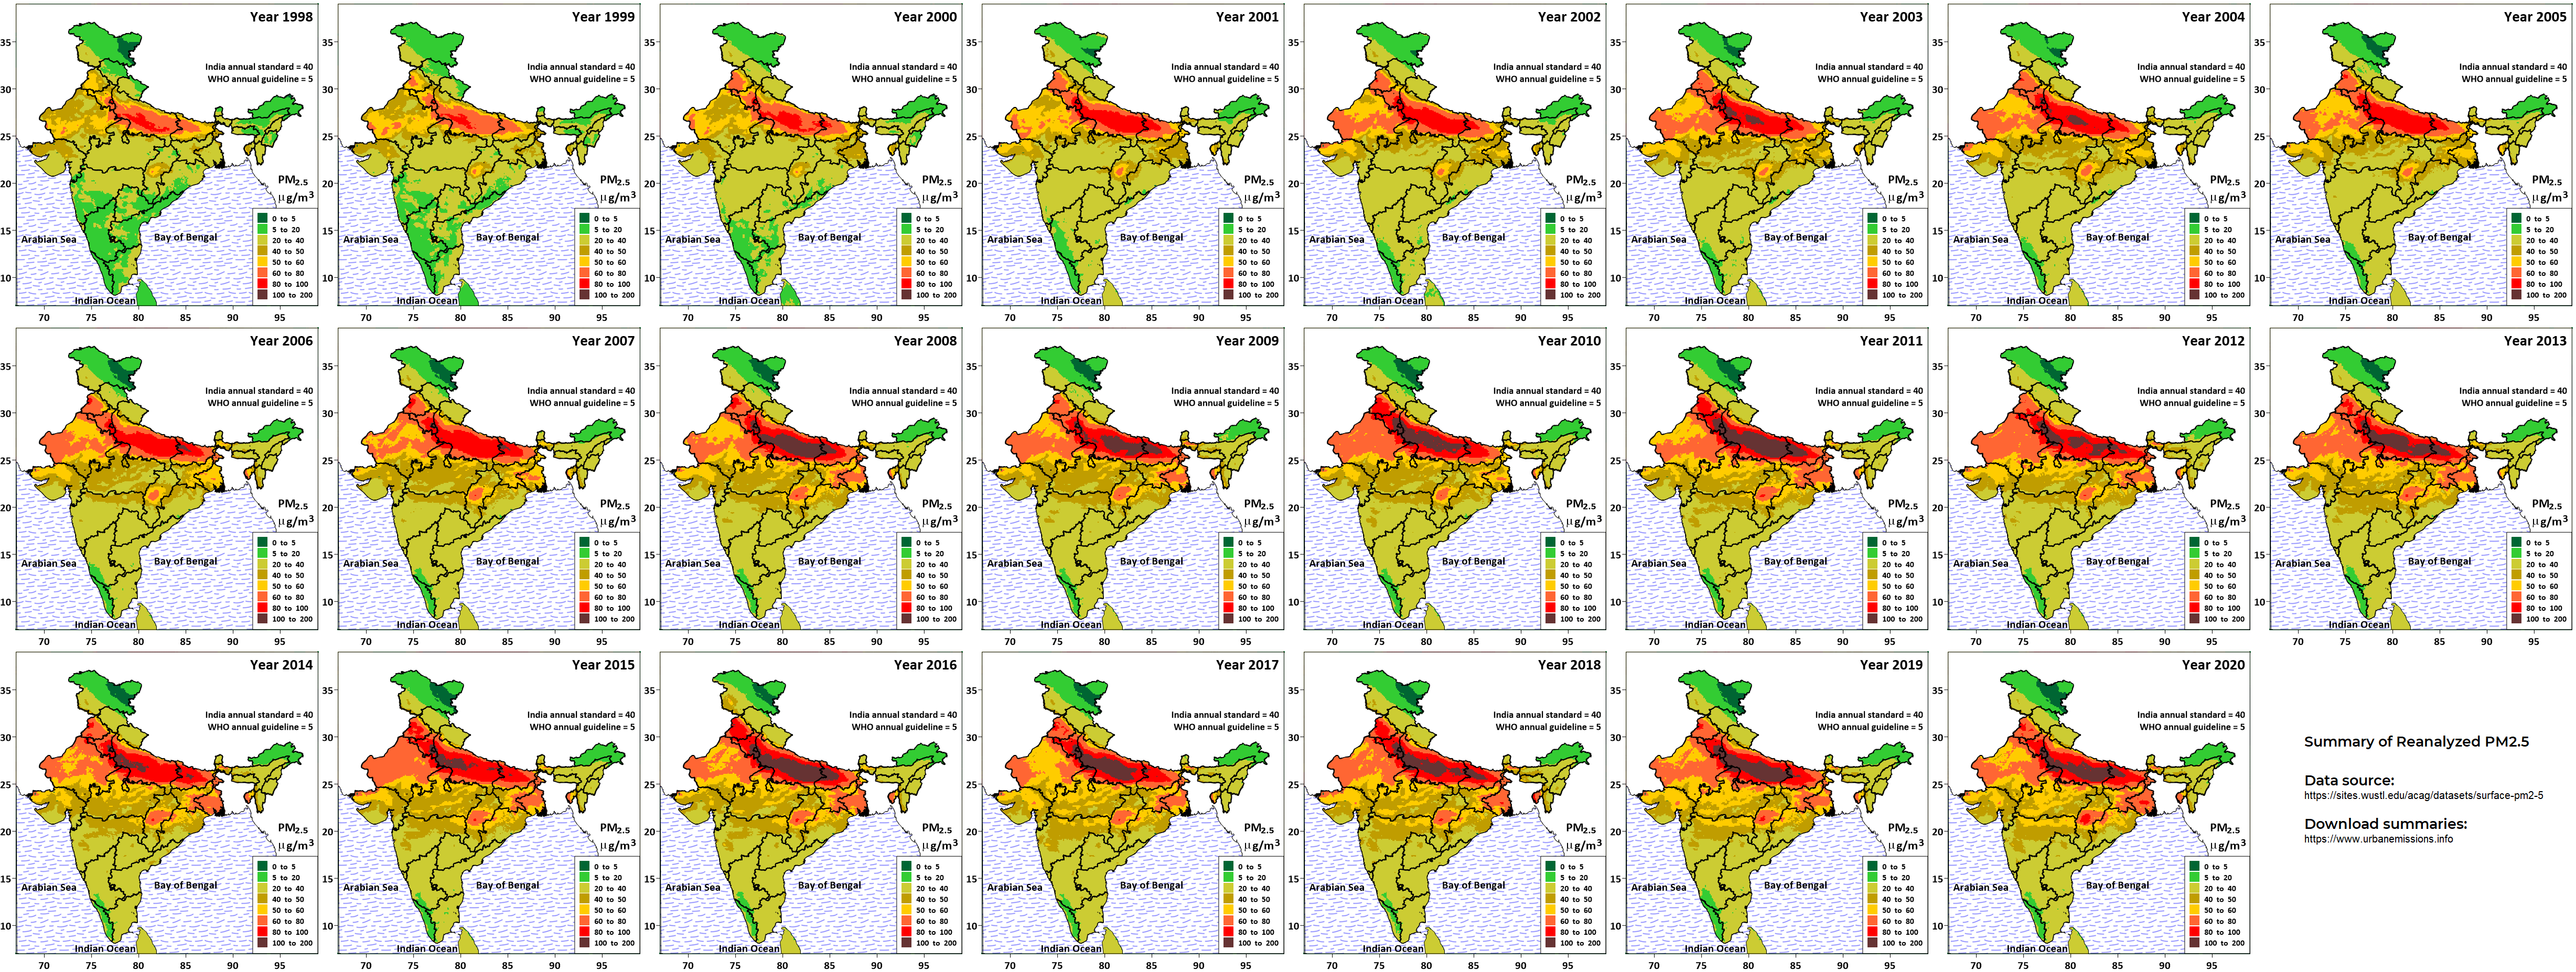
Open access journal article “Evolution of India’s PM2.5 Pollution Between 1998 and 2020 Using Global Reanalysis Fields Coupled with Satellite Observations and Fuel Consumption Patterns” and supplementary information is published here.
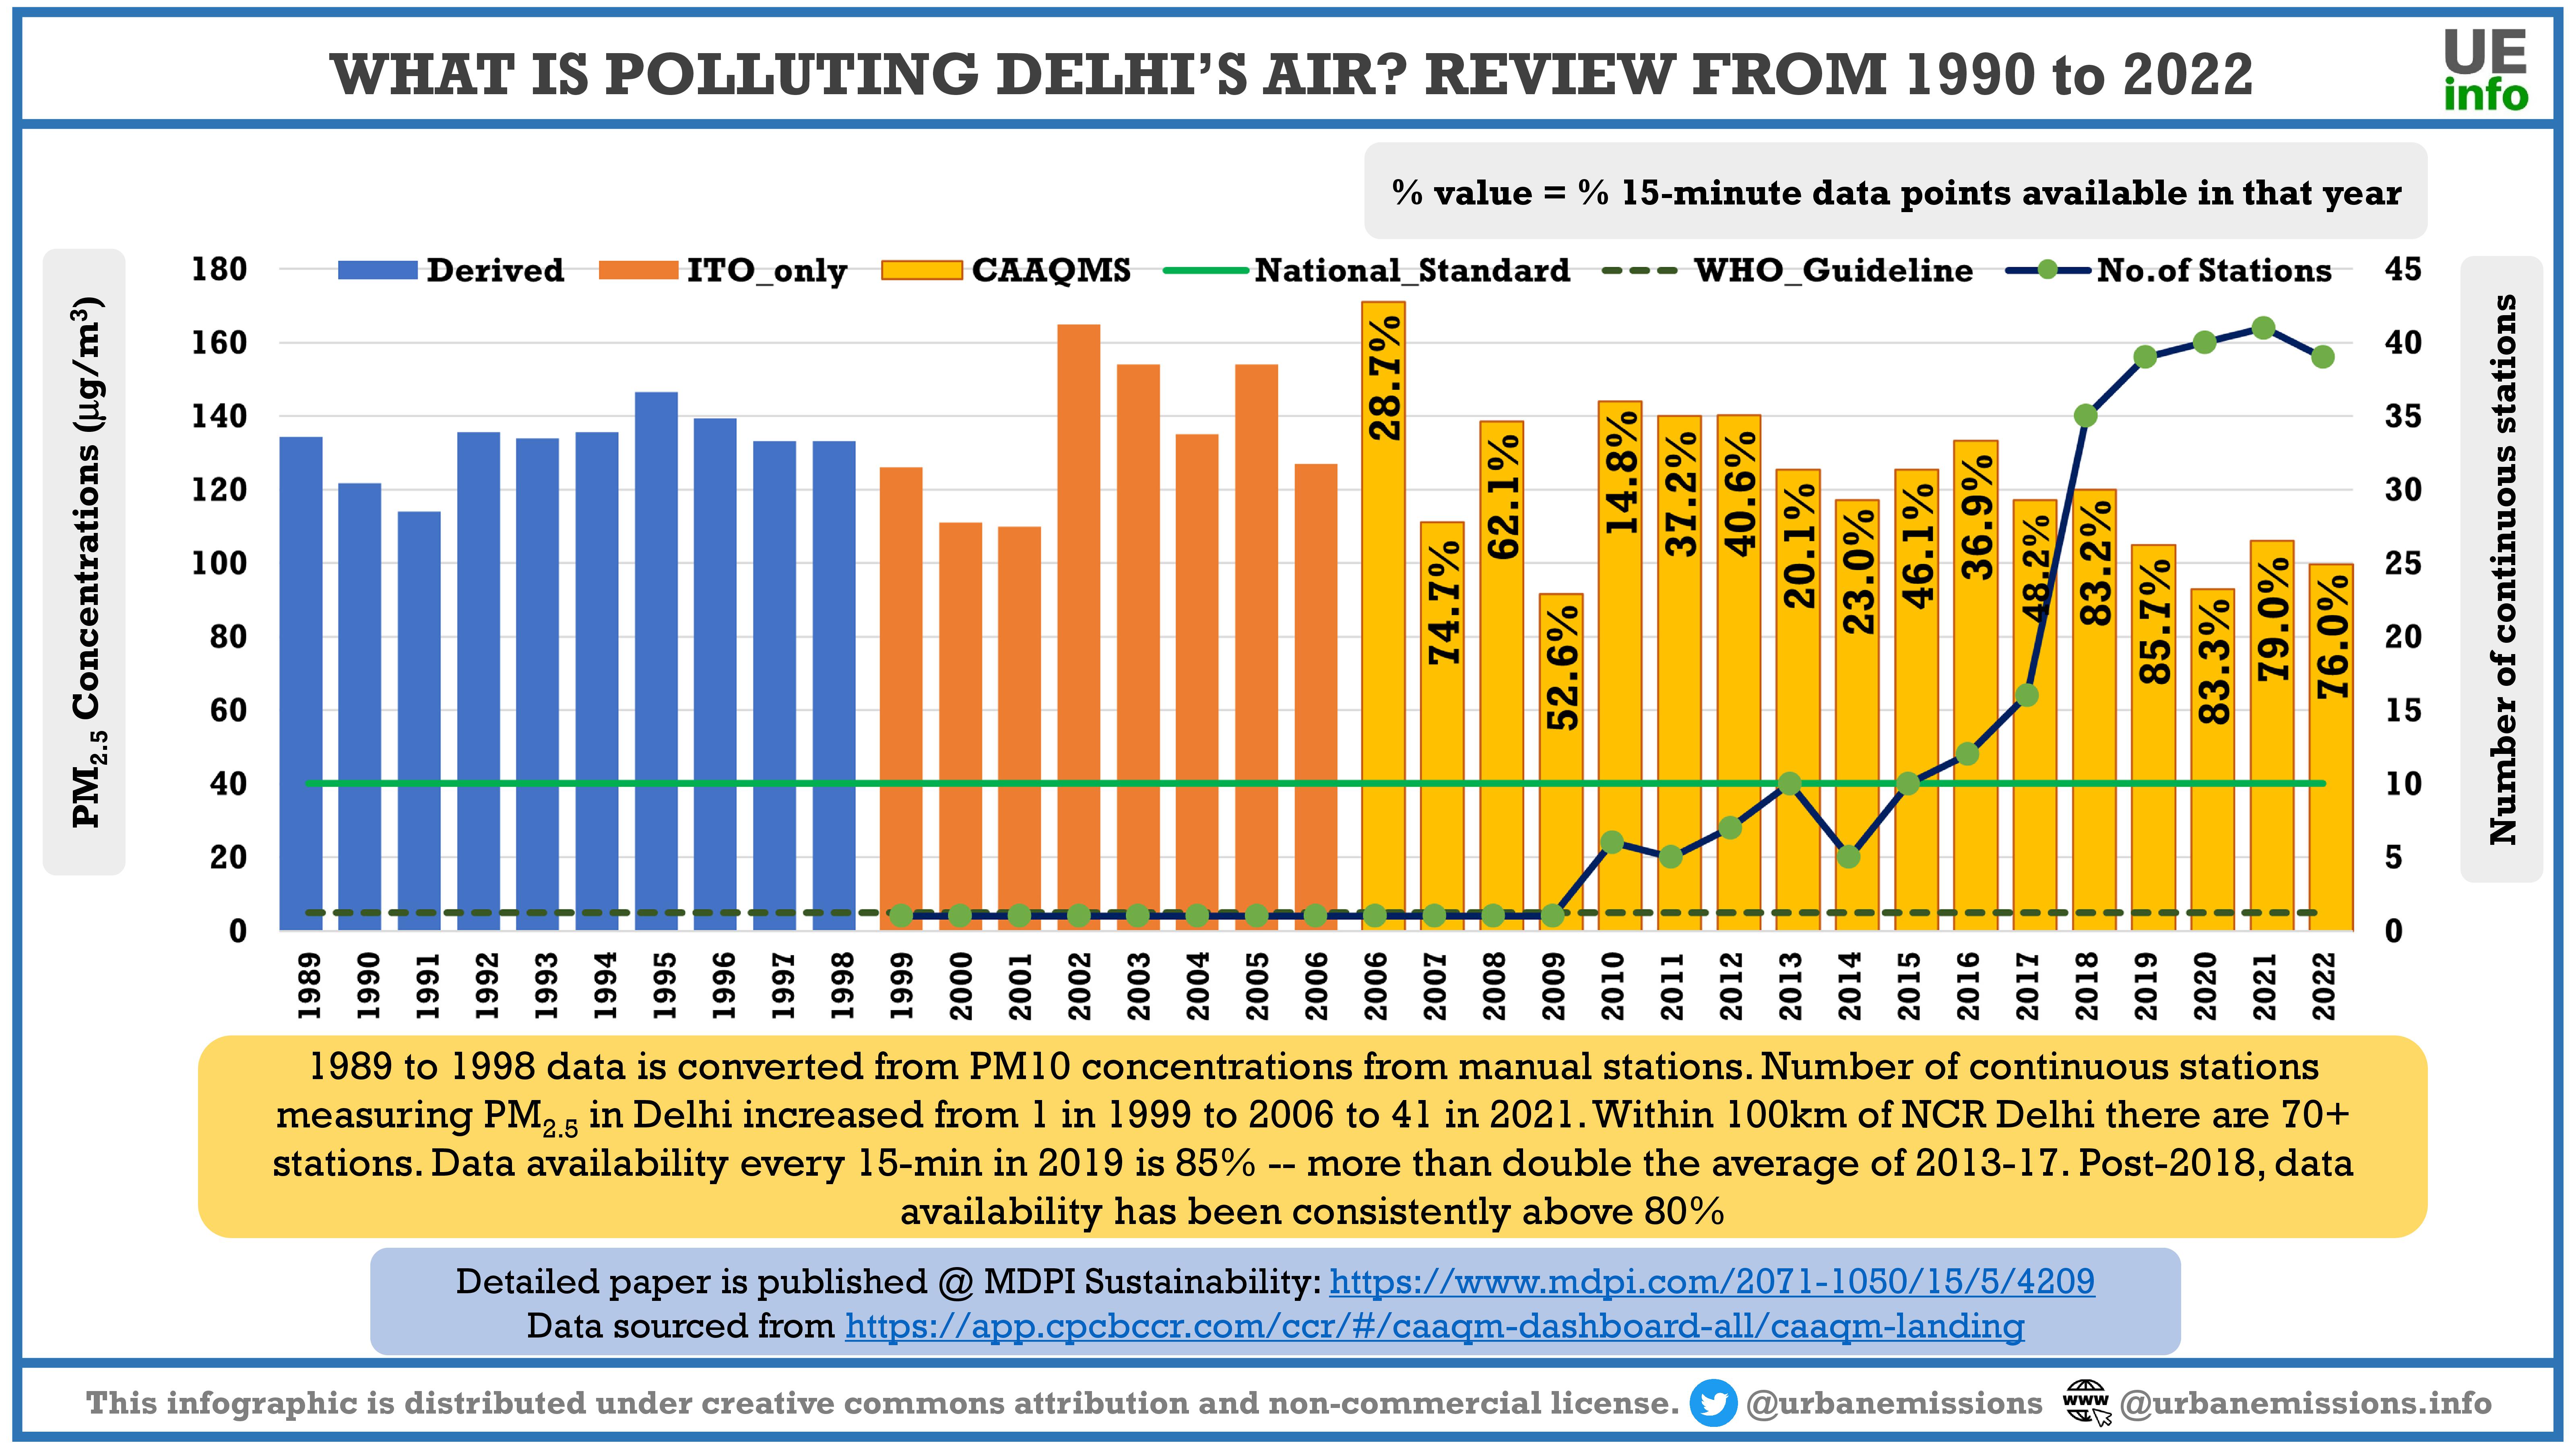
What is Polluting Delhi’s Air?
Air pollution in (urban and rural) India is a growing public concern, and city of Delhi (its capital) is one of the most studied city with a disproportionate share of media attention. Yet, we do not seem to have decisive answers to simple questions like how polluted is the city, what are the main sources, and where to start to control pollution in the city. A review of Delhi’s air quality from 1990 to 2022 from data, sectoral, judicial, and institutional perspectives was published as a journal article in 2023 and the associated data and references is available [here].
Browse other publications on Delhi’s air quality here
- 40 by 2040: Cost of inaction and delays in reaching Delhi’s air quality target (2025)
- Five reasons why Delhi’s air pollution problem is complex (2025)
- Statistical Ambiguity: Was Delhi’s air quality in July 2025 the best in a decade? (2025)
- Understanding Delhi’s Diwali Emission Loads (2024)
- Air Quality Index Analysis for Indian Cities 2015-2023 (2024)
- Health modelling of transport in low-and-middle income countries: A case study of New Delhi, India (2022)
- Aerosol speciation and meteorology data sets from Delhi supersite study – Jan’17 to Mar’18 (2021)
- What it means to take the long view on air pollution in Delhi? (2021)
- Can we vacuum our air pollution problem using smog towers? (2020)
- On-road PM2.5 pollution exposure in multiple transport microenvironments in Delhi (2015)
- Role of urban growth, technology, and judicial interventions on vehicle exhaust emissions in Delhi for 1991-2014 and 2014-2030 periods (2015)
- Evolution of on-road vehicle exhaust emissions in Delhi (2015)
- Benchmarking vehicle and passenger travel characteristics in Delhi for on-road emissions analysis (2015)
- A GIS based emissions inventory at 1km x 1km spatial resolution for air pollution analysis in Delhi, India (2013)
- Multi-pollutant emissions inventory for the National Capital Region of Delhi (2012)
- Air quality forecasting system for cities – Modeling architecture for Delhi (2011)
- Photochemistry of air pollution in Delhi, India – A monitoring based analysis (2009)
 |
 |
Air Pollution Knowledge Assessments (APnA) city program

Launched in August 2017, the APnA city program is designed to provide a starting point for understanding air pollution in urban agglomerations to support public dialogue and policy discussions. Architecture behind the APnA city program is carved and updated from our operational all India air quality forecasting platform.
We currently have stories for 60 Indian cities – Agra, Amritsar, Bengaluru, Bhopal, Bhubaneswar, Chandigarh-Ambala-Patiala, Chennai, Coimbatore, Dehra Dun, Indore, Jaipur, Kanpur, Kochi, Ludhiana, Nagpur, Patna, Pune, Raipur-Durg-Bhilai, Ranchi, Varanasi, Agartala, Ahmedabad, Allahabad, Asansol-Durgapur, Aurangabad, Dharwad-Hubli, Dhanbad-Bokaro, Gaya, Guwahati-Dispur, Gwalior, Hyderabad, Jamshedpur, Jodhpur, Kolkata-Howrah, Kota, Lucknow, Madurai, Mumbai, Nashik, Panjim-Vasco-Margao, Puducherry, Rajkot, Shimla, Srinagar, Surat, Thiruvananthapuram, Tiruchirapalli, Vadodara, Vijayawada-Guntur, and Visakhapatnam.
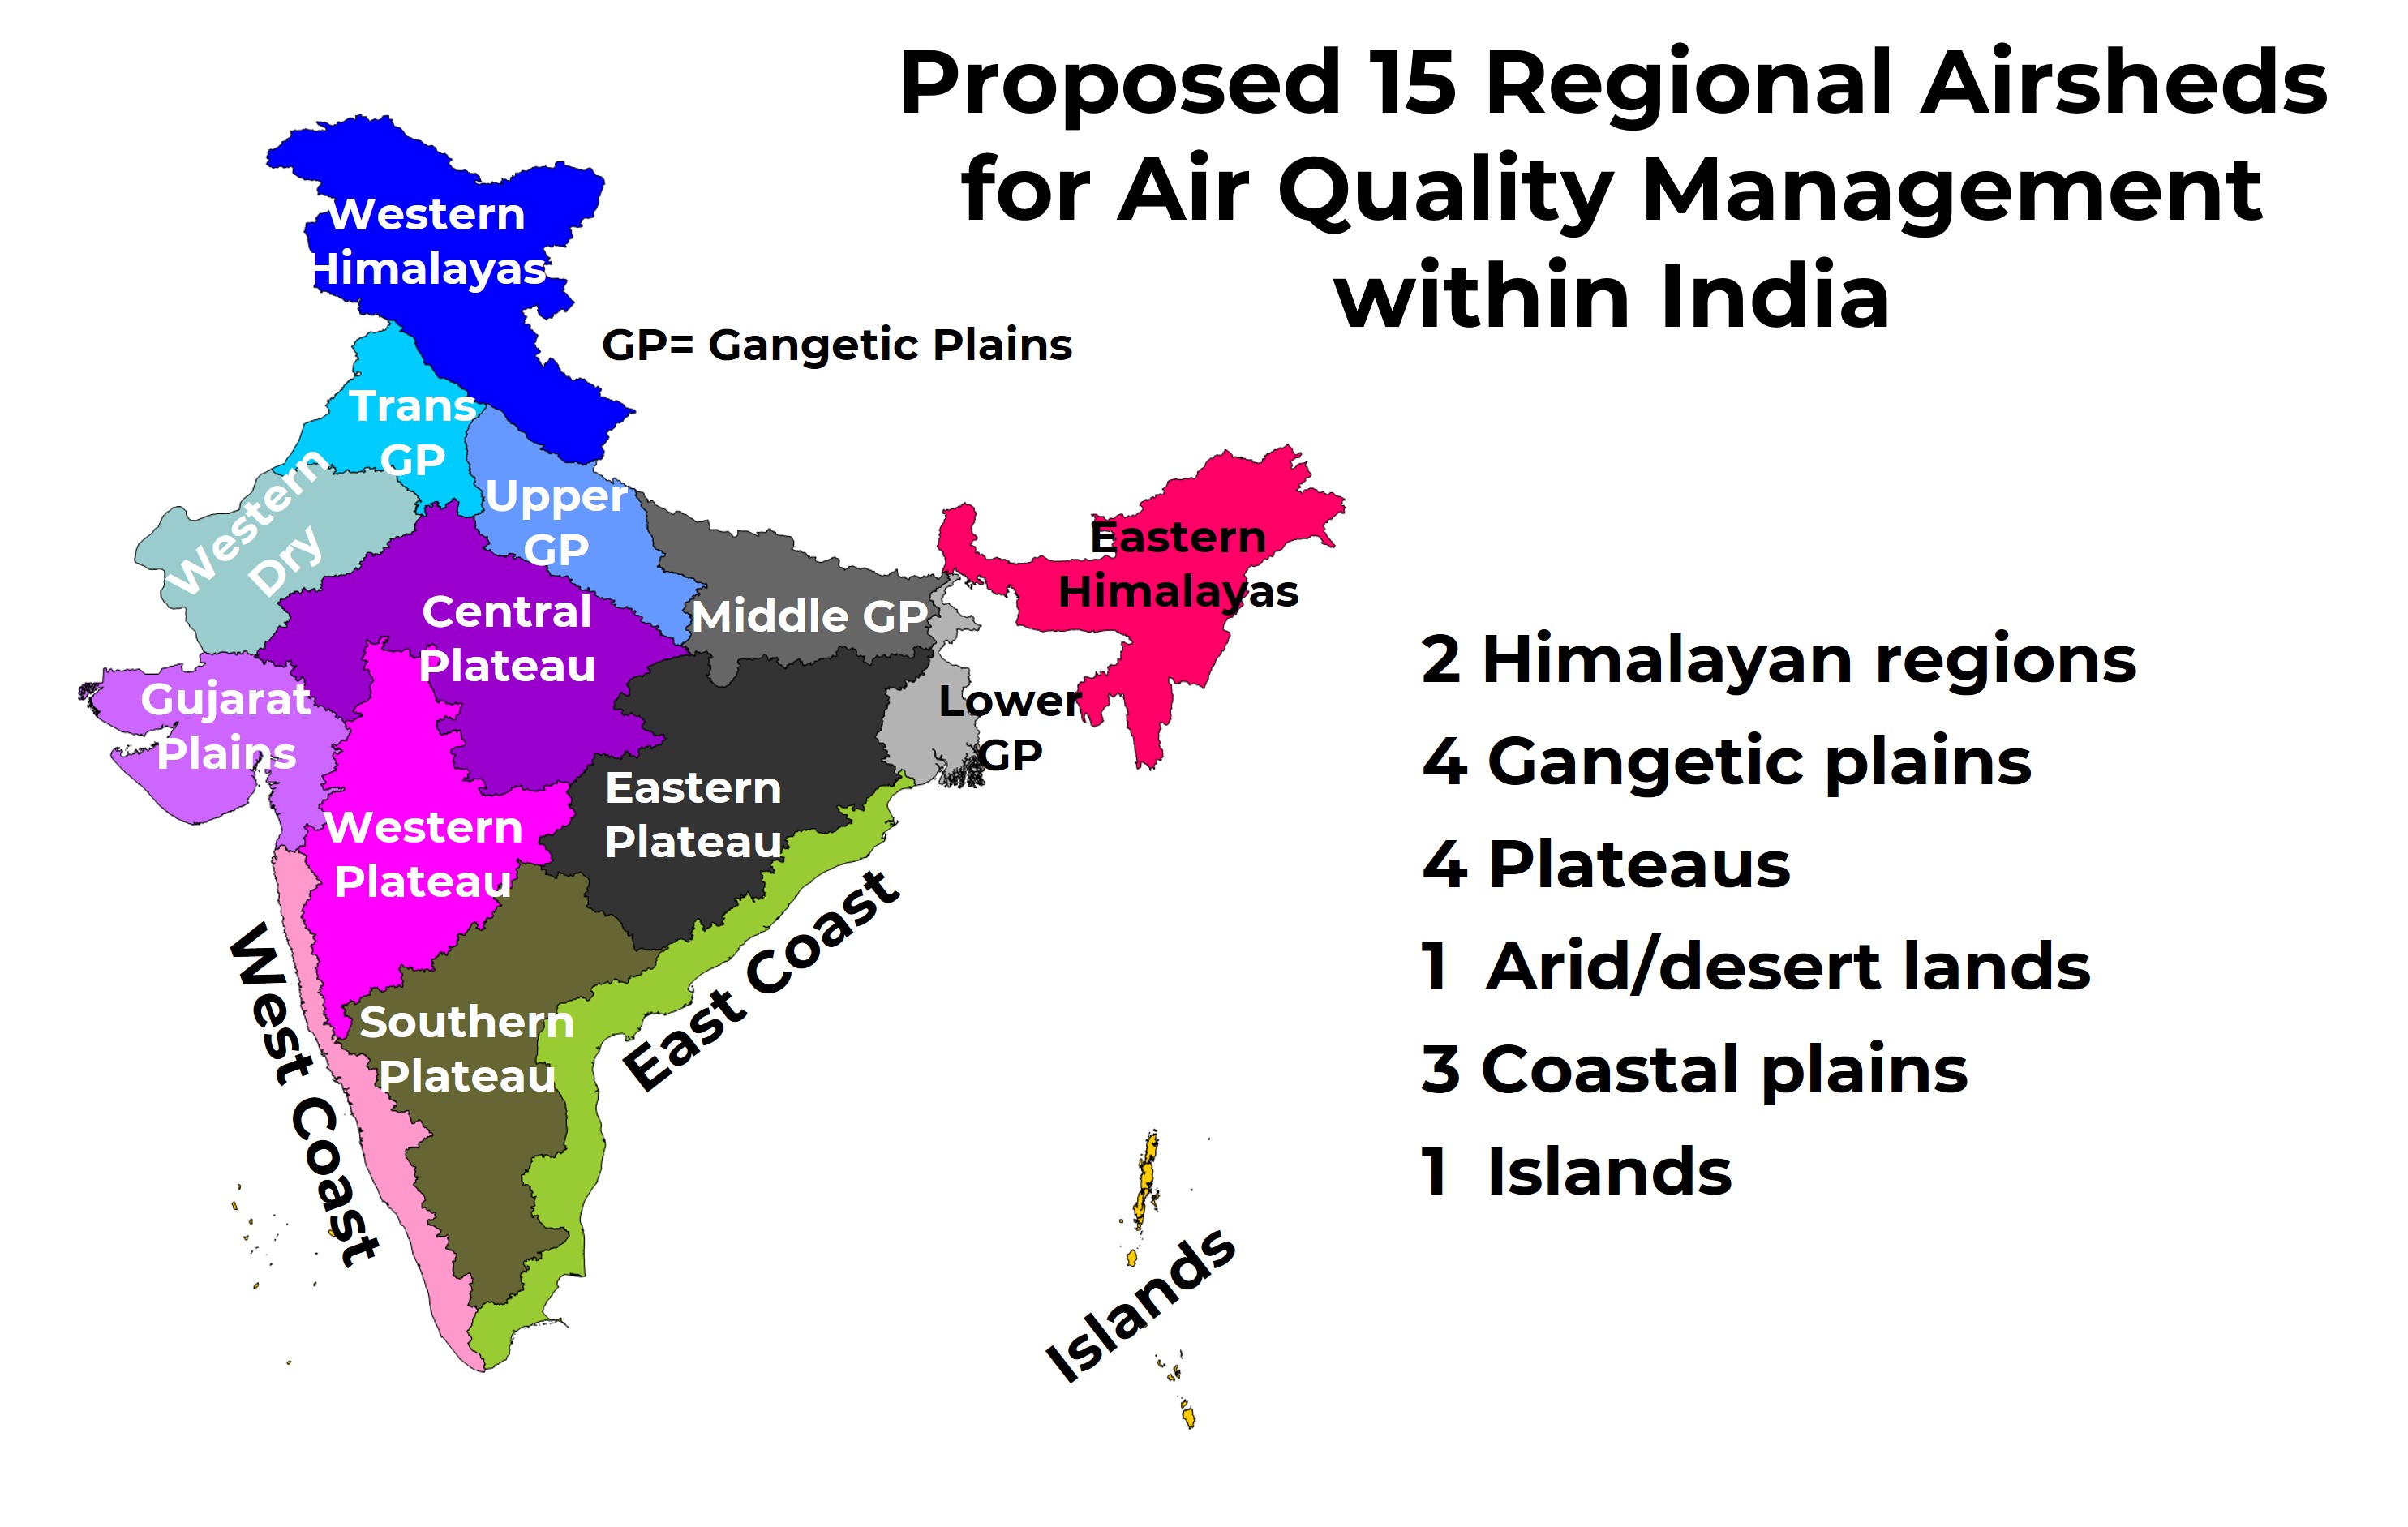
What are India’s Airsheds for Regional Air Quality Management?
Journal Article in Air (2024) [publication link]
Air pollution knows no boundaries, which means for a city or a region to attain clean air standards, must not only look at the emission sources within its own administrative boundary, but also at sources in the immediate vicinity and those originating from long-range transport. And there is a limit to how much area can be explored to evaluate, govern, and manage as designated airsheds for cities and larger regions. This paper discusses the need from an official airshed framework for India’s air quality management, urban airsheds designated for India’s 131 non-attainment cities under the national clean air programme, and proposes climatically and geographically appropriate regional airsheds to support long-term planning. Between 28 states, eight union territories, 36 meteorological sub-regional divisions, and six regional meteorological departments, establishing the proposed 15 regional airsheds for integrated and collaborative air quality management across India is a unique opportunity. [Download supporting information @ zenodo]
Landscape Review of Air Quality Modeling in India
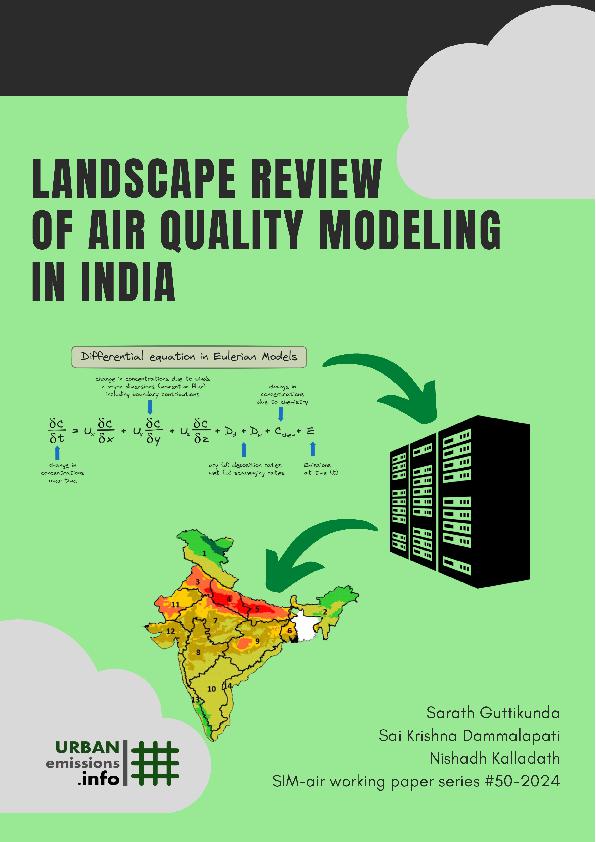
Air quality modeling (AQM) is “data management” and the goal of this exercise is to support clean air action planning and implementation. This data provides us with the knowledge to validate the progress made or not made from various emissions management programs in space and time. All this data further strengthens the dialogue between data generators, data consumers, policy makers, and the public.
In this working paper, we refer to AQM following the classical modeling path and we reviewed the progress made by the modeling community, identified some research gaps, and proposed some line items to extend India’s air quality modeling efforts (content-wise and institutionally). AQM is an involved exercise, in need of a lot of data and a lot of computational power from the first step of emissions modeling to evaluating clean air action plans. When all these components come together, forms of input and output data can support various stages of air quality management process. This landscape review is limited to the horizontal-scope of research activities and did not investigate the depth of the research activities.
Link to working paper #SIM-50-2025 and more.