 Here we present a repository of data resources with information directly relevant for energy, emissions, and pollution analysis in India (click on the link or scroll down)
- Official national and state level portals (here)
- Guidelines, acts, standards, and rules documents (here)
- All relevant resources for India’s NCAP program (here)
- Ambient air quality monitoring (here)
- Satellite retrievals and tools (here)
- Global and regional health impact analysis and tools (here)
- Compiled statistics, maps, and other geospatial databases (here)
- Compiled databases on energy, emissions, meteorology, and reanalysis fields (here)
This list was last updated in January 2024. Click on the image to download all the links as a PDF working paper.
- Example calculators for emissions and pollution modeling, including methods to build supporting information [download here]
- Instructional and informational videos (view here)
- Ministry of Environment, Forests, and Climate Change (MoEFCC)
- National Green Tribunal (NGT)
- Environment Pollution (Protection & Control) Authority (EPCA)
- Central Pollution Control Board (CPCB)
- State Pollution Control Boards
- Pollution Control Committees
- Andaman & Nicobar Islands
- Chandigarh
- Dadra, Nagar Haveli, Daman, & Diu
- Delhi
- Jammu & Kashmir
- Ladakh
- Lakshadweep
- Puducherry
- National Environmental Engineering Research Institute (CSIR-NEERI)
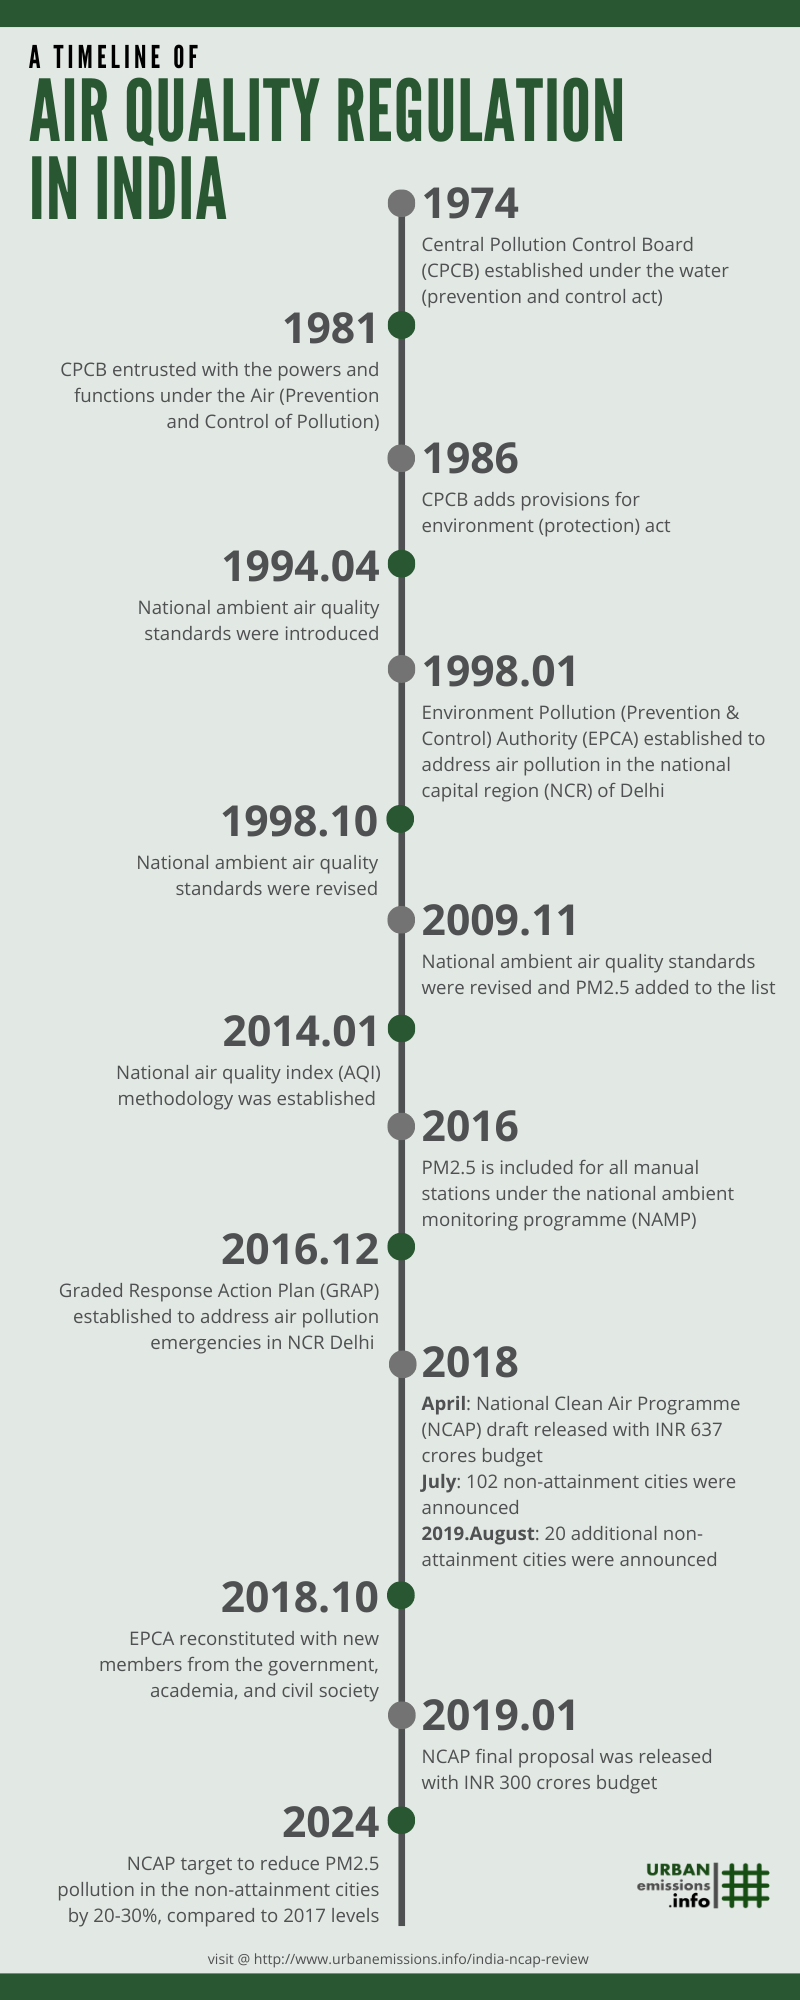
- Air (Prevention and Control of Pollution) Act, 1981, amended 1987
- Environment (Protection) Act, 1986 and Rules thereunder
- National Green Tribunal Act, 2010
- National Ambient Air Quality Standards, amended 2009
Environmental Standards
- 17 major polluting industries
- Aluminium Smelter, Caustic Soda, Cement, Copper Smelter, Distilleries, Dyes & Dye Intermediates, Fertiliser, Integrated Iron & Steel, Tanneries, Pesticides, Petrochemicals, Drugs & Pharmaceuticals, Pulp & Paper, Oil Refineries, Sugar, Thermal Power Plants, Zinc Smelter
- Effluent emission standards are listed @CPCB and @MoEFCC. Here is a summary for the heavy industry
- Bricks
- Cement
- Coal mines
- Coal washeries
- Copper, Lead, and Zinc smelting
- Fertilizers
- Glass
- Iron and Steel
- Paper and Pulp
- Pesticides
- Petrochemicals
- Sewage Treatment
- Sugar
- Tanneries
- Textiles
- Thermal power plants
 National Clean Air Programme (NCAP)
- Documents
- Draft NCAP proposal (2018)
- Final NCAP proposal (2019)
- City by city approved action plans are available here or here
- A review of the 102 approved action plans – conducted by Urban Emissions and CEEW, July 2020. Final publication here.
- A review of 10 approved action plans – conducted by NRDC, January 2020
- Portals
- Resource material
- Main NCAP data portal (here)
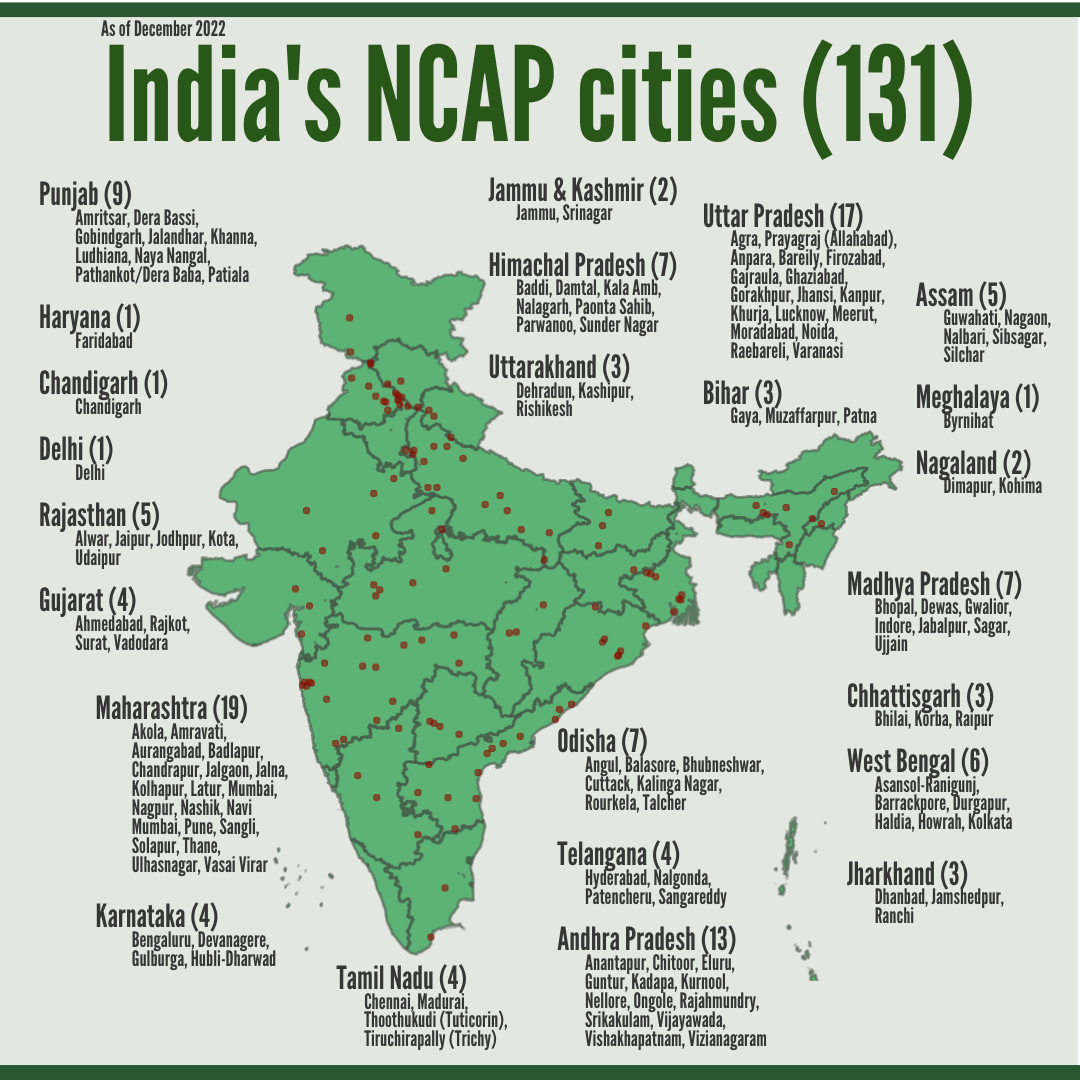
- List of non-attainment cities and designated airsheds (here)
- A review of the approved action plans (here)
- Ambient monitoring needs for each of the designated airsheds (here)
- Database of (GIS) road lines and road density information by airsheds (here)
- Database of urban built-up area shares by airshed (here)
- Database of TROPOMI S5P satellite’s 2019-2023 NO2 extracts for the airsheds (here)
- Database of TROPOMI S5P satellite’s 2019-2023 SO2 extracts for the airsheds (here)
- Database of TROPOMI S5P satellite’s 2019-2023 O3 extracts for the airsheds (here)
- Database of TROPOMI S5P satellite’s 2019-2023 HCHO extracts for the airsheds (here)
- Database of reanalyzed monthly average 2m-temperature for 1980-2023 (here)
- Database of reanalyzed monthly average precipitation rate for 1980-2023 (here)
- 101 style blog piece on air monitoring in India
- Guidelines and technical specifications
- 2003 – guidelines for ambient air monitoring
- 2015 – technical specifications for continuous ambient air quality monitoring stations (CAAQMS)
- 2018 – technical specifications for continuous emissions monitoring (CEMS)
- Number of monitoring states recommended by state and by district (based on the guidelines published by CPCB, 2003)
- National Ambient Monitoring Program (NAMP) – manual monitoring network operated and maintained by CPCB, India
- Table of monitoring stations (as of July 2020)
- Annual average summary of air quality and number of monitoring days (2013, 2014, 2015, 2016, 2017, 2018, 2019, 2020, 2021)
- Daily average summary of air quality (2021)
- Daily AQI bulletins
- Monthly AQI bulletins
- Compiled NAMP air quality data (as excel) for 2011-2015
- Continuous Ambient Air Quality Monitoring System (CAAQMS) – real-time monitoring network operated and maintained by CPCB, India
- Continuous Emissions Monitoring System (CEMS) – real-time emissions and effluent monitoring data for 17 categories of Industries and common facilities (link)
- System of Air Quality and Weather Forecasting And Research (SAFAR) – real-time monitoring network operated and maintained by IITM, Pune, India
- A global summary of outdoor ambient air quality data by WHO (2018)
- A review piece of WHO data included for India (2018)
- openaq.org – aggregator and harmonizer of real-time and historical air quality data from official
(government) reference-grade data and air sensor data worldwide (information on how to access data is here) - IQair – aggregator of official and unofficial data across the globle
- Breezo.in – aggregator of official real-time monitoring data in India
- AirVeda – unofficial network of low-cost sensors
- AQI.in – unofficial network of low-cost sensors
- Purple Air – unofficial network of low-cost sensors
- Clarity – unofficial network of low-cost sensors
- Full resource links with illustrations
- Visualization portal for 1990-2018 global burden of disease estimates (IHME-GBD)
- Resource links to methodology and inputs
- Visualization portal for State of the Global Air (SOGA) by Health Effects Institute (HEI)
- India state-level disease burden initiative by ICMR and PHFI (2019)
- State-level reports (PHFI)
- Burden of disease attributable to major sources of air pollution in India (GBDMAPS-India) by HEI
- Air Quality Life Index (AQLI) by U.Chicago
- Health impacts analysis tools
- Household Air Pollution Intervention Tool (HAPIT)
- Air pollution health effects online tool by TERI
- CO-Benefits Risk Assessment (COBRA) health impacts screening and mapping tool by USEPA
- Environmental BENefits MAPping and analysis program (BENMAP) by USEPA
- AirCounts tool by Abt Associates
- Tool for health risk assessment of air pollution – AirQ+ by WHO
- FAst Scenario Screening Tool (FASST) by EU
- Greenhouse gas – Air pollution INteractions and Synergies (GAINS) by IIASA
- The Long-range Energy Alternatives Planning – Integrated Benefits Calculator (LEAP-IBC) by SEI
- Simple Internative Models for better air quality (SIM-air) by Urban Emissions
- Census India (2011)
- Indiastats.com (paid statistics service)
- Statista.com (paid statistics service)
- Statistical Year Book (SYB) of India by MoSPI
- Energy Statistics of India by MoSPI (2021, 2023)
- Directorate of Statistics by state
- Andhra Pradesh
- Assam
- Bihar
- Chandigarh
- Chhattisgarh
- Delhi
- Goa
- Gujarat
- Haryana
- Himachal Pradesh
- Jammu & Kashmir
- Jharkhand
- Karnataka
- Kerala
- Madhya Pradesh
- Maharashtra
- Manipur
- Meghalaya
- Mizoram
- Nagaland
- Odisha
- Puducherry
- Punjab
- Rajasthan
- Sikkim
- Tamil Nadu
- Telangana
- Tripura
- Uttarakhand
- Uttar Pradesh
- West Bengal
Compiled GIS data and maps
- Community created maps of India by datameet
- Openstreetmaps (GIS)
- Mapcruzin.com (GIS)
- Global Human Settlements (GHS) – urban built areas
- Land cover data 1992-2015 (ESA)
- Open buildings database (Source Coop)
- Nightlights database (Earth Obs Group)
- SHRUG database (link)
- Gridded Population
- India energy dashboard by Niti Aayog
- India Energy Security Scenarios (IESS) by Niti Aayog
- GHG Platform India (GPI) by multiple agencies
- International Energy Agency (IEA)
- Greenhouse gas – Air pollution INteractions and Synergies (GAINS) by IIASA
Compiled emission databases
- MIX regional emissions database for Asia
- REAS regional emissions database for Asia
- EDGAR global emissions inventory
- CAMS global emissions inventory
- ECCAD global compilation of emissions and ancillary data
- SAFAR India emissions inventory by Indian Institute of Tropical Meteorology (contact)
- SMoG-India emissions inventory by Indian Institute of Technology, Bombay
- OMI-HTAPv2.2 SO2 global emissions inventory 2005-2019 (NASA)
- Greenhouse gas – Air pollution INteractions and Synergies (GAINS) by IIASA
- MEGAN global biogenic emissions
- Forest and agricultural fires
Compiled modeled reanalysis fields
- MOZART global model by UCAR
- CAM-chem global community earth system model by UCAR
- CAMS global reanalysis model by ECMWF
- MERRA-2 global reanalysis model by NASA [link]
- SAANS India reanalysis model by IIT-Delhi
- Daily PM2.5 concentrations 2018-2023 by Stanford U [link]
- Global PM2.5 reanalysis by WUSTL for 1998-2022
- Extract of annual and monthly averages for the Indian Subcontinent
Compiled meteorological fields
- Indian Meteorological Department (IMD)
- Climate Explorer by KNMI for stationwise data
- NCEP global reanalysis fields (long-term achives)
- Global Forecast System (GFS) fields (short-term archives)
- Windy (open visualization portal)
- Earth Nullschool (open visualization portal)
- Compiled meteorological data for Indian districts (from Urban Emissions)
Industry
- Annual Survey of Industries (ASI) by the Ministry of Statistics and Programme Implementation (MoSPI)
- Annual reports by MOSPI
- Annual reports by the Ministry of Steel
- Annual reports by the Ministry of Chemicals and Fertilizers
- Annual reports by the Ministry of Mines
- Annual reports by the Cement Manufacturers Association
- Annual reports by the Ministry of Micro, Small, and Medium Enterprises
- Annual reports by the Ministry of Textiles
- Annual reports by the Ministry of Coal
- Annual reports by the Ministry of Petroleum and Natural Gas
- Annual reports by the Department of Heavy Industry
- Annual reports by the Department of Animal Husbandry and Dairy
- Annual reports by the Department of Fisheries
- Annual reports by the Department of Pharmaceuticals
- Annual reports by the Department of Chemical and Petro-chemicals
Power Plants
- full resource links
Transport (road)
- National Transport Development Policy Committee (NTDPC) report – Moving India to 2032
- Annual reports by the Ministry of Road Transport and Highways
- Annual reports by the Ministry of Petroleum and Natural Gas
- Urban transport reports by the Ministry of Housing and Urban Affairs
- AMRUT/JNNURM city development reports
- Smart Cities Mission – city development reports
- Google directions API for traffic speeds (paid service)
- Google mobility statistics during COVID-19
- Tom Tom traffic index (paid service)
- Vehicle challan count at toll plazas across India (2020-22) [link]
- Delhi GTFS public bus transport location and speed information [link]
Transport (rail, aviation, and shipping)
- Shipping – full resource links
- Aviation global emissions inventory by EDGAR
- Departures and arrivals information by AirSewa
- Railway train schedules
- Departures and arrivals information by flightstats (paid service)
- Cargo tonnage by rail and aviation by indiastats.com (paid service)
Residential cooking and heating
- full resource links
Open waste burning
- Global trash burning emissions inventory by UCAR
- waste management in India (database)
- Gridded open waste burning emissions in India (2019)
- Indian National Satellite System (INSAT) series
- RAPID portal to visualize real-time INSAT products (IMD, Delhi)
- Satellite derived PM2.5 (by ISRO, Dehradun)
- Radar maps (IMD, Delhi)
- Customized satellite maps for the Indian Subcontinent (IMD, Delhi)
- Geostationary Environment Monitoring Spectrometer (GEMS) – hourly air quality over East Asia and part Indian Subcontinent (new)
- Multi-Angle Imager for Aerosols (MAIA) (new)
- Tropospheric Monitoring Instrument (TROPOMI) – NO2, SO2, Ozone, HCHO, and CH4
- Active fire counts database from VIIRS satellite
- Active burned area product from MODIS satellite
- Fires visualization portal by NASA
- ACE-FTS and MAESTRO – 50+ gaseous species
- Cloud Aerosol Lidar and Infrared Pathfinder Satellite Observation (CALIPSO)
- Global Ozone Monitoring Experiment (GOME-2) – total column SO2, O3, NO2, and cloud parameters
- Measurement of Pollution in the Troposphere (MOPITT) – CO and CH4
- Total Ozone Mapping Spectrometer (TOMS) – Ozone
- Ozone Monitoring Instrument (OMI) – near real time SO2, O3, and AOD
- Moderate Resolution Imaging Spectroradiometer (MODIS)
- Scanning Imaging Absorption Spectrometer for Atmospheric Chartography (SCIAMACHY) – multiple gases
- Optical Spectograph and Infrared Imaging System (OSIRIS) – O3 and NO2
- Multi-angle Imaging Spectrometer (MISR) – dust storms and aerosols
- Global Precipitation Measurements (GPM)
- Data centers and access methods
- World Data Center (WDC)
- Earth Data (NASA)
- Data access methods (NASA)
- Copernicus open access hub (ESA)
- Aura Validation Data Center (AVDC, NASA)
- The Wisconsin Horizontal Interpolation Program for Satellites (WHIPS)
- Atmospheric Tool Box (ATB) for Sentinel-5P products
- Google Earth Engine (GEE) for Sentinel-5P products
Visit our Air Pollution knowledge Assessments (APnA) city program page.