Knowing how much pollution exists and where/when it occurs is only part of the air quality story. Source apportionment answers the equally important question: where is the pollution coming from?
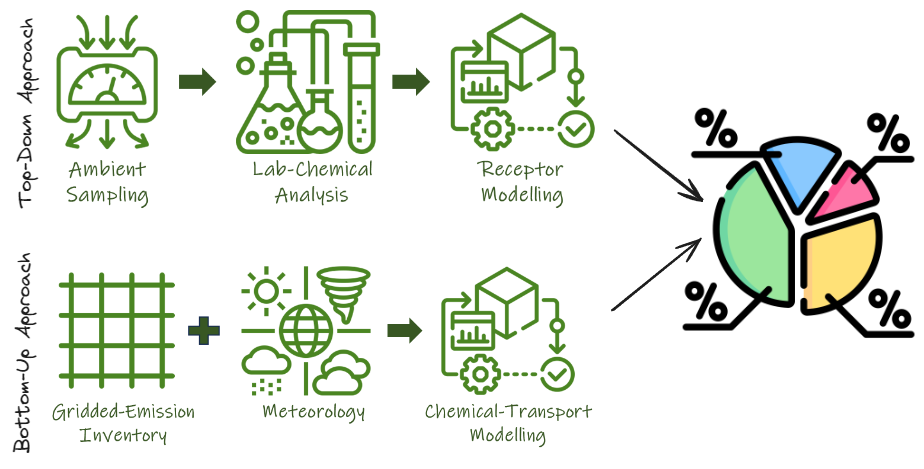
“Source apportionment” is an analytical technique which quantifies the contributions of different emission sources, such as road transport, industry, residential burning, agriculture, and natural sources, to observed (or modelled) ambient pollutant concentrations at a specific location or across a region. These techniques use a combination of chemical fingerprints specific to various sources (top-down) and emission intensities (bottom-up).
Source apportionment results are directly actionable for policy. If, for example, residential biomass burning is found to contribute 40% of wintertime PM2.5 concentrations in a city, policymakers can prioritize clean cooking and heating programs over traffic management measures.
In the developing world, PM2.5 source apportionment is particularly important given the diversity of emission sources that all compete for policy attention. In more developed contexts such as the US and the EU, apportionment studies frequently highlight the dominant role of NO2 and Ozone from road transport.
Source apportionment is not a single concept, as it takes several distinct forms, each serving a different purpose in policy dialogue.
Pollution apportionment
… is the most used in public and policy discussions. It represents the pollution already present in the air and how much of that can be attributed to each source. By the time emissions reach this stage, they are well-mixed, both vertically and across the region, chemically transformed, and interacting with other pollutants. This is the air people breathe, and it is the most direct basis for health-linked and source-linked policy decisions.
Emissions apportionment
… commonly known as an emissions inventory. Rather than measuring what is in the air, it quantifies the rate at which pollutants are released at the source — how much an industry emits, collectively what is the vehicle exhaust amount, or the emission intensity of different cooking practices across a region. Emissions inventories are essential planning tools, but they do not account for atmospheric dispersion, chemical transformation, or mixing — all of which occur after emission and before a pollutant reaches a receptor point (for example, a monitor or a nose).
Health apportionment
… introduces a third dimension through the concept of intake fraction — the proportion of emissions from a given source that is inhaled by the exposed population. A source may contribute heavily (like a power plant) to overall emissions yet have a low intake fraction if its pollutants disperse over a wide area before reaching people. Conversely, low-level sources such as vehicle exhaust, waste burning or roadside dust have very high intake fractions because emissions occur close to where people live and breathe, with little opportunity for dilution.
Perceived apportionment
… is the fourth and often overlooked dimension. Derived from public surveys and community dialogue, it captures what people believe to be the dominant pollution source (regardless of what monitoring or modelling data show). In most cities, transport is perceived as the primary culprit, shaped by visible exhaust, noise, and the volume of public discourse around vehicles. This perception gap between scientific evidence and public understanding has real consequences for policy: it can drive attention and resources toward visible sources while less visible but equally significant contributors such as agriculture, industry, or residential burning, go under-scrutinized.
An effective air quality management plan draws on all four dimensions, but pollution apportionment remains the anchor. It is the closest representation of what people are exposed to, and therefore the most direct basis for setting priorities, designing interventions, and measuring progress.
- What is PM2.5? [link]
- A primer on pollution source apportionment (version 2024) and other notes
- Reading the air: A practical guide to air quality data and its uses (2026) [link]
Browse [link] for other FAQ’s