Among the many pollutants, particulate matter (PM) is the most talked about and probably the main pollutant of concern. Other noteworthy pollutants are sulphur dioxide (SO2), nitrogen oxides (NOx), carbon monoxide (CO), hydrocarbons or volatile organic compounds (VOCs), especially the polycyclic aromatic hydrocarbons (PAHs), and ozone (O3).

From a regulatory perspective, PM is studied, measured, and monitored the most for multiple reasons. Such as
- Being the critical pollutant for health concerns (asthma, breathing troubles, eye irritation, etc)
- Being a critical ingredient to a visual form of pollution (smog) leading to visibility issues, and
- Commonly the most visual pollutant out a chimney or a tail pipe or a cooking stove (often in the form of black soot).
World Health Organization (WHO) and Institute of Health Metrics Evaluation (IHME) estimated that urban air pollution from PM accounts for ~4 million premature deaths annually and the burden occurs primarily in developing countries.
It is important that we understand more about the pollutant that concerns us the most, to formulate rational and effective policies and make informed investment decisions related to air quality improvements.
FAQ – Which size fraction of particulate matter is more important?
 PM is generally measured as mass concentration of particles within certain size classes. These size distinctions are a result of sources and formation mechanisms, which lead to variation in chemical composition and physical properties. The range of sizes also affects their atmospheric lifetime, spatial distribution, indoor-outdoor ratios, temporal variability and associated health impacts. To date, most measurements are conducted for PM10 and most of the developing countries still monitor PM10 as a key indicator. Slowly, with the growing knowledge on PM composition and its direct linkage to health impacts, finer fractions are becoming more important. PM2.5 is now more critical for health impacts and policy relevant discussions.
FAQ – What is the difference between primary and secondary particulate matter?

Primary is a direct emission source and forms a significant portion of the PM pollution. This comprises of metals, elemental carbon (also known as black carbon), and organic carbon. Other primary pollutants include sulfur dioxide, nitrogen oxides, volatile hydrocarbons, methane, carbon monoxide, and carbon dioxide — all which are in the gaseous form.
Secondary is due to chemical transformation of primary gaseous emissions. In PM, the secondary aerosol components include sulfates from sulfur dioxide emissions, nitrates from nitrogen oxide emissions, organic aerosols from hydrocarbon emissions, and ammonium from ammonia emissions. The path and the quantity of chemical transformation depends on the strength of the pollutant emissions and the mix of the emissions. In an atmospheric chemical mechanism, these interlinkages can run into 300+ equations. Other secondary pollutants include ozone (in the gaseous form) – a result of a mix of reactions between NOx and VOC emissions in the presence of sunlight.
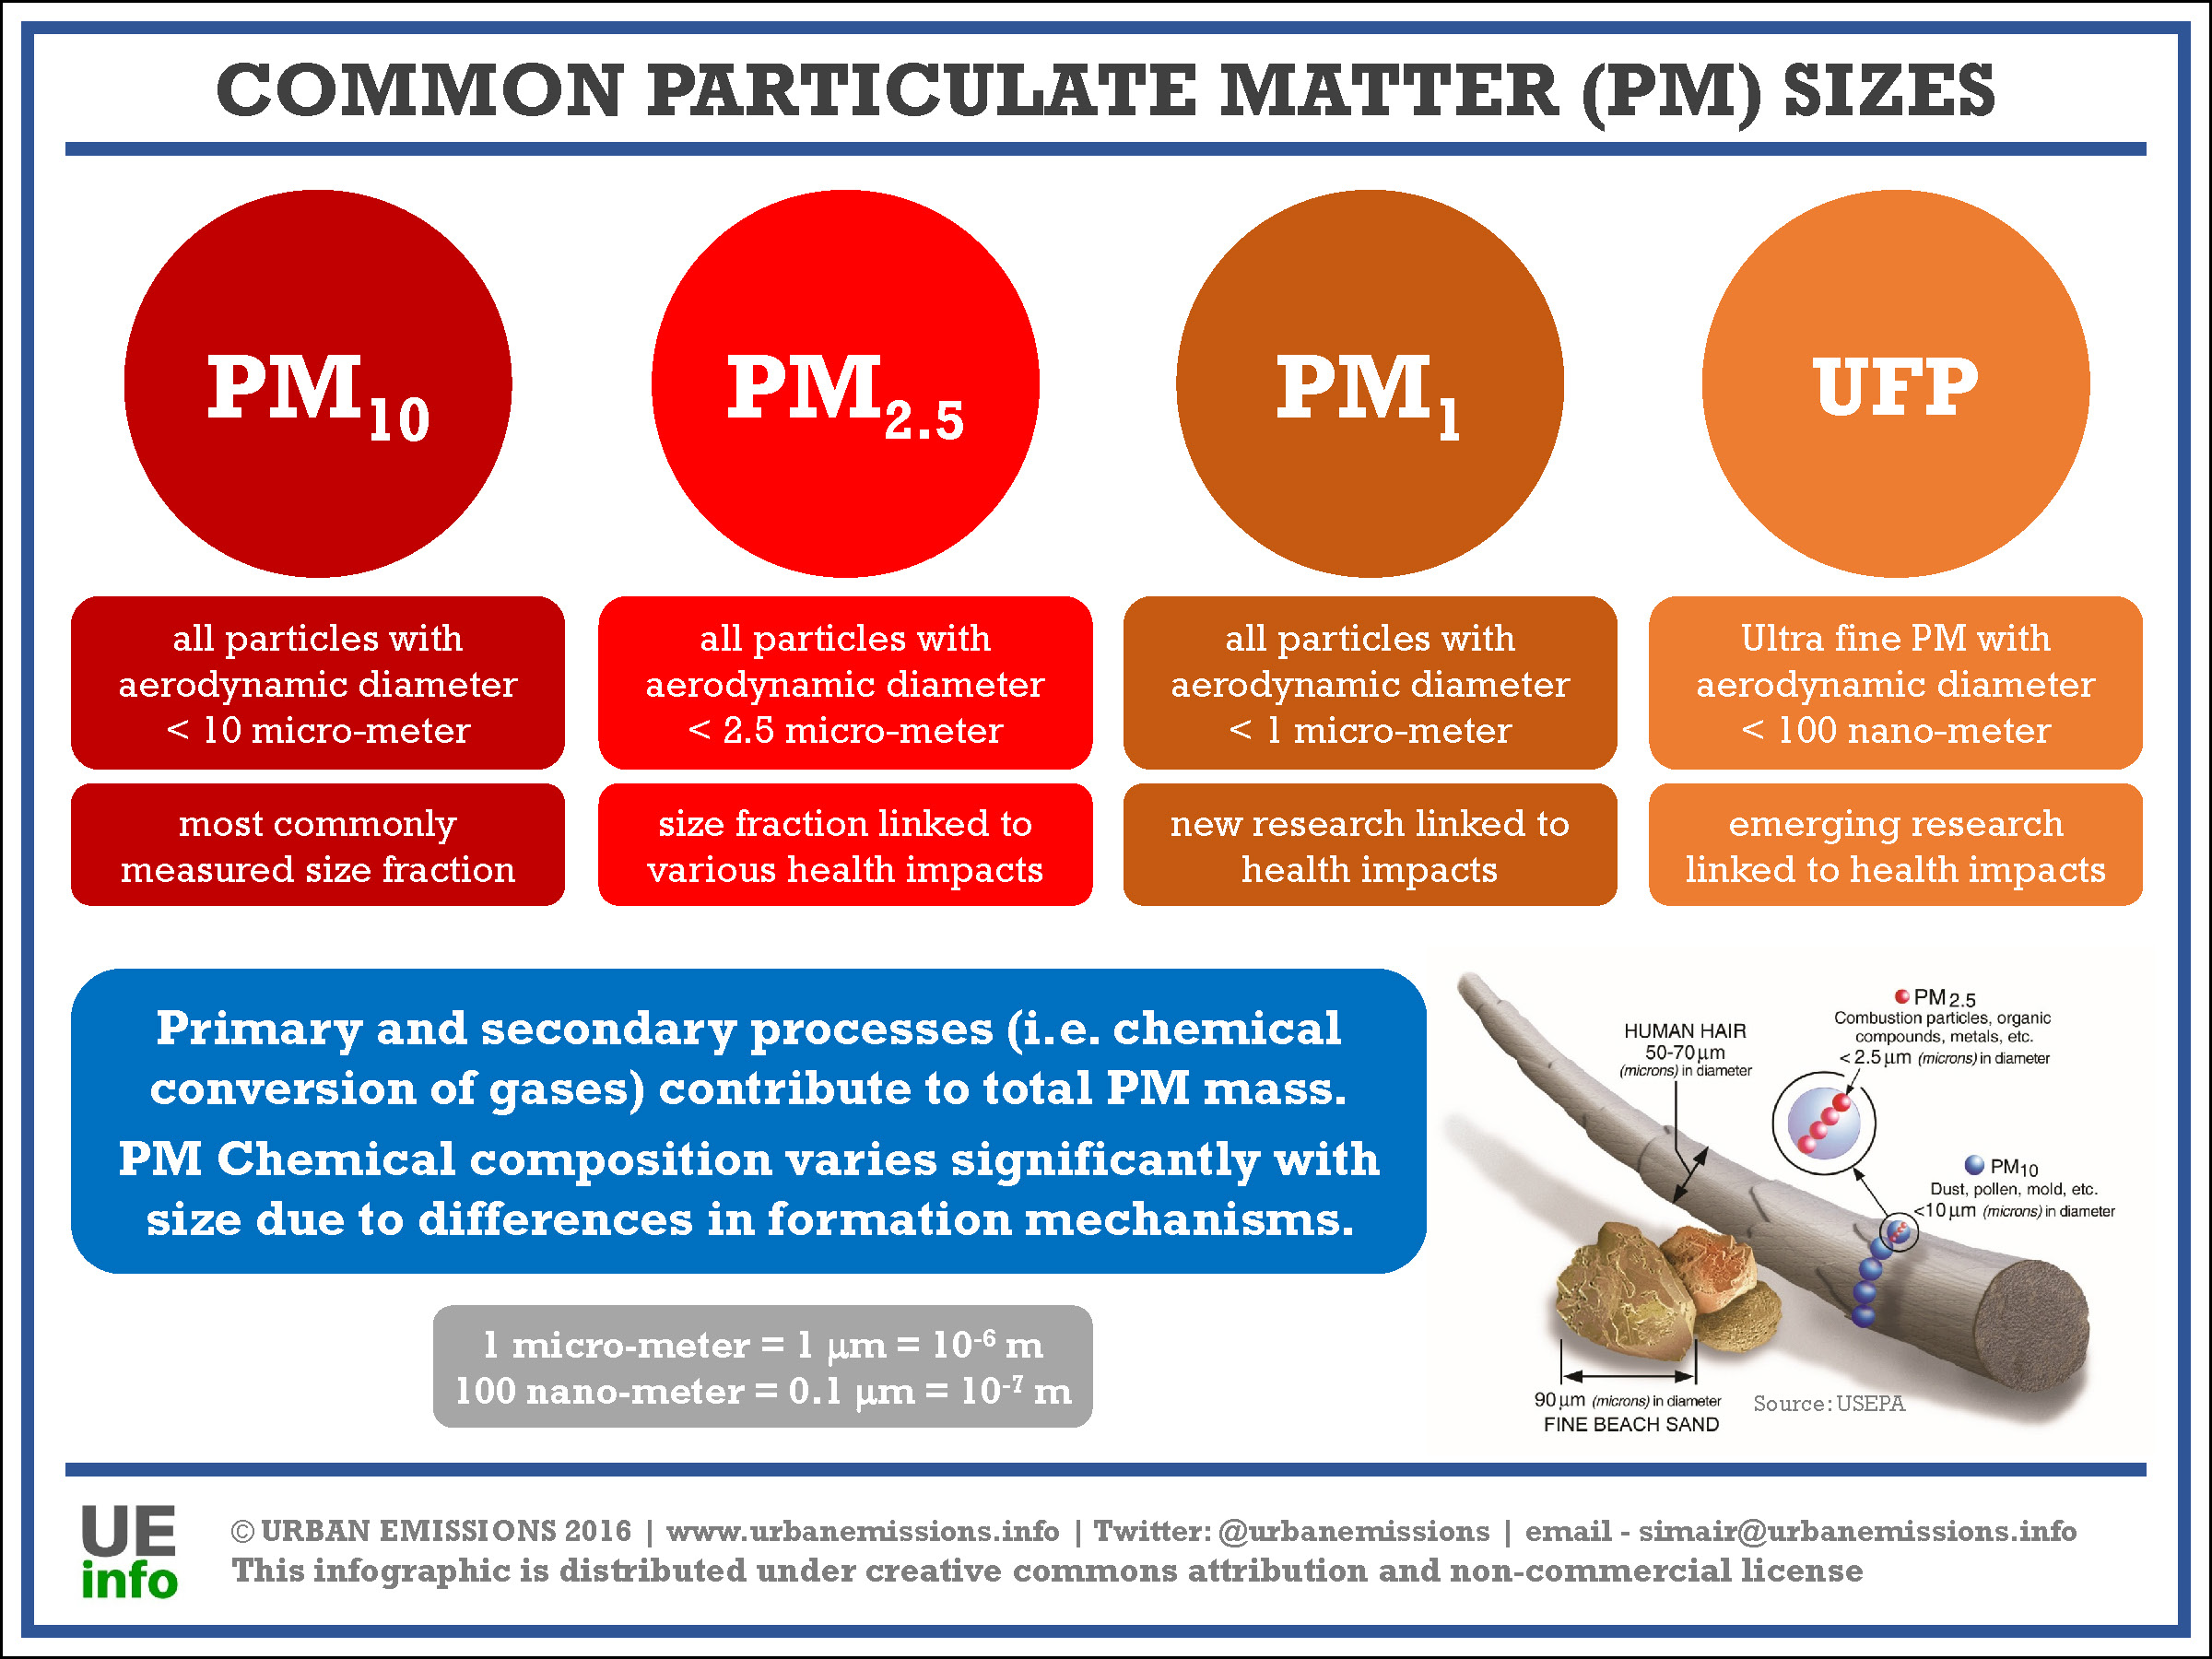
FAQ – What is the difference between fine and coarse particulate matter?
There is constant confusion between PM2.5 vs. PM10 and “fine vs. coarse” fractions of particulate matter.
 The schematic above presents an overview of what is part of each of these fractions and they are broadly defined like this
- PM2.5 – this is all the particulate matter under 2.5 µm
- PM10 – this is all the particulate matter under 10.0 µm
- Fine PM – this is all the particulate matter under 2.5 µm, which is same of PM2.5
- Coarse PM – this is all the particulate matter between 2.5 and 10 µm
FAQ – What is pollution source apportionment?
 This is the process of estimating the contribution of various sources to ambient PM pollution. This is a key input required for prioritizing actions against the most contributing sources. It is important to not get confused between the overlapping definitions of contributions to emissions and pollution. An emissions inventory provides information at the source level, the information critical for policy discussions is the contribution of sources to the pollution we breath in the air. In each city or a region, the contributions estimated from emissions at the sources need not be the same as the contributions estimated for ambient pollution. For example, a power plant will contribute significantly to the emissions inventory in a city. However, its pollution travels long distance and contributes less in the immediate vicinity.
There are 2-ways to ascertain source apportionment – top-down and bottom-down. A detailed primer on this topic is available here, along with the pros and the cons of these approaches. While these approaches have their differences, they are complimentary in nature and in an ideal situation, a study to understand the source strengths in a city or a region will include an application of both the approaches.
FAQ – Which size fraction of particulate matter should be measured?
 This is a tricky question. Any pollutant with a national standard must be monitored for regulatory and auditory purposes. In case of particulate matter, PM10 was most measured for the longest time – partly because of the availability of the equipment. In India, PM2.5 was introduced to the criteria pollutants table in 2009 and since then all the cities have started to measure this. Typically, this list includes PM10, PM2.5, SO2, NO, NO2, CO, Ozone, Ammonia, and some VOC’s like Benzene, Toluene, Xylene, and Formaldehyde.
When health impacts are in discussion, PM2.5 is the key size fraction with the greatest number of studies. Chronic and acute exposure to other pollutants also lead to some health impacts; however, PM2.5 composition has contributions from all the other pollutants via secondary chemical mechanisms, which makes it the most important pollutant of them all.
Since the PM pollution is a concern for most of the growing cities, more efforts are necessary to monitor it – both the size fractions (PM10 and PM2.5). With the growing advances in technology, there is a wide array of monitors, in size, precision, and cost, and with some background checks, a user can take a decision to use the most suitable one. A detailed primer on air quality monitoring is available here.
FAQ – How many monitors are required to monitor particulate matter in a city?
Unlike the “what to monitor” question, “how much to monitor” primarily depends on the financial status of the city or the concerned institution. It is important that as many monitoring stations as possible are established, to create a representative pollution map of the city or the area of interest, and this is dependent on the local institutional capacity, not only for procuring the equipment, but also to operate and maintain the same.
Typically, a thumb rule for representativeness of a continuous monitoring station is 4-km diameter. This representative area will be lesser inside the cities with multiple obstructions like tall buildings and trees or could be more outside the cities which is commonly referred to as “background”. Placing a monitor every 9-km2 is financially and technically prohibitive for any city or country.
A representative sample set will include many monitors in densely populated and commercially active areas of an airshed and lesser number of stations outside the main urban areas. This is a compromise between technical needs and financial obligations of a buying and operating a network. Countries have their own thumb rules on the number of recommended monitoring stations to represent the trends spatially and temporally in a city or an area of interest. India’s Central Pollution Control Board created some guidelines, summarized below, for estimating recommended number of monitoring stations for total suspended particulate matter (SPM), SO2, NO2, and CO (and other oxidants). Using these guidelines, an example for the city of Bengaluru is presented in the figure. This assessment used information on gridded population and gridded urban settlements area to recommended 41 PM monitors for the city’s airshed. More details on these thumb rules and other pertinent information on air quality monitoring is included in this primer.
FAQ – Is road-transport the main culprit of particulate matter pollution in a city?
A common question with a difficult answer – “it depends”. Yes, the road-transport emissions are growing rapidly in most of the developing country cities and its contribution to local and global air pollution problems is also increasing significantly. Yet, the answer lies in the mathematics and knowing the strengths of all the sources that are contributing to the problem.
On one side, the visibility of this growing transport sector creates a cloud that over-represents its contribution. Since people spend more time on the roads, either because of traveling or just idling on the busy roads, they tend to get exposed to most of the pollution from on-road activities (including resuspension of dust). Then it is natural to assume that the road-transport is the main culprit of all the air pollution problems.
For a city, it is important that an understanding of all the sources (inside and outside the city boundaries) is established before a decision is made on the contribution of any sector. For example, Delhi’s air pollution, which is the most studied city in India – A summary of contributions from multiple studies is presented below, suggesting – road-transport emissions are an important culprit, but not necessarily the main culprit. Also see the review of Delhi’s air pollution from 1990 to 2022.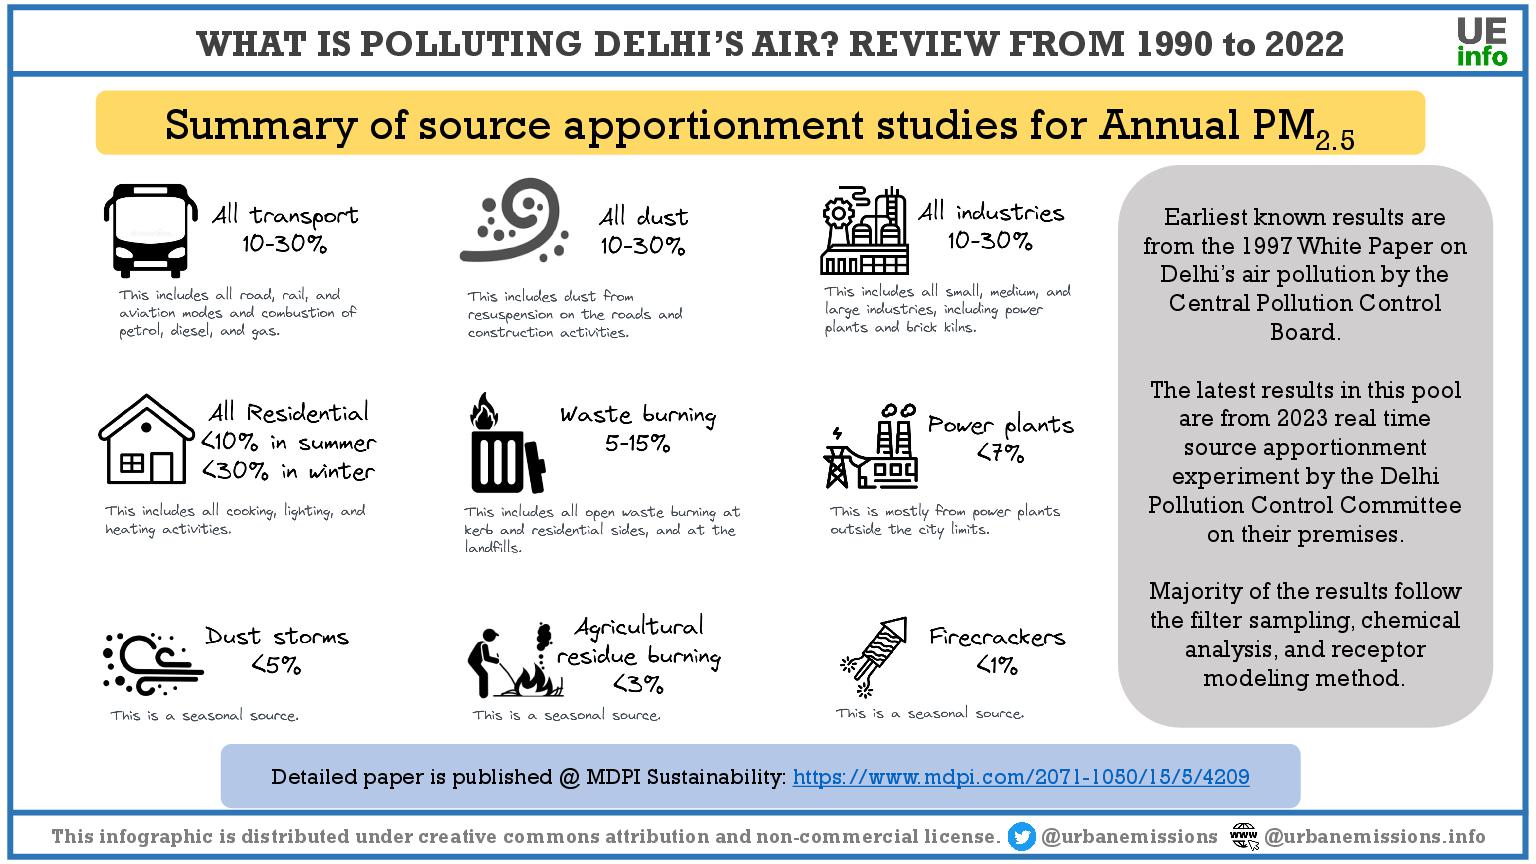
The long-range transport also plays a critical role. The transport emissions are ground-based and tend to increase the local concentrations significantly. However, the industrial emissions contribute to farther distances because of their tall chimneys (technical term for this is “advection”). And for pollutants like SO2 and other gases, the advection is more important as it provides enough hang time for these gases to undergo chemical transformation and eventually contribute to PM fractions downwind of the source regions. For example, during the 2008 Olympics, the city of Beijing achieved significant reductions in air pollution levels by not only cutting the vehicular fleet by half for the games period, but also by closing several small and large industrial sites within a radius of 100-km.
The arguments discussed above will not apply for cities where there are no industries (inside and outside the city boundaries), all the roads are paved with limited construction activities, all the cooking and heating activities are supported by clean gas or electricity, and have 100% waste management capability. In this case, vehicle exhaust from local transport will be the main culprit.
FAQ – Is PM2.5 the most harmful of all air pollutants?
Several studies were conducted worldwide to understand the epidemiological nature of air pollution with health impacts. The Global Burden of Diseases (GBD) study, which is updated every year, provides a library of such studies and a synthesis of results in the form integrated exposure response (IER) curves linking PM and ozone to various health endpoints. Among the environmental risks, air pollution is among the top 10 for exposure from outdoor and indoor air pollution and among the pollutants PM and ozone key.
The complexity in singling these two pollutants is primarily due to their chemical composition (FAQ-02) linked to other pollutants, their tendency to stay in the air for longer periods and travel longer distances, and their tendency to go deeper into human body parts and result in chronic diseases. PM2.5 pollution is directly linked to cause or exacerbate asthma, collapsed lung, chronic bronchitis, pneumonia, blocked lung artery, lung cancer, diabetes, blood pressure, complications during pregnancy, early childhood brain function impairment, and even hair loss. While the IER curves give an indication of the possible impacts of air pollution on human health, there are other impacts which need immediate attention, such as smog (visibility impacts), agricultural yield (linked to ozone), and climate change (like changes in monsoon patterns).
Tools and resources for health Impact Analysis
- Visualization portal for 1990-2018 global burden of disease estimates (IHME-GBD)
- Resource links to methodology and inputs
- Visualization portal for State of the Global Air (SOGA) by Health Effects Institute (HEI)
- India state-level disease burden initiative by ICMR and PHFI (2019)
- State-level reports (PHFI)
- Burden of disease attributable to major sources of air pollution in India (GBDMAPS-India) by HEI
- Air Quality Life Index (AQLI) by U.Chicago
- Health impacts analysis tools
- Household Air Pollution Intervention Tool (HAPIT)
- Air pollution health effects online tool by TERI
- CO-Benefits Risk Assessment (COBRA) health impacts screening and mapping tool by USEPA
- Environmental BENefits MAPping and analysis program (BENMAP) by USEPA
- AirCounts tool by Abt Associates
- Tool for health risk assessment of air pollution – AirQ+ by WHO
- FAst Scenario Screening Tool (FASST) by EU
- Greenhouse gas – Air pollution INteractions and Synergies (GAINS) by IIASA
- The Long-range Energy Alternatives Planning – Integrated Benefits Calculator (LEAP-IBC) by SEI
- Simple Internative Models for better air quality (SIM-air) by Urban Emissions
FAQ – Can we vacuum our particulate pollution problem using air purifiers and smog towers?
For managing outdoor air pollution, the answer is a big “NO”.

Atmospheric science defines the air pollution problem as (a) a dynamic situation where the air is moving at various speeds with no boundaries and (b) a complex mixture of chemical compounds constantly forming and transforming into other compounds. With no boundaries, it is unscientific to assume that one can trap air, clean it, and release into the same atmosphere simultaneously. Expecting filtering units to provide any noticeable results at the community level is unrealistic.
A detailed report and a series of op-eds on this topics are presented here.
Question # 10 – Can we model particulate matter?
The first step in PM pollution modelling is collation of existing knowledge base. This includes information from environmental agencies, NGOs, universities, research institutes, traffic-related departments, energy-consumption statistics, and important point source emitters, followed by building technical capacity to conduct emissions and pollution modelling at various scales – urban and regional, to analyze overall pollution trends, source contributions, and sensitivity analysis of interventions.
The key steps involved in this process are the following.

Applications of this steps is followed in the Air Pollution knowledge Assessments (APnA) city program for India and some other cities in Asia, Africa, and Latin America.
Similar (and more) knowledge databases for city’s under India’s NCAP program are prepped here.
Example tools and instructional videos are available here.
Supporting information is presented as working paper and journal articles here.
Browse [link] for other FAQ’s