 Updated: March, 2024
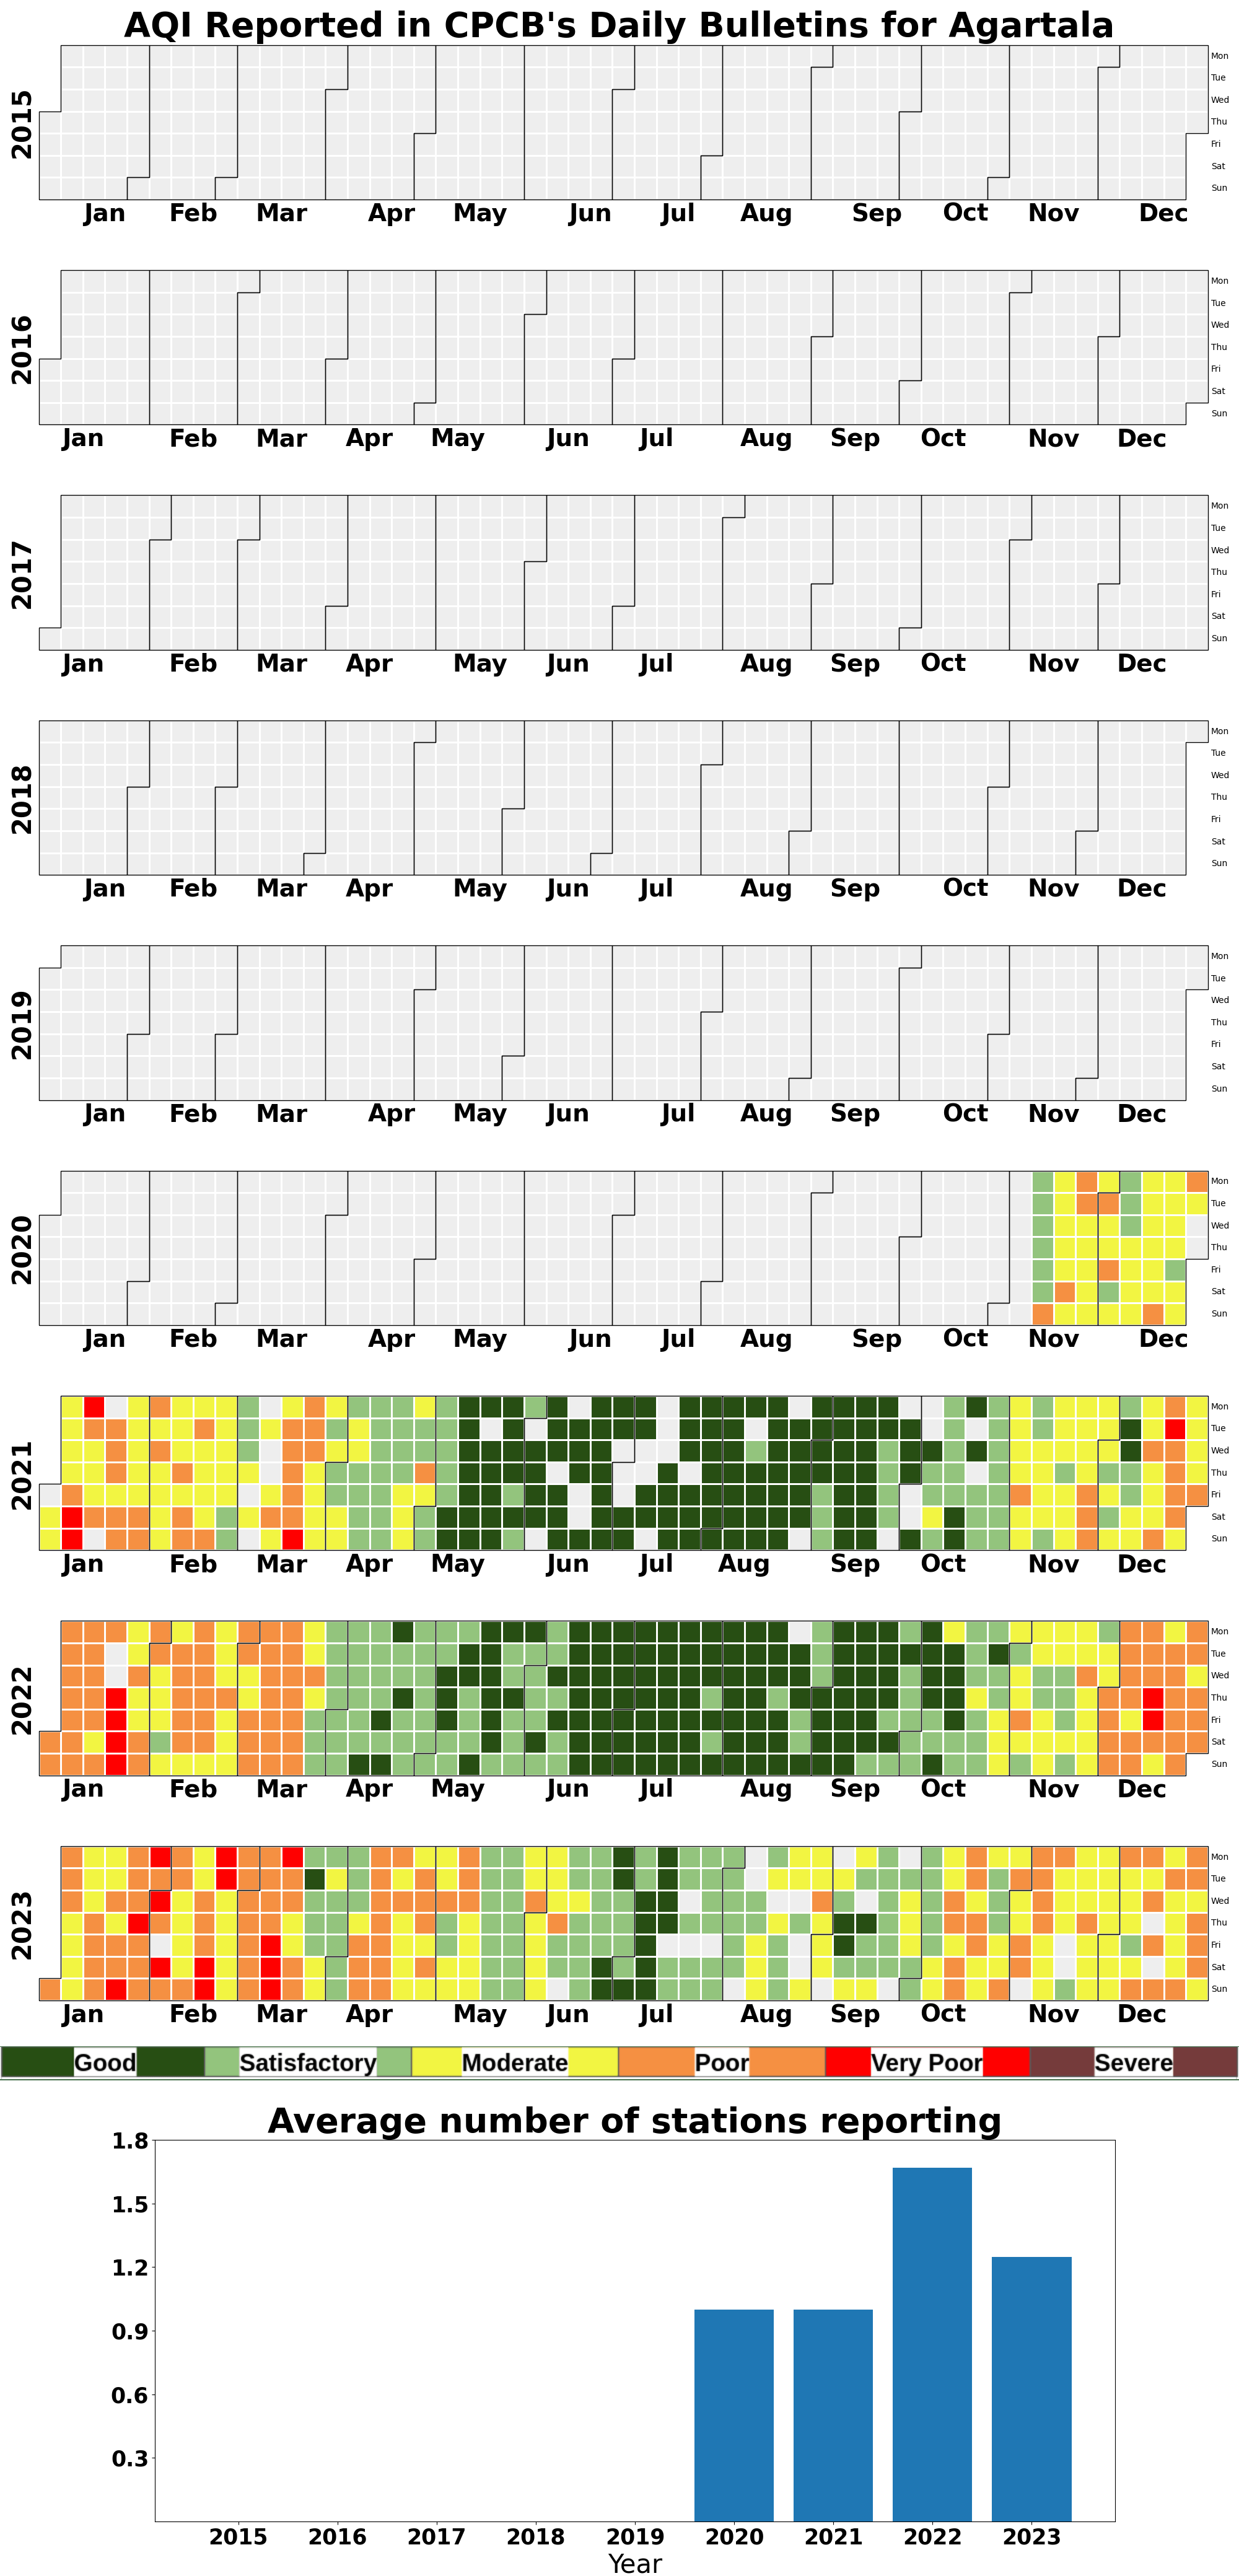
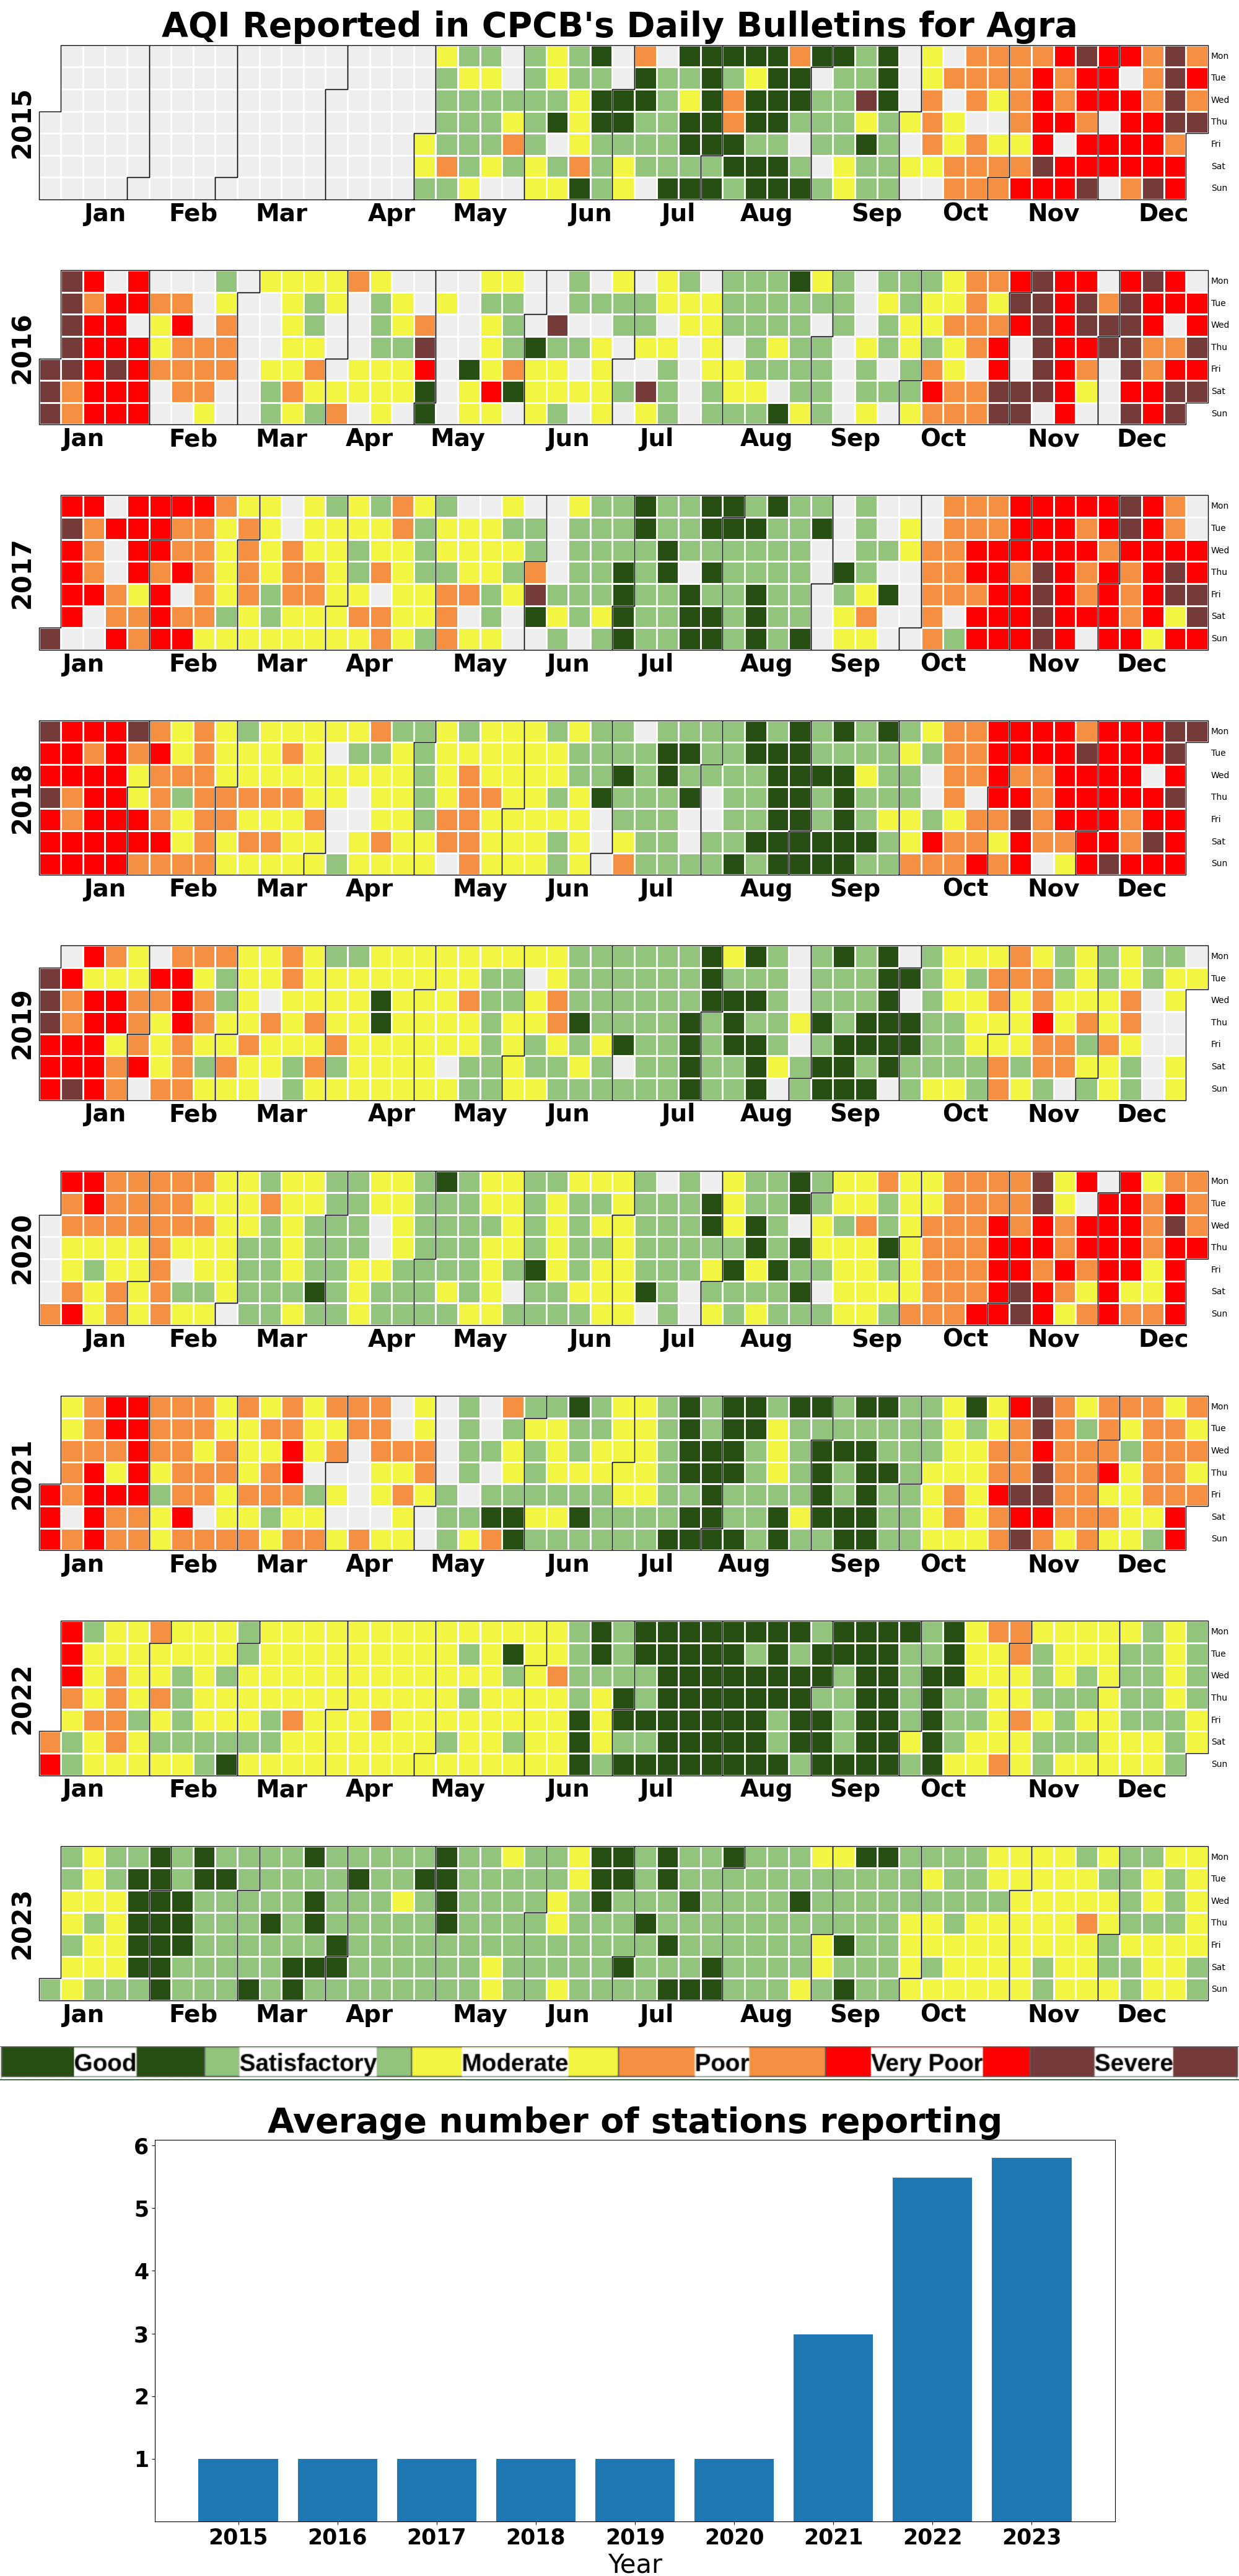
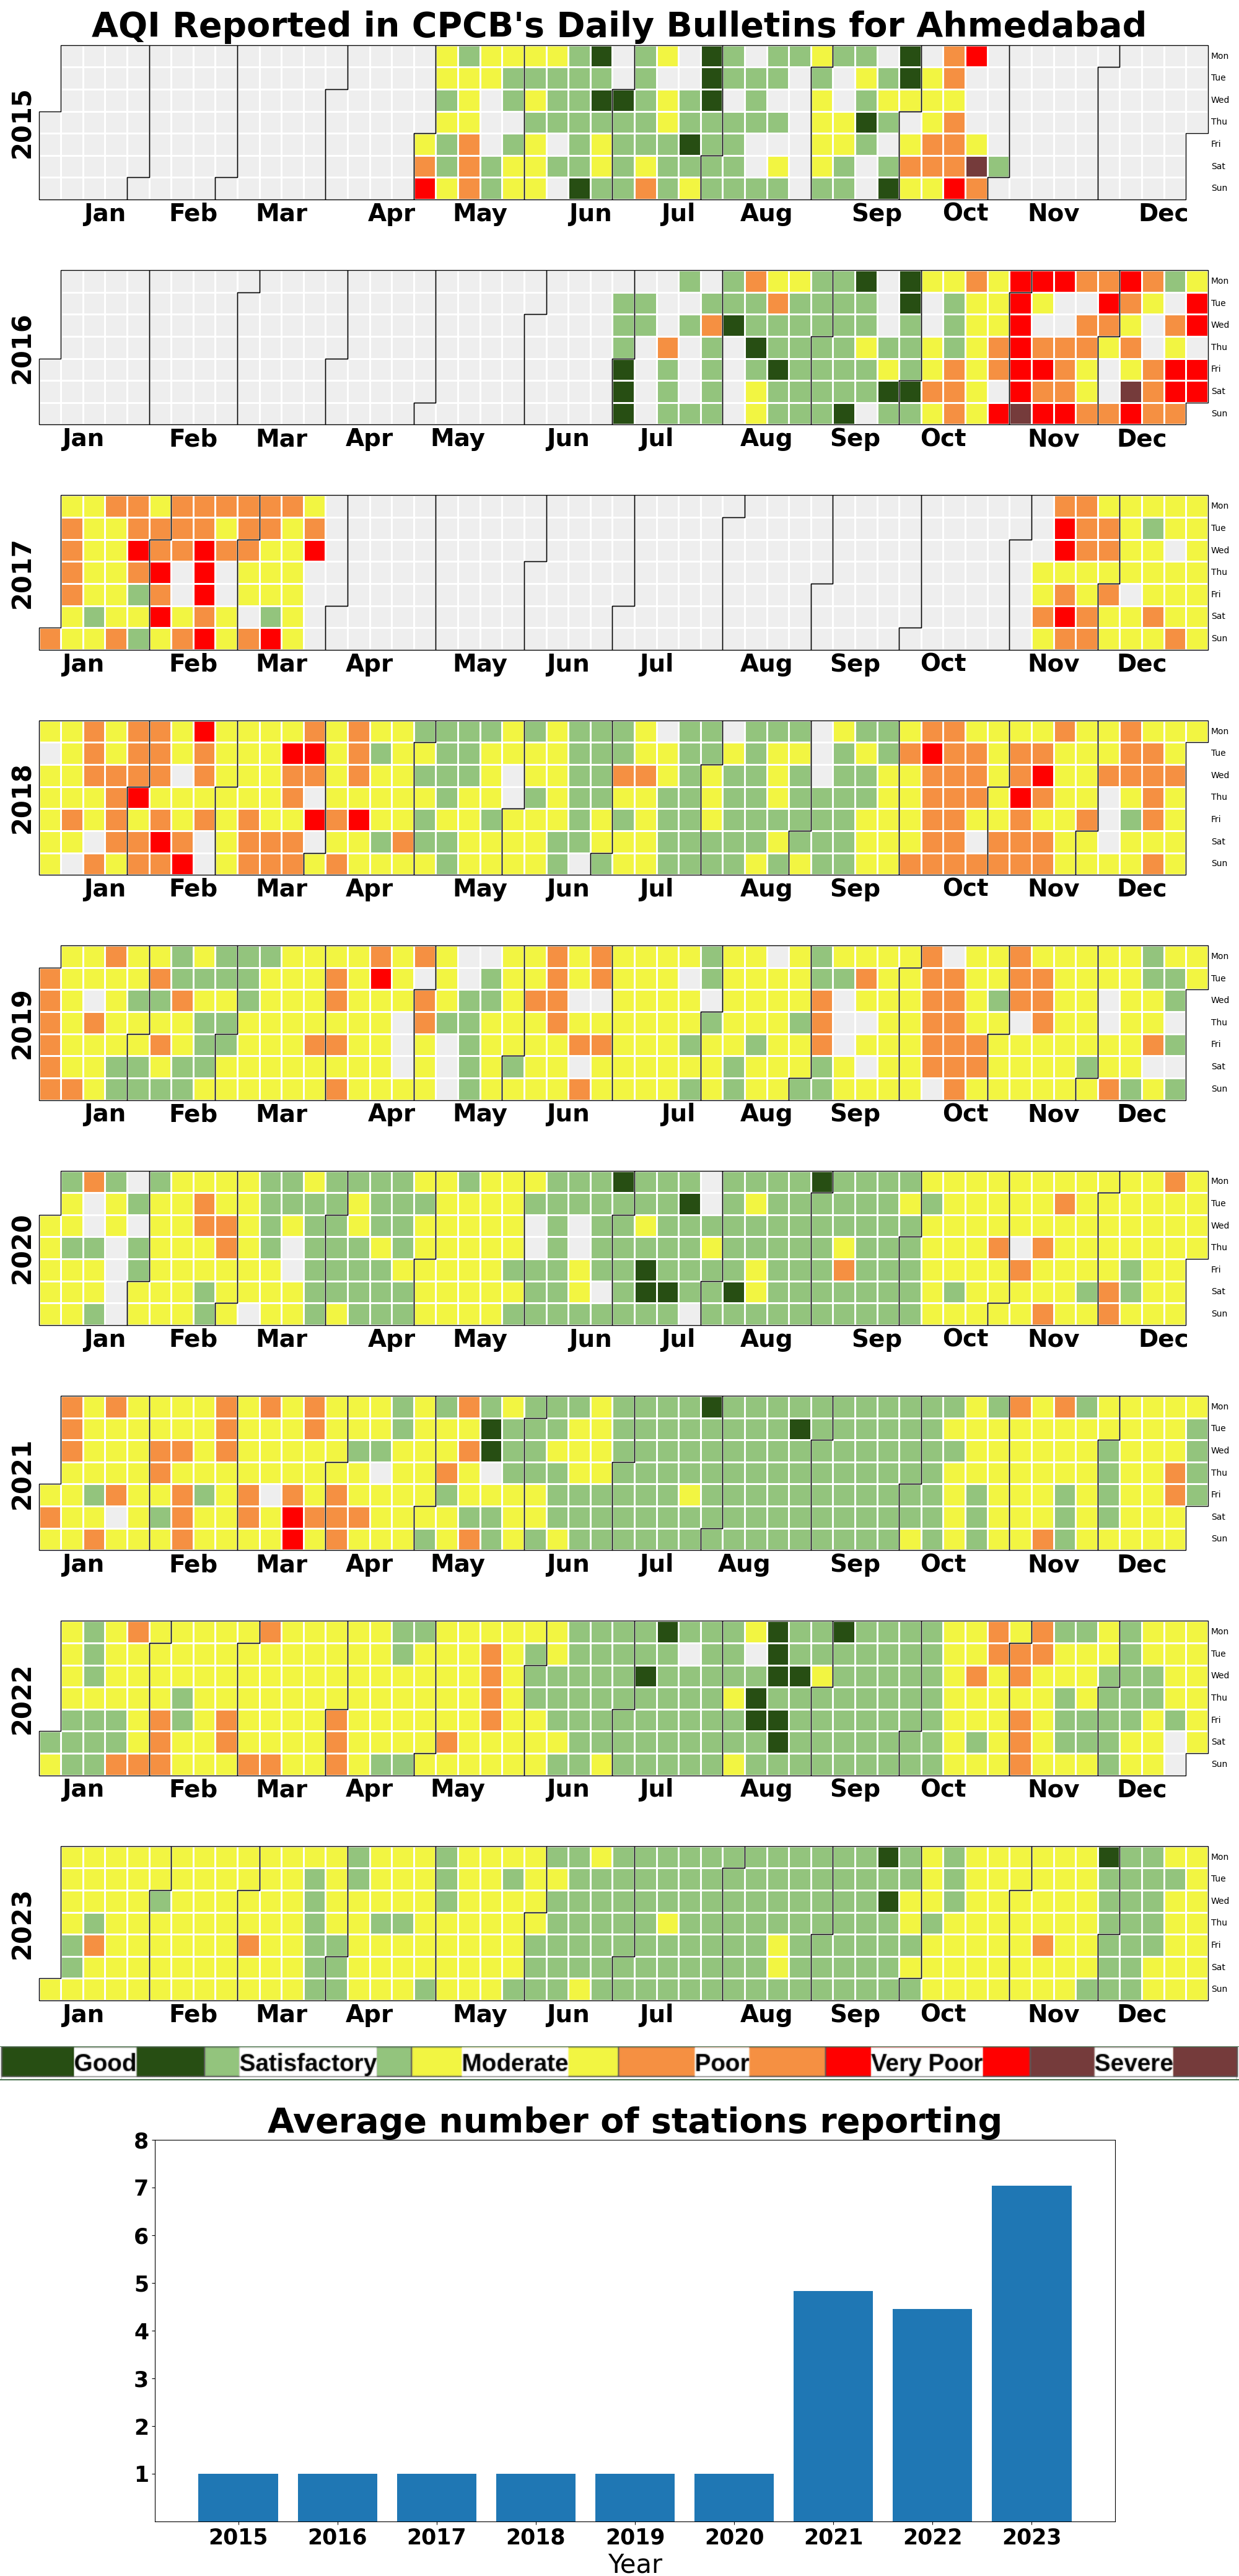
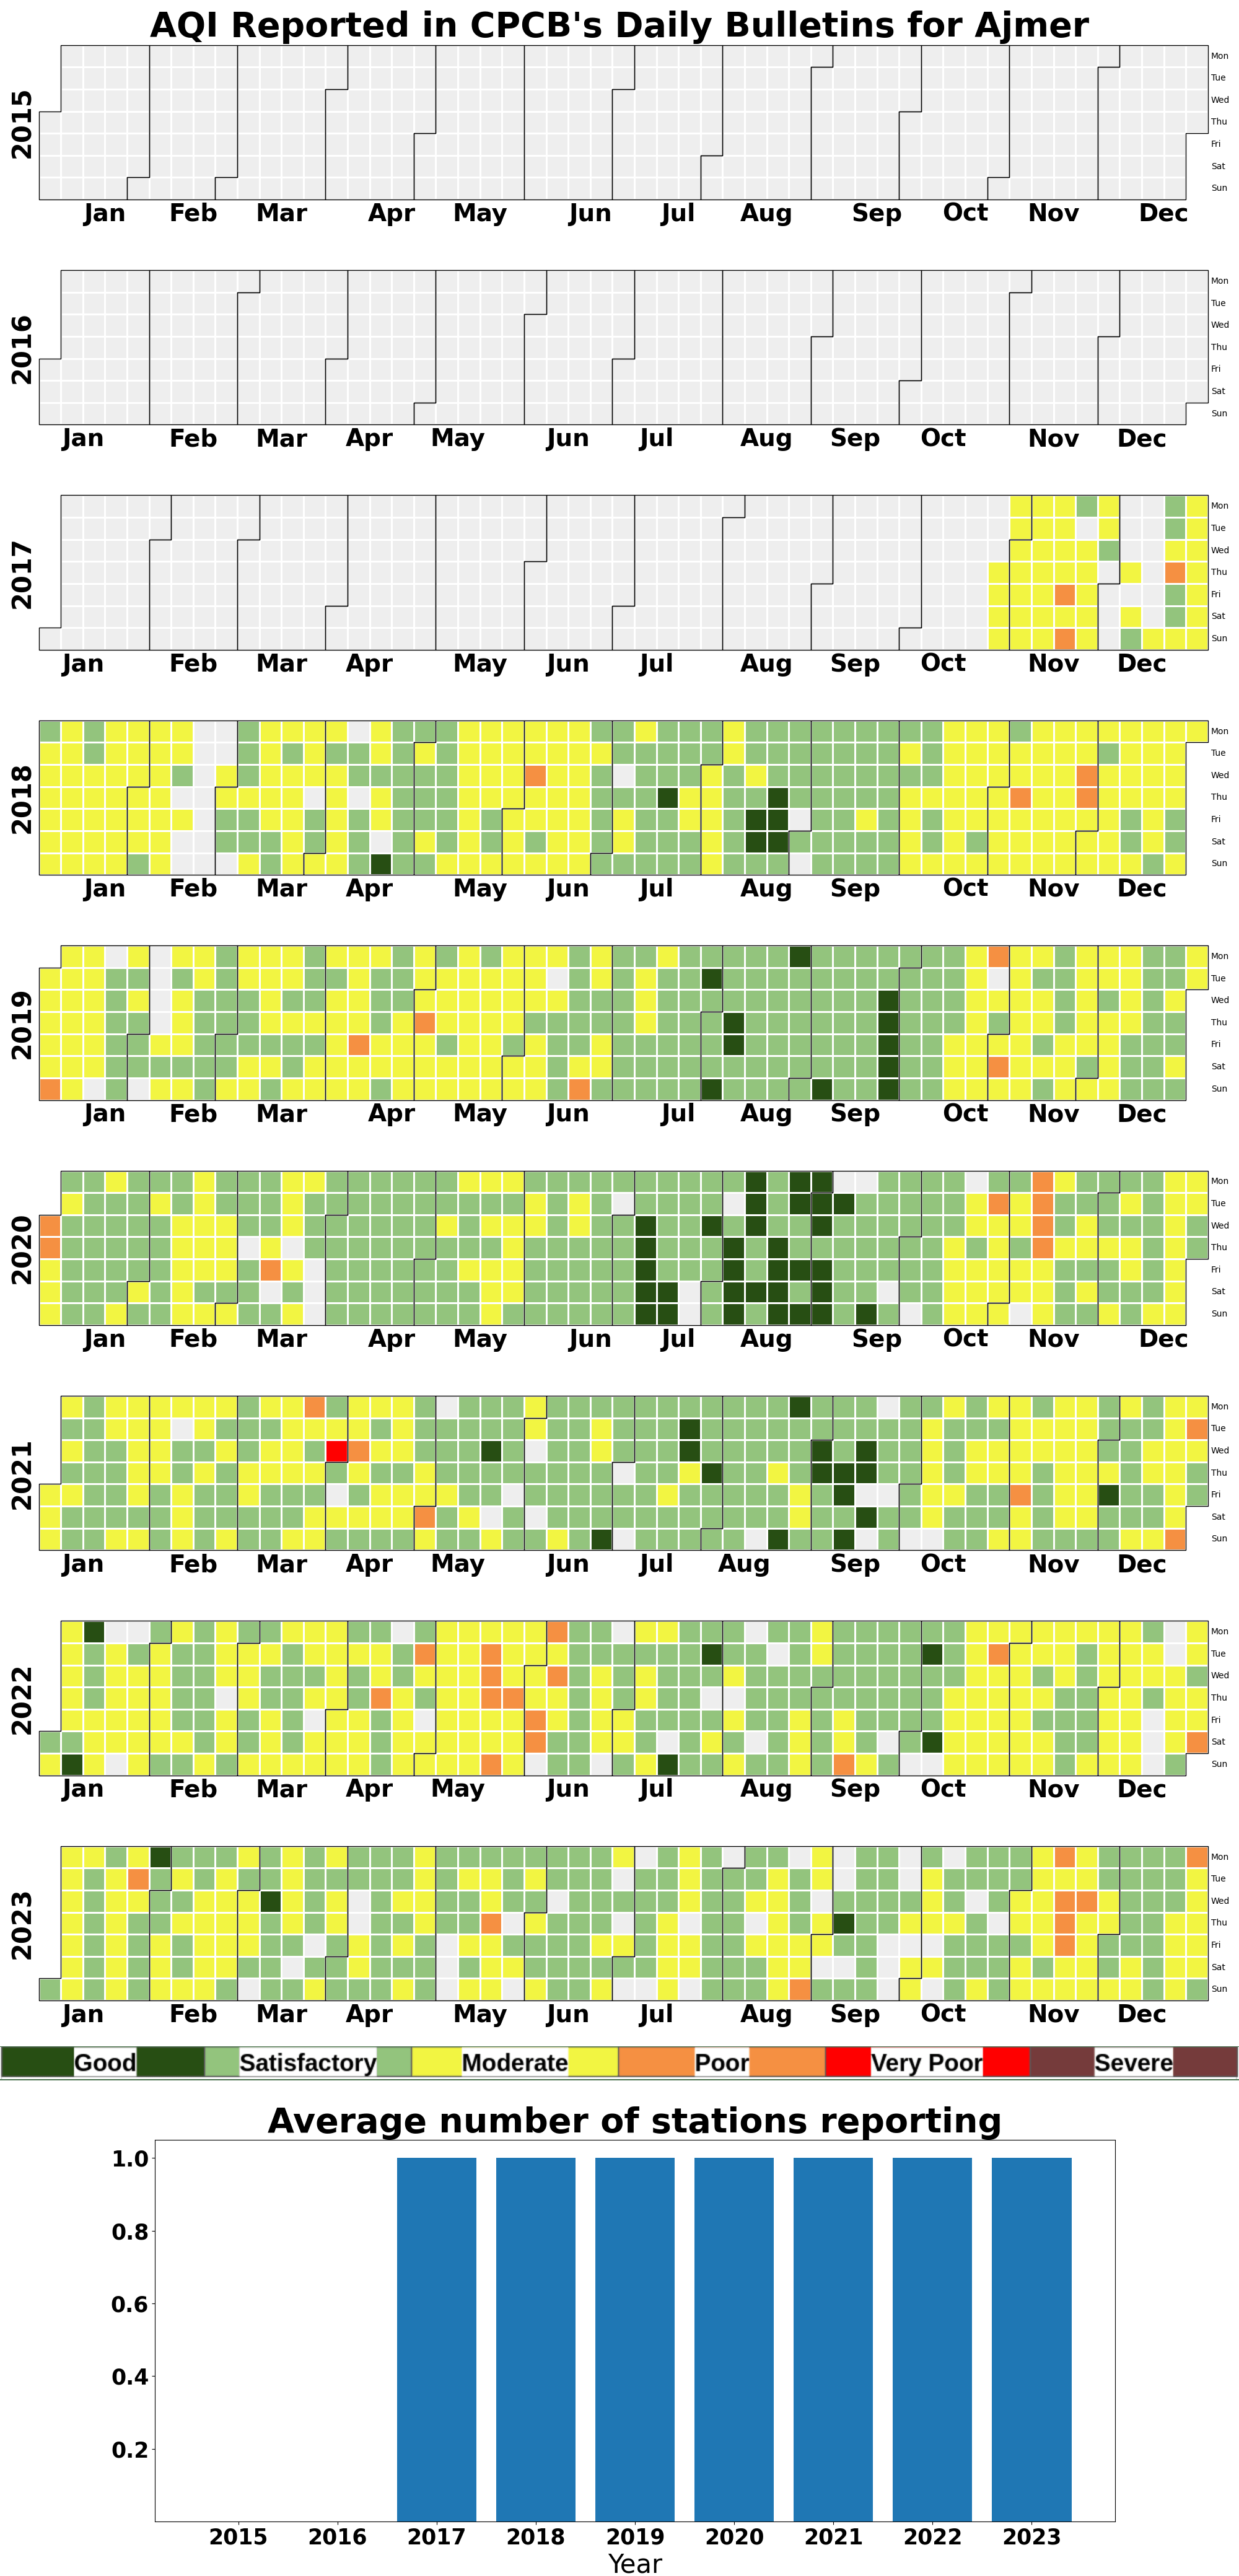
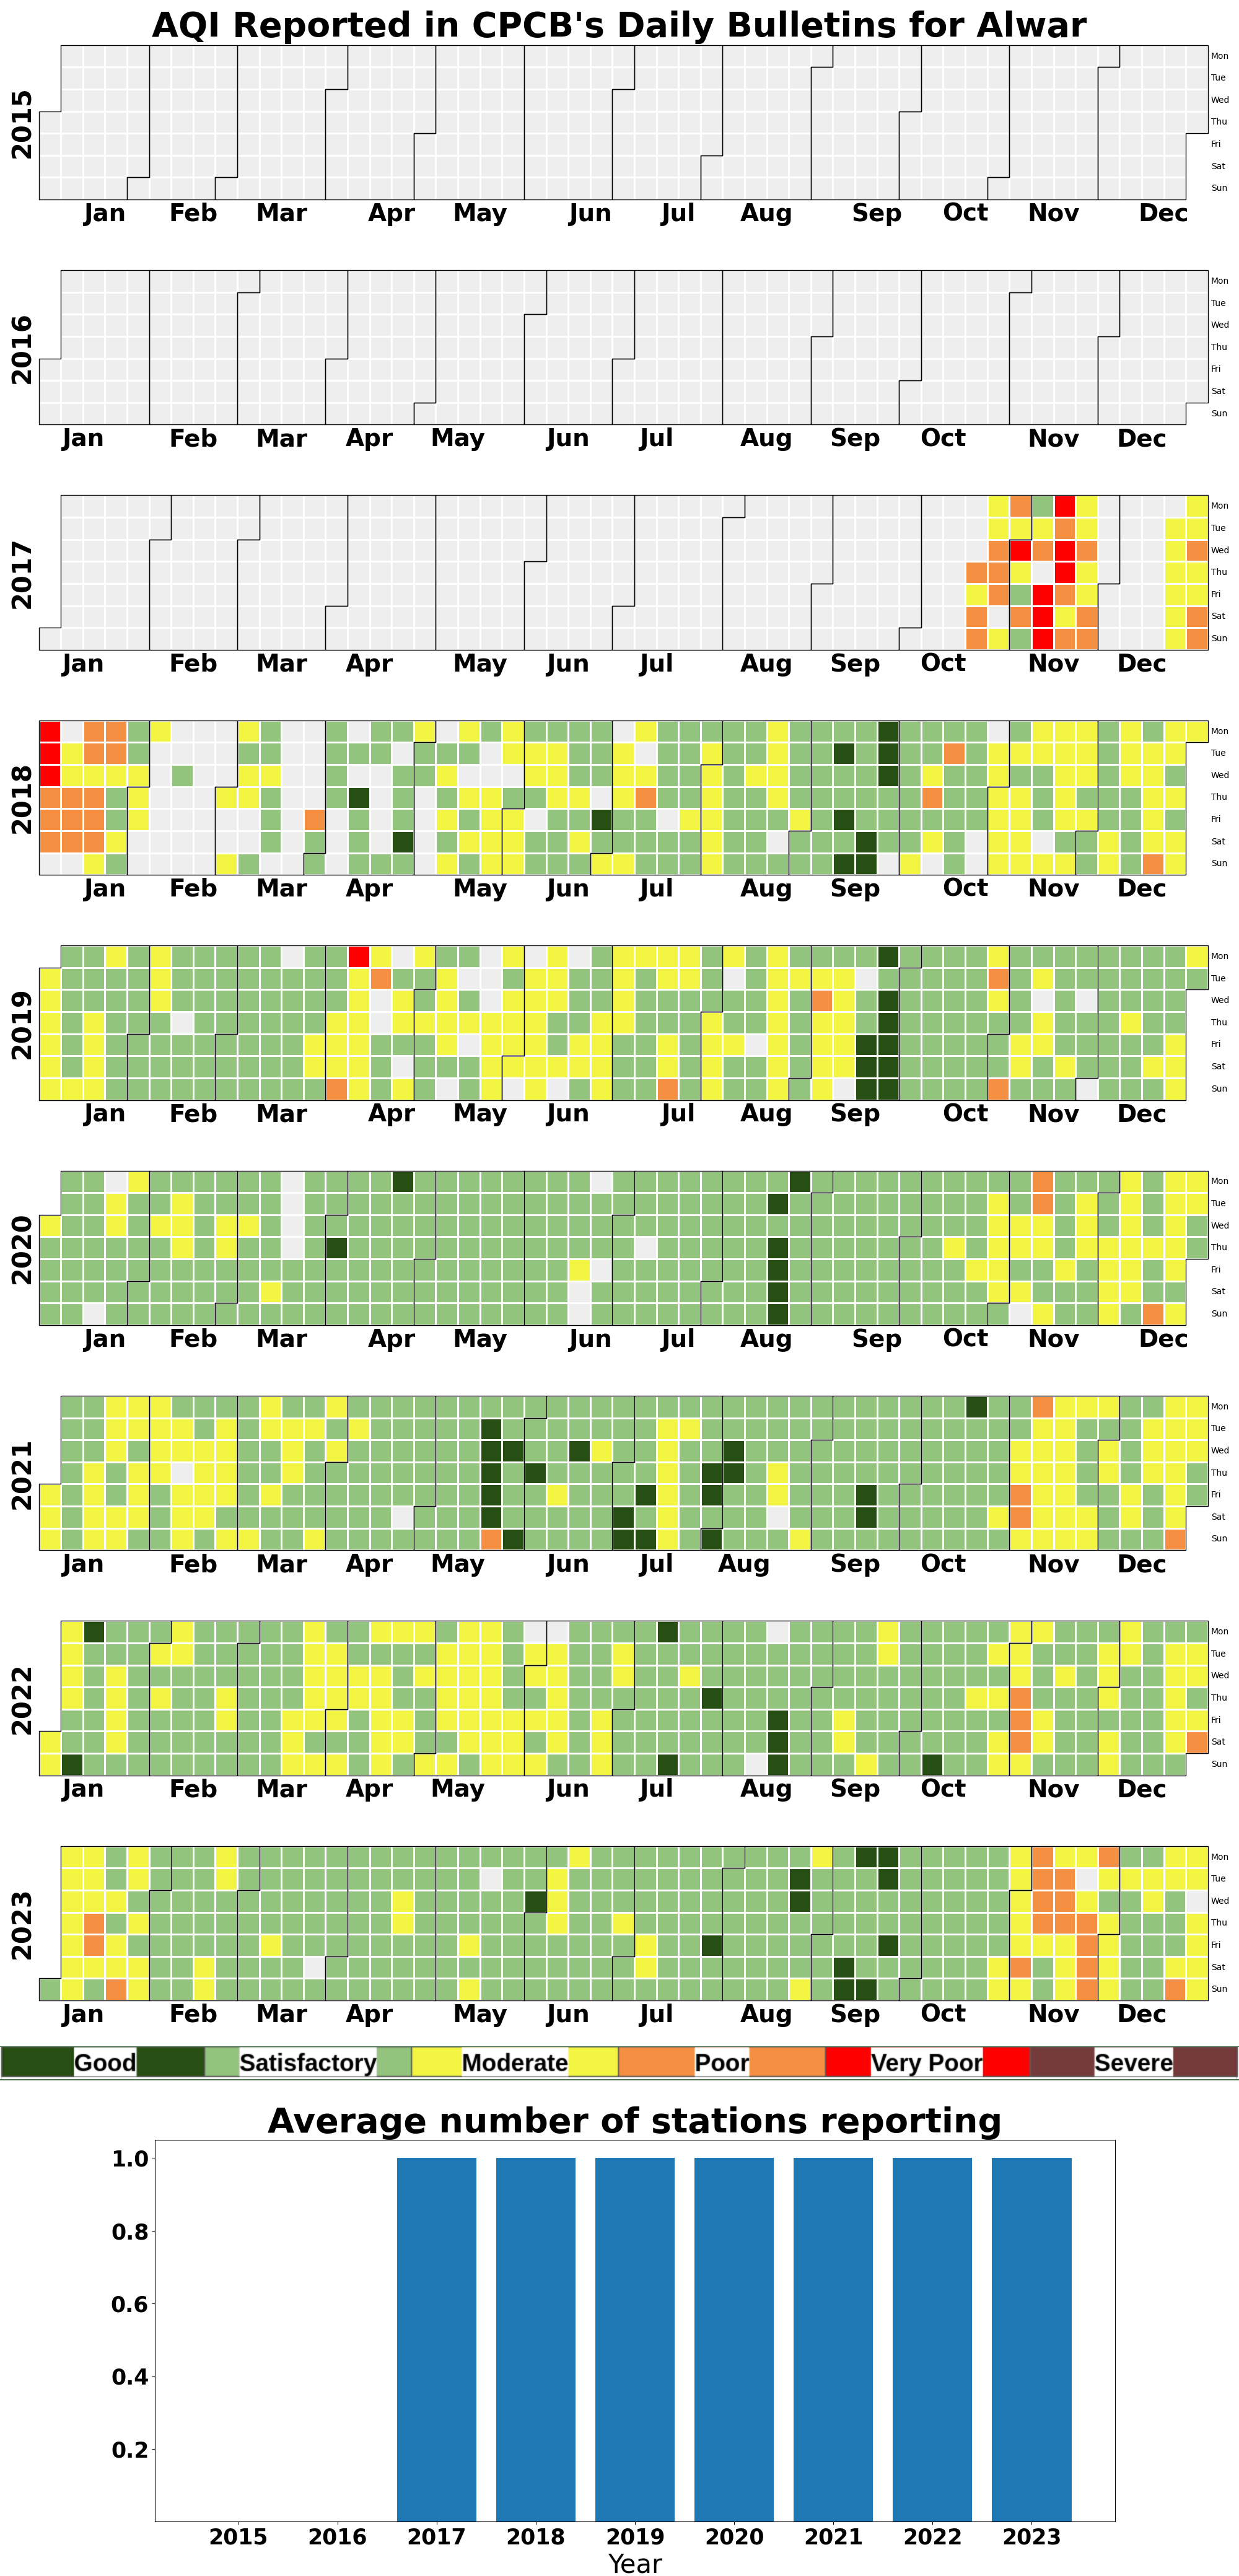
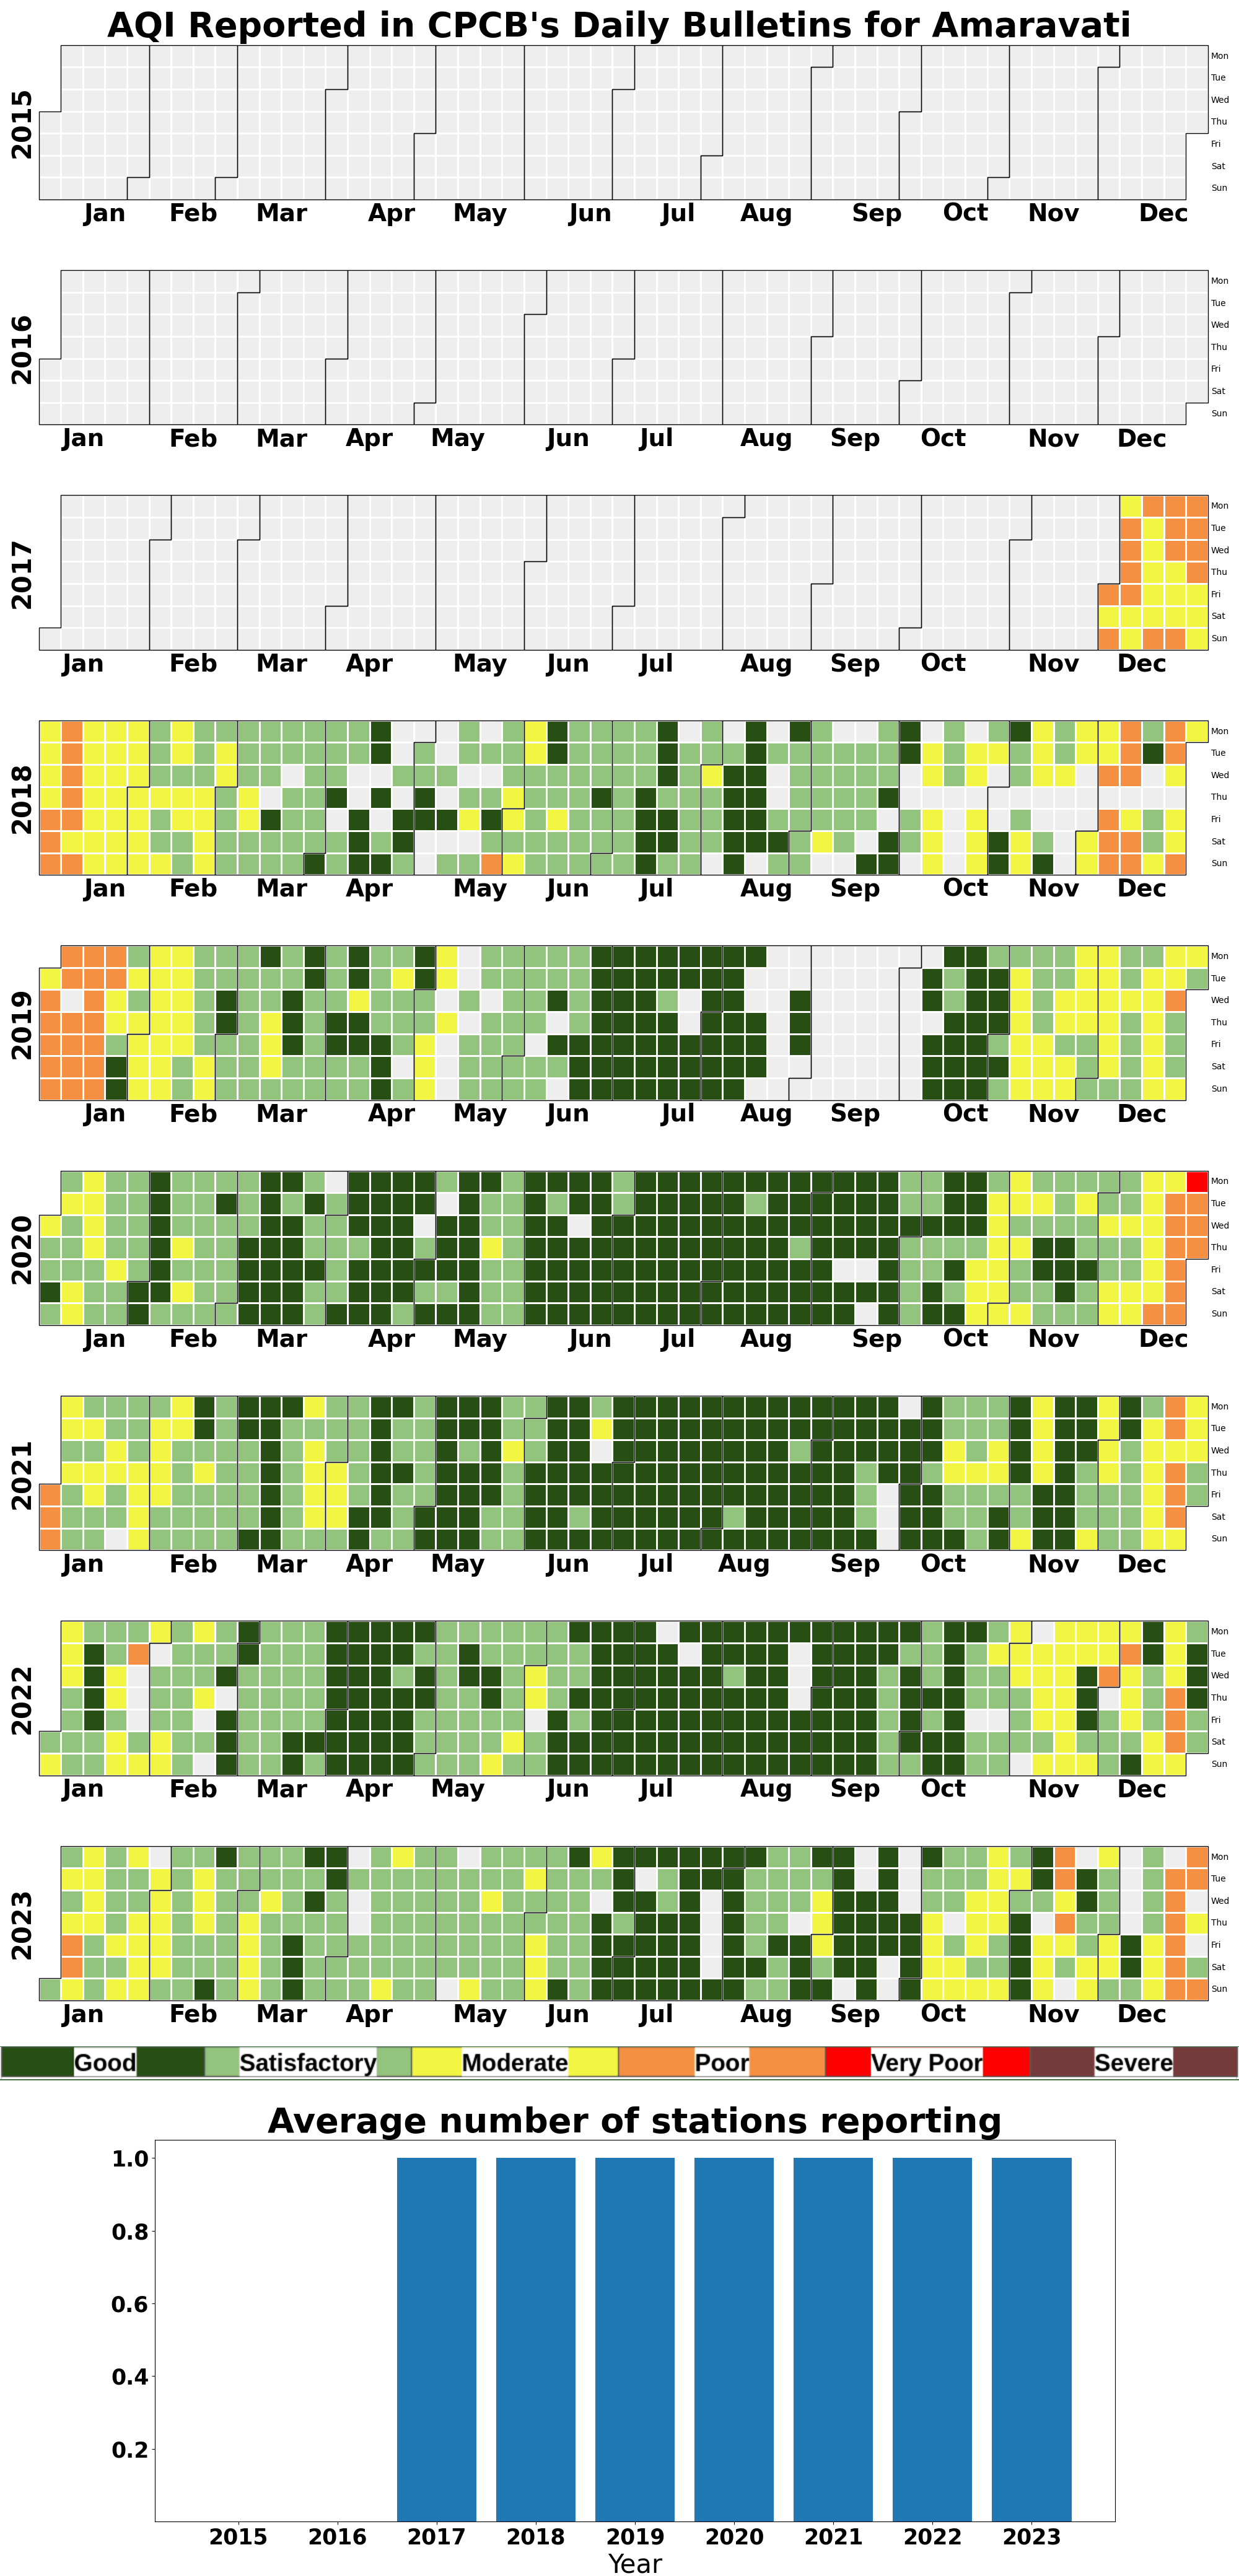
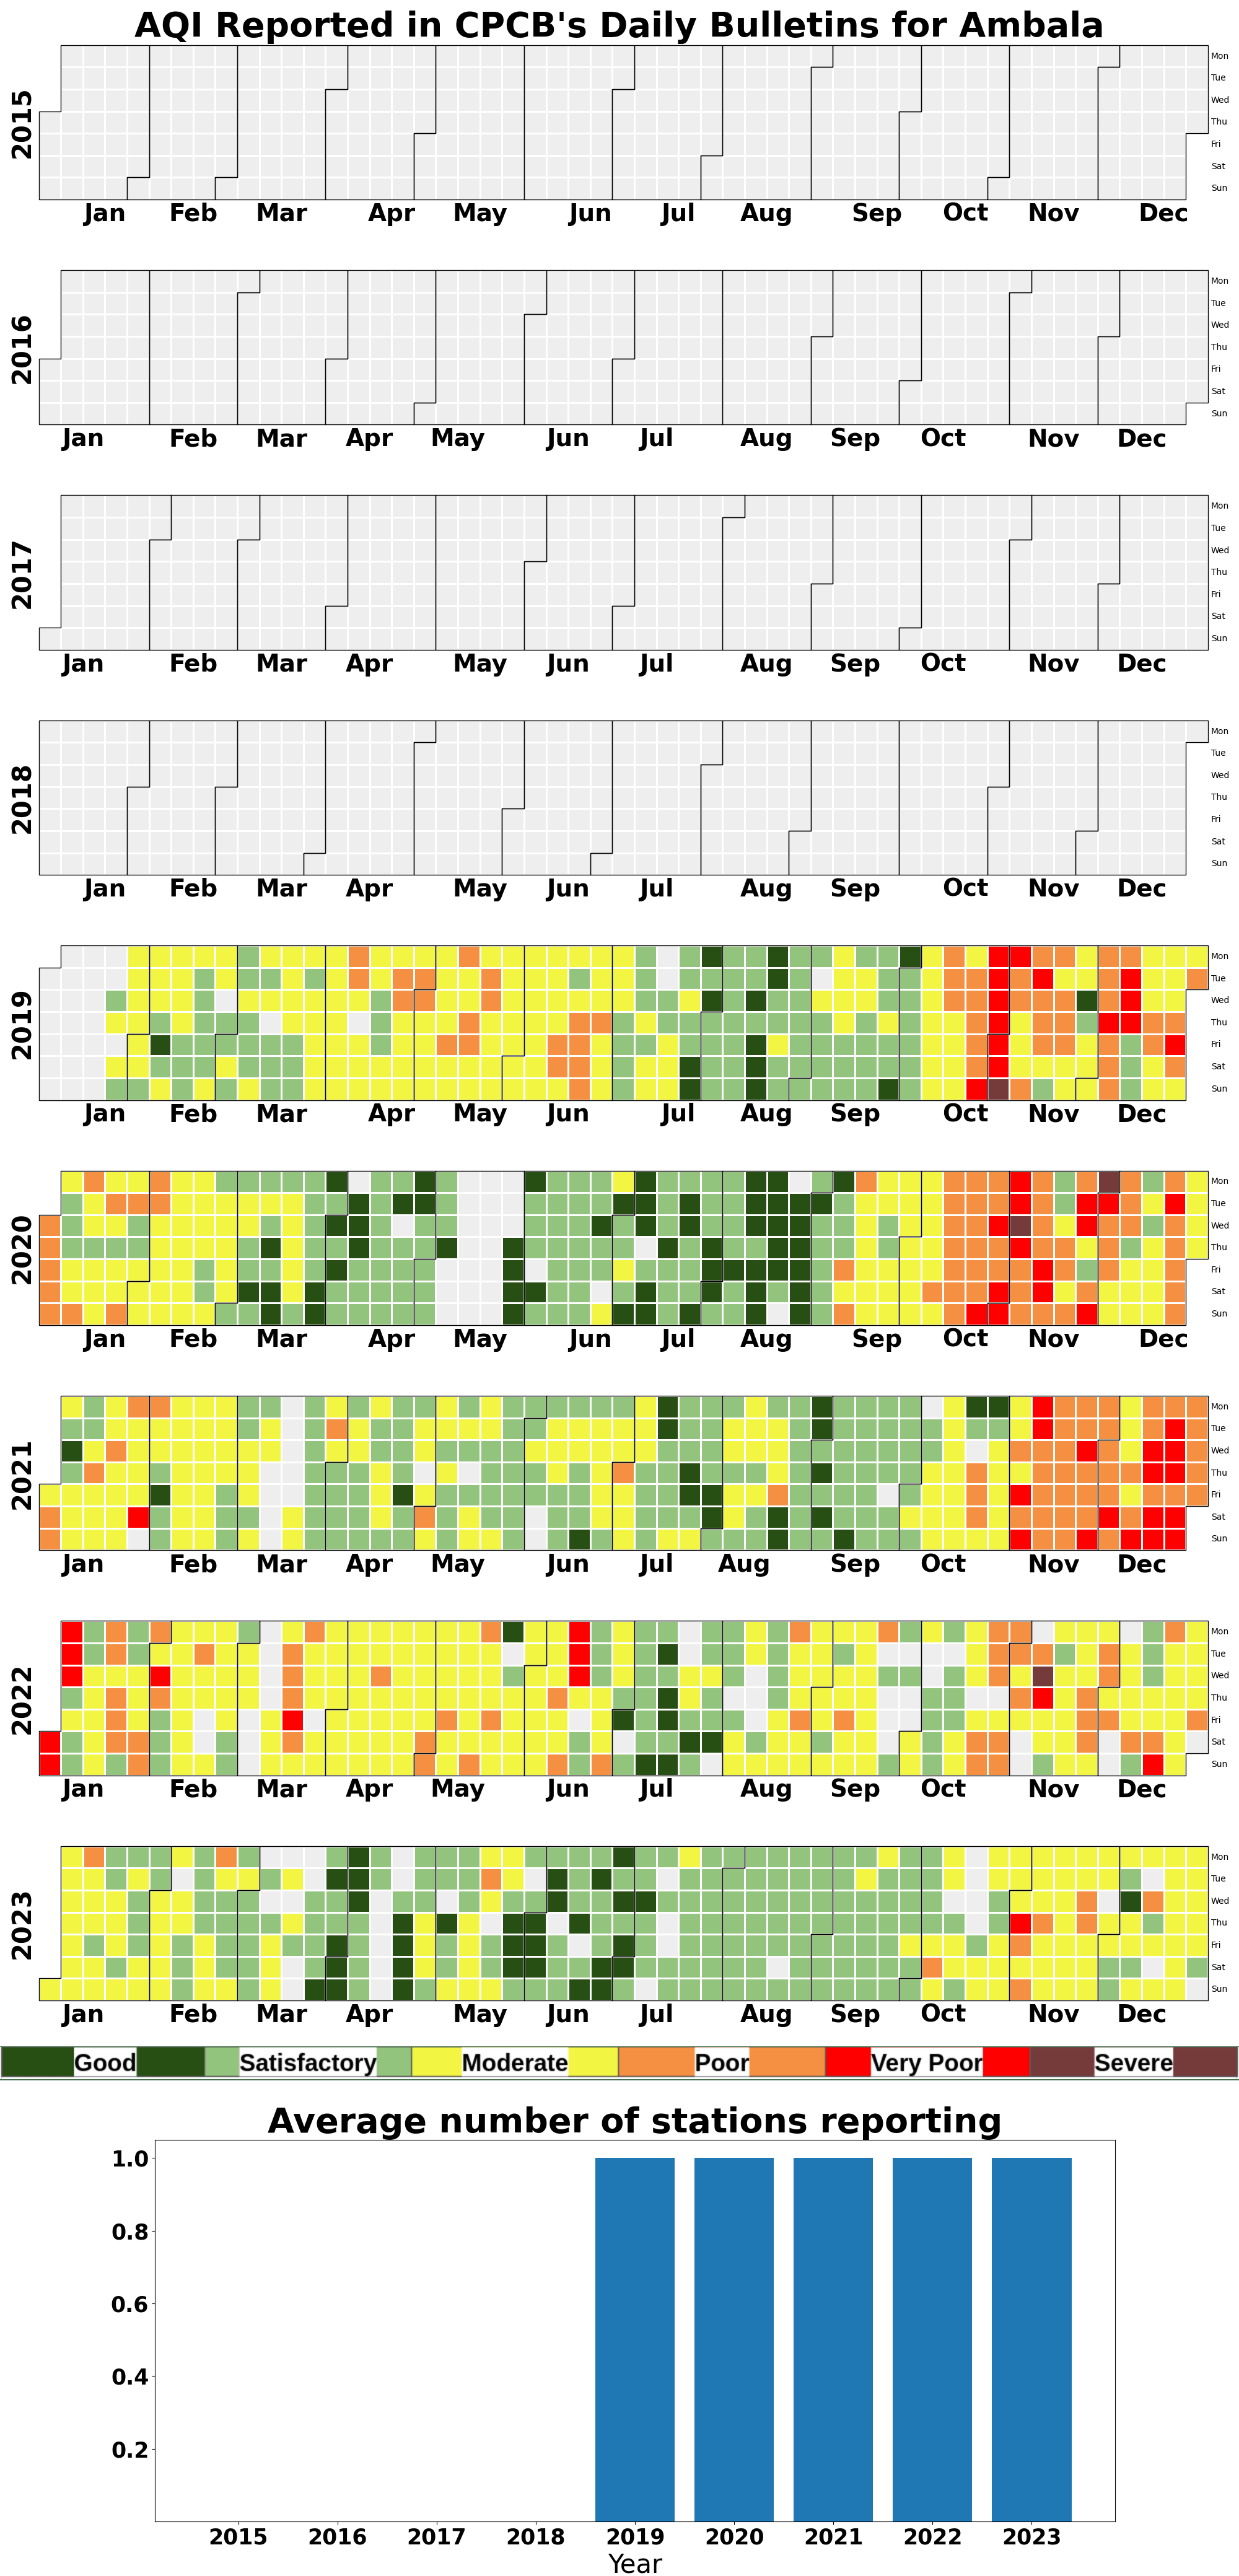
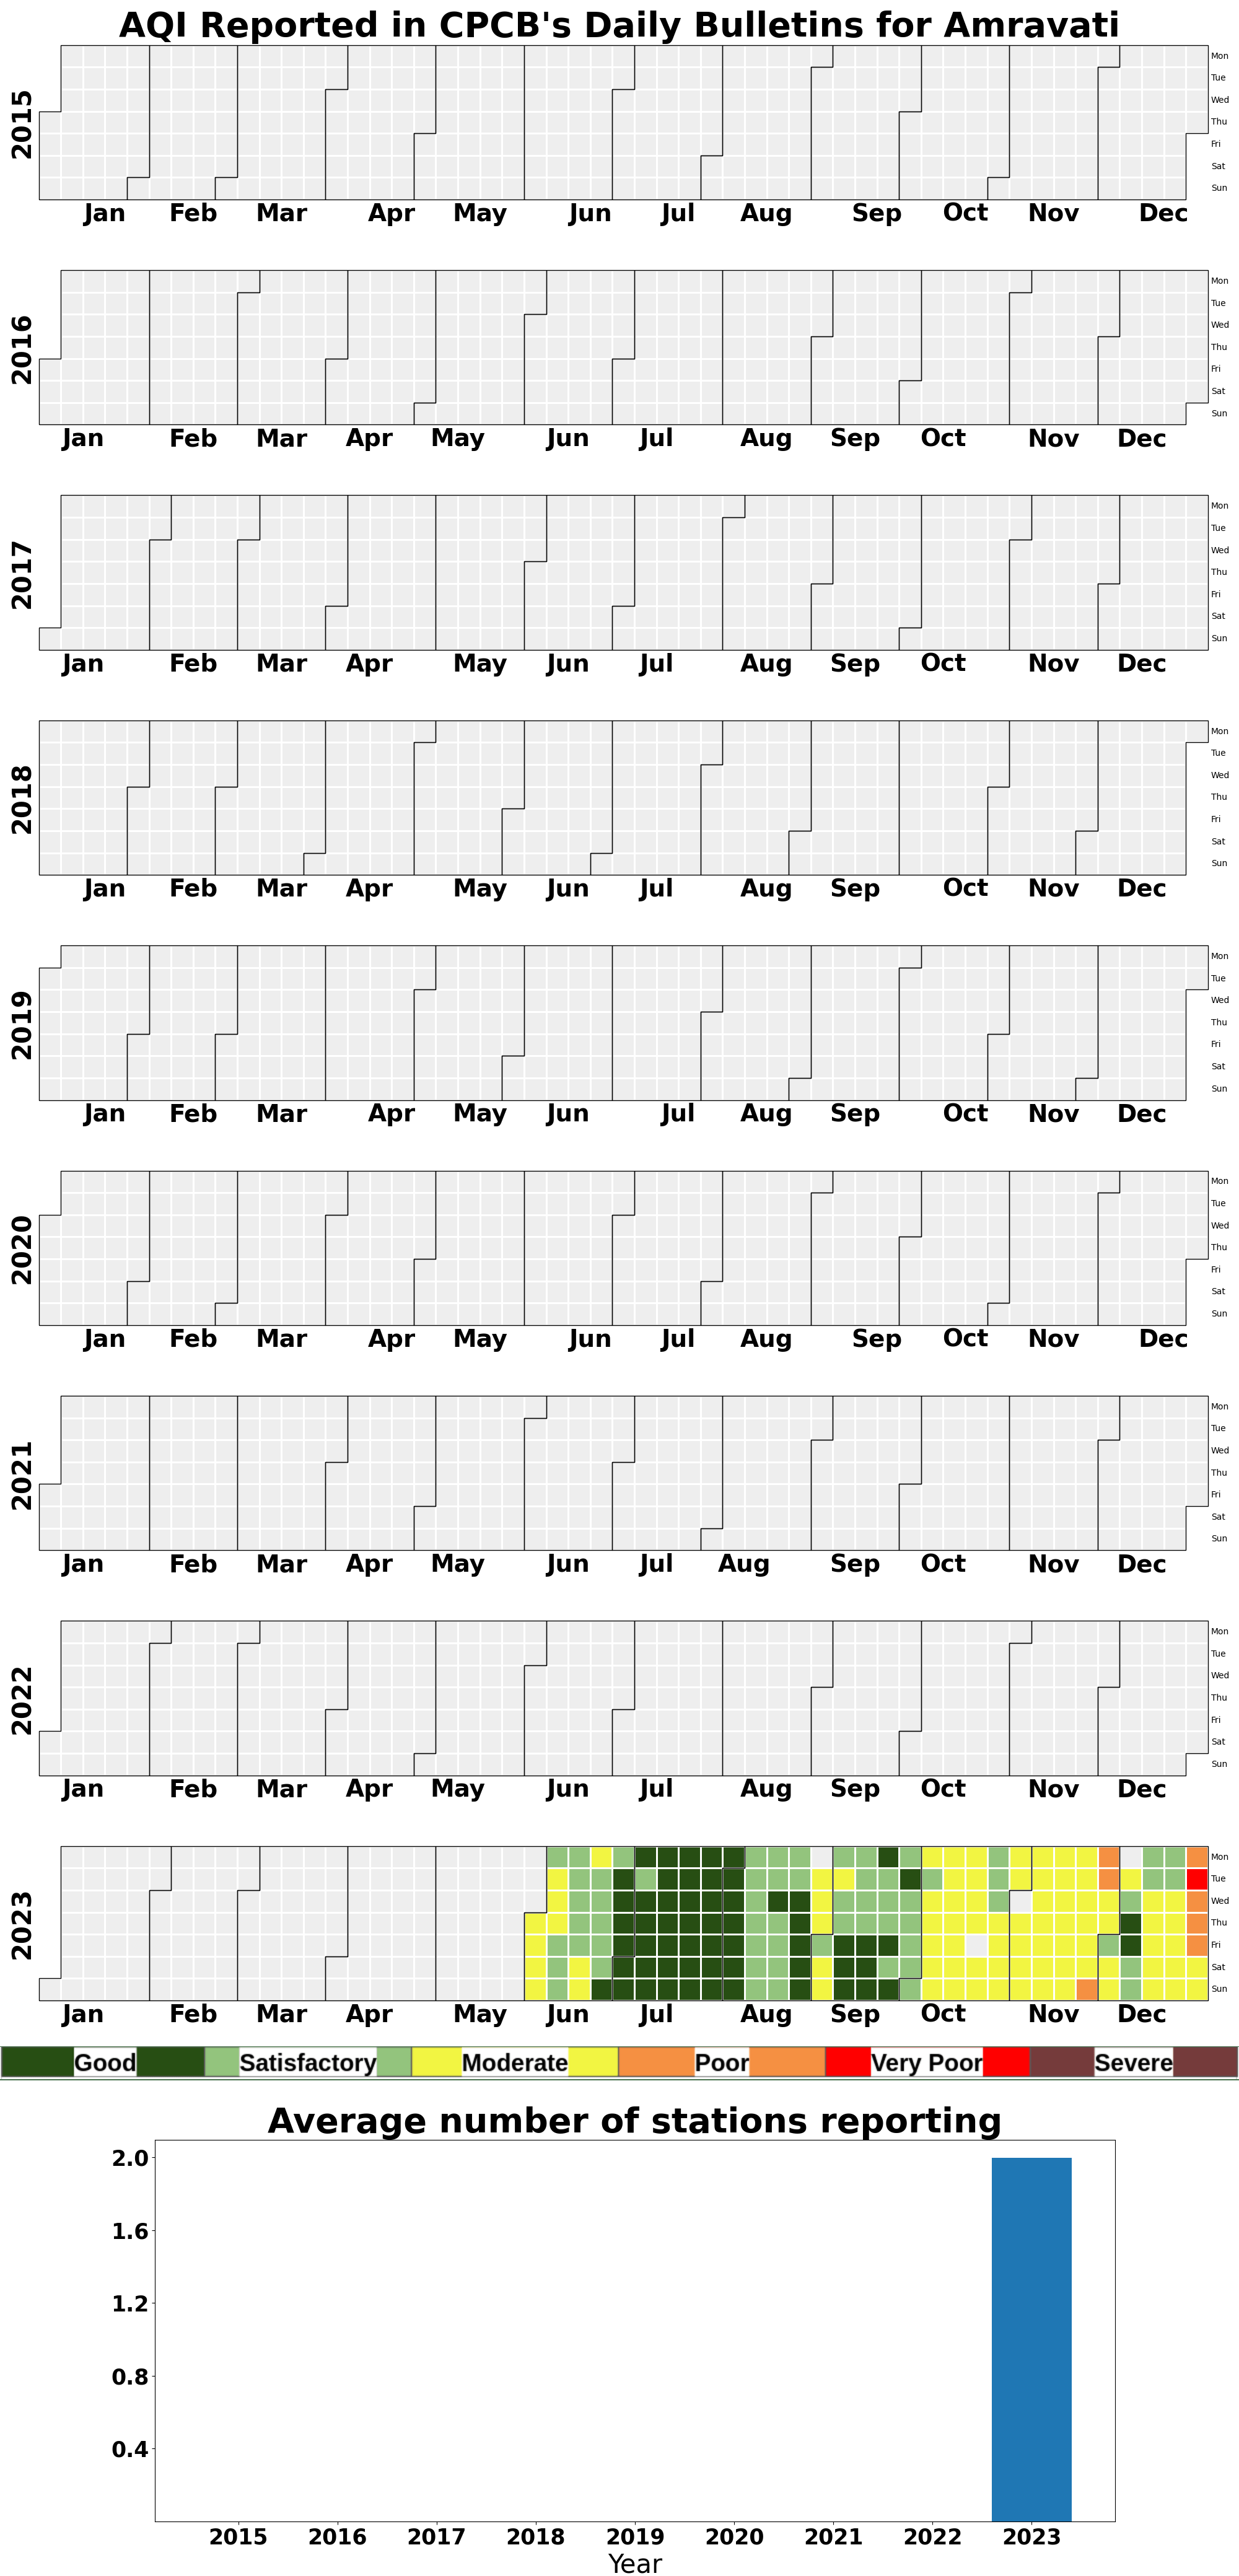
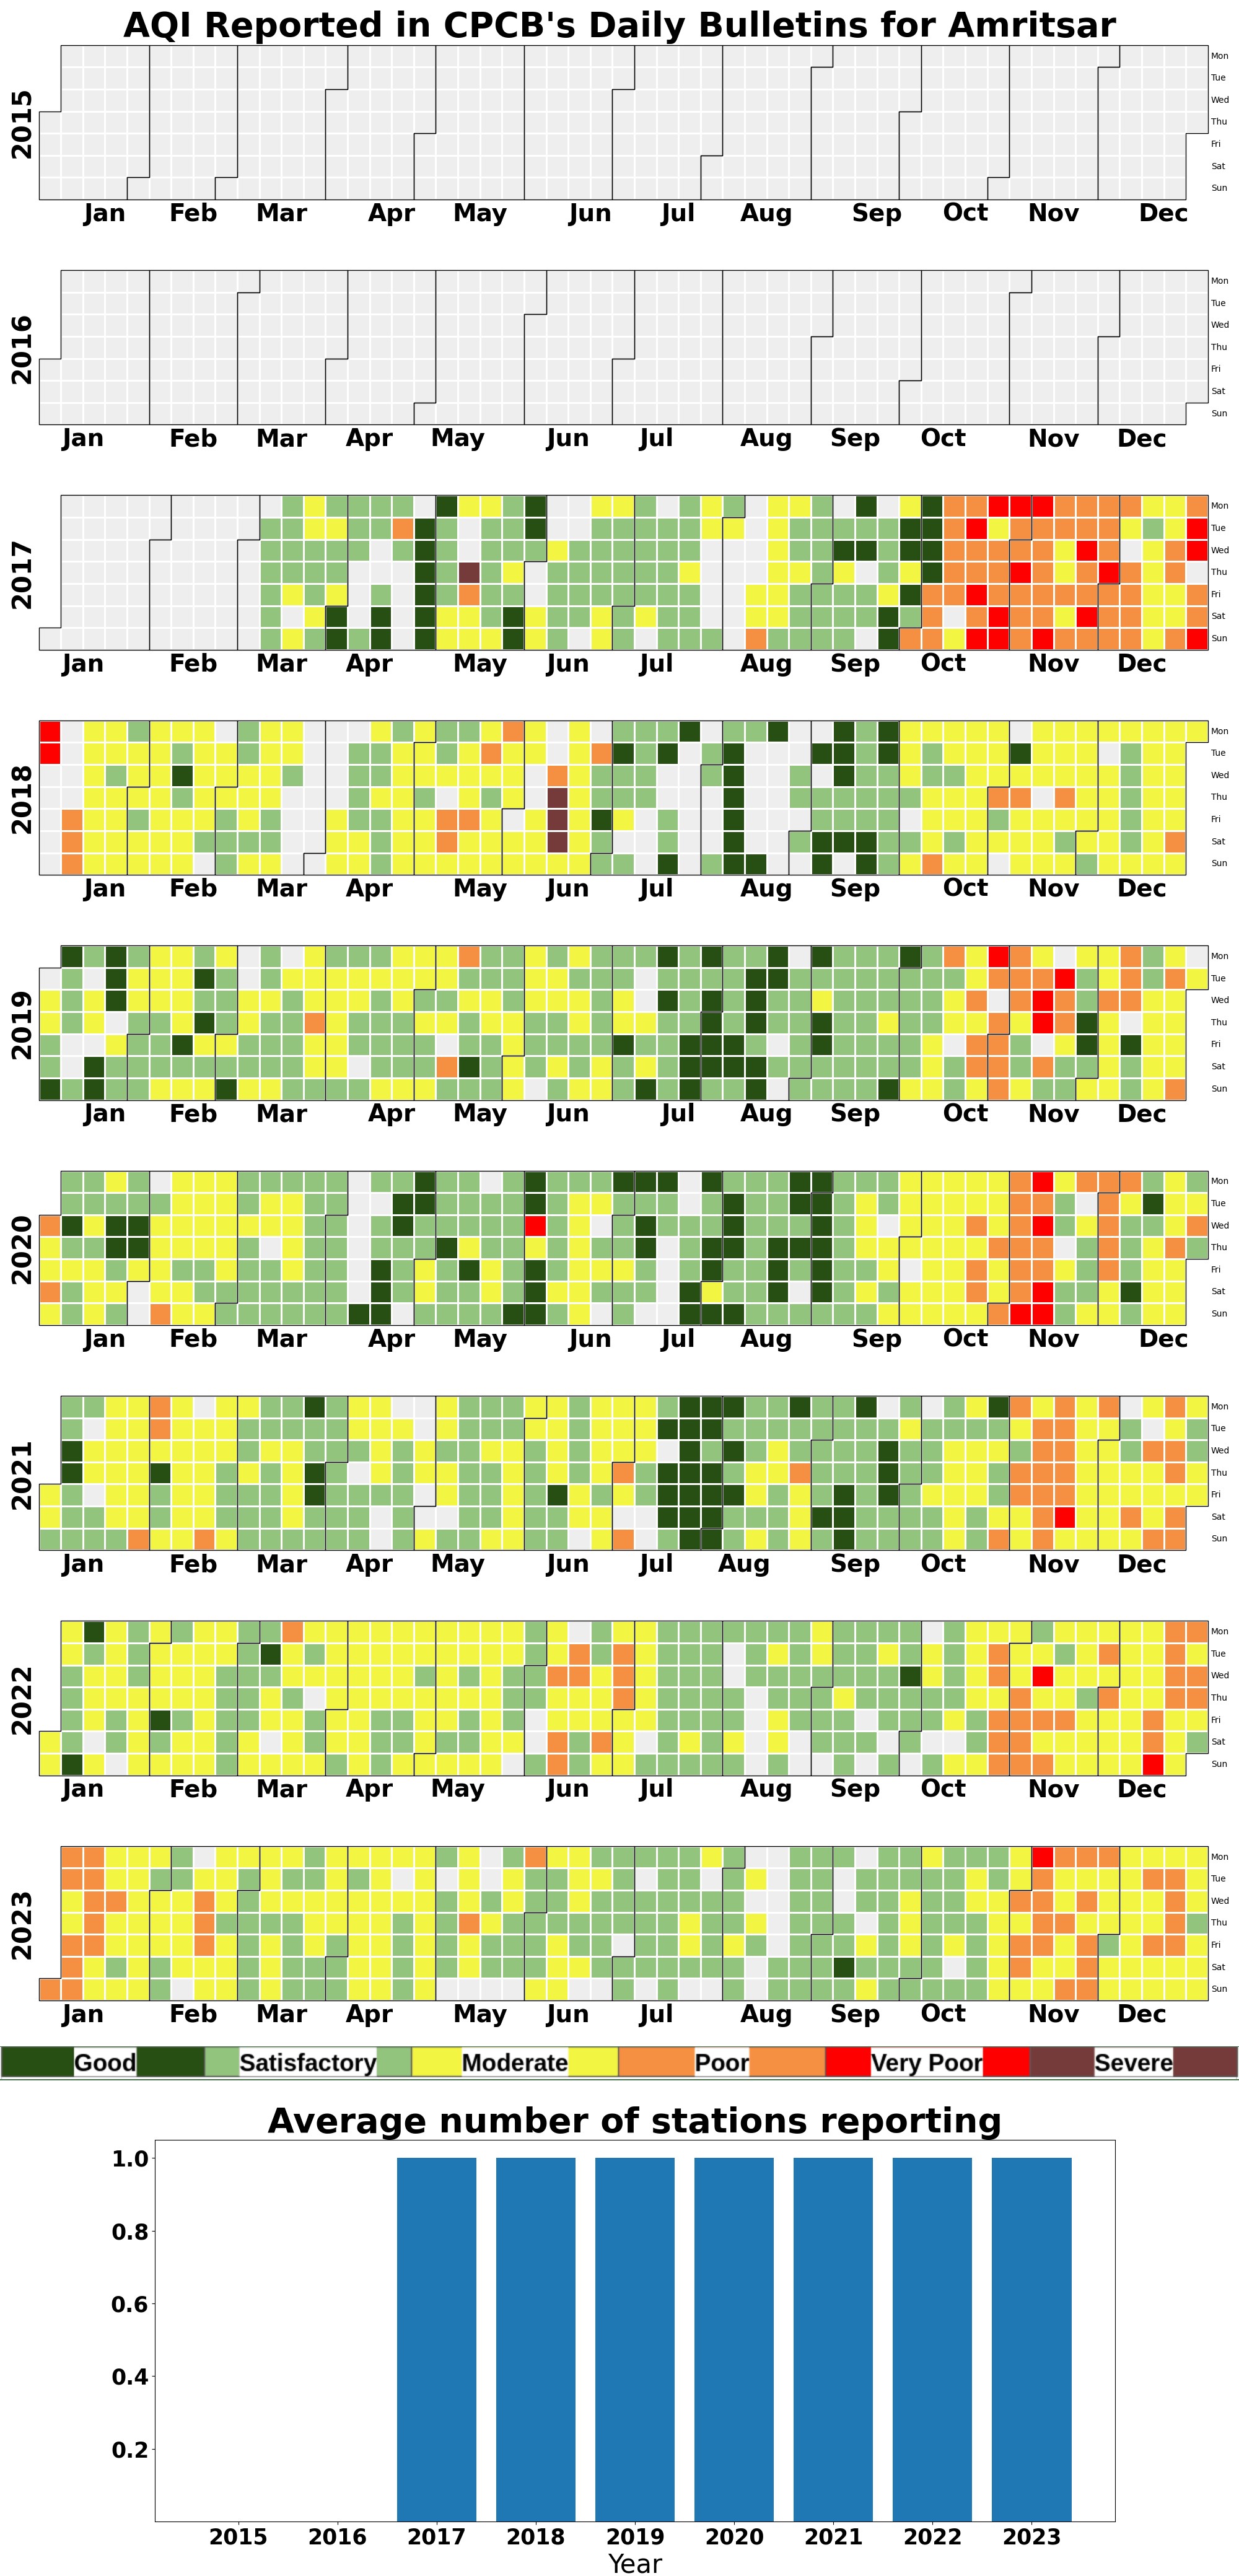
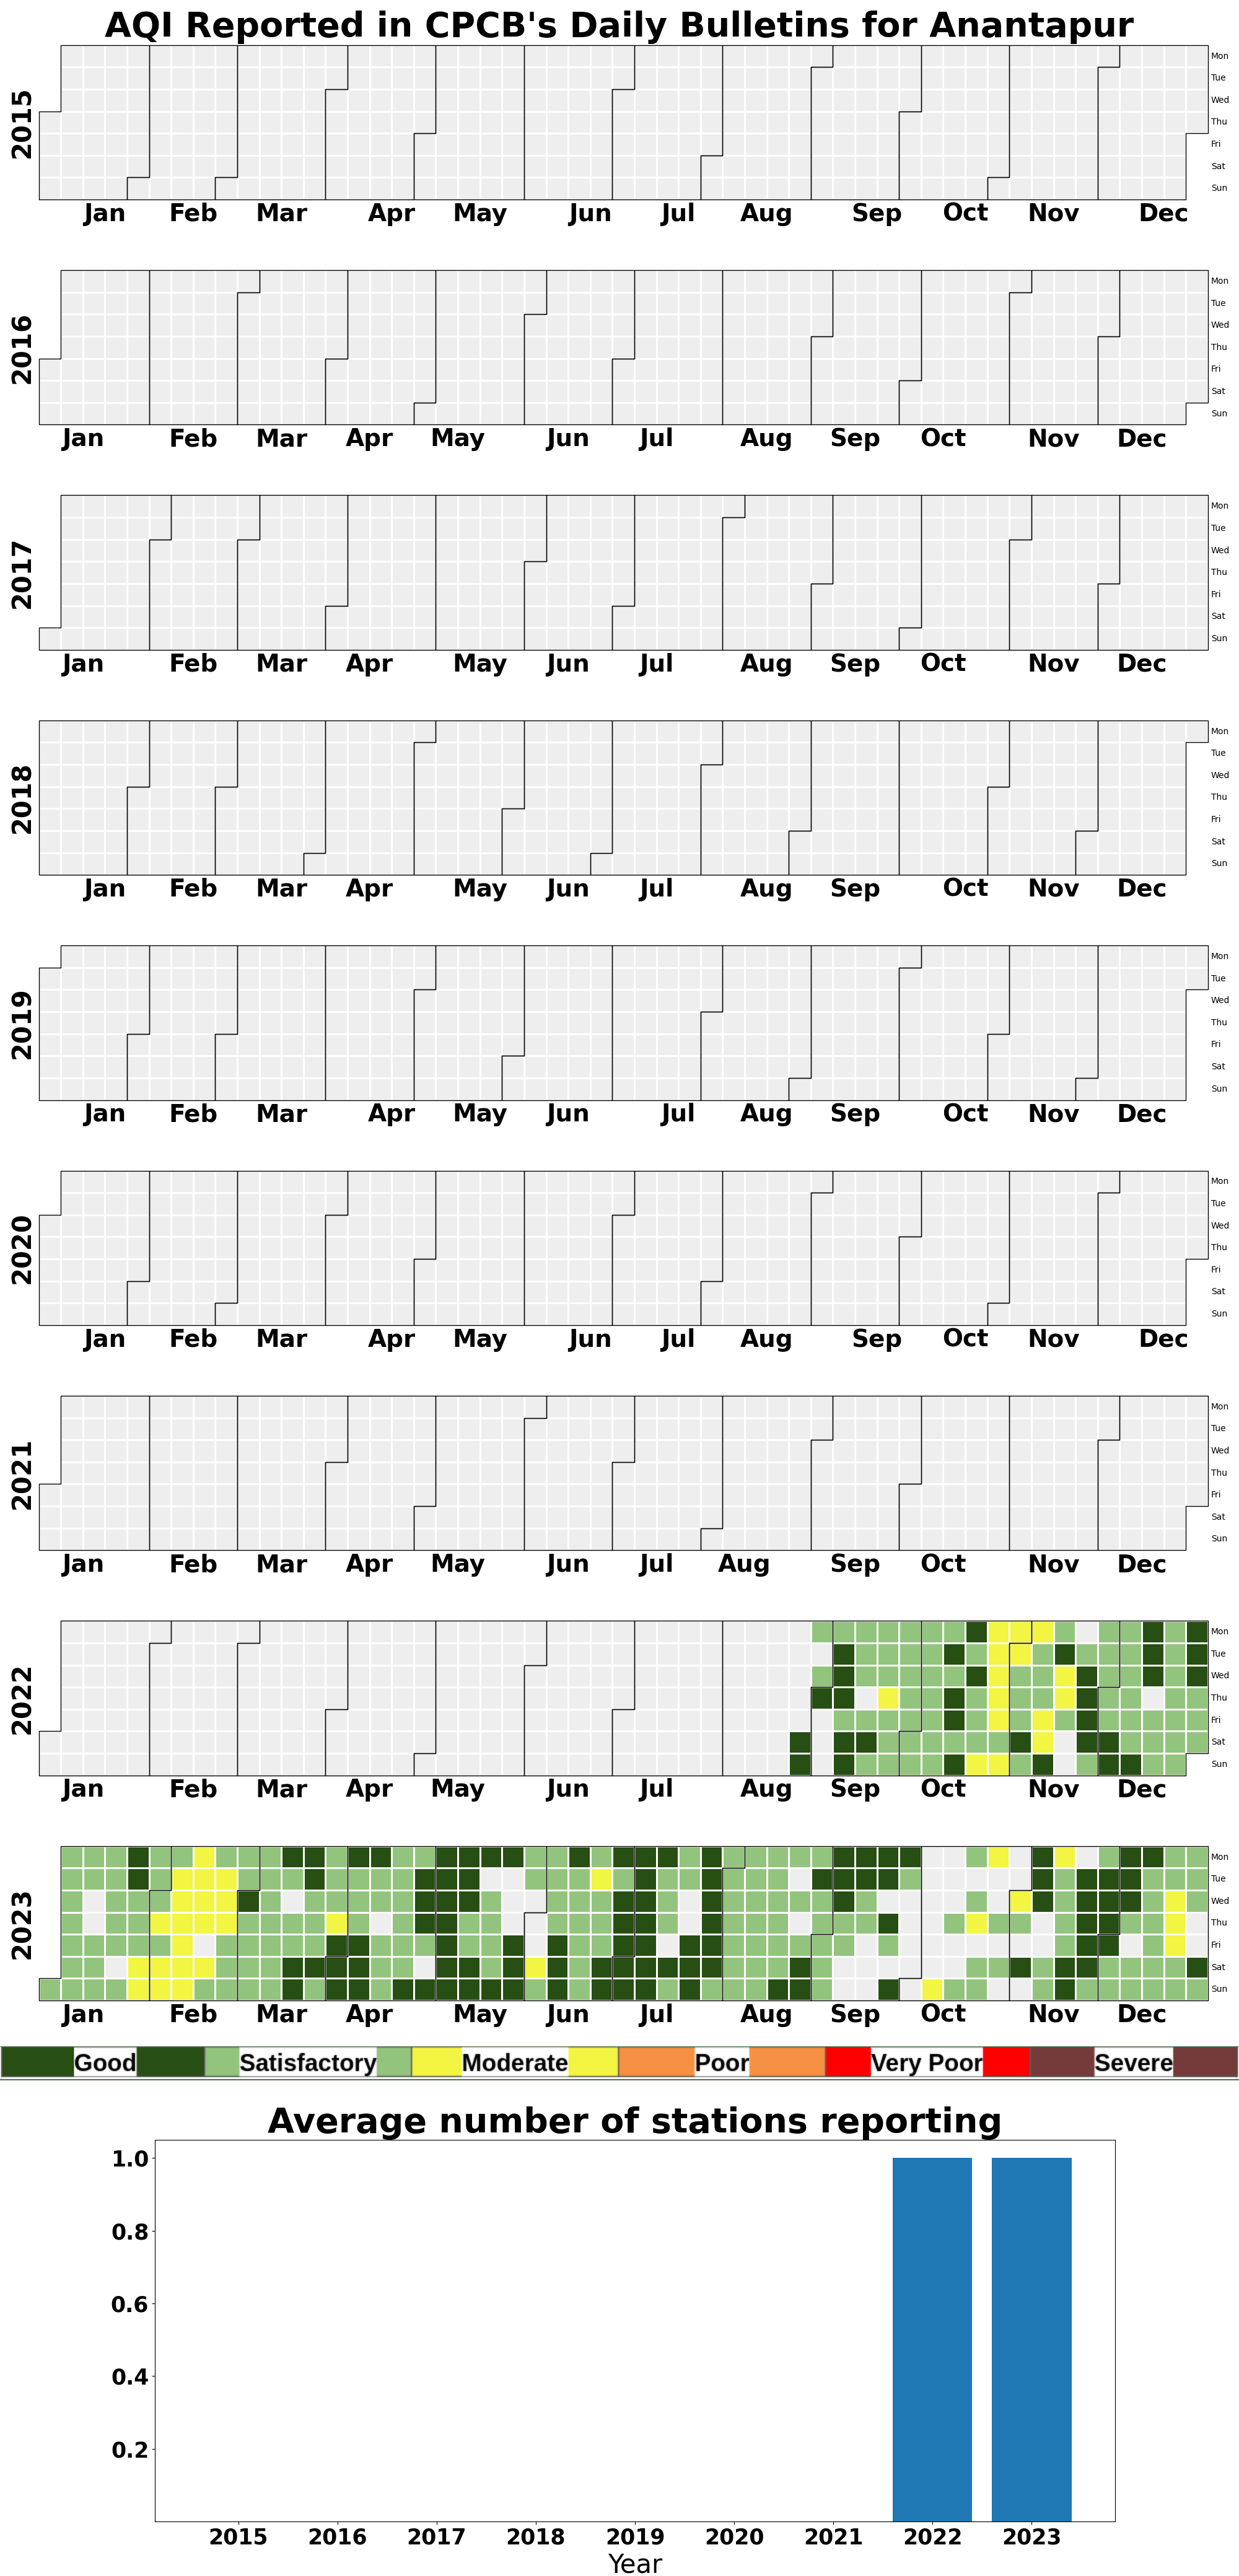
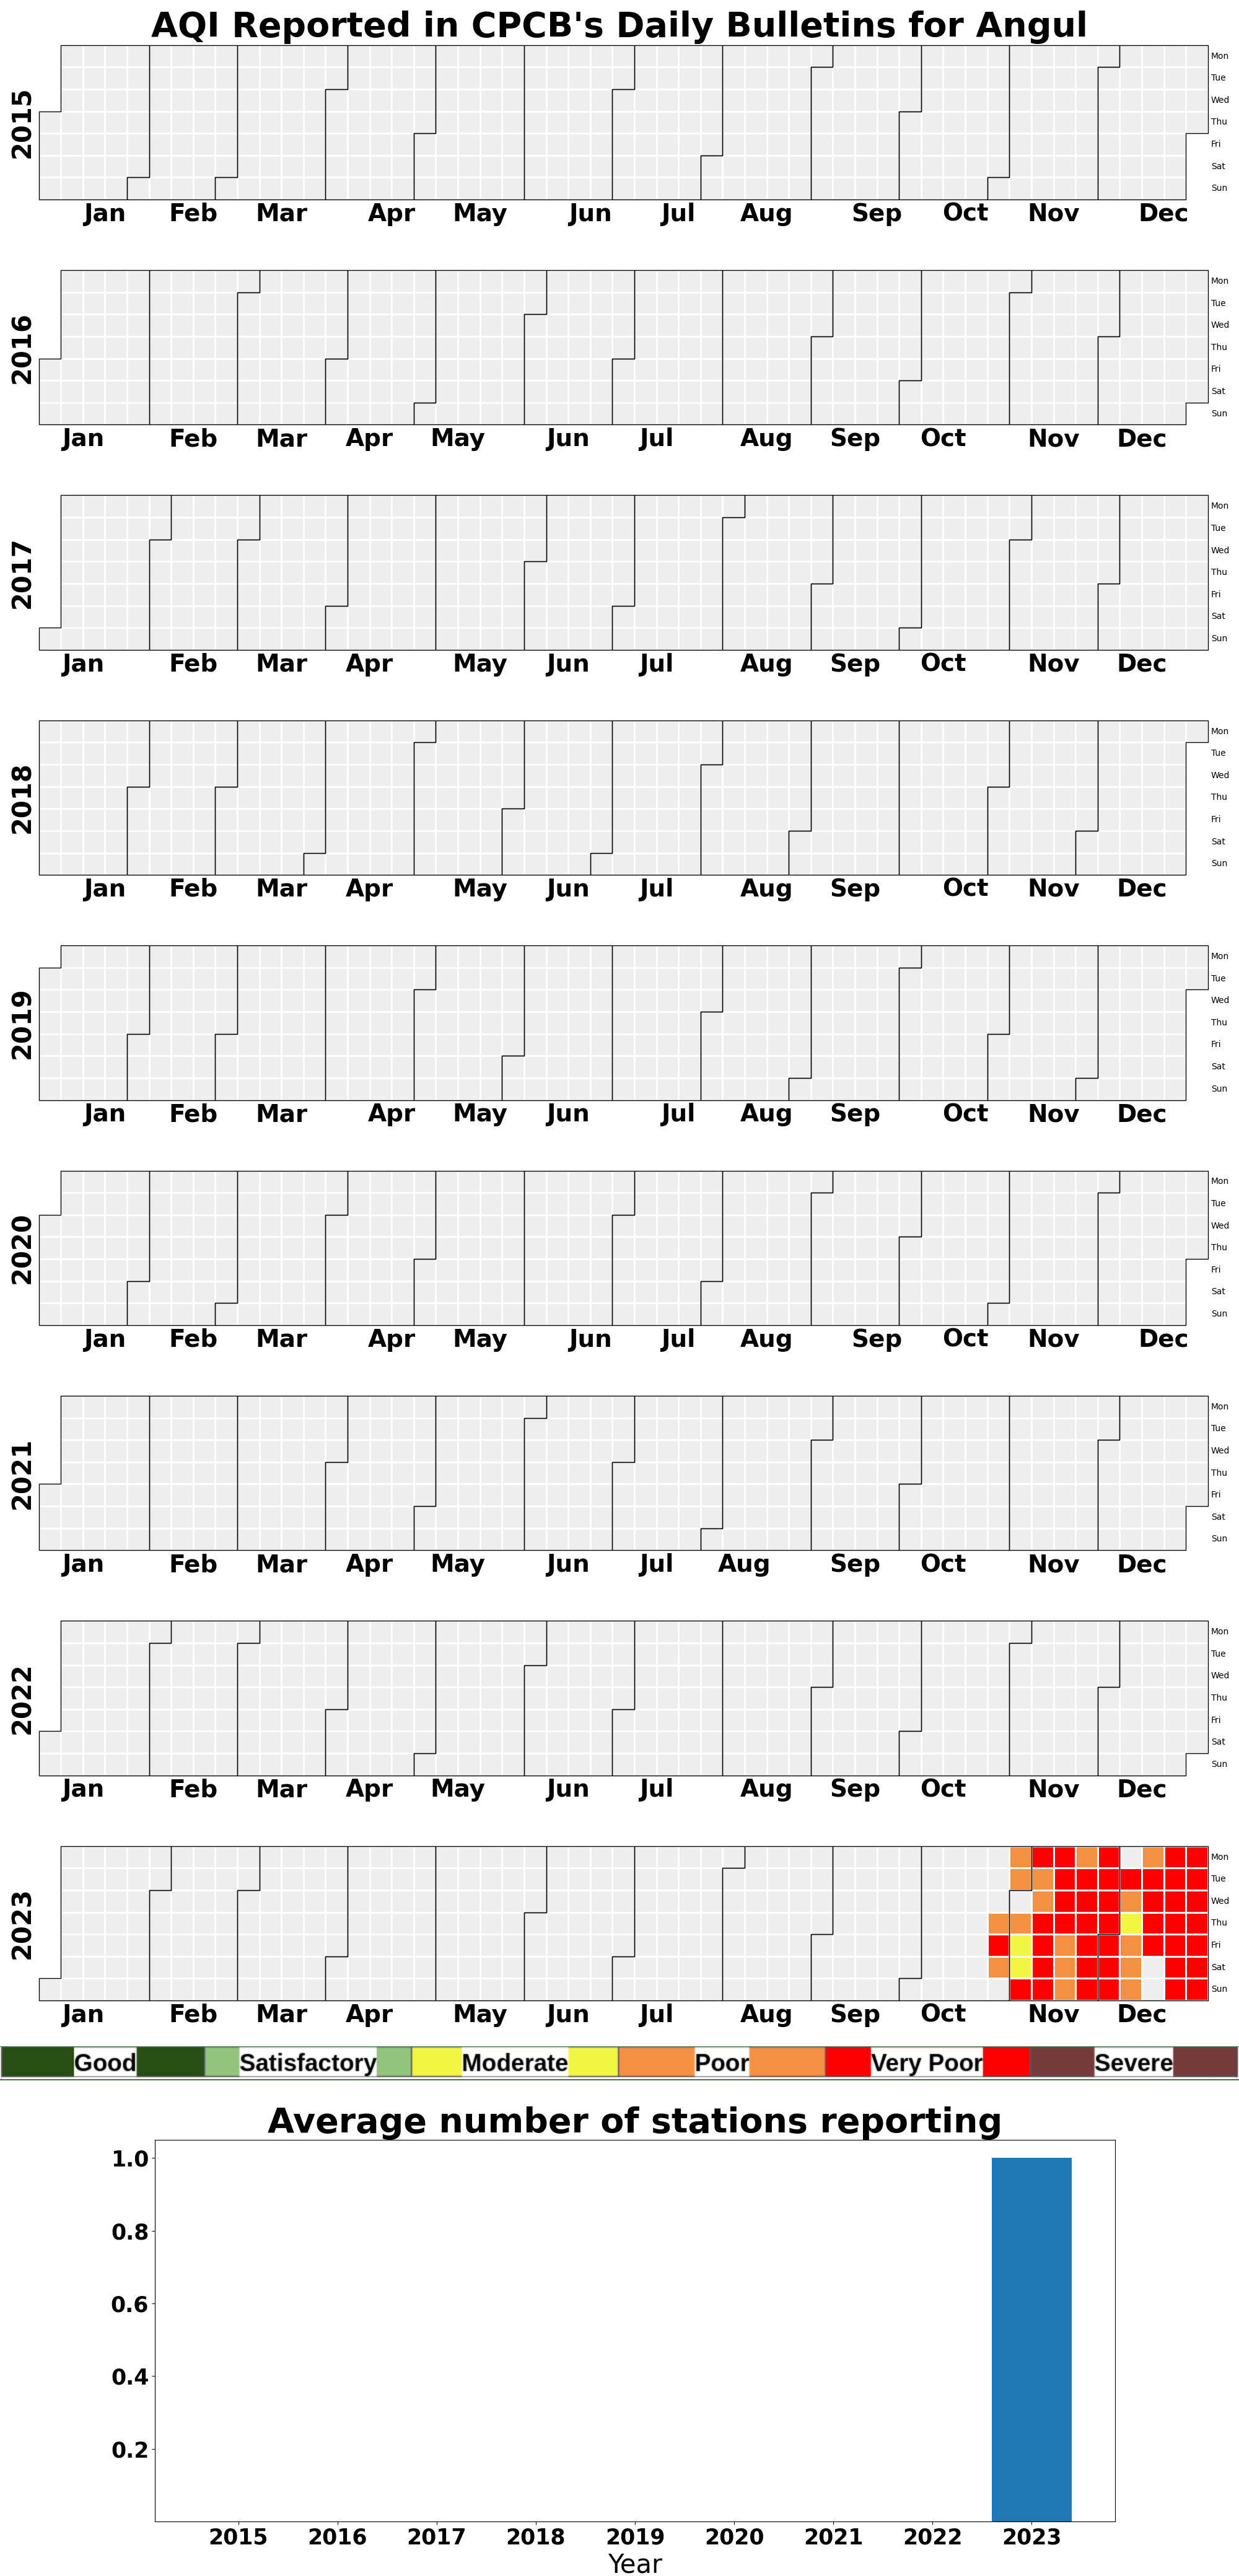
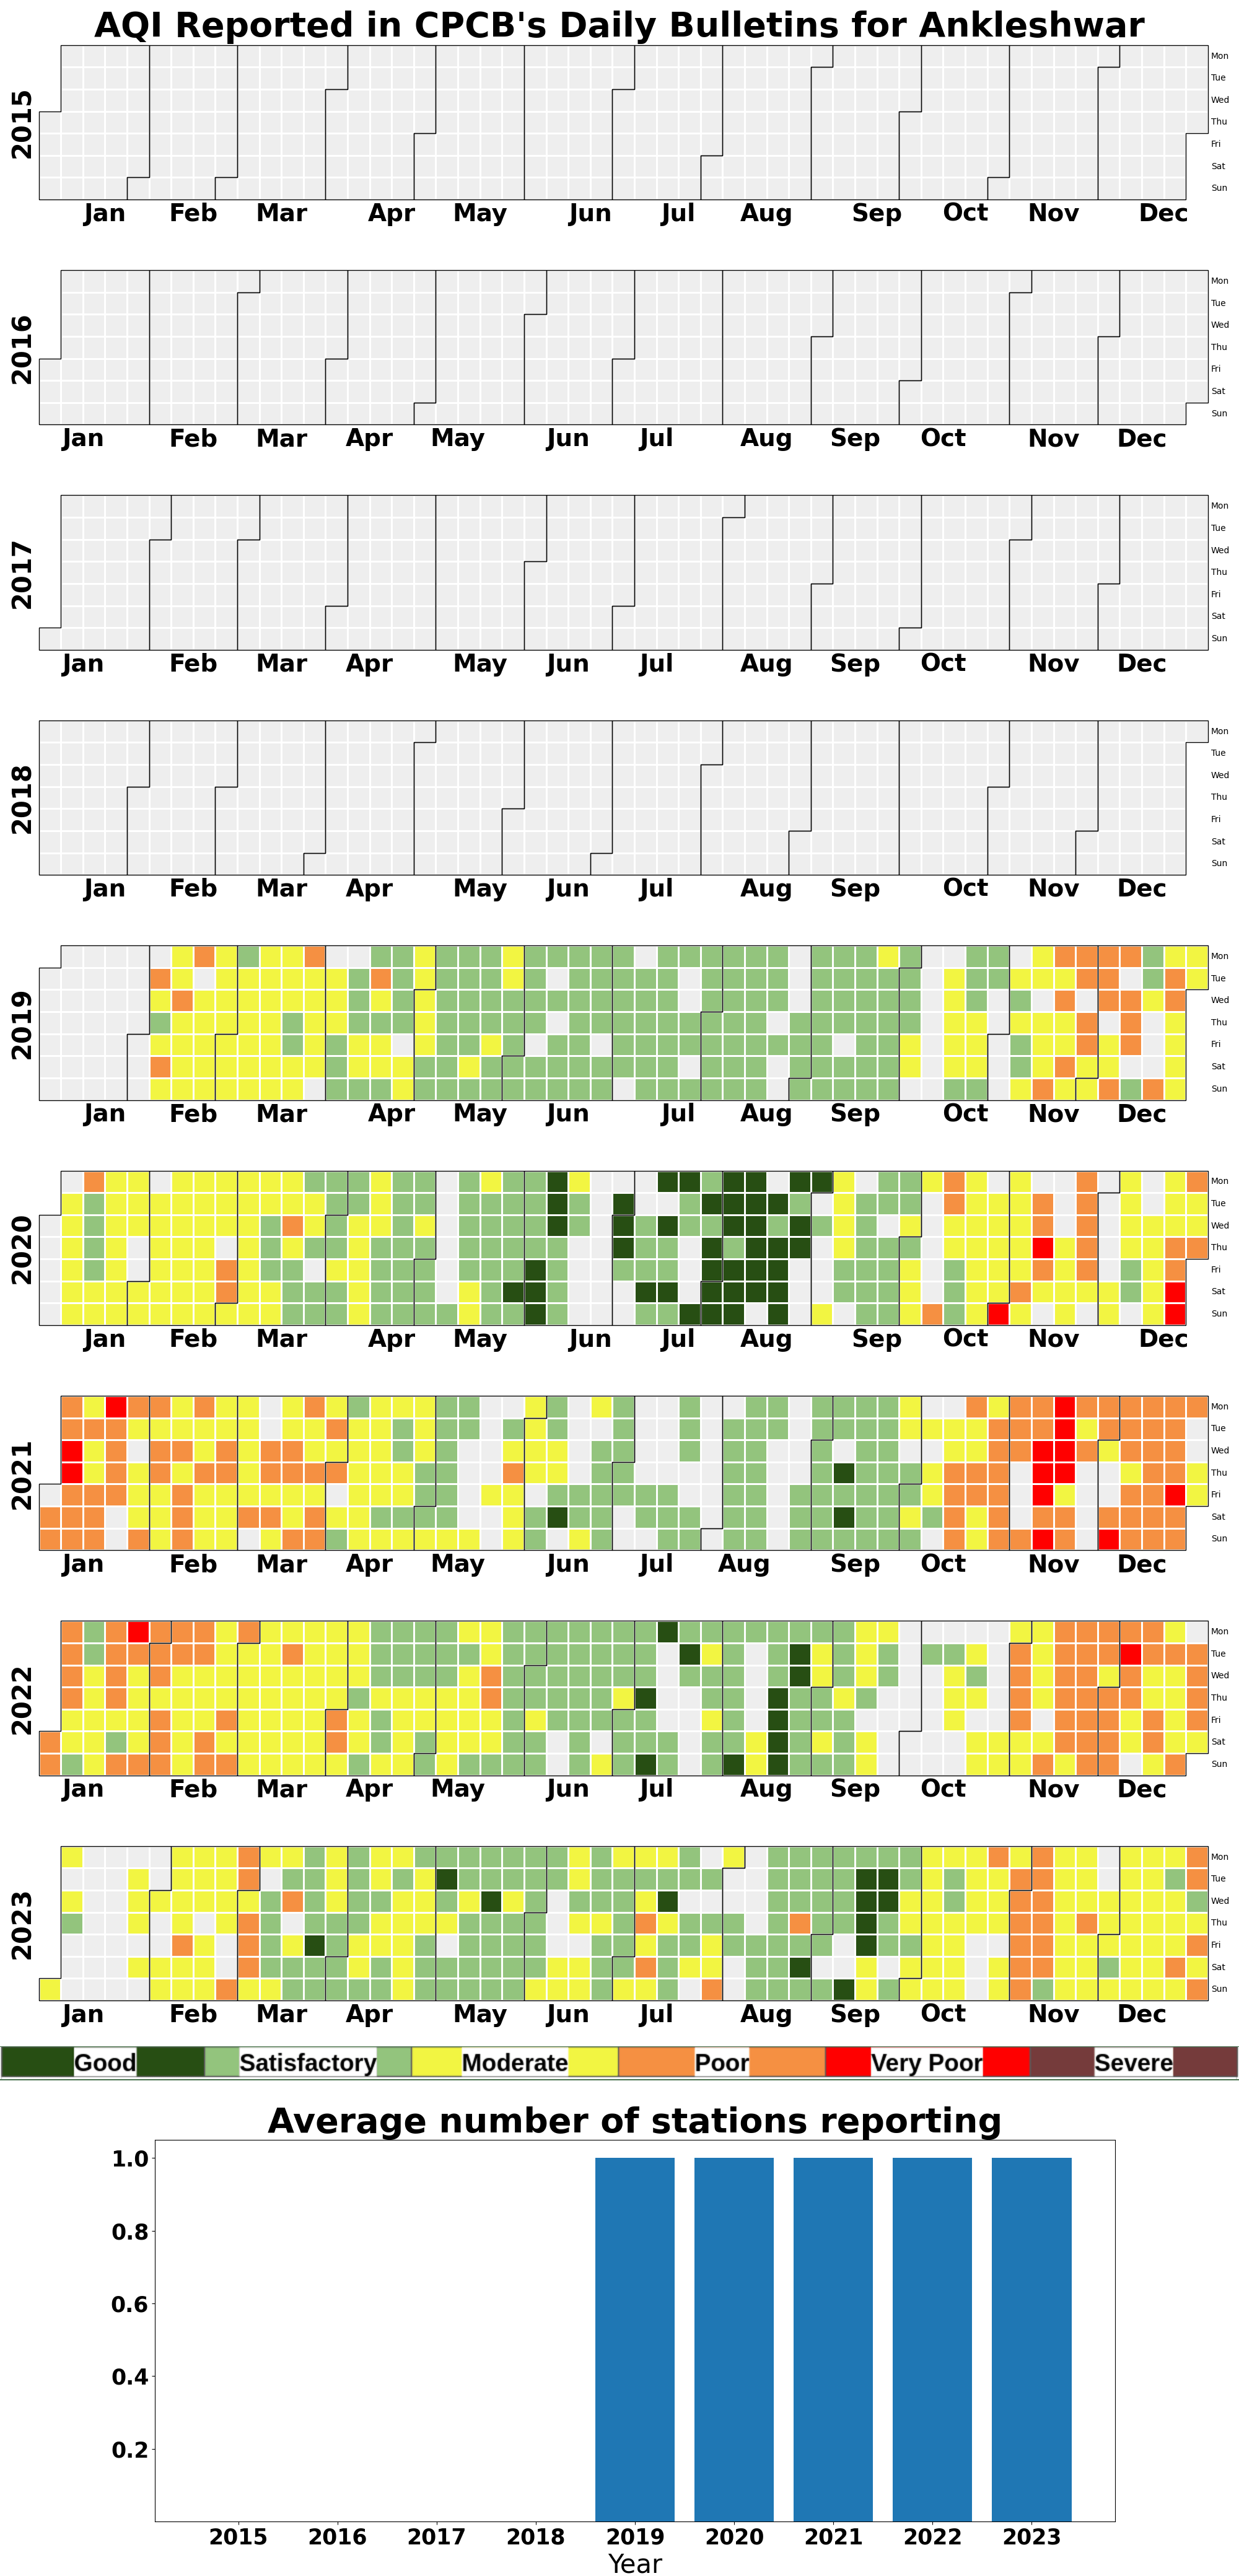
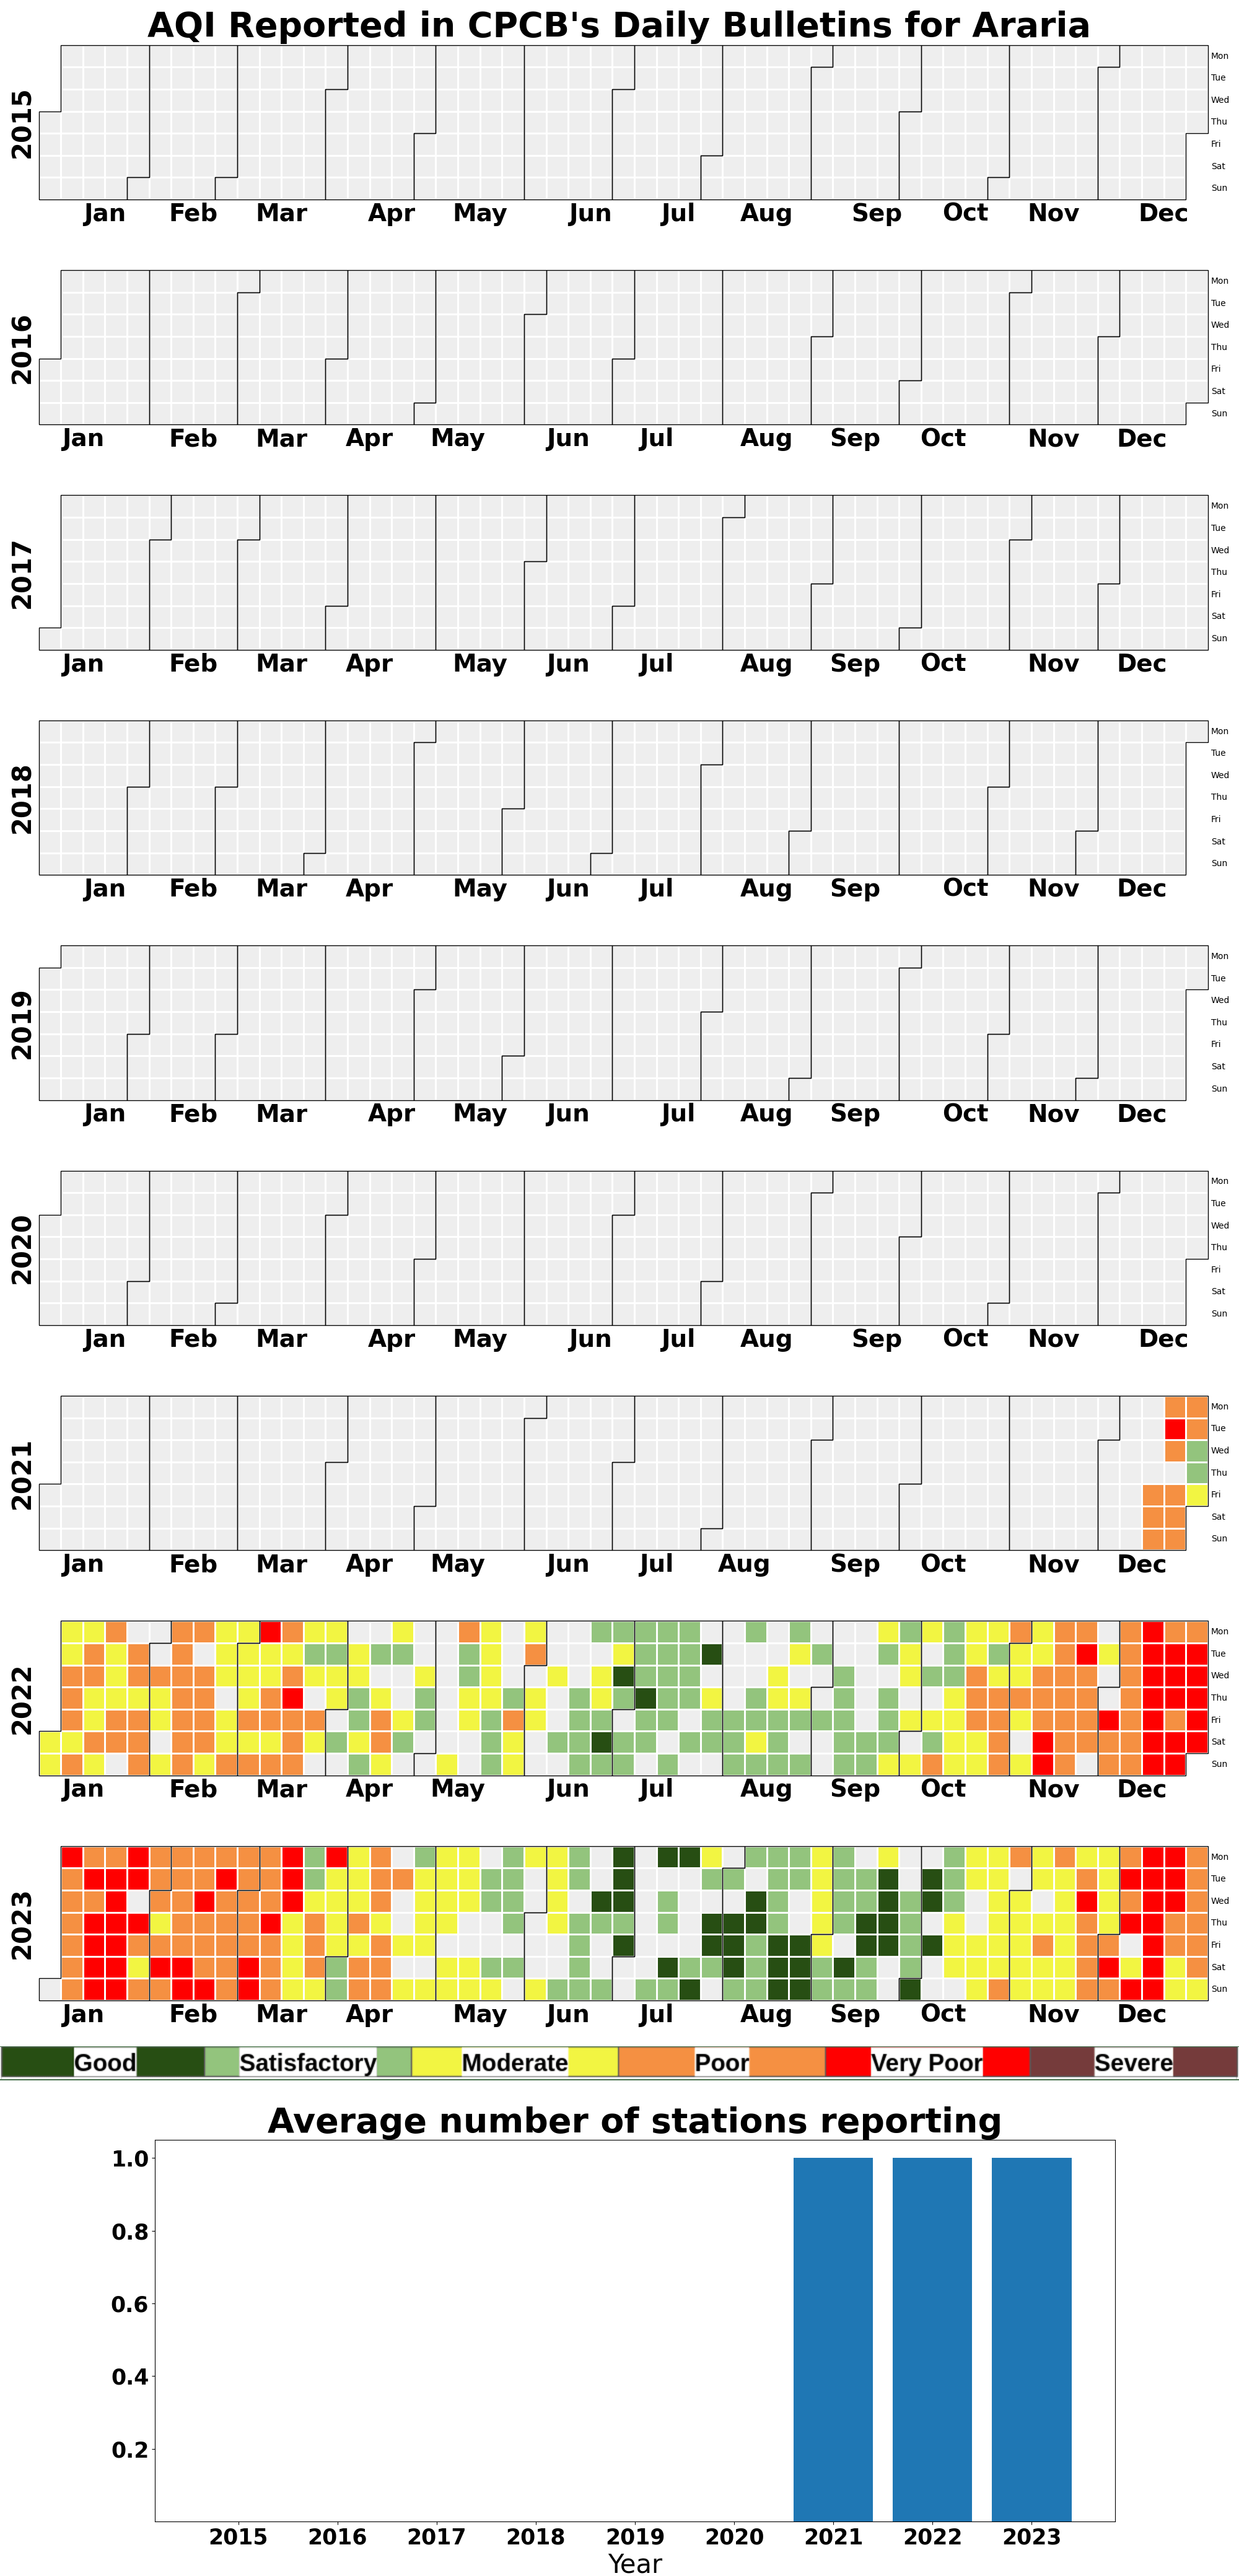
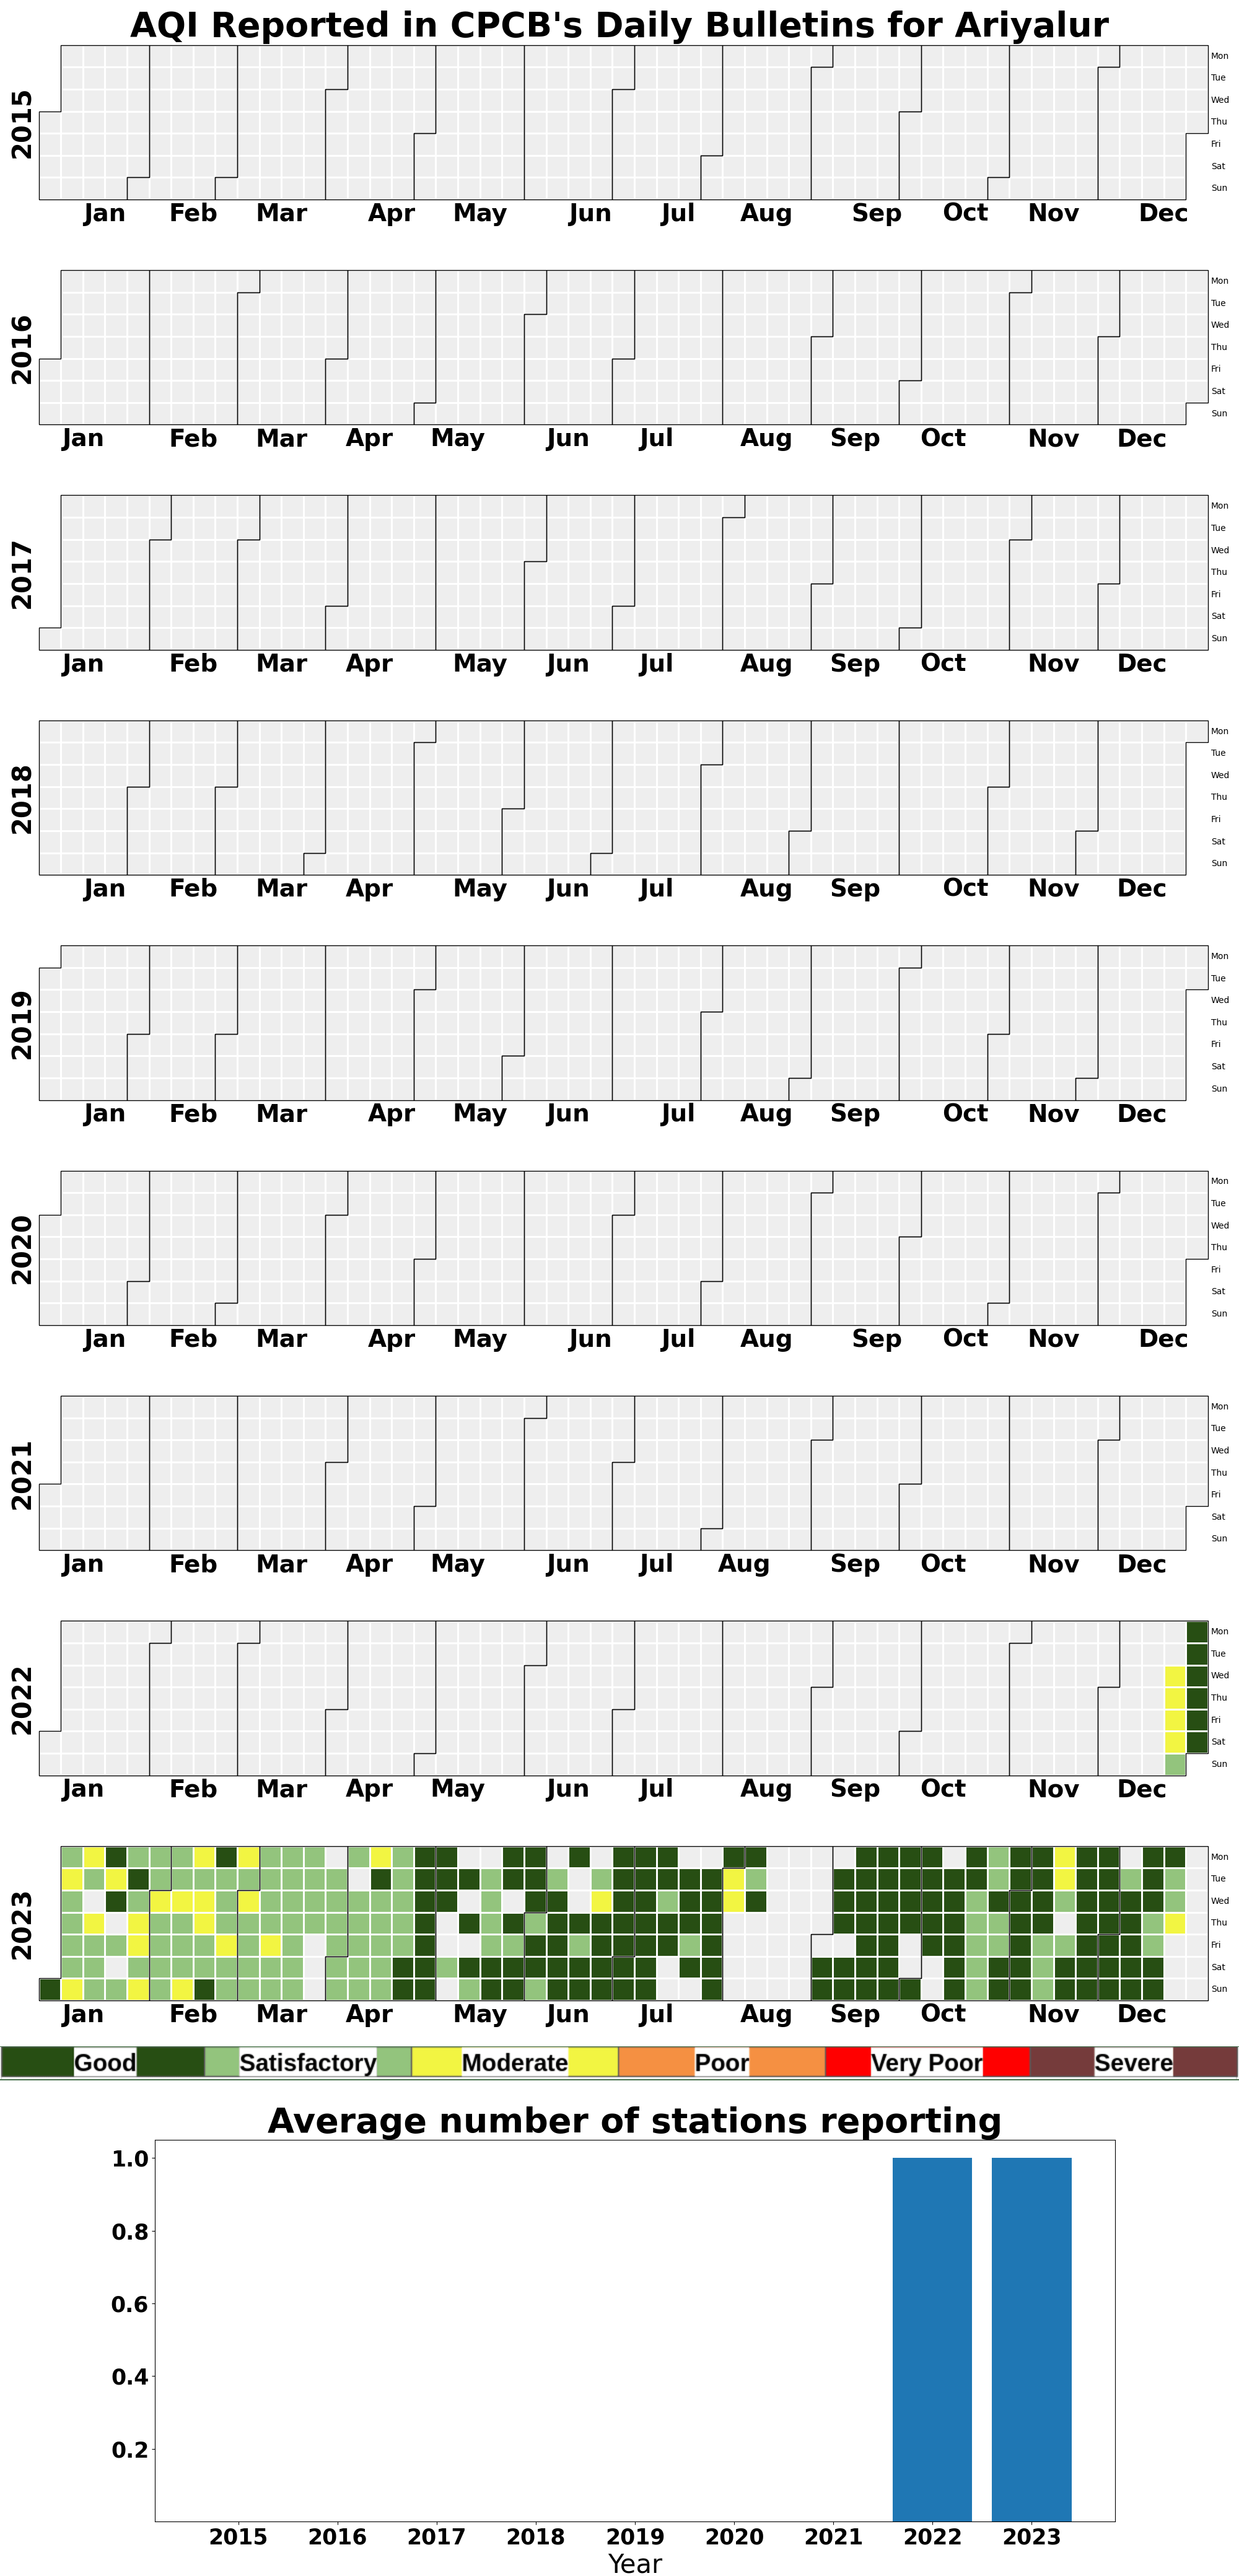
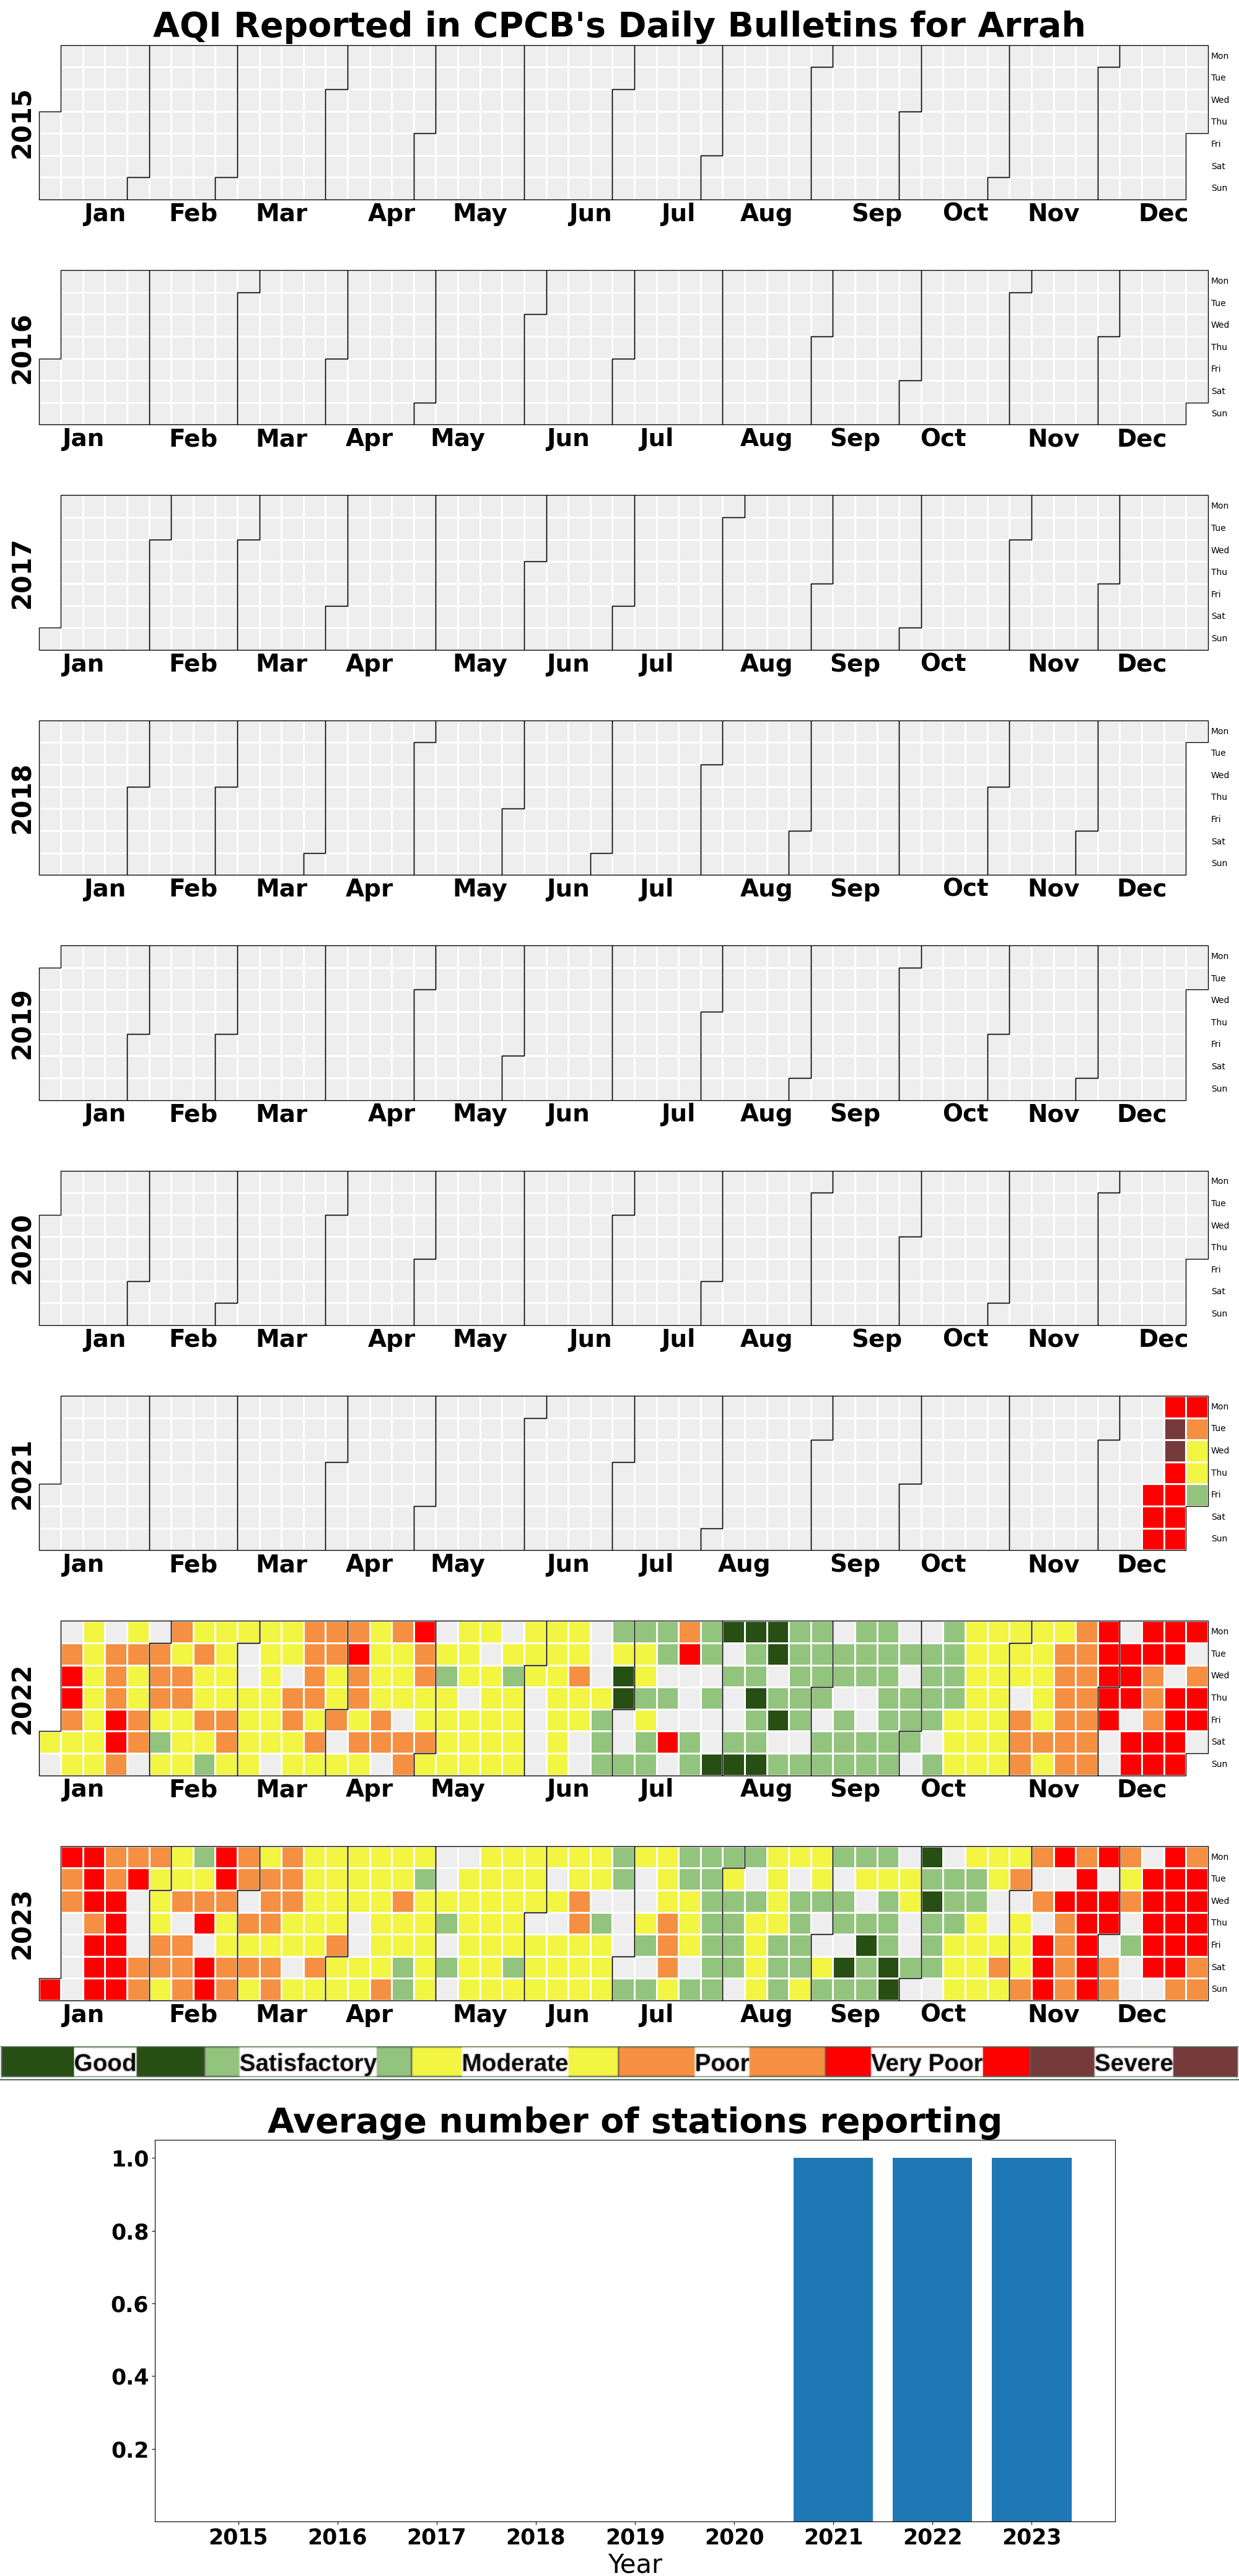
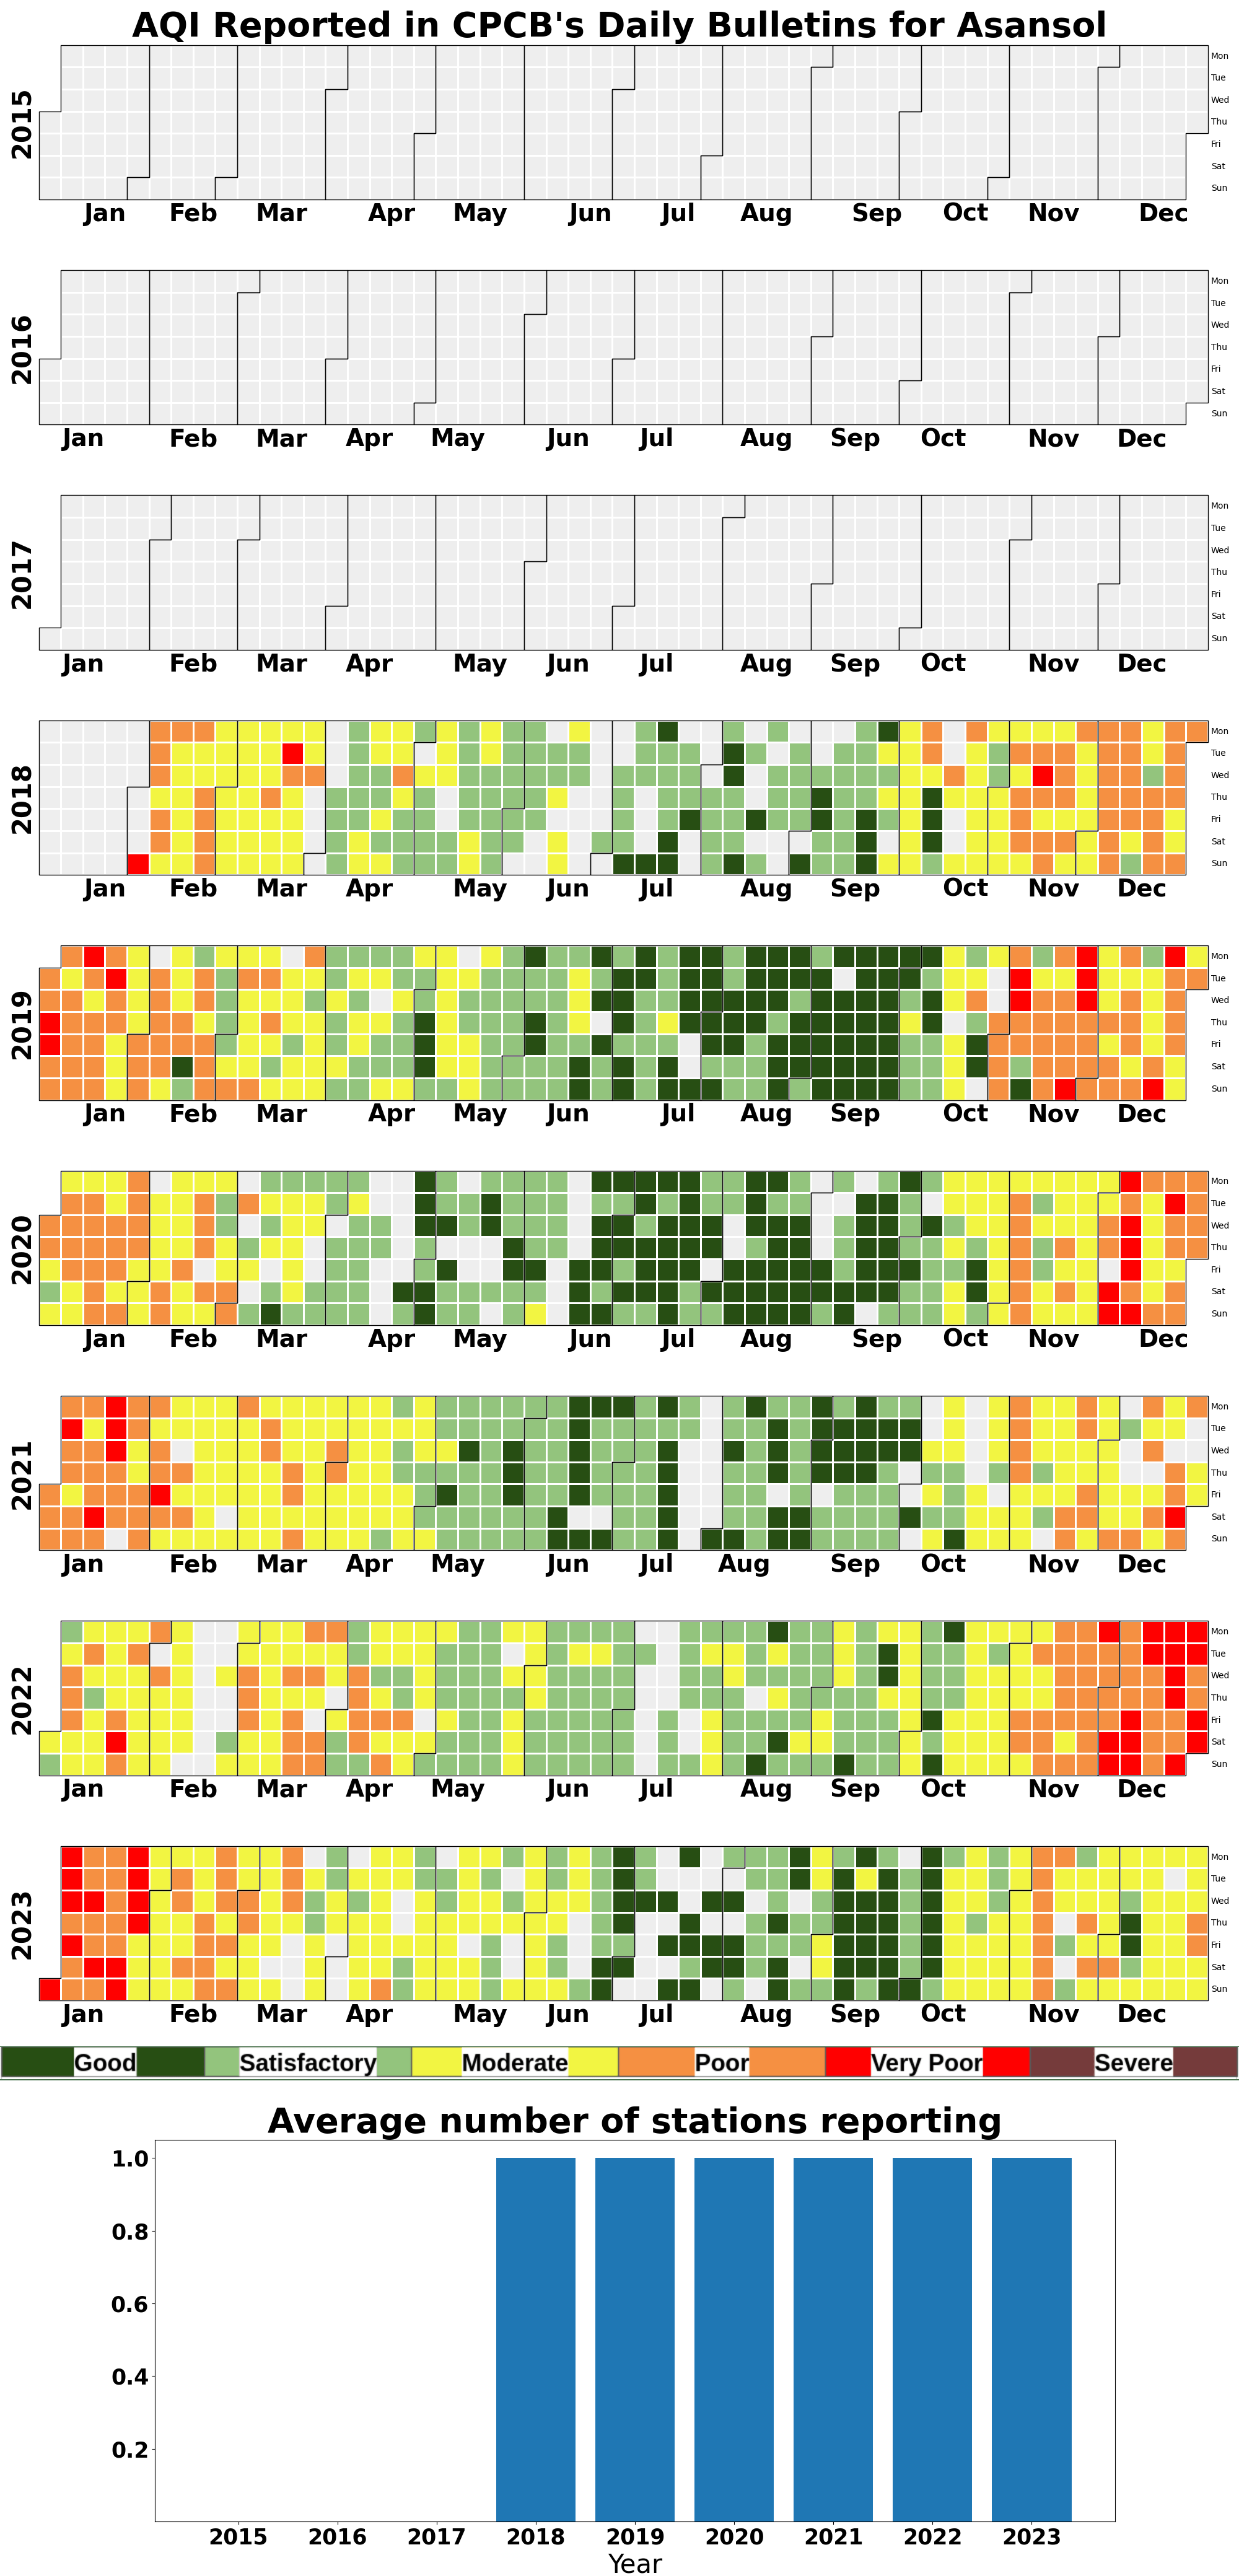
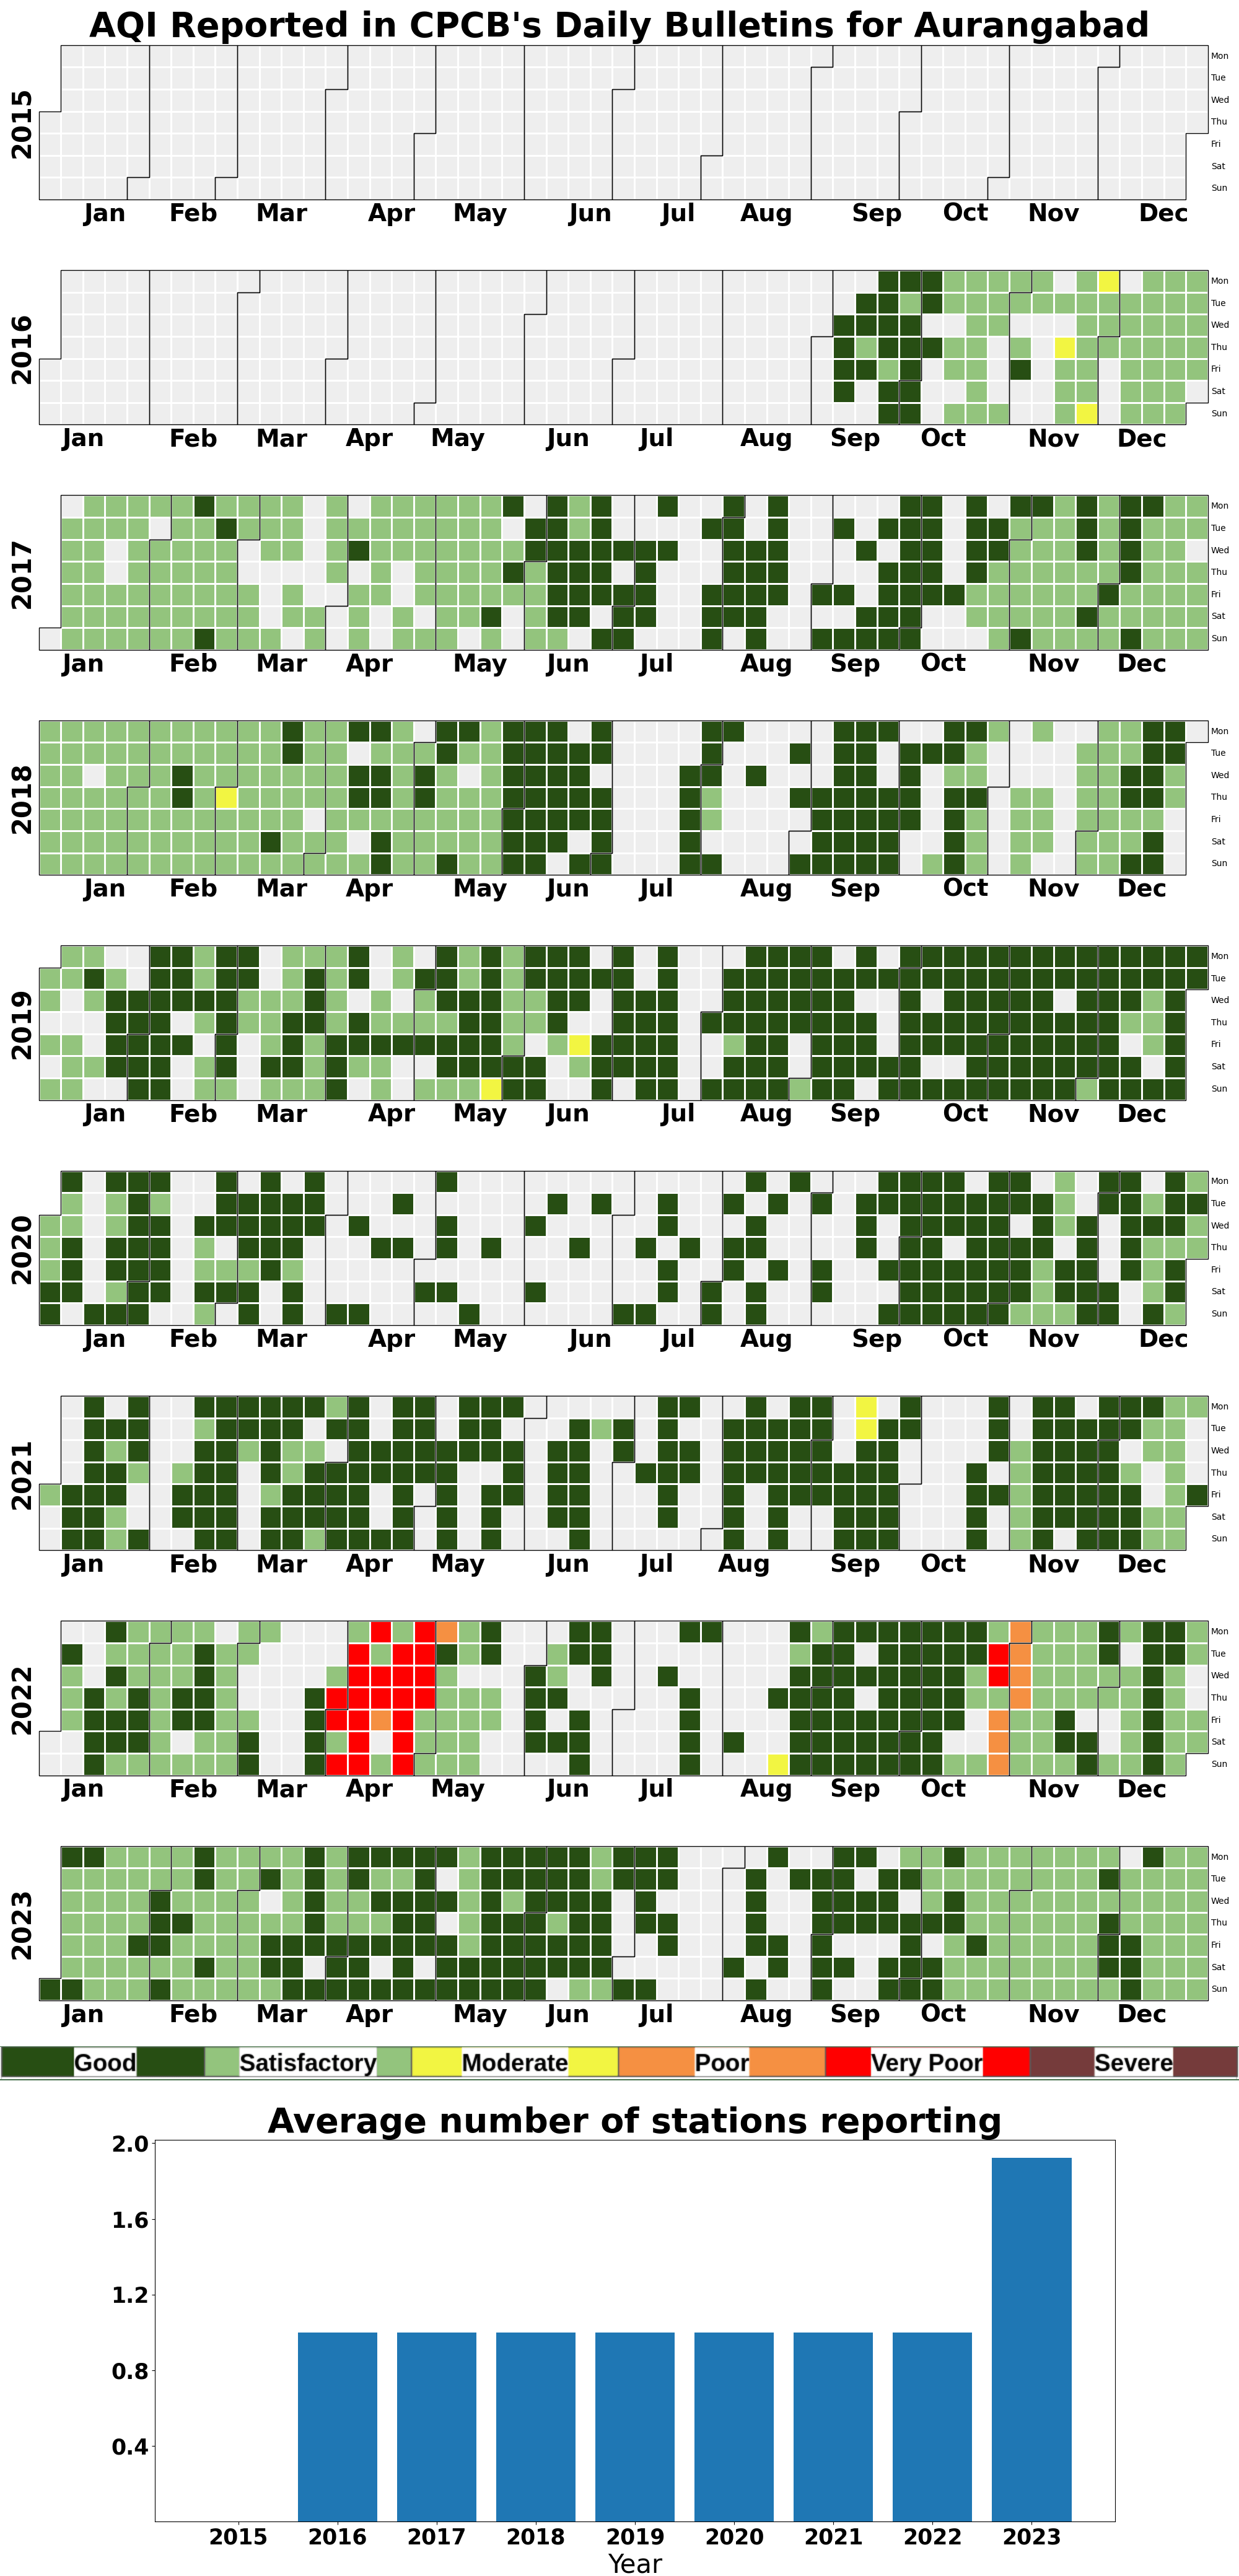
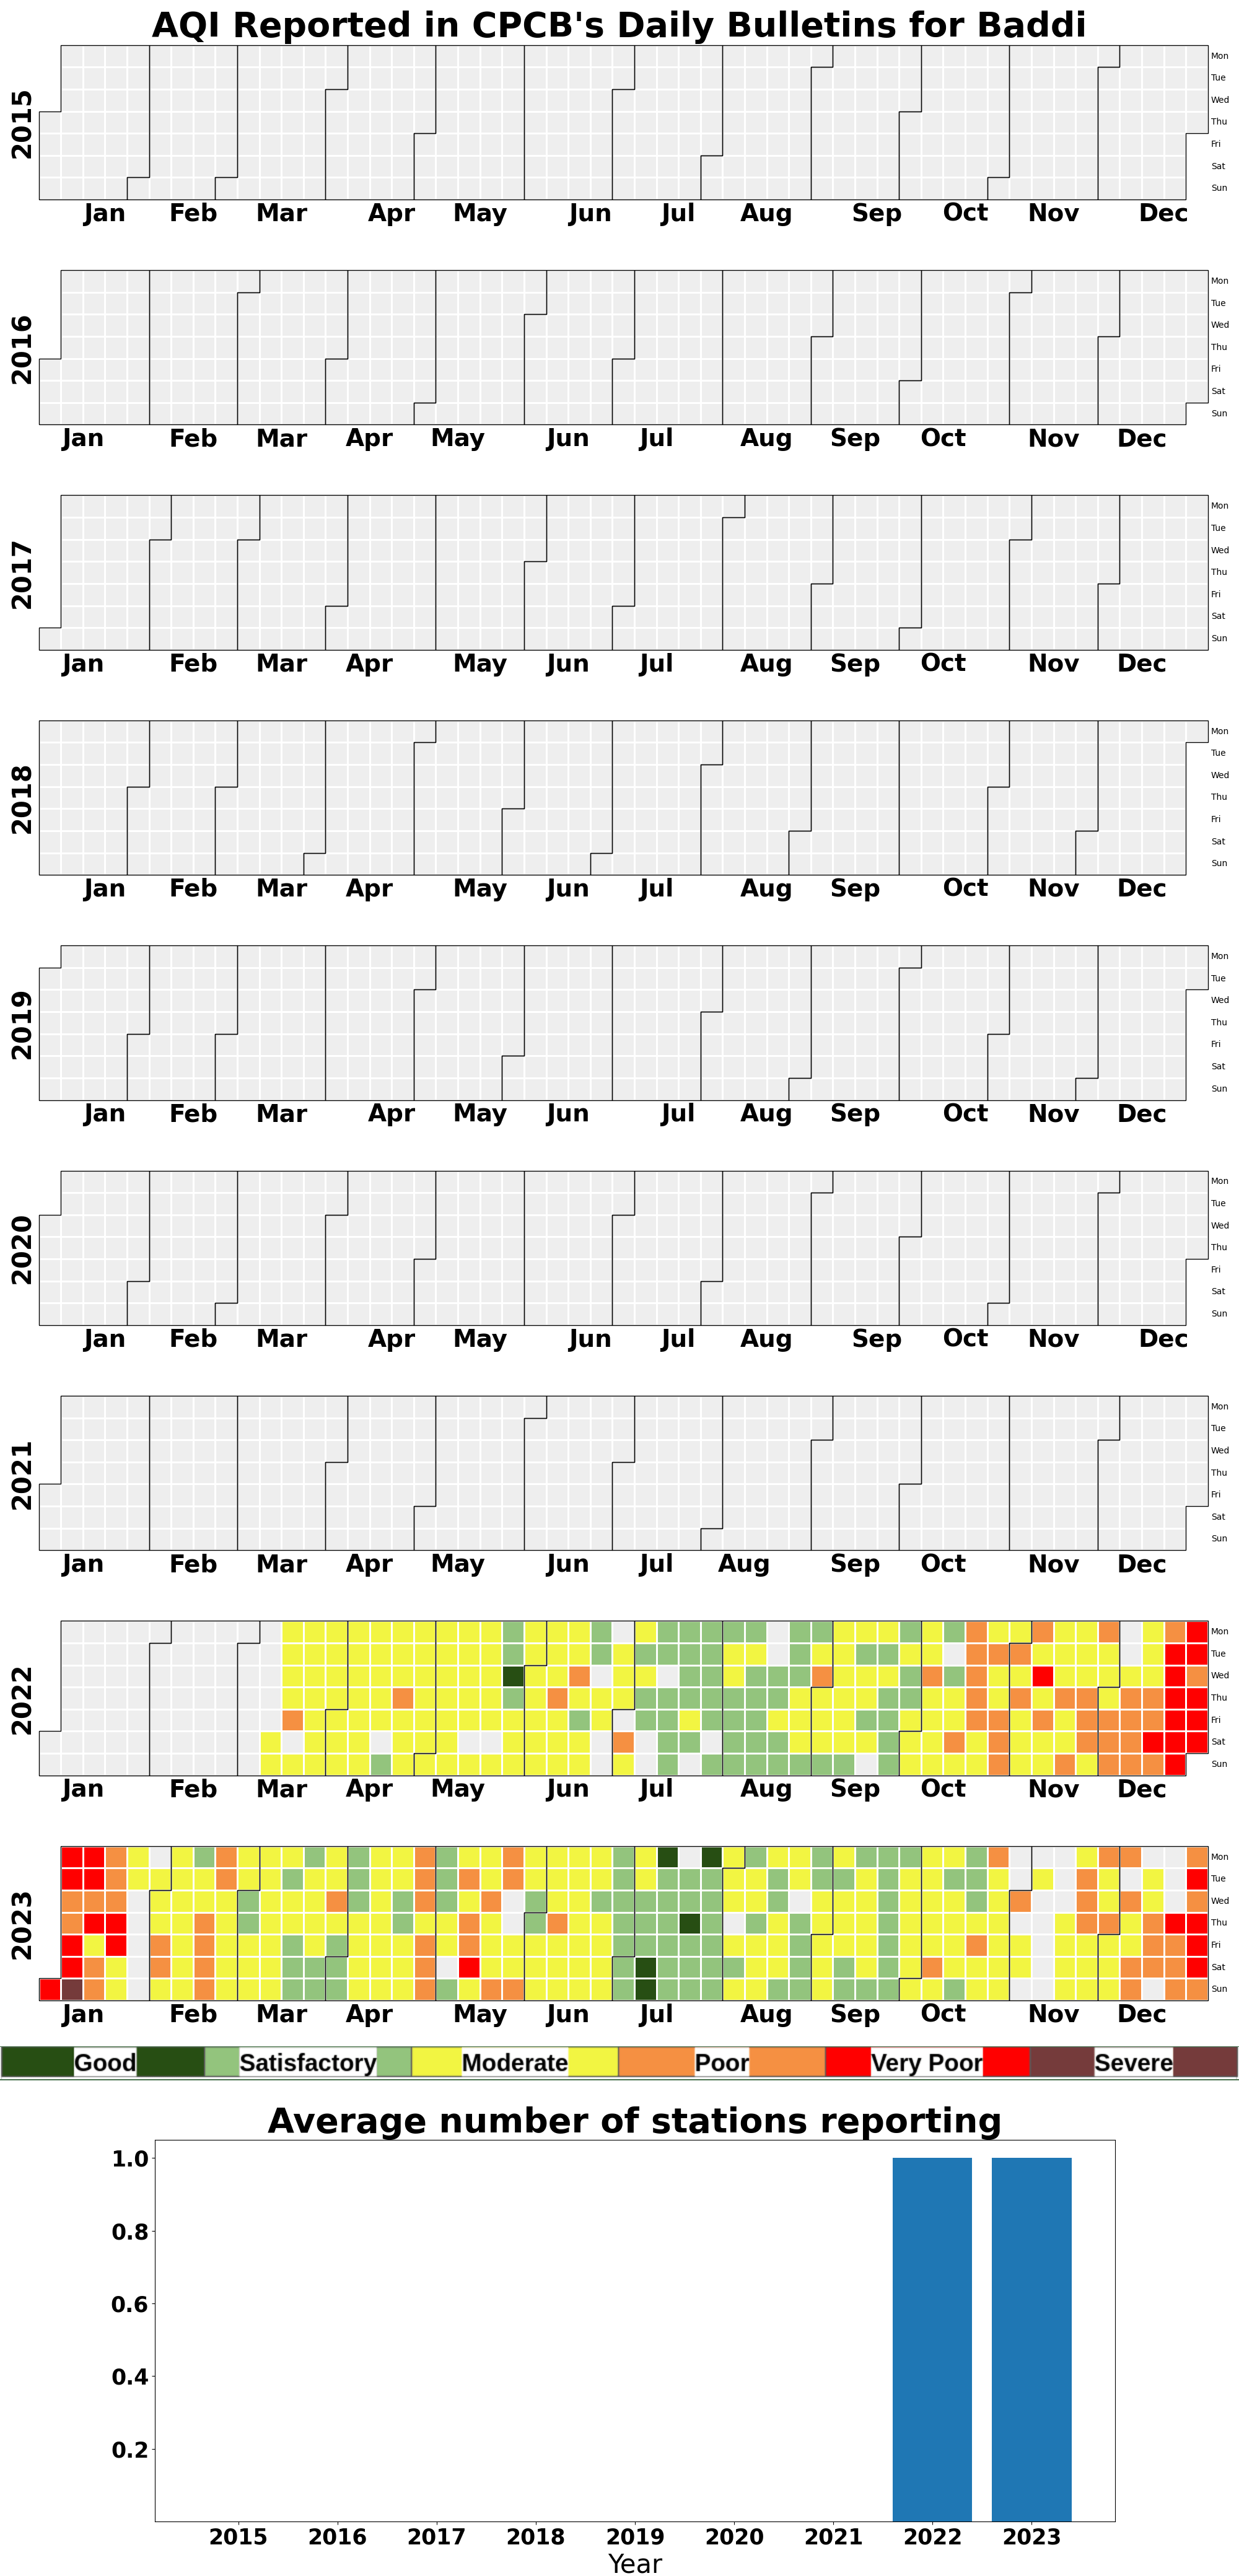
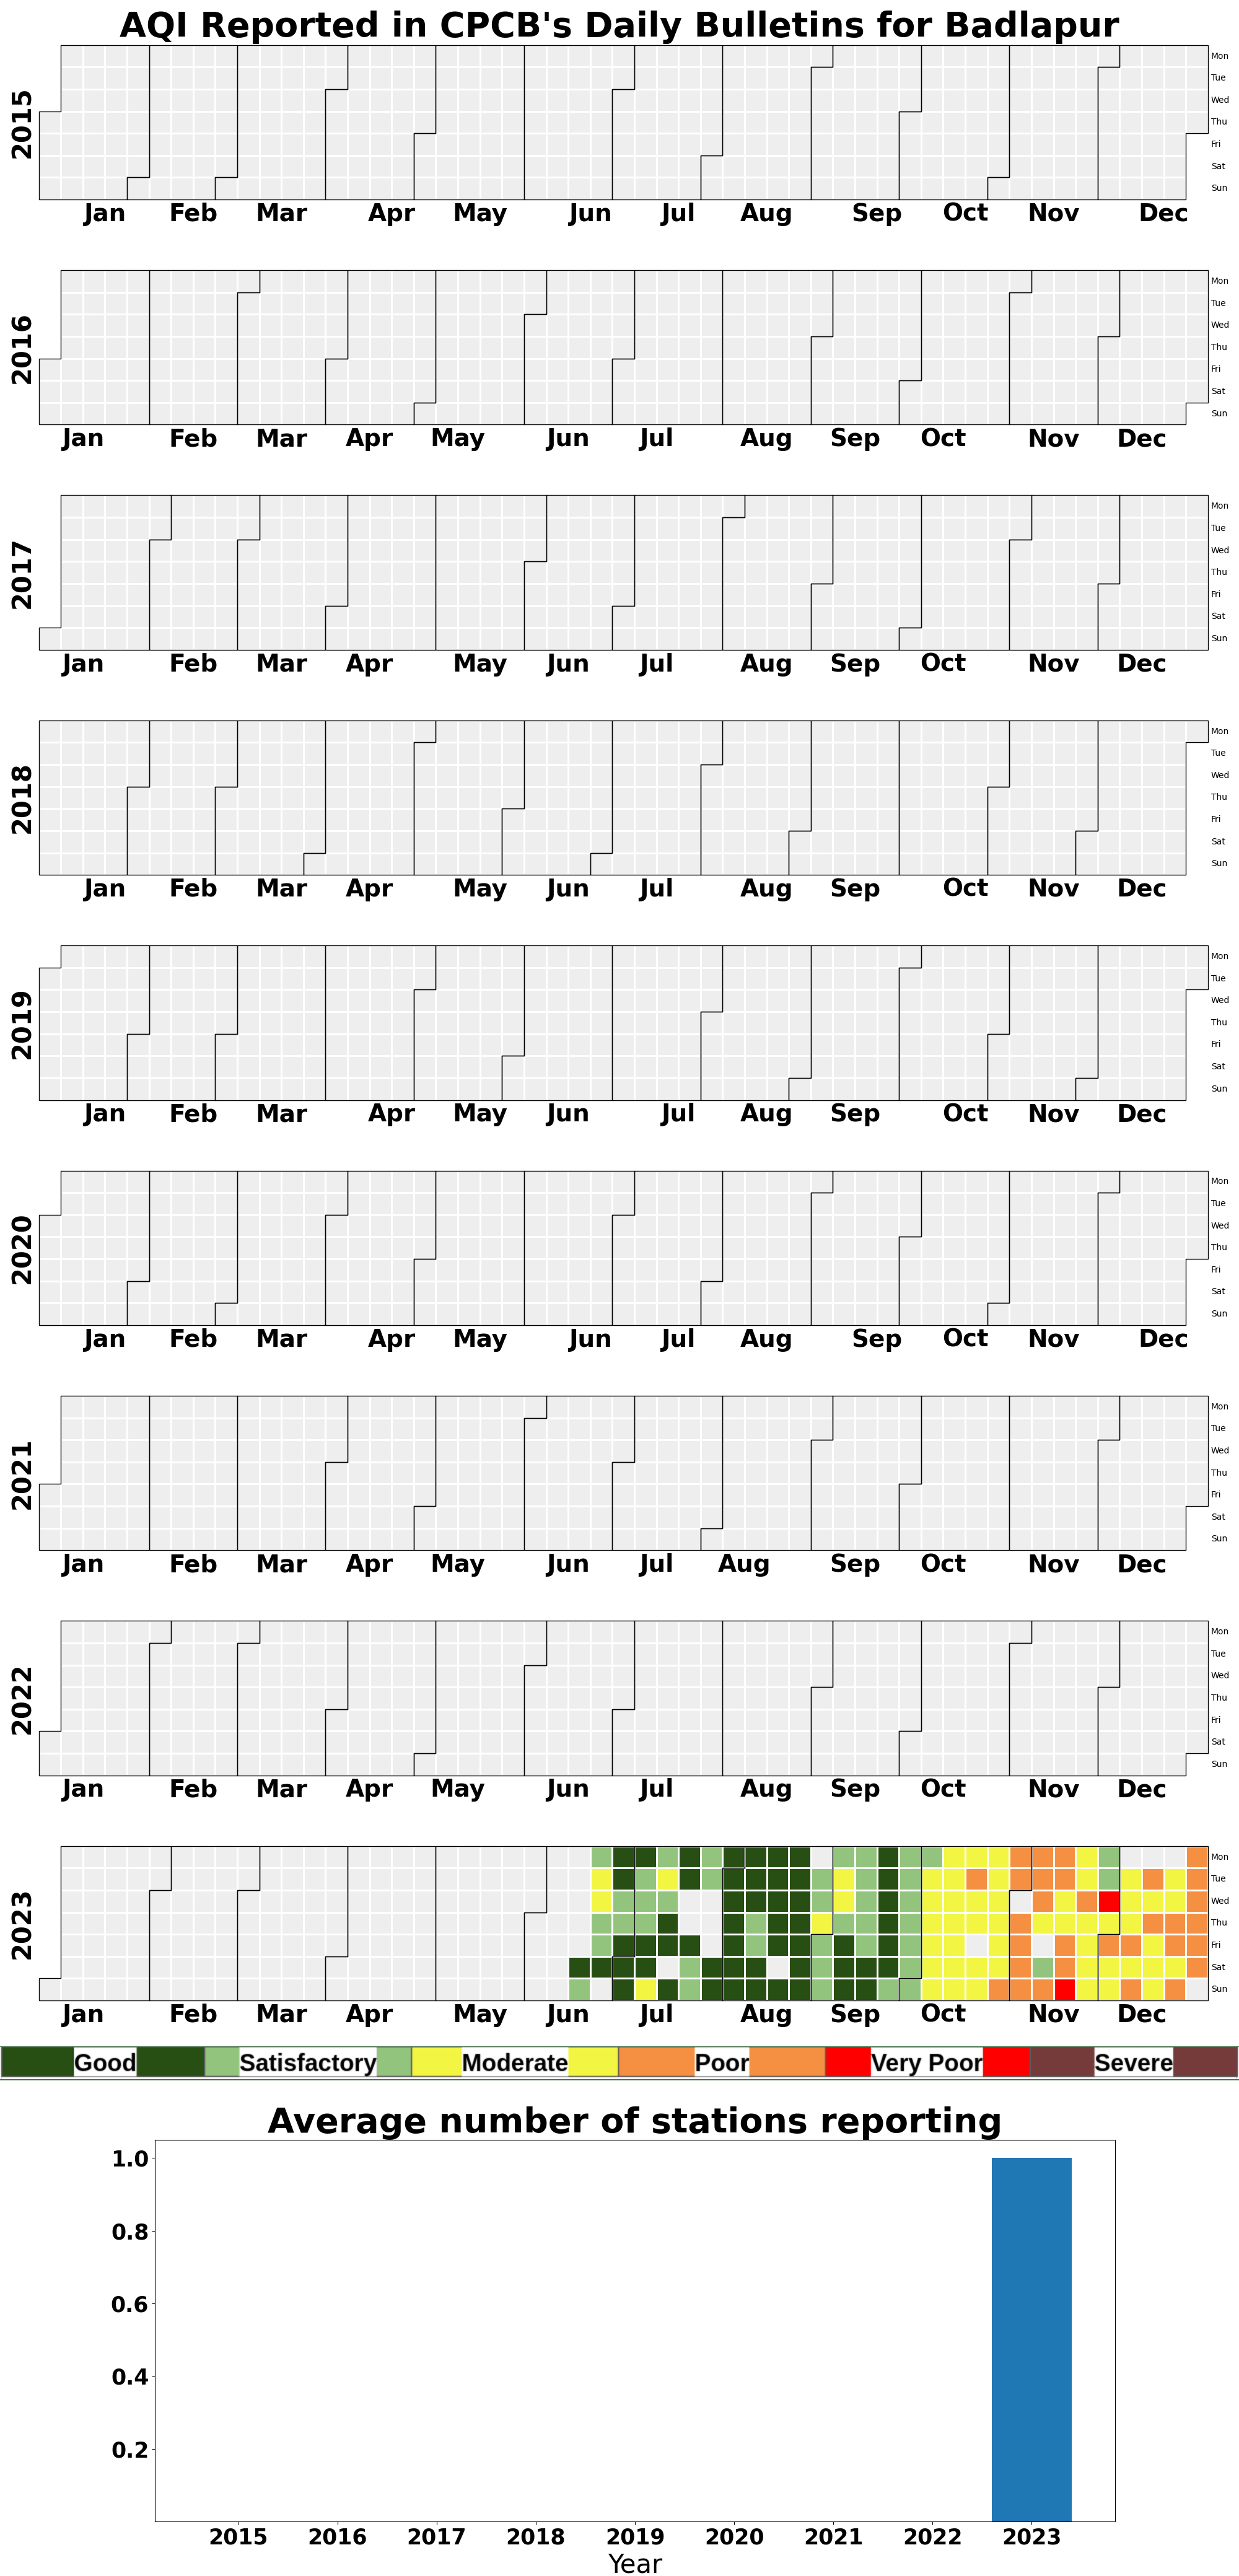
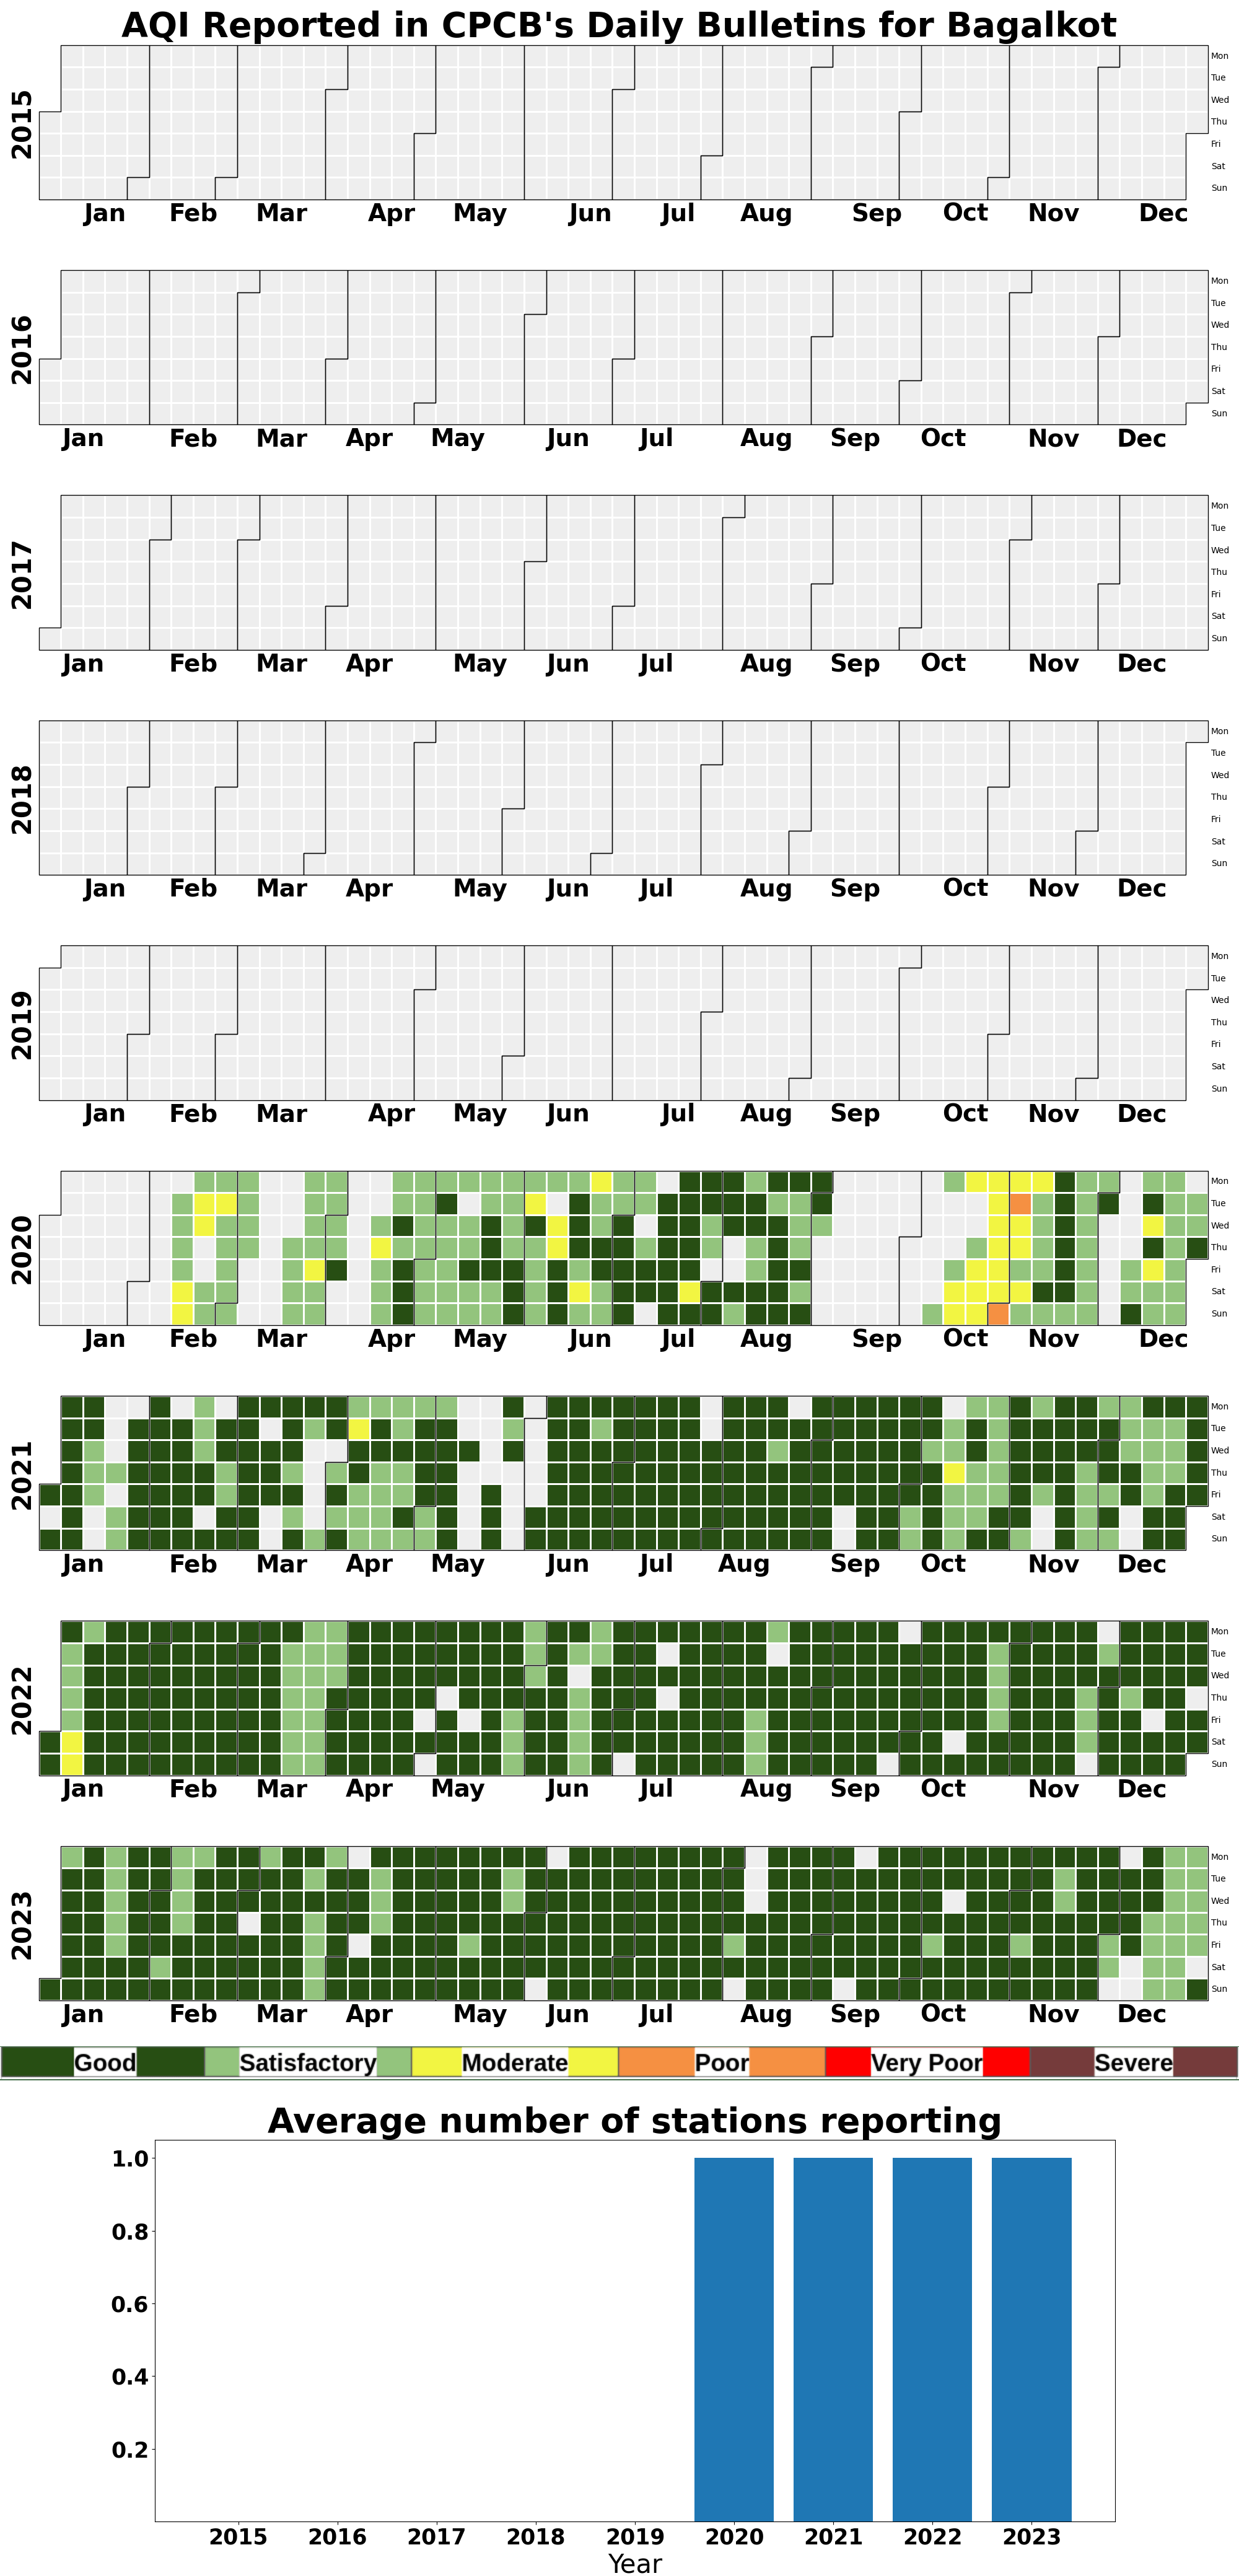
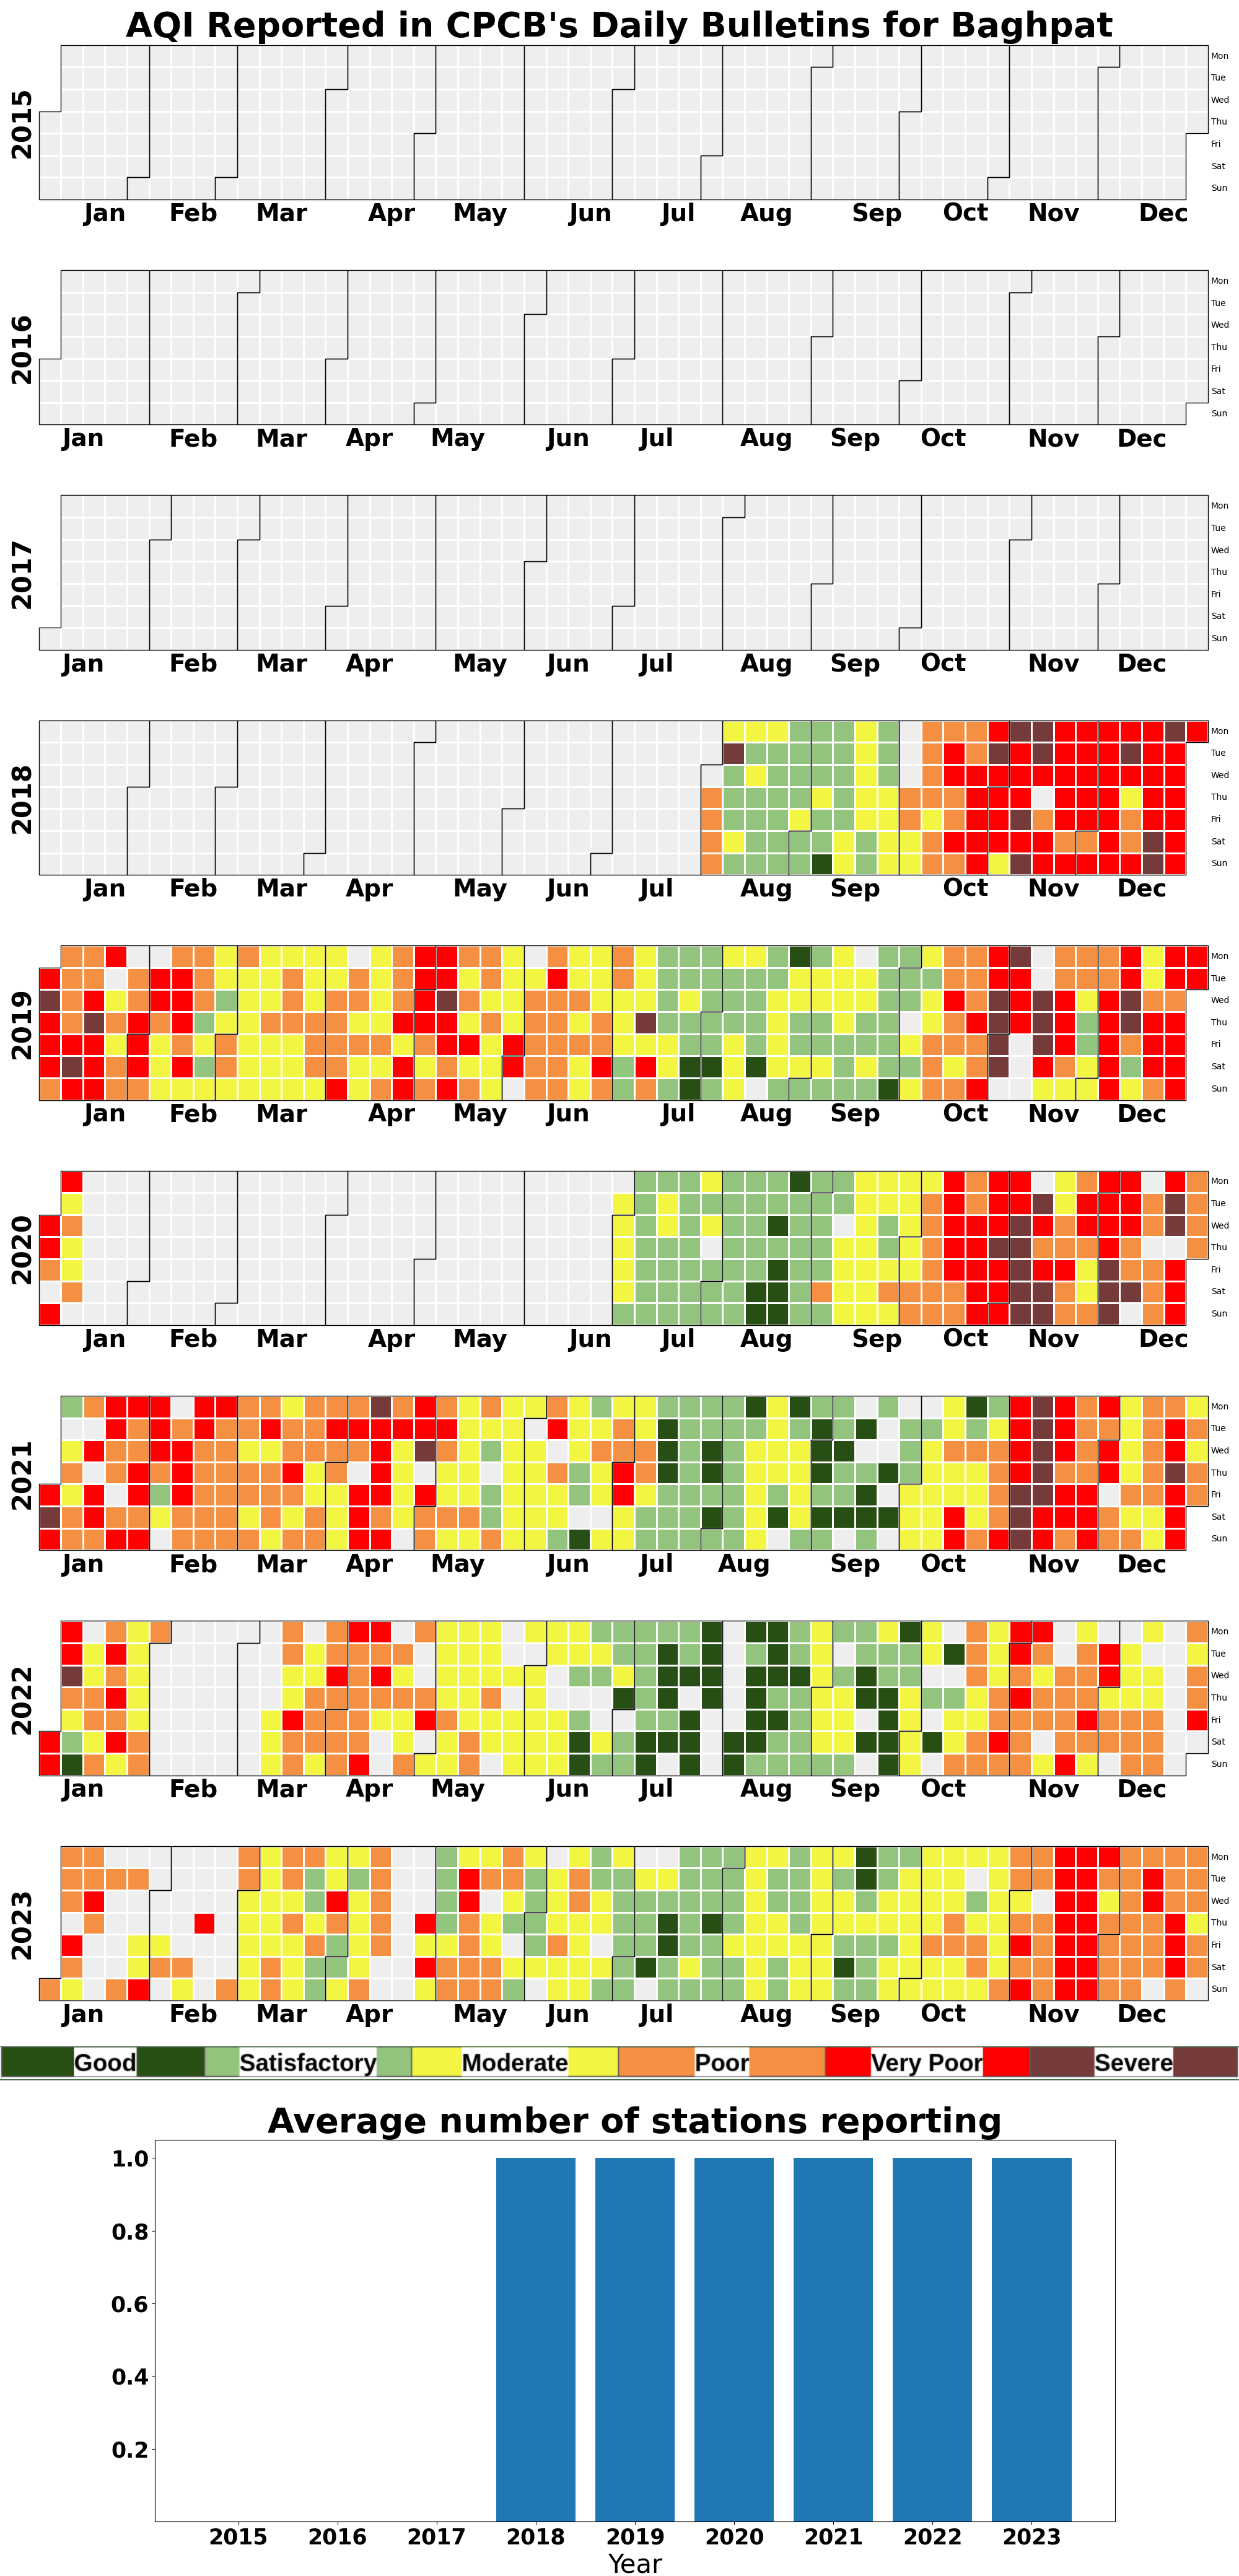
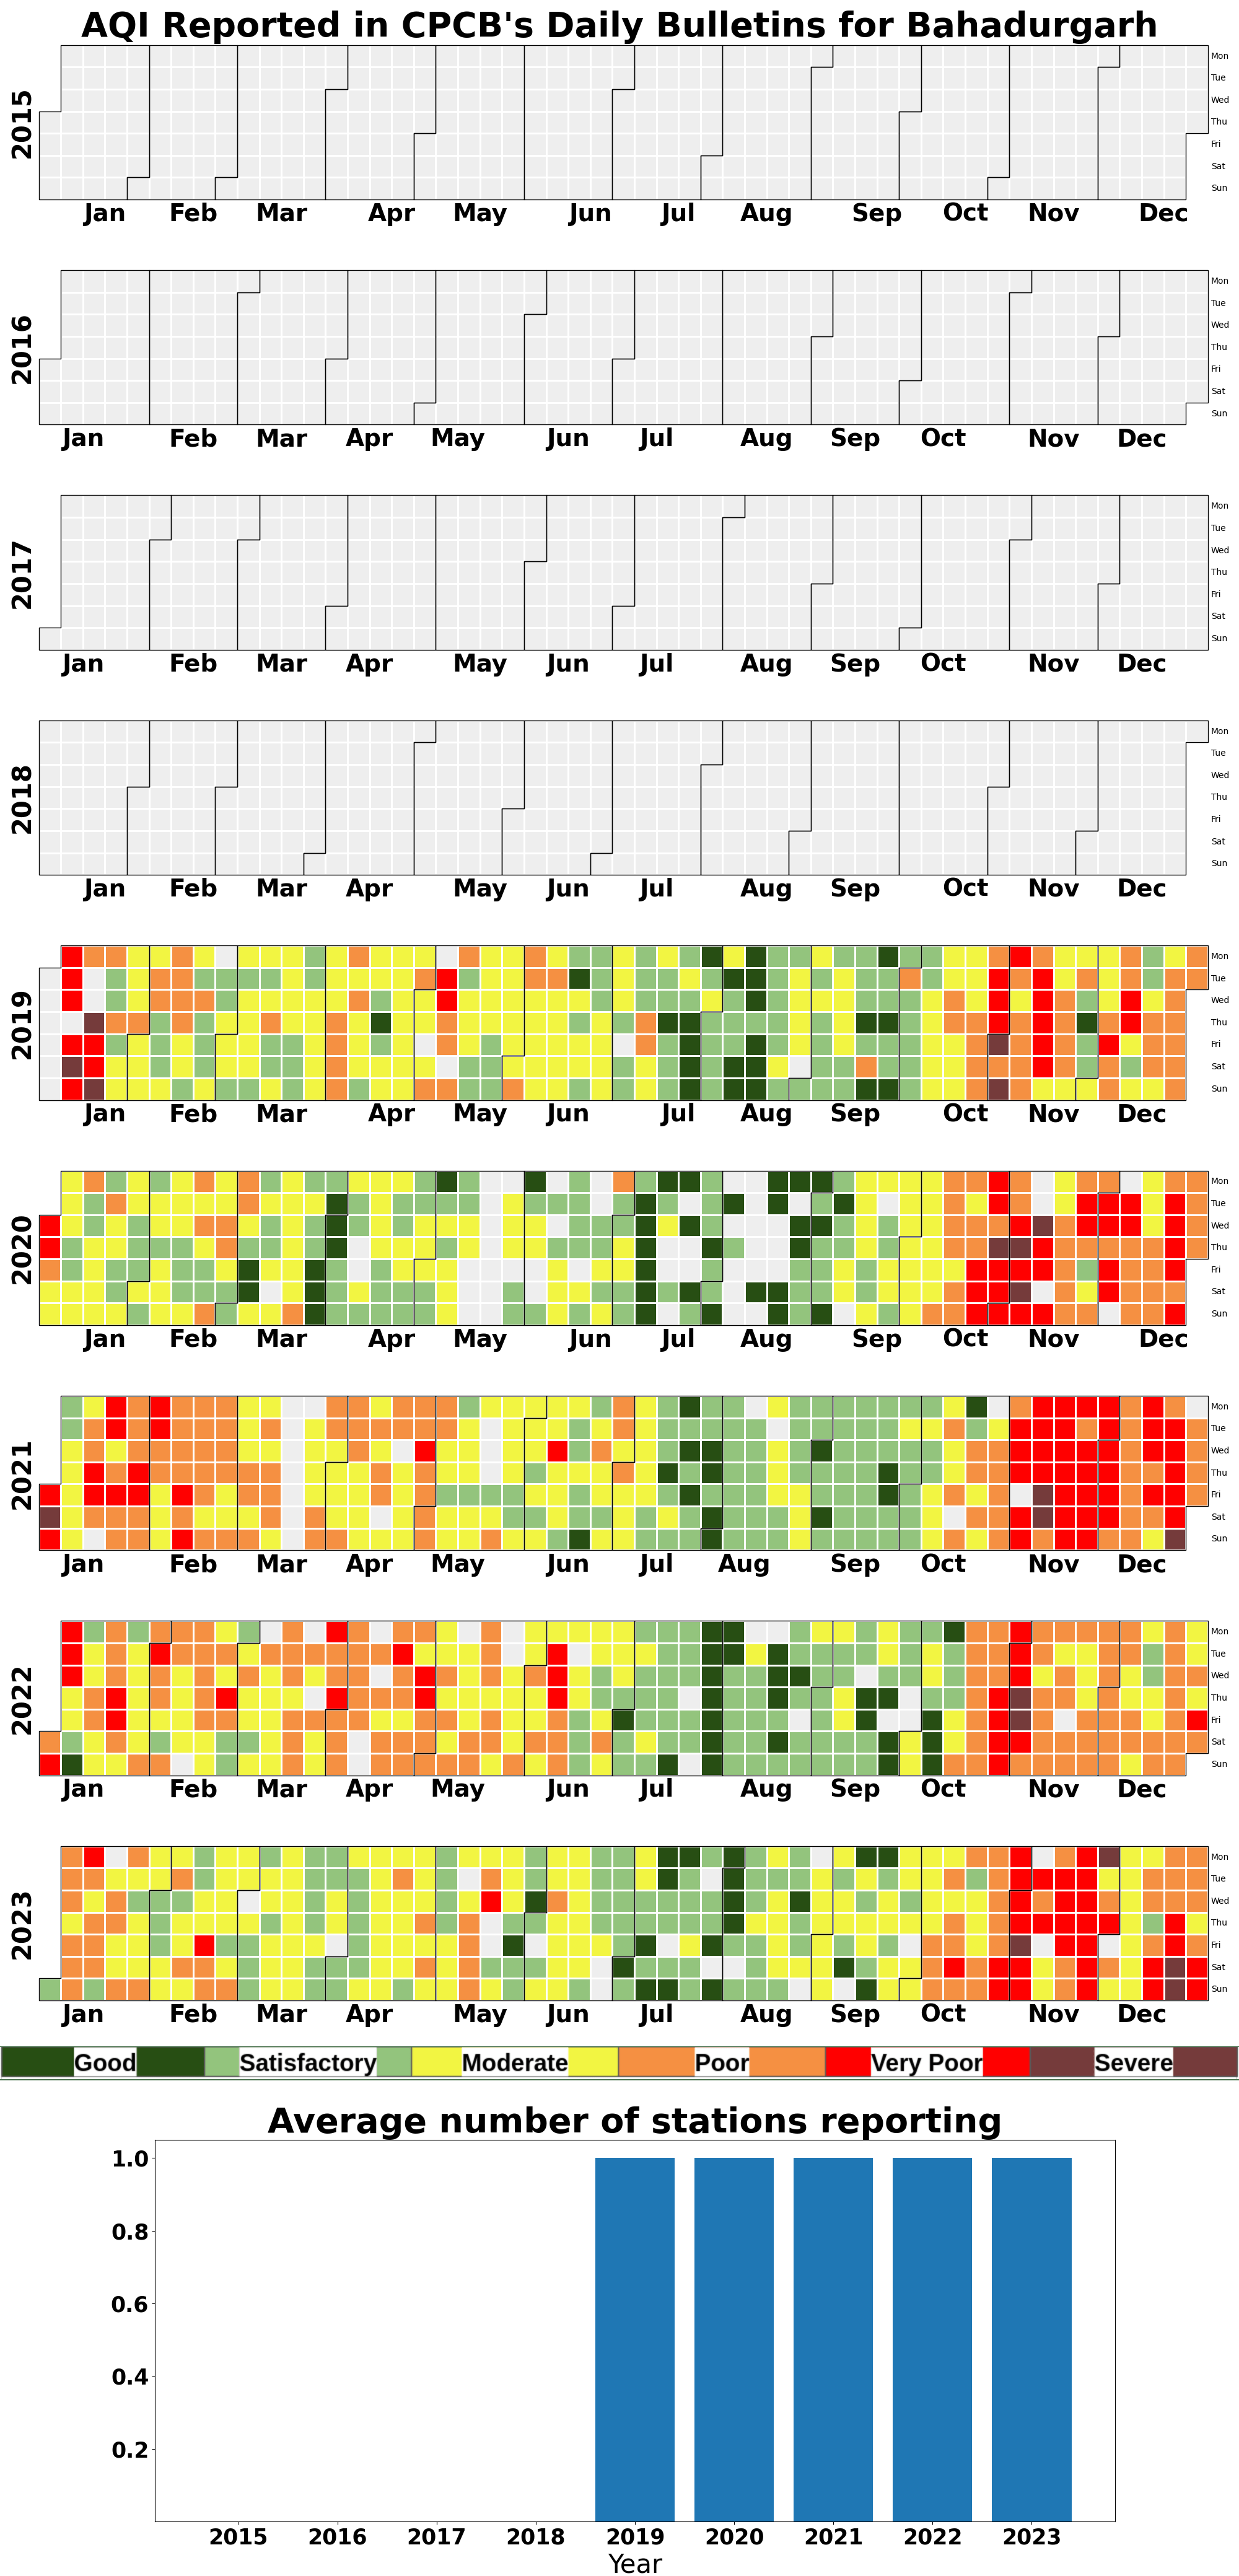
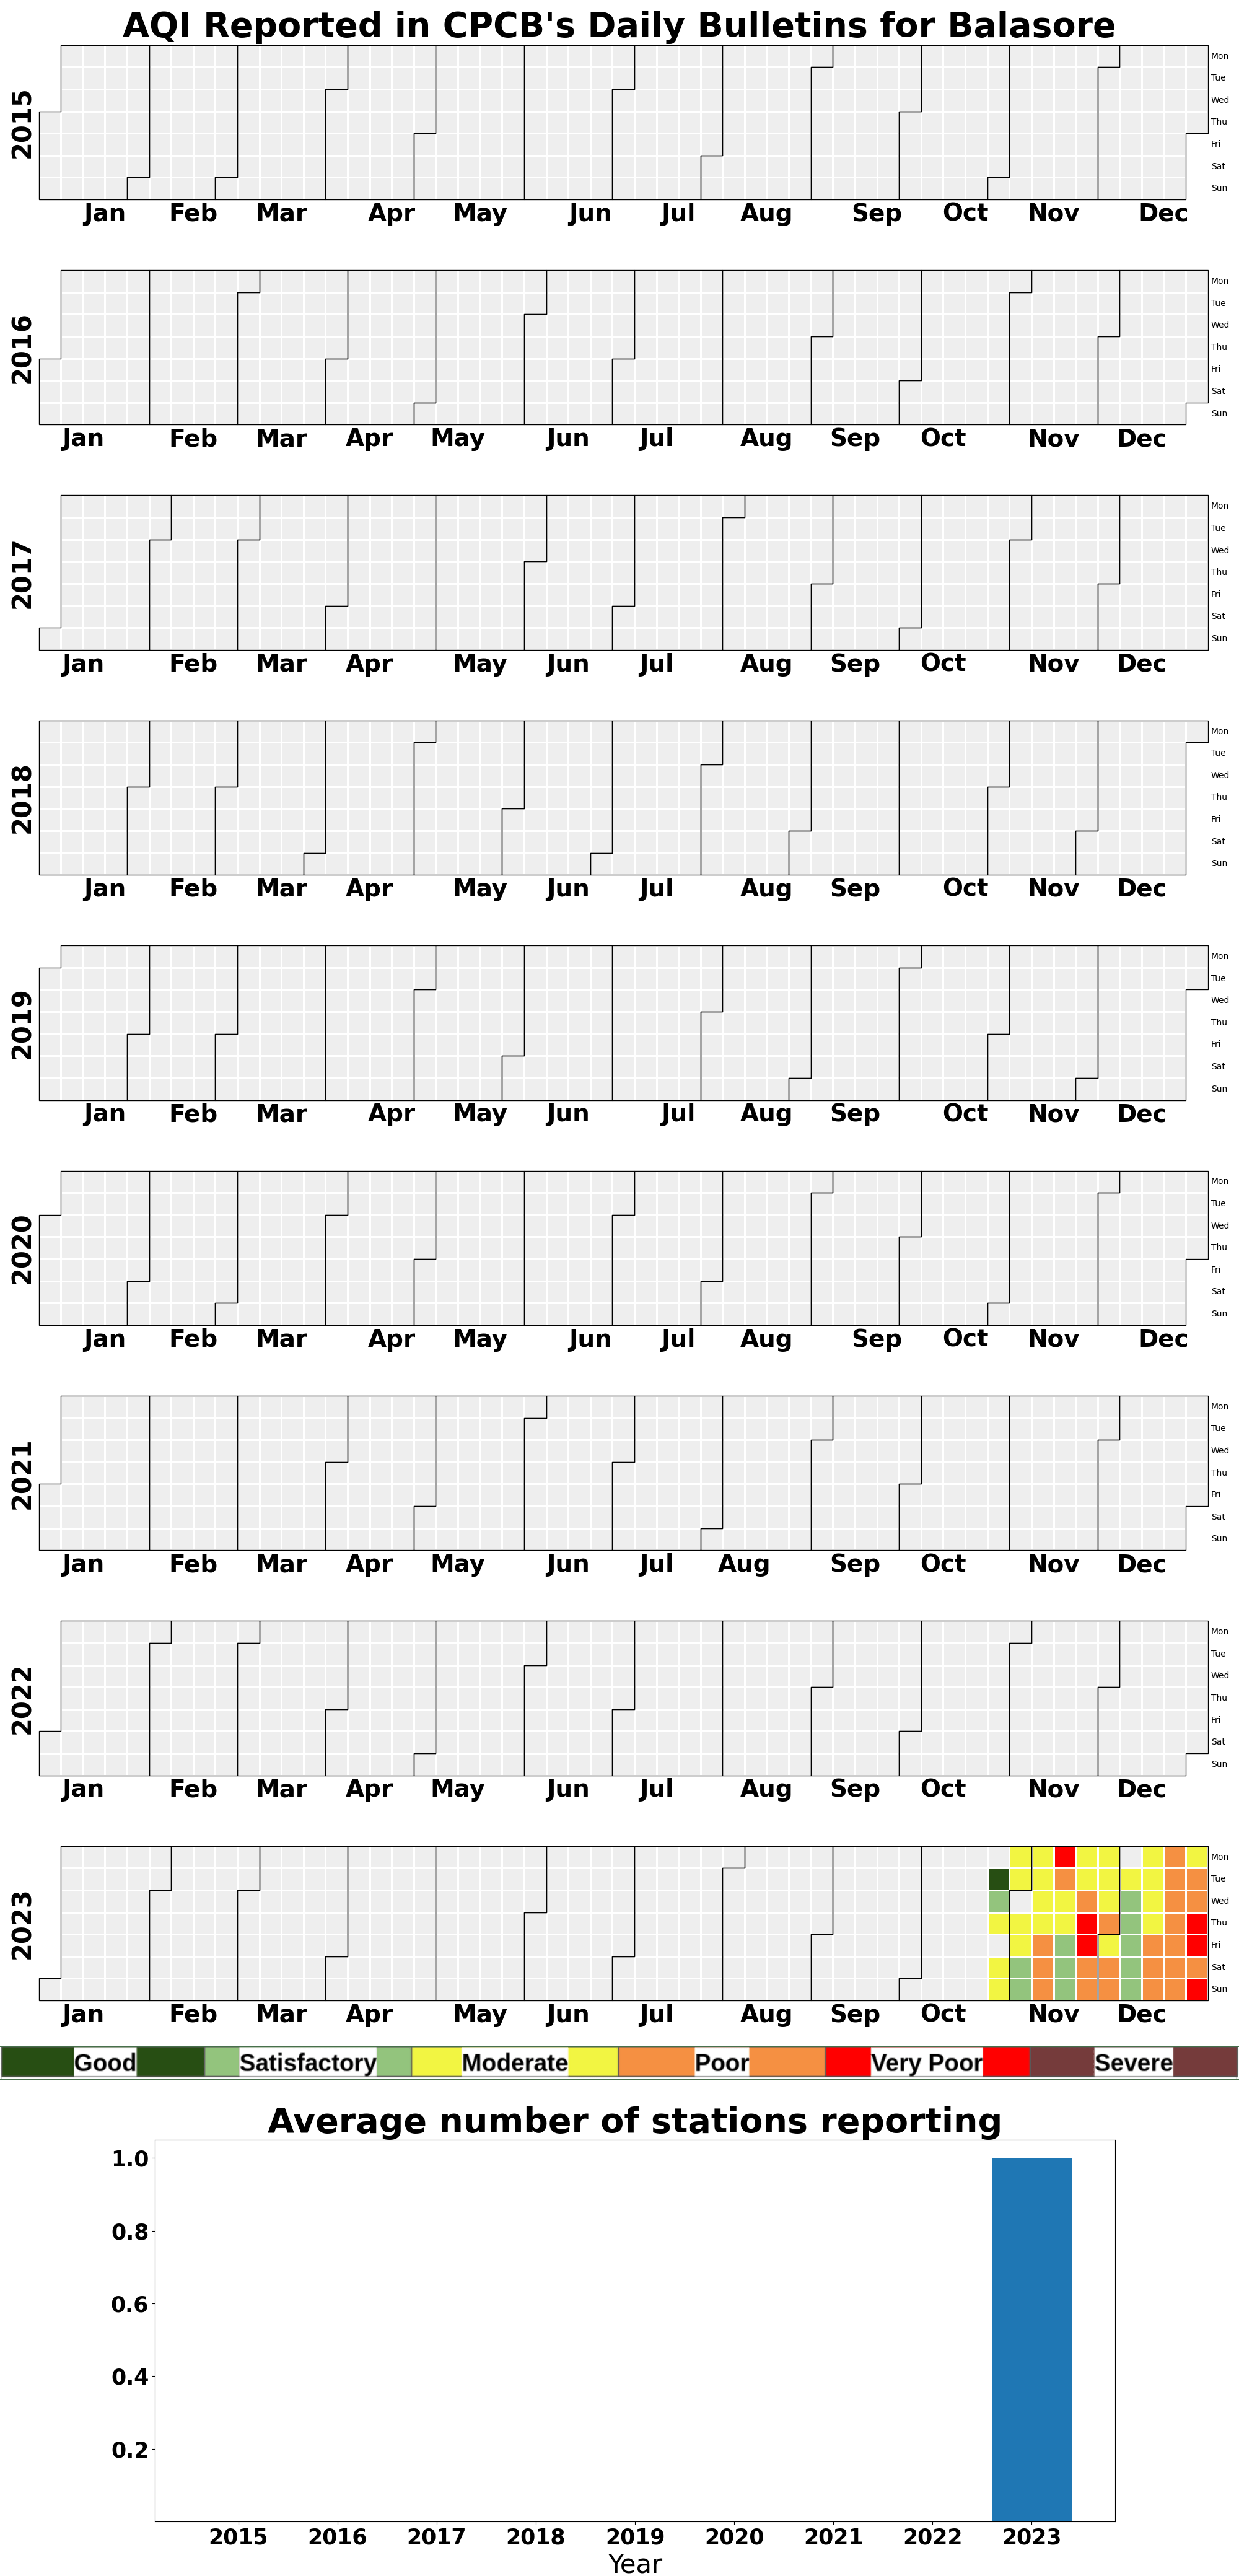
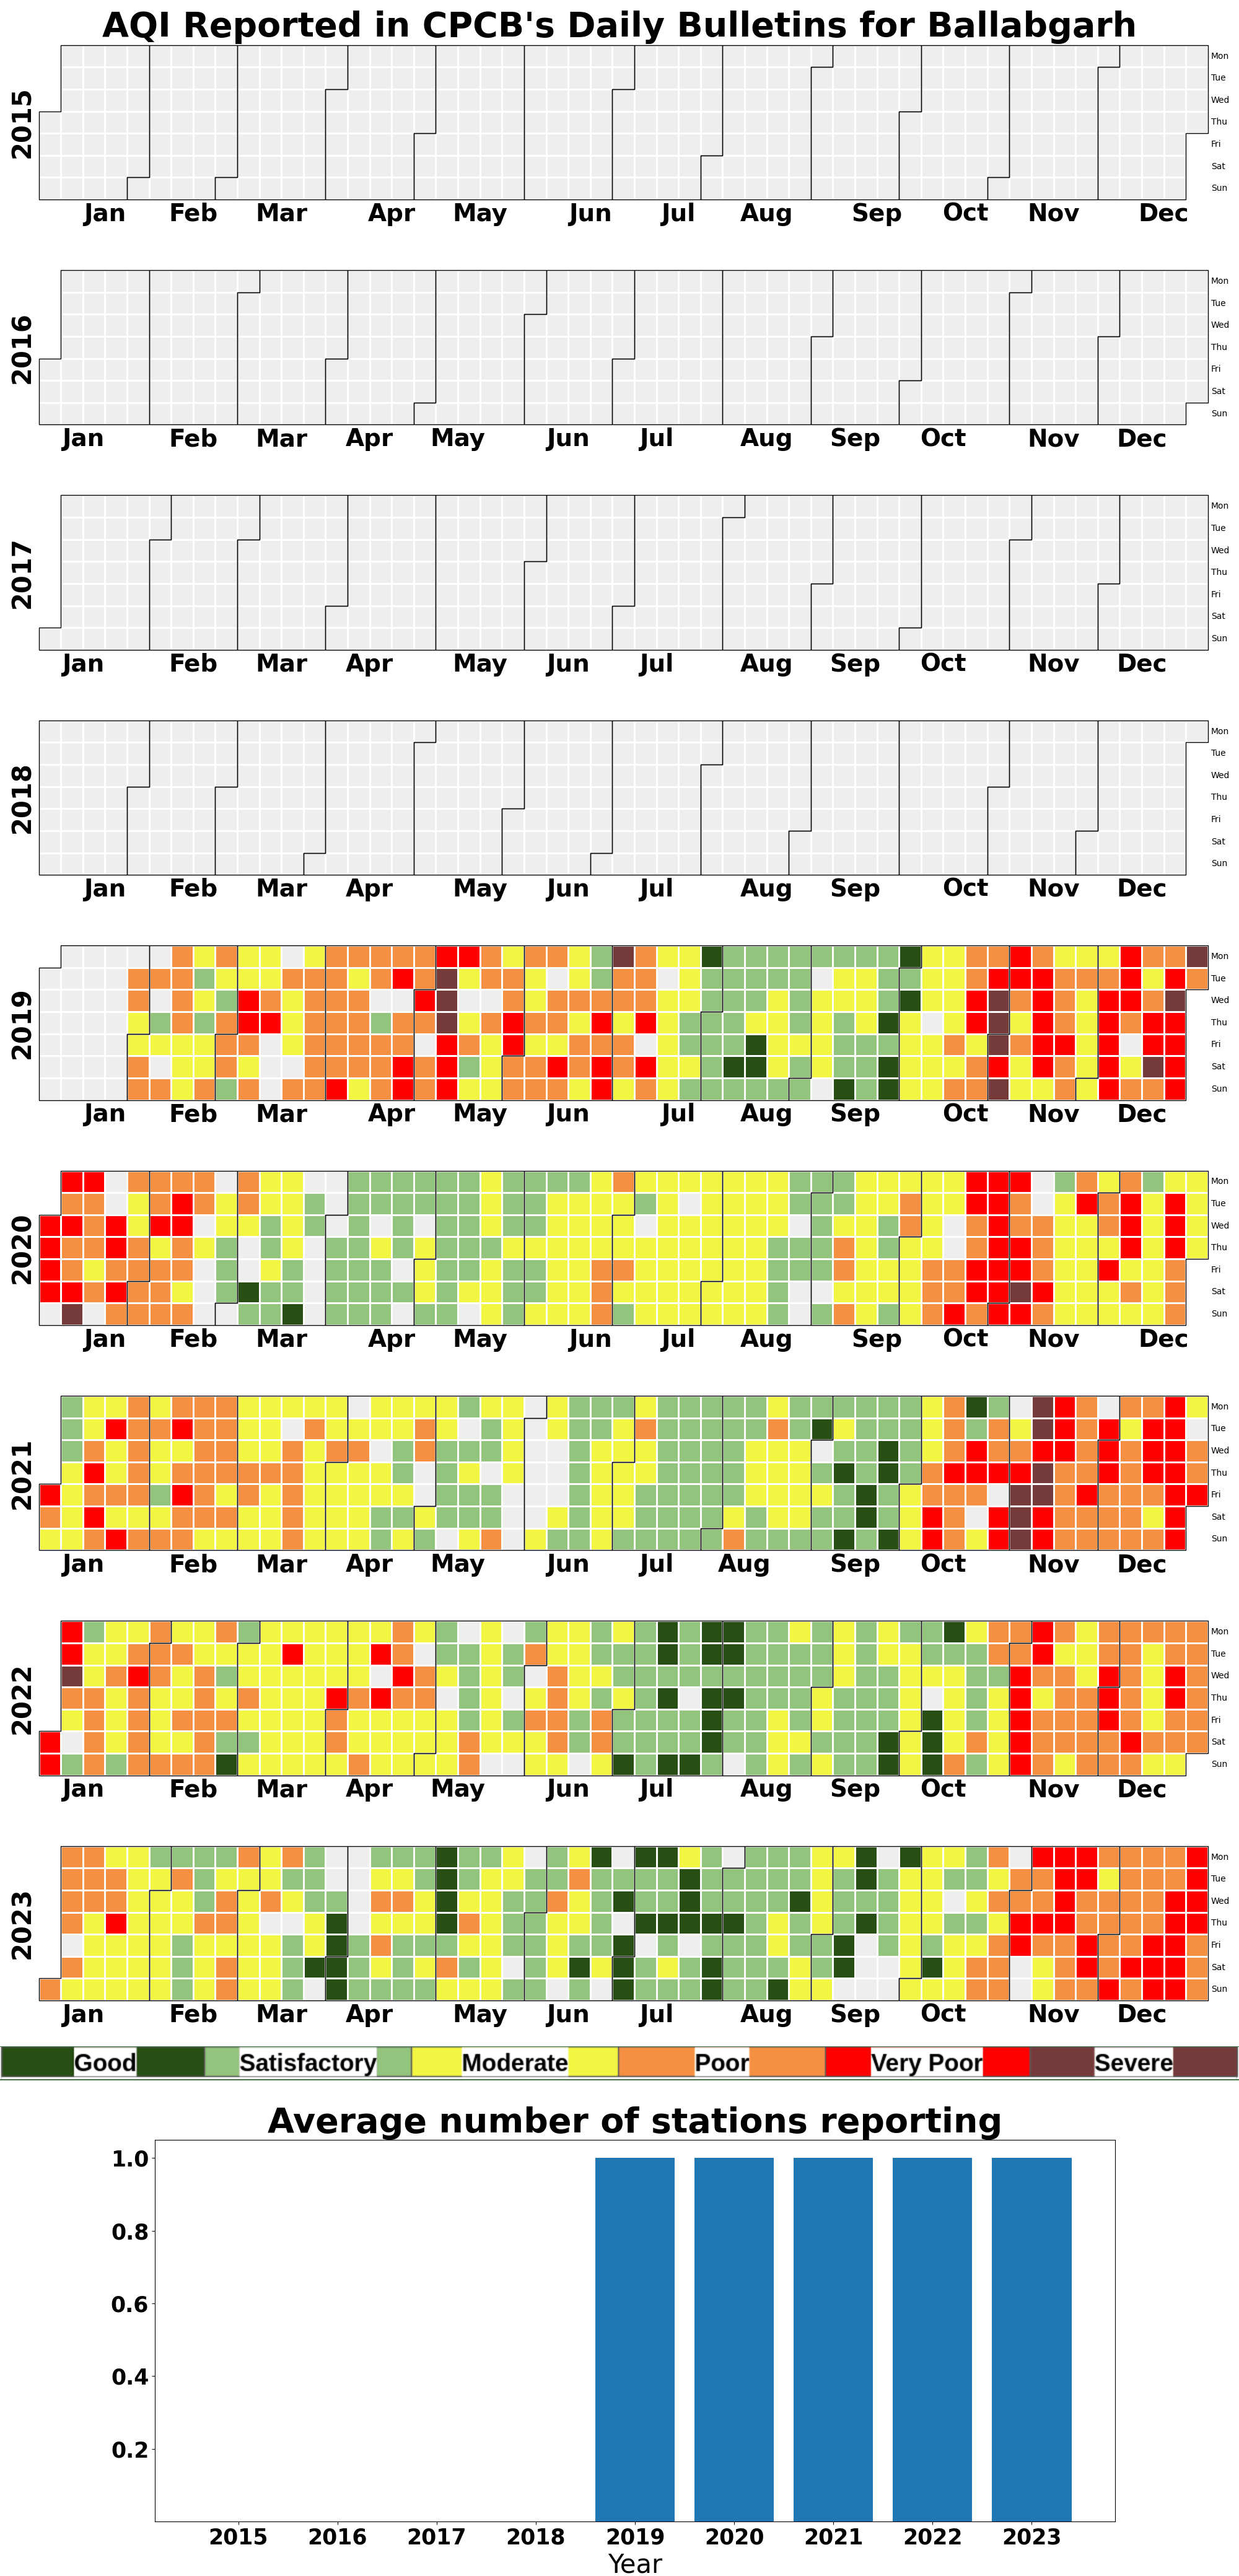
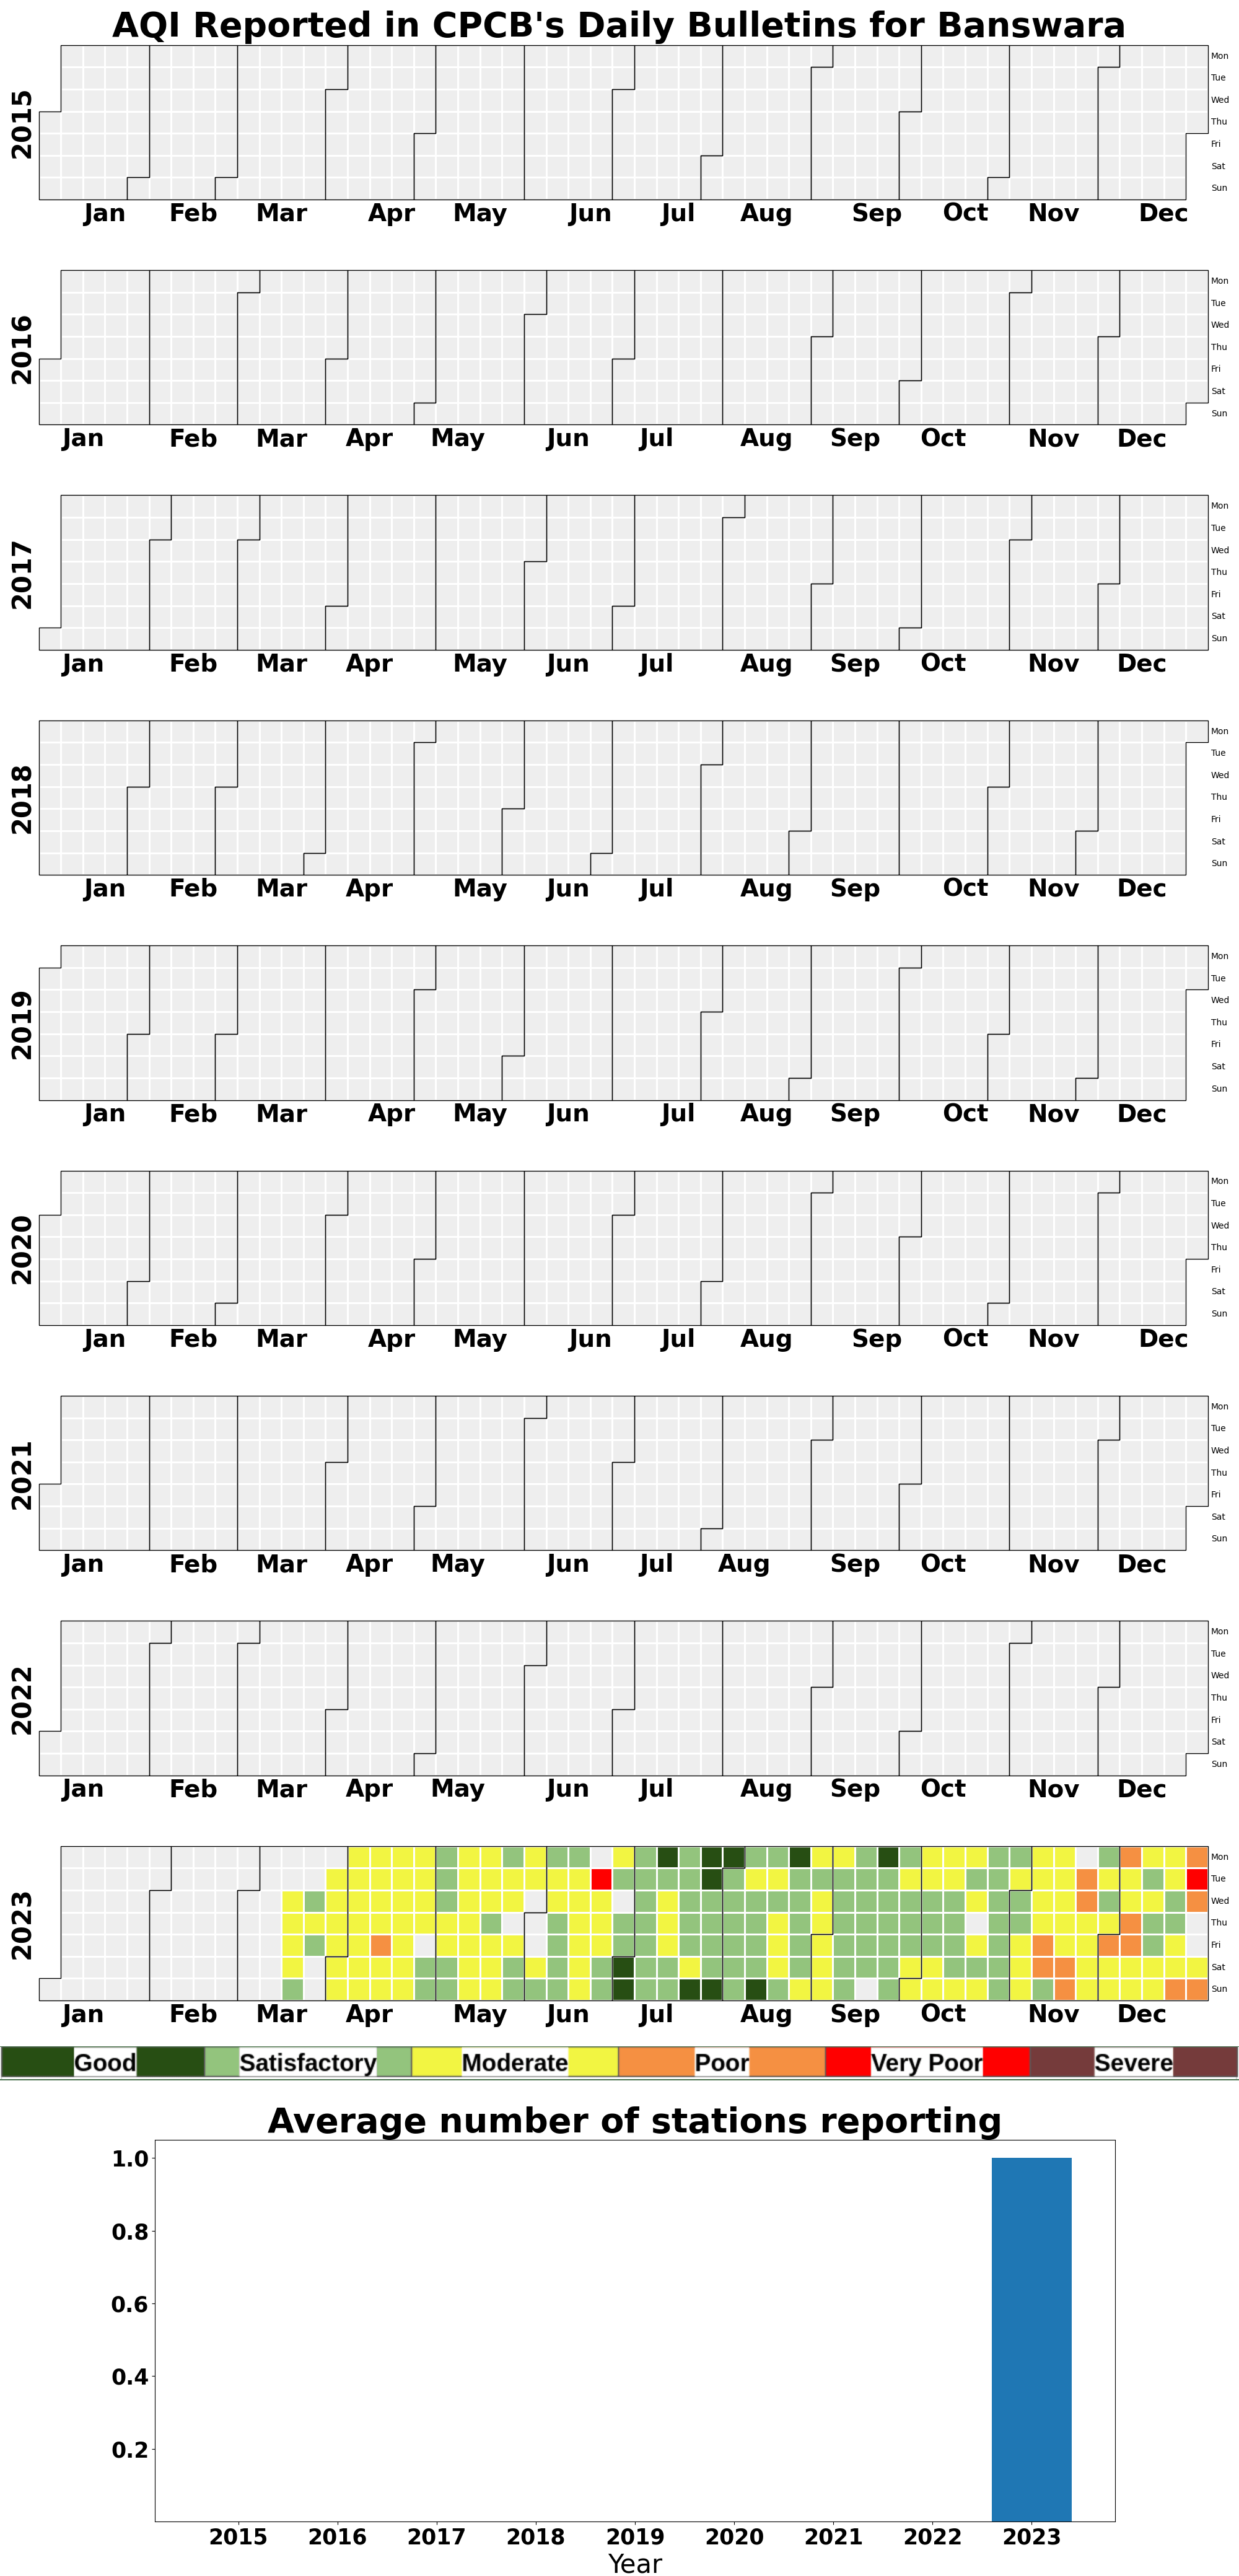
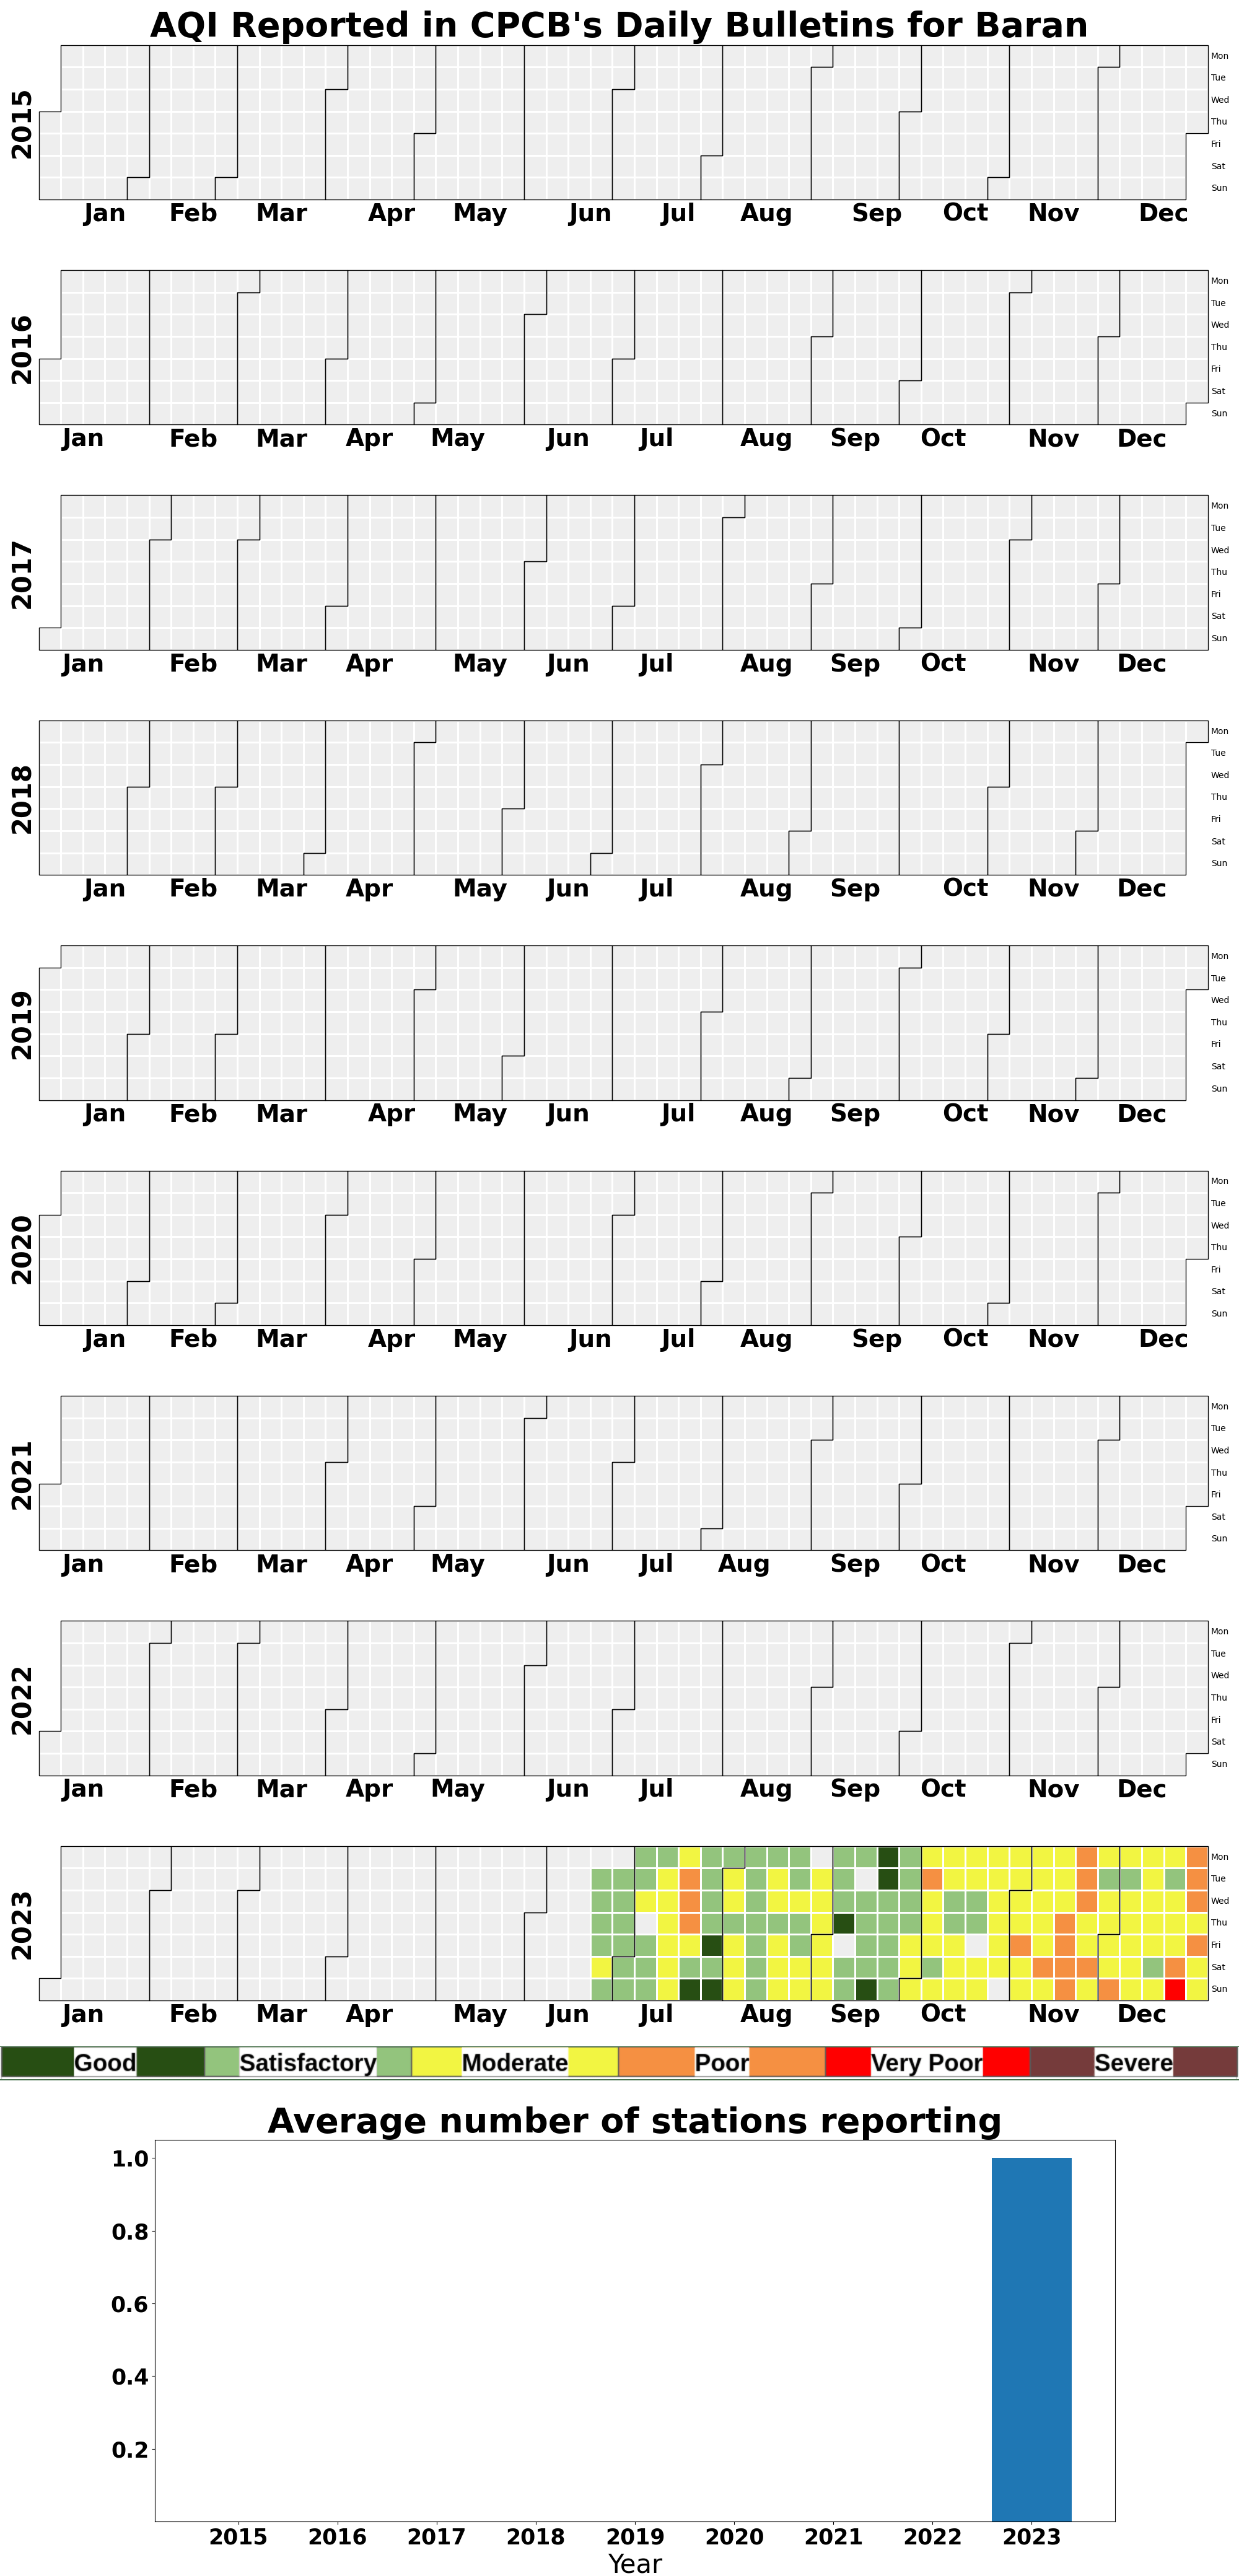
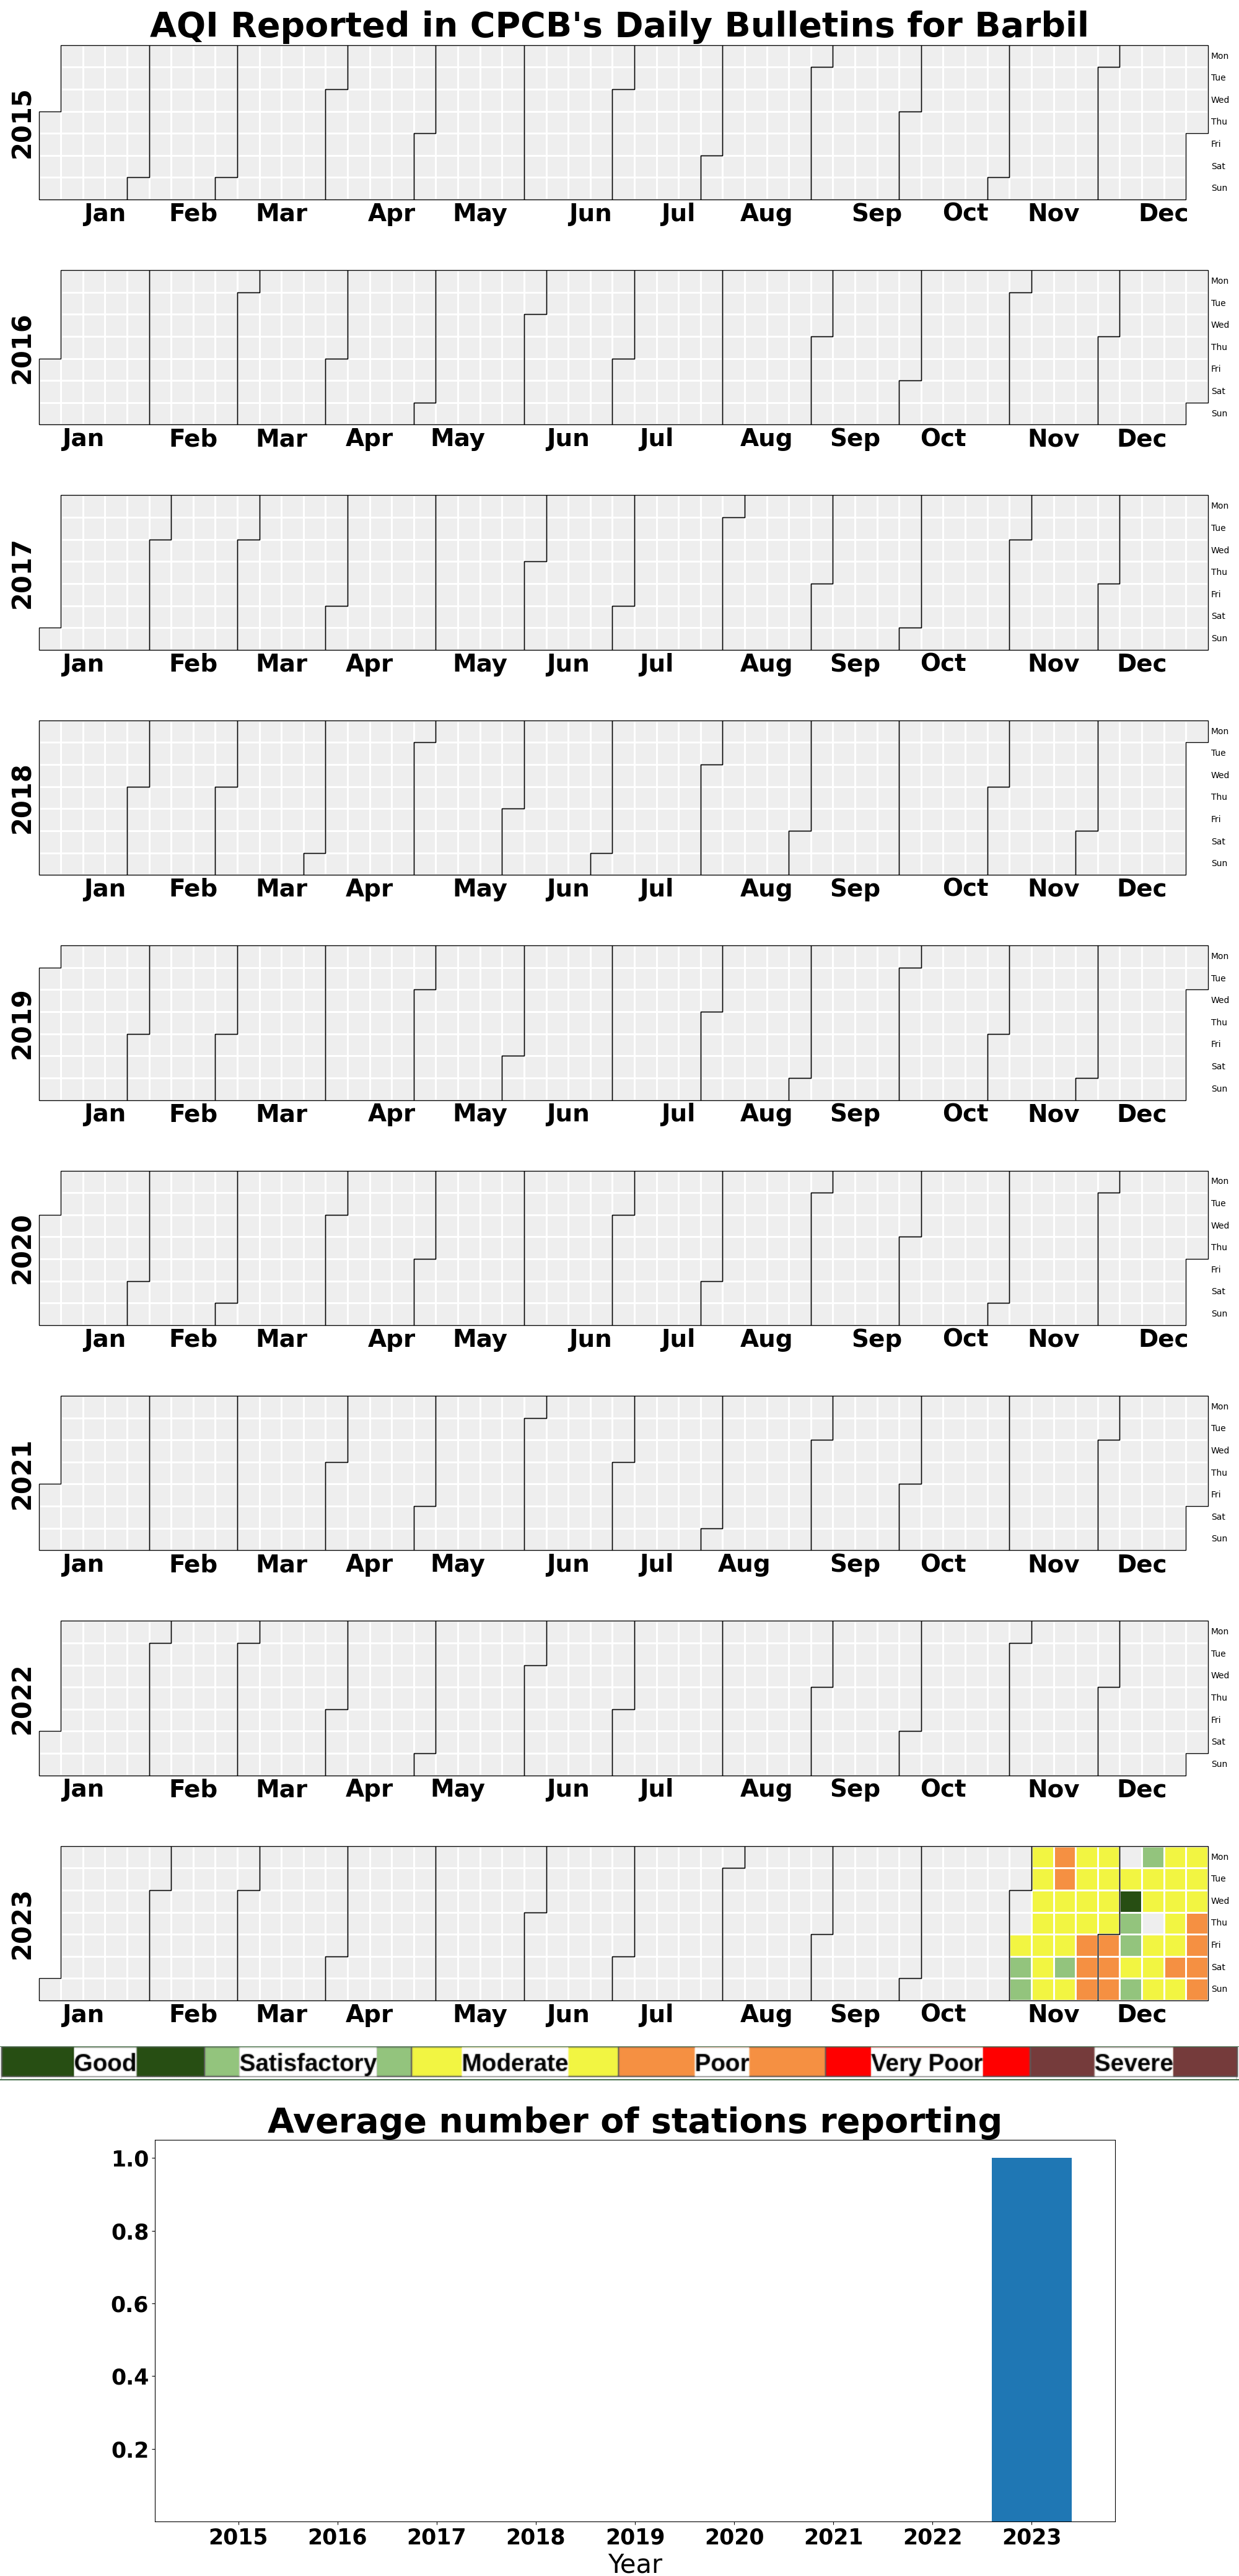
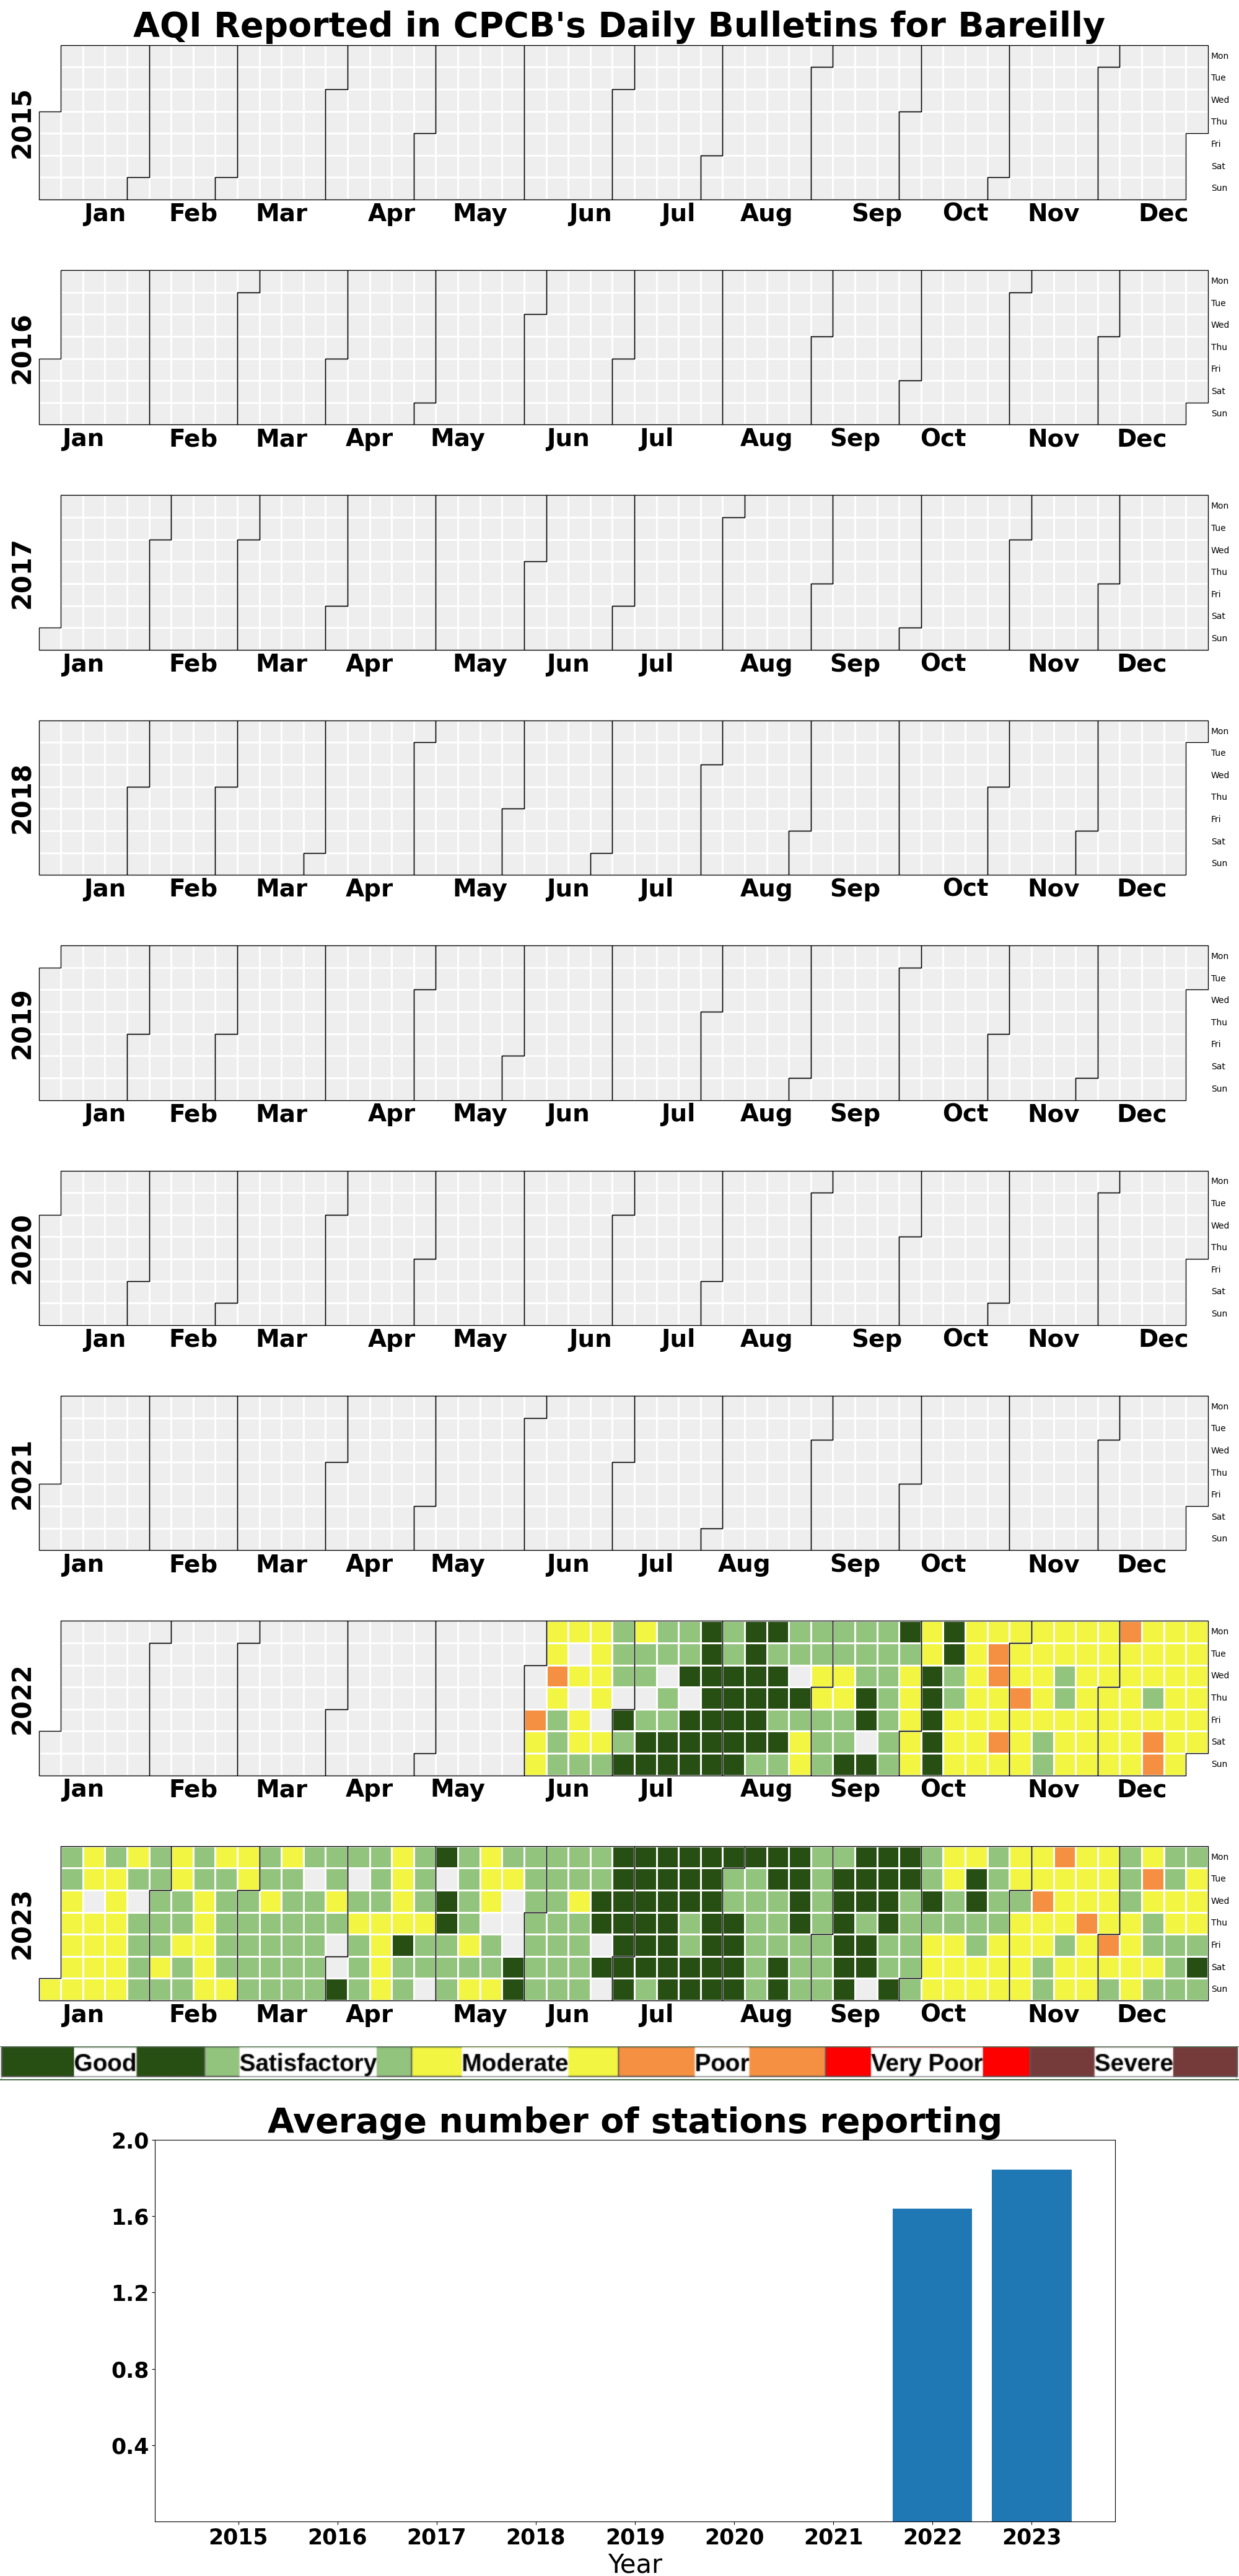
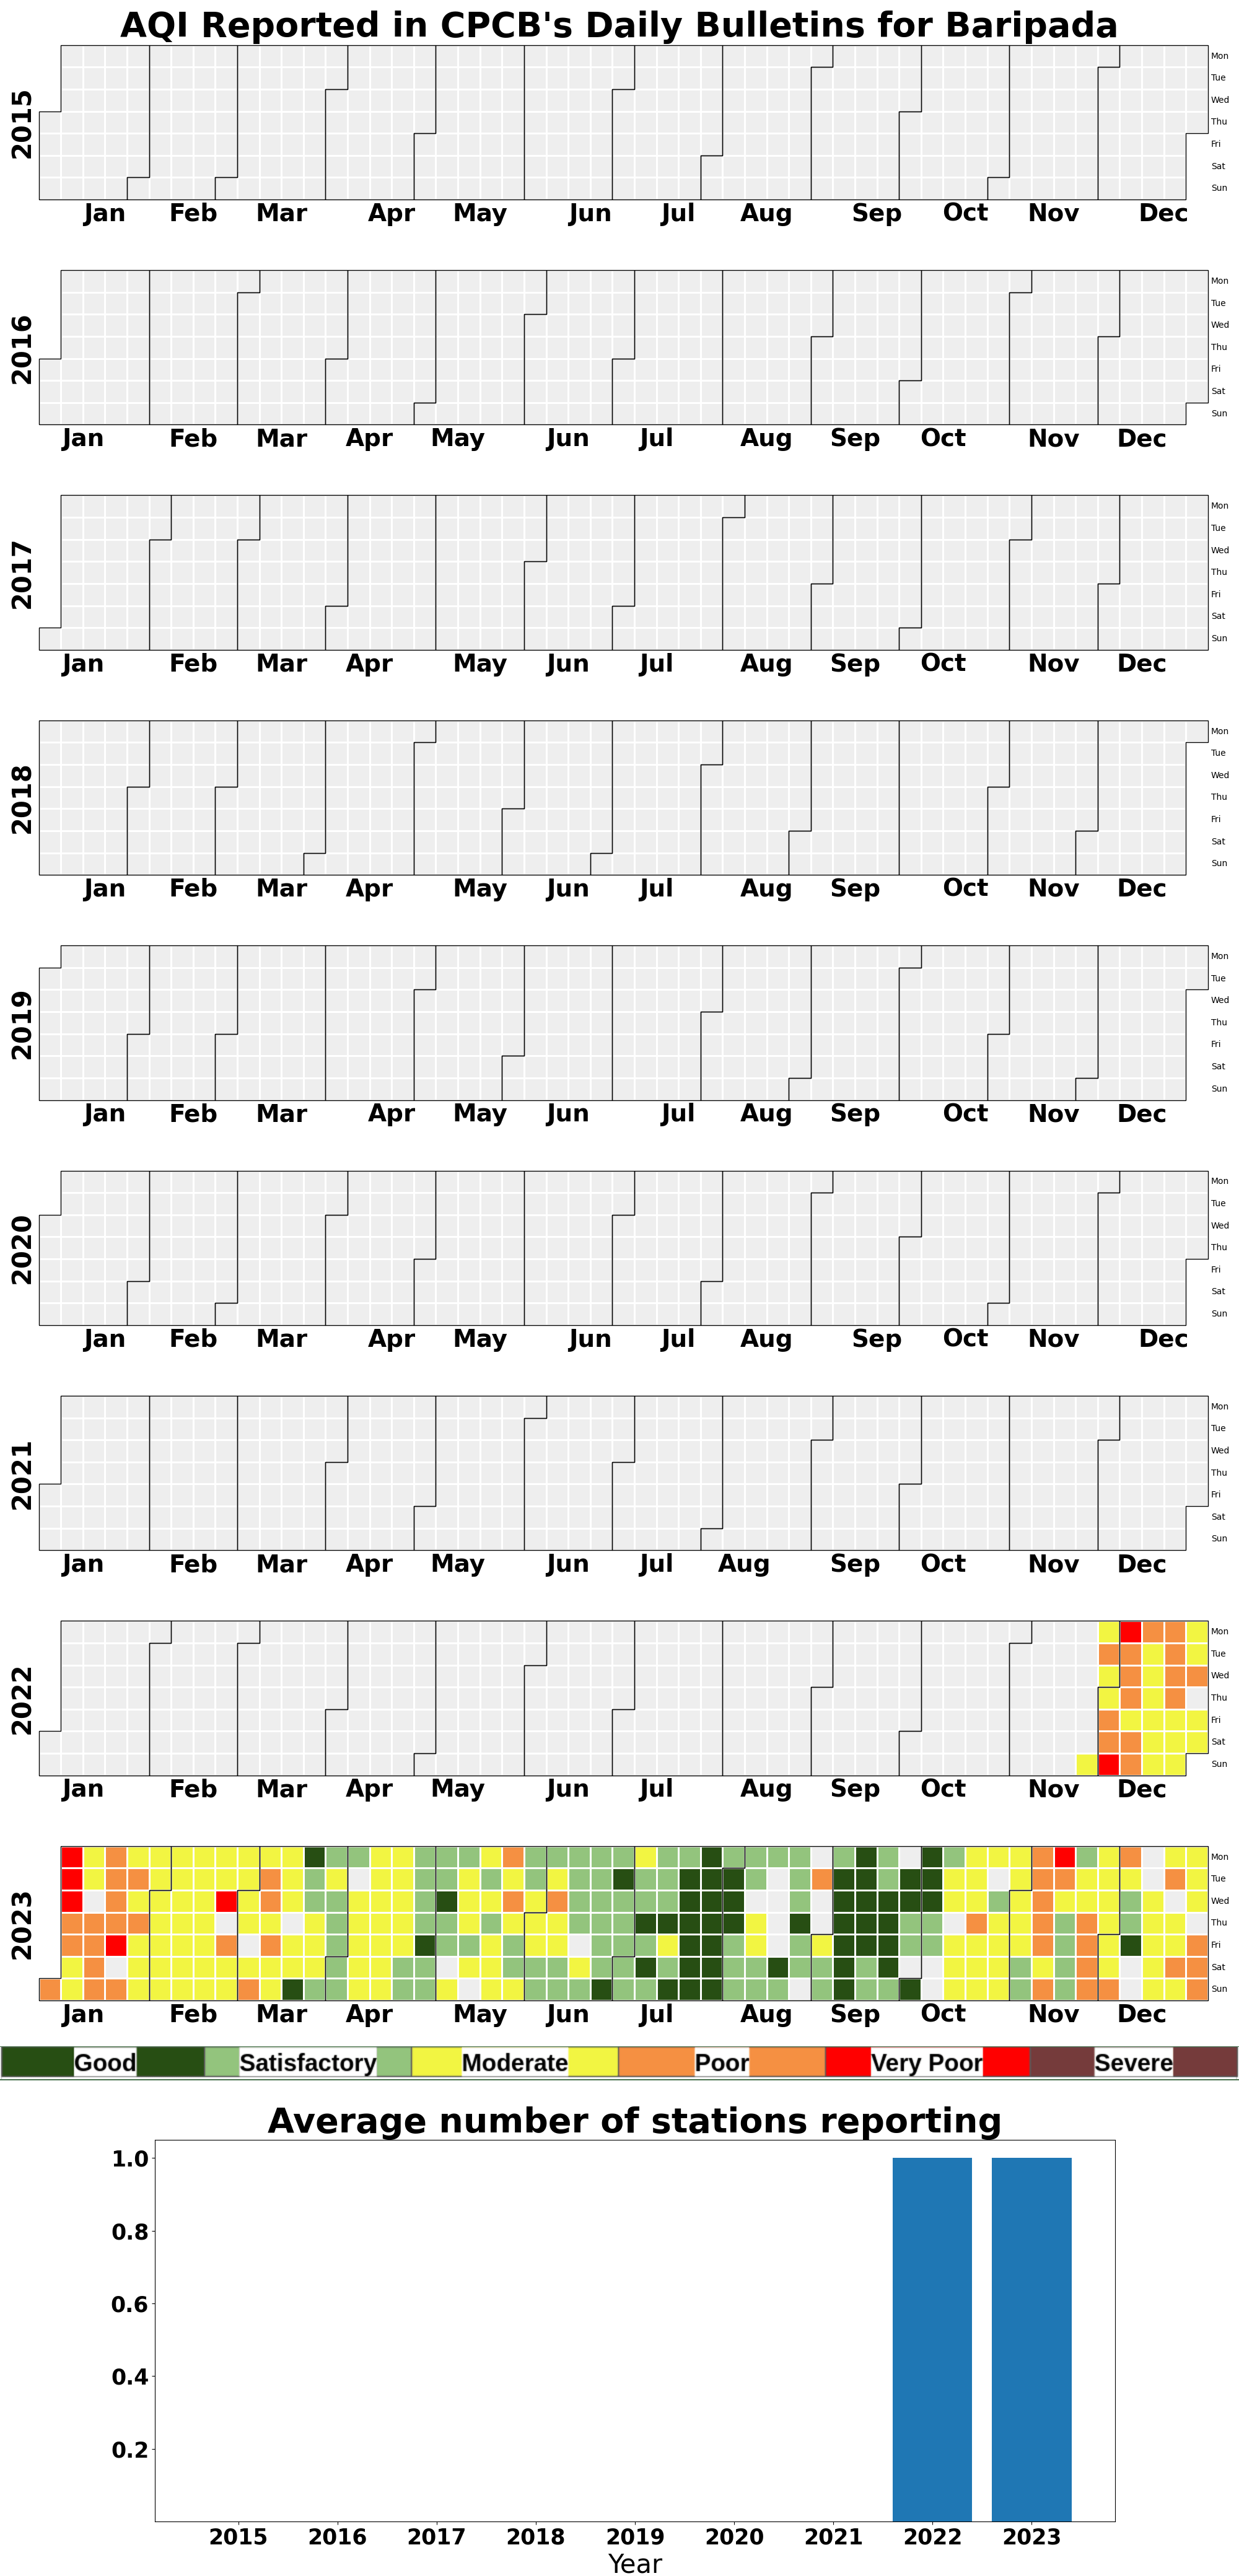
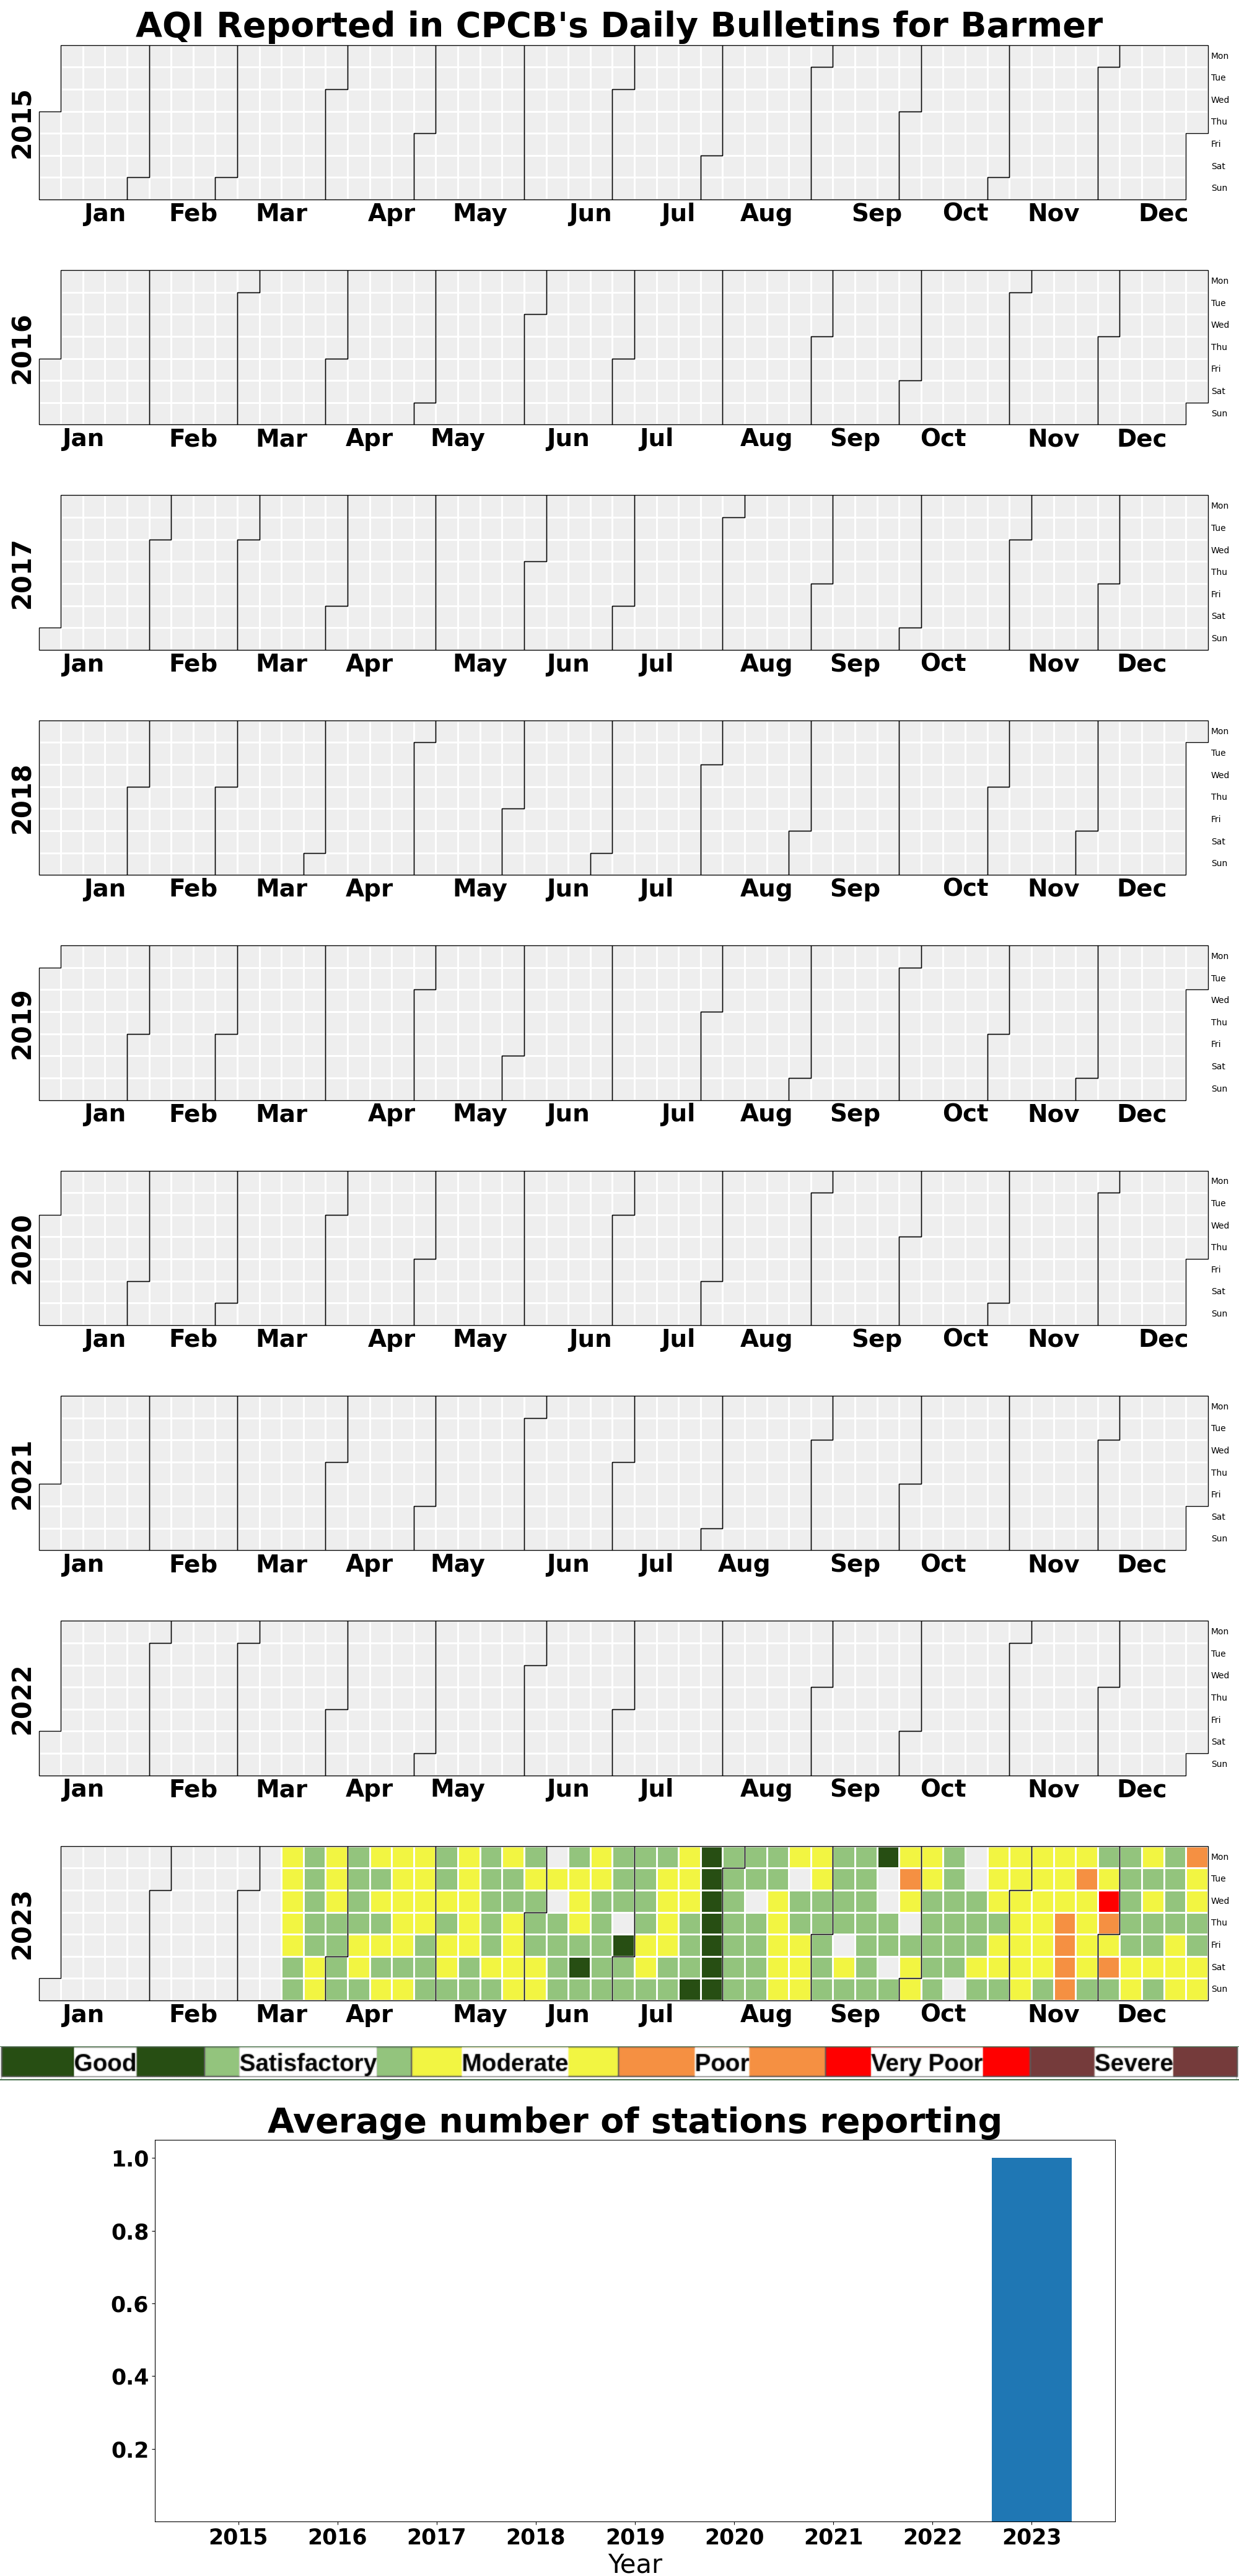
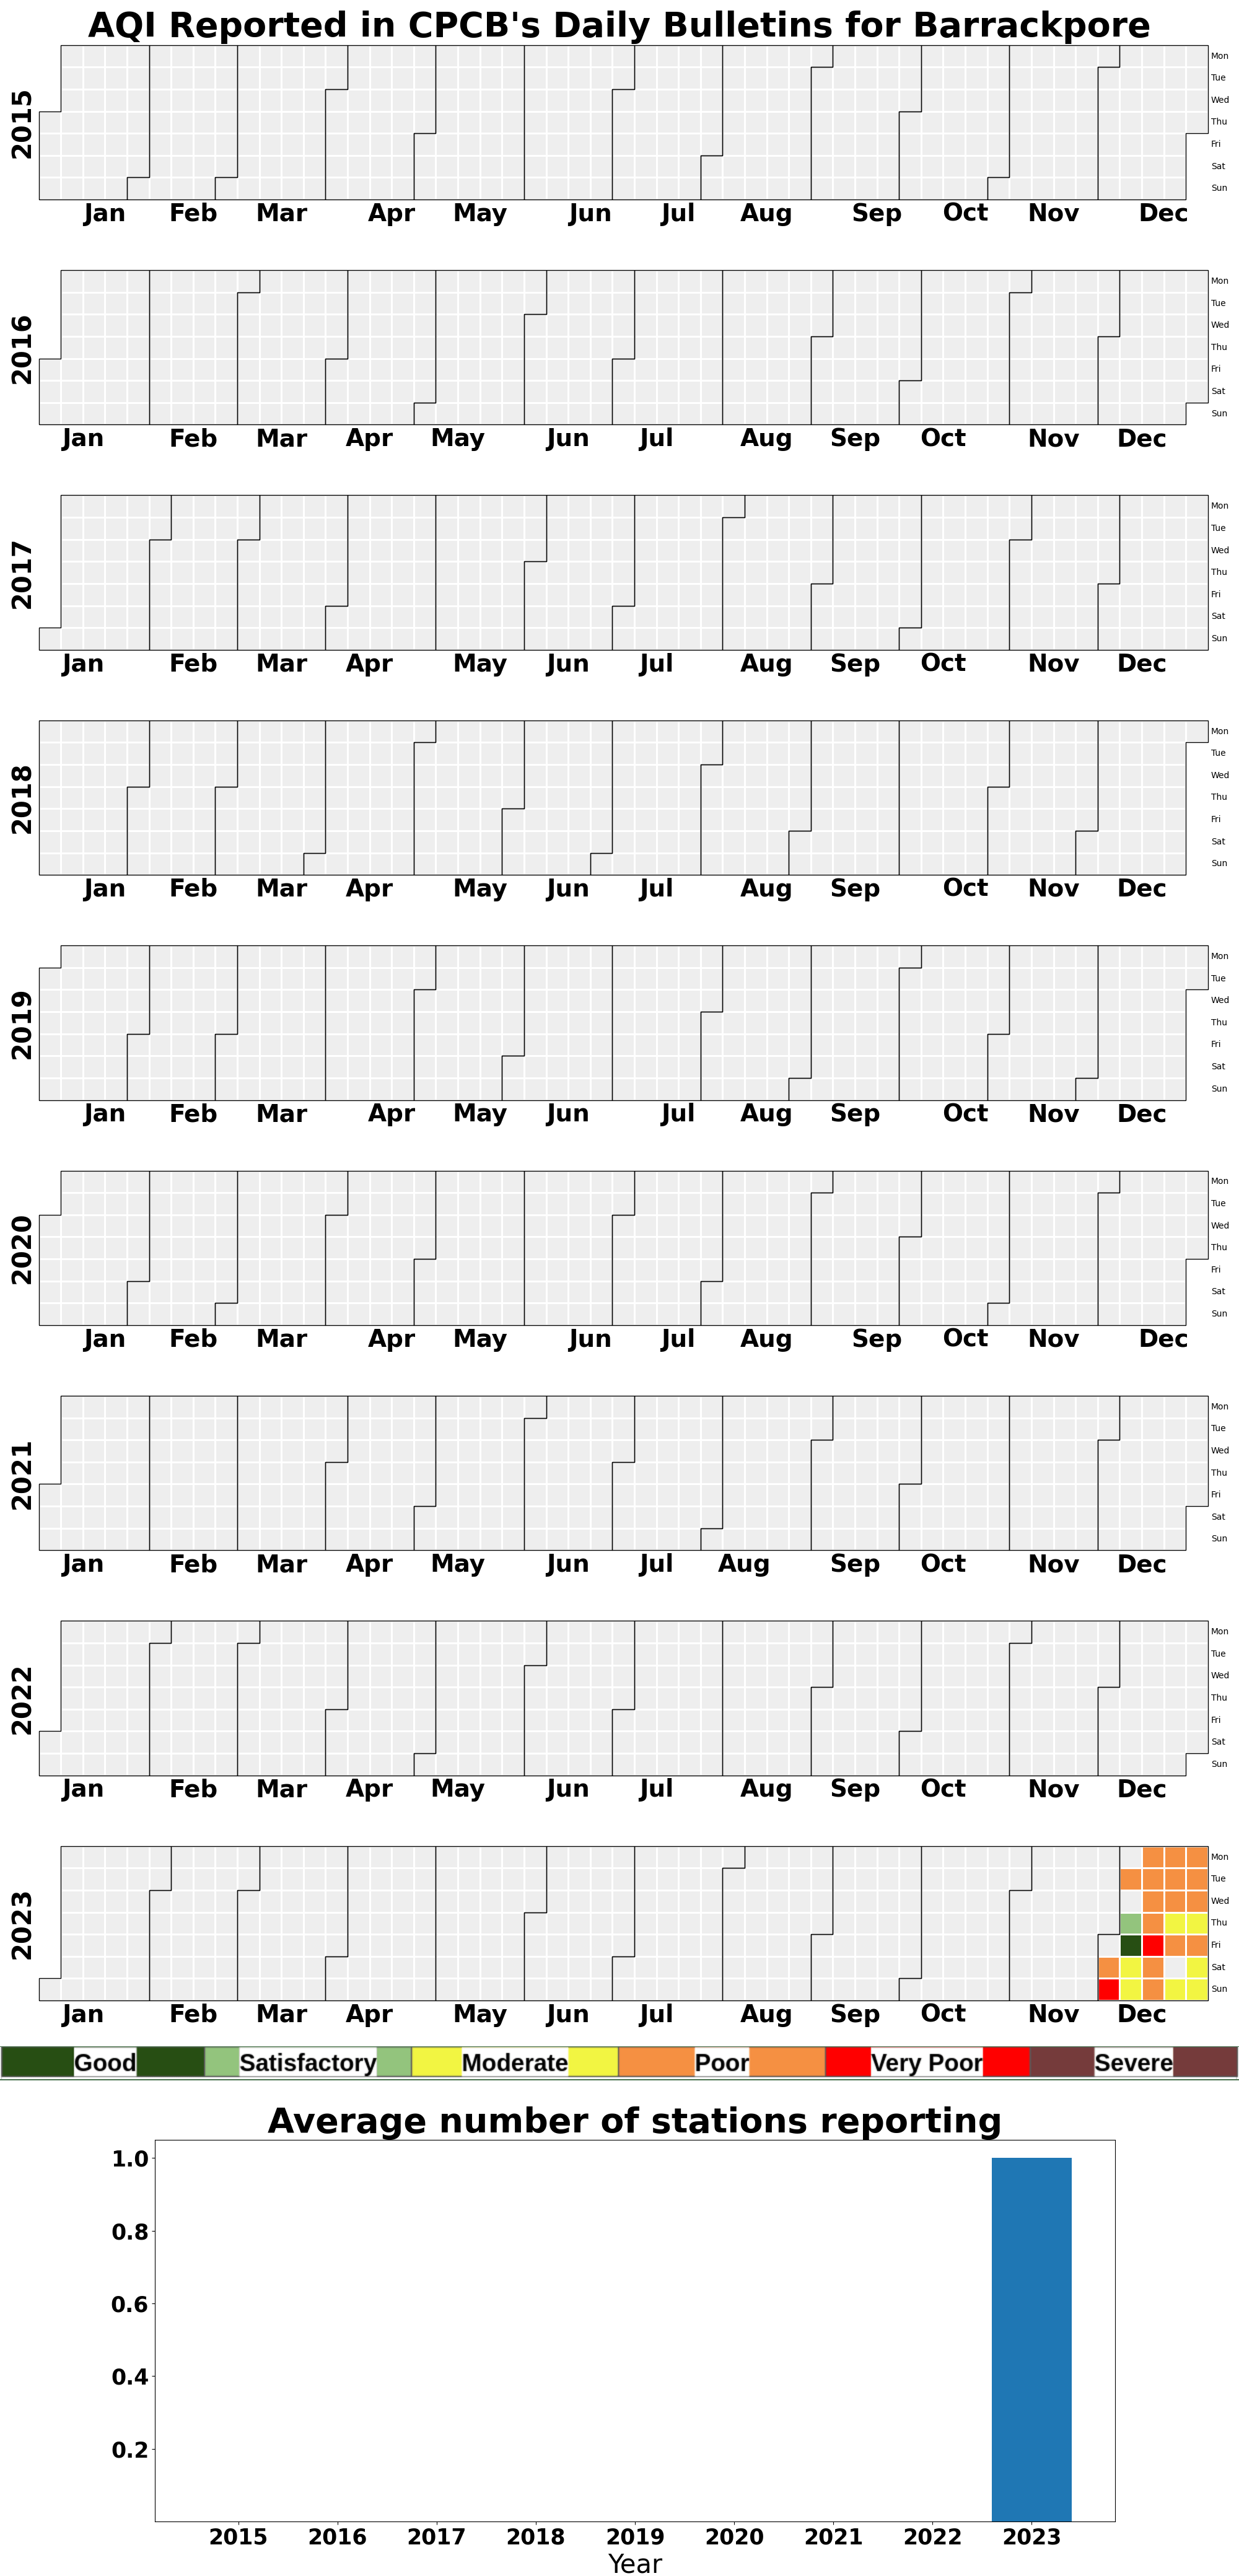
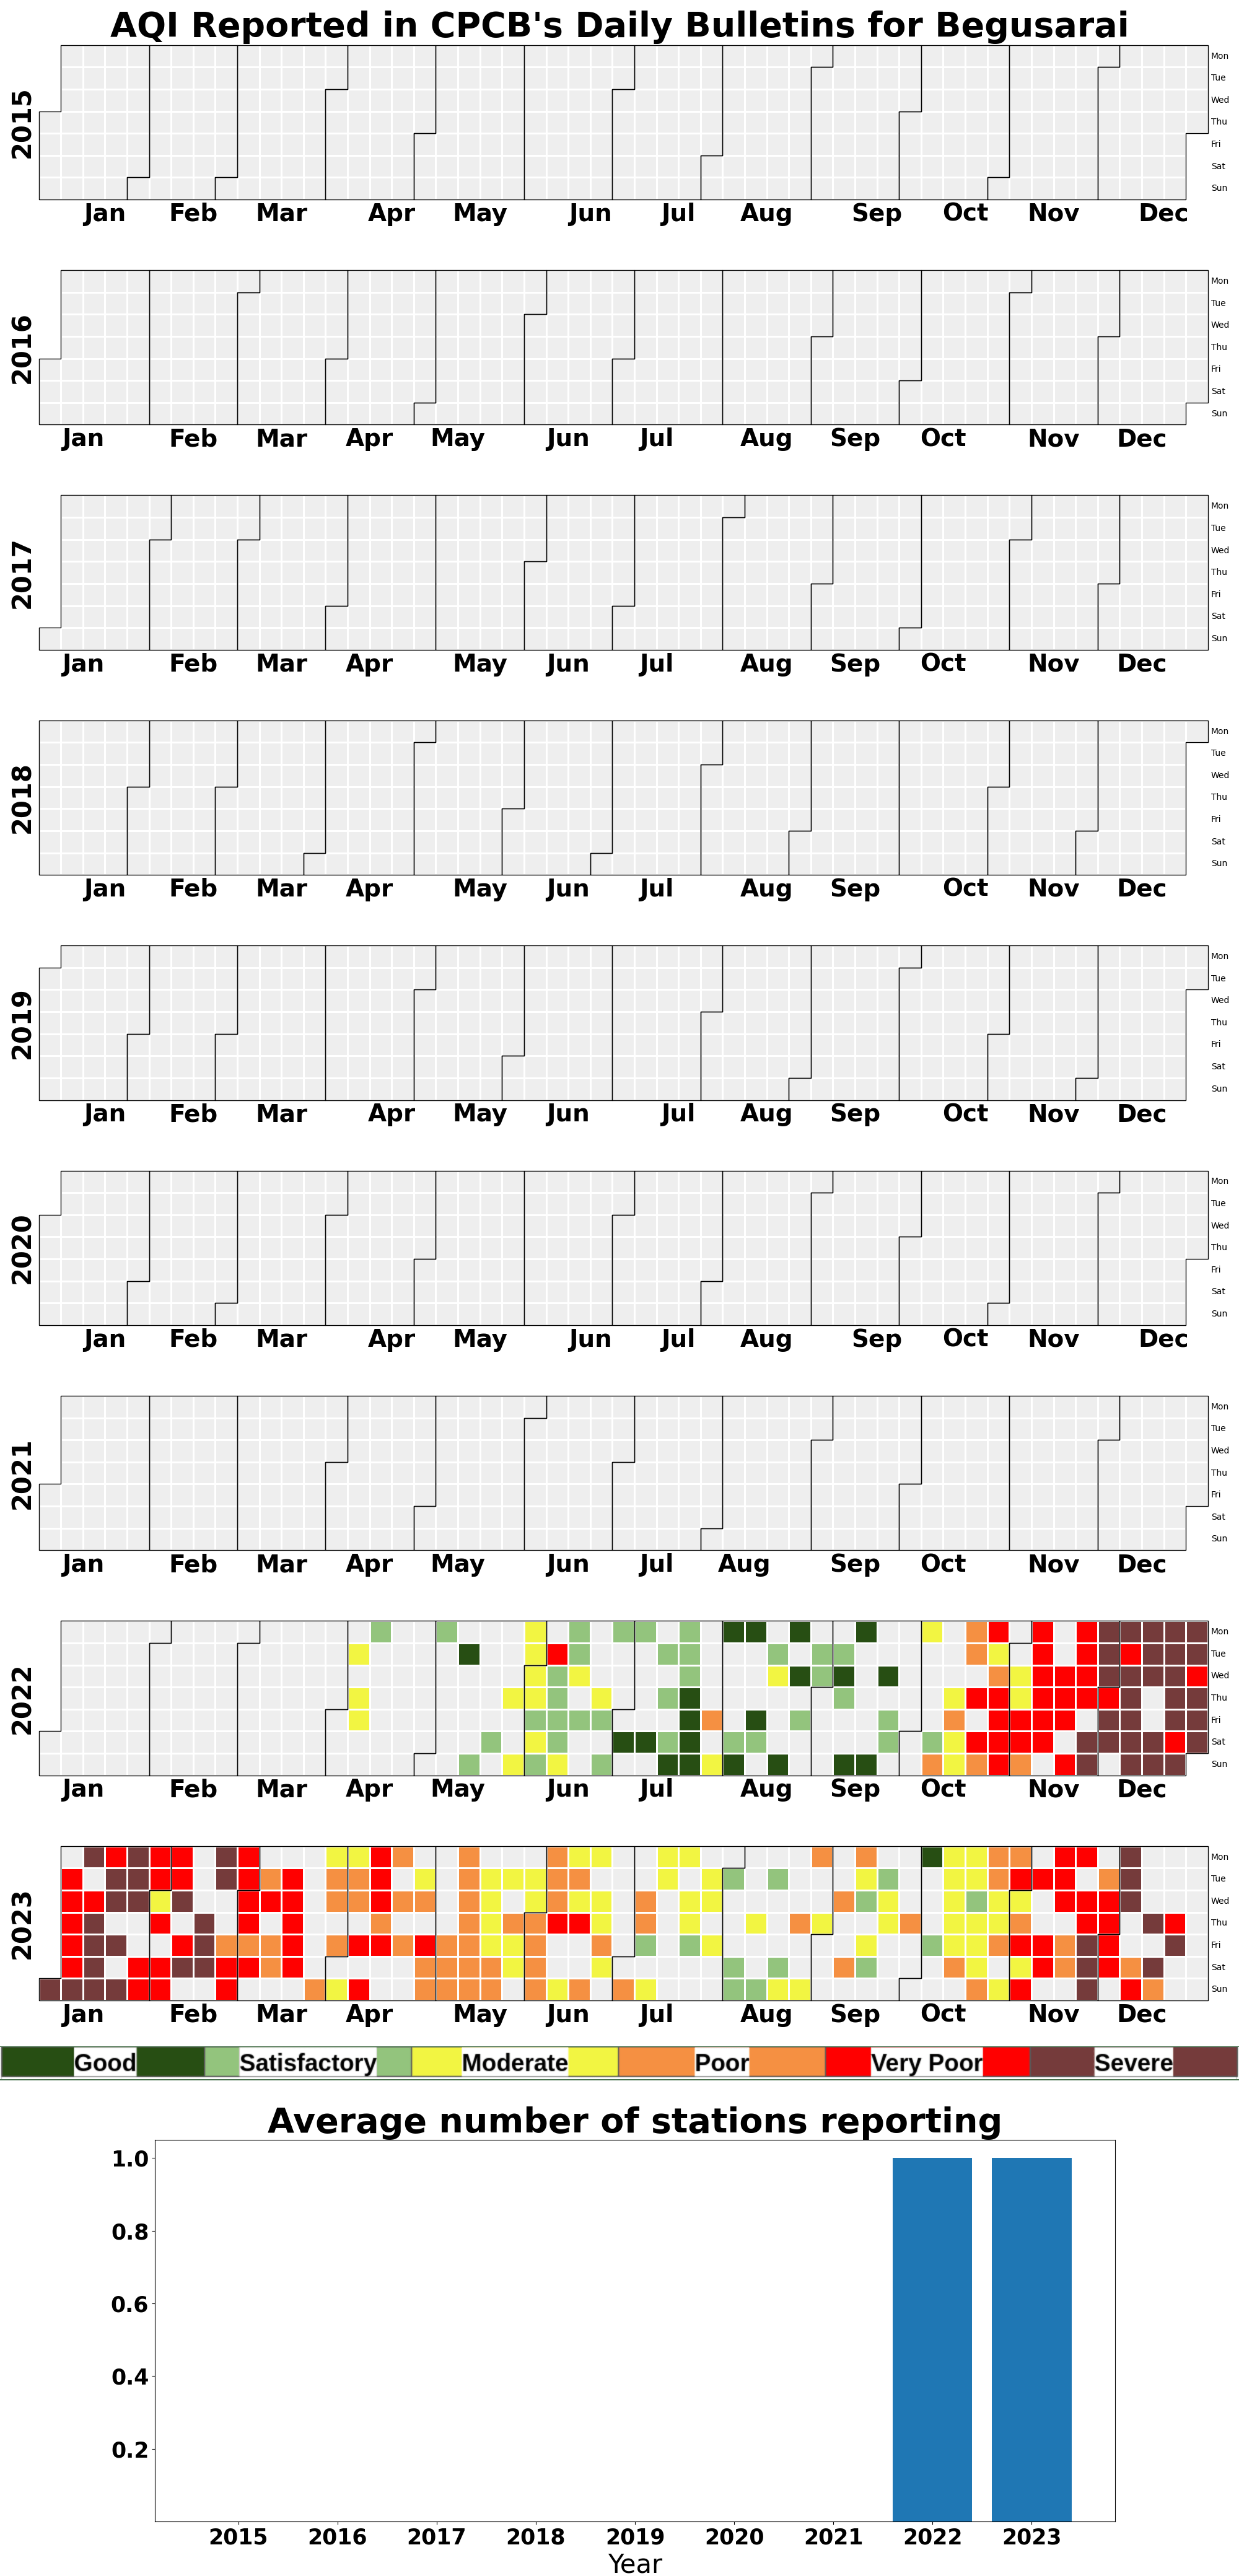
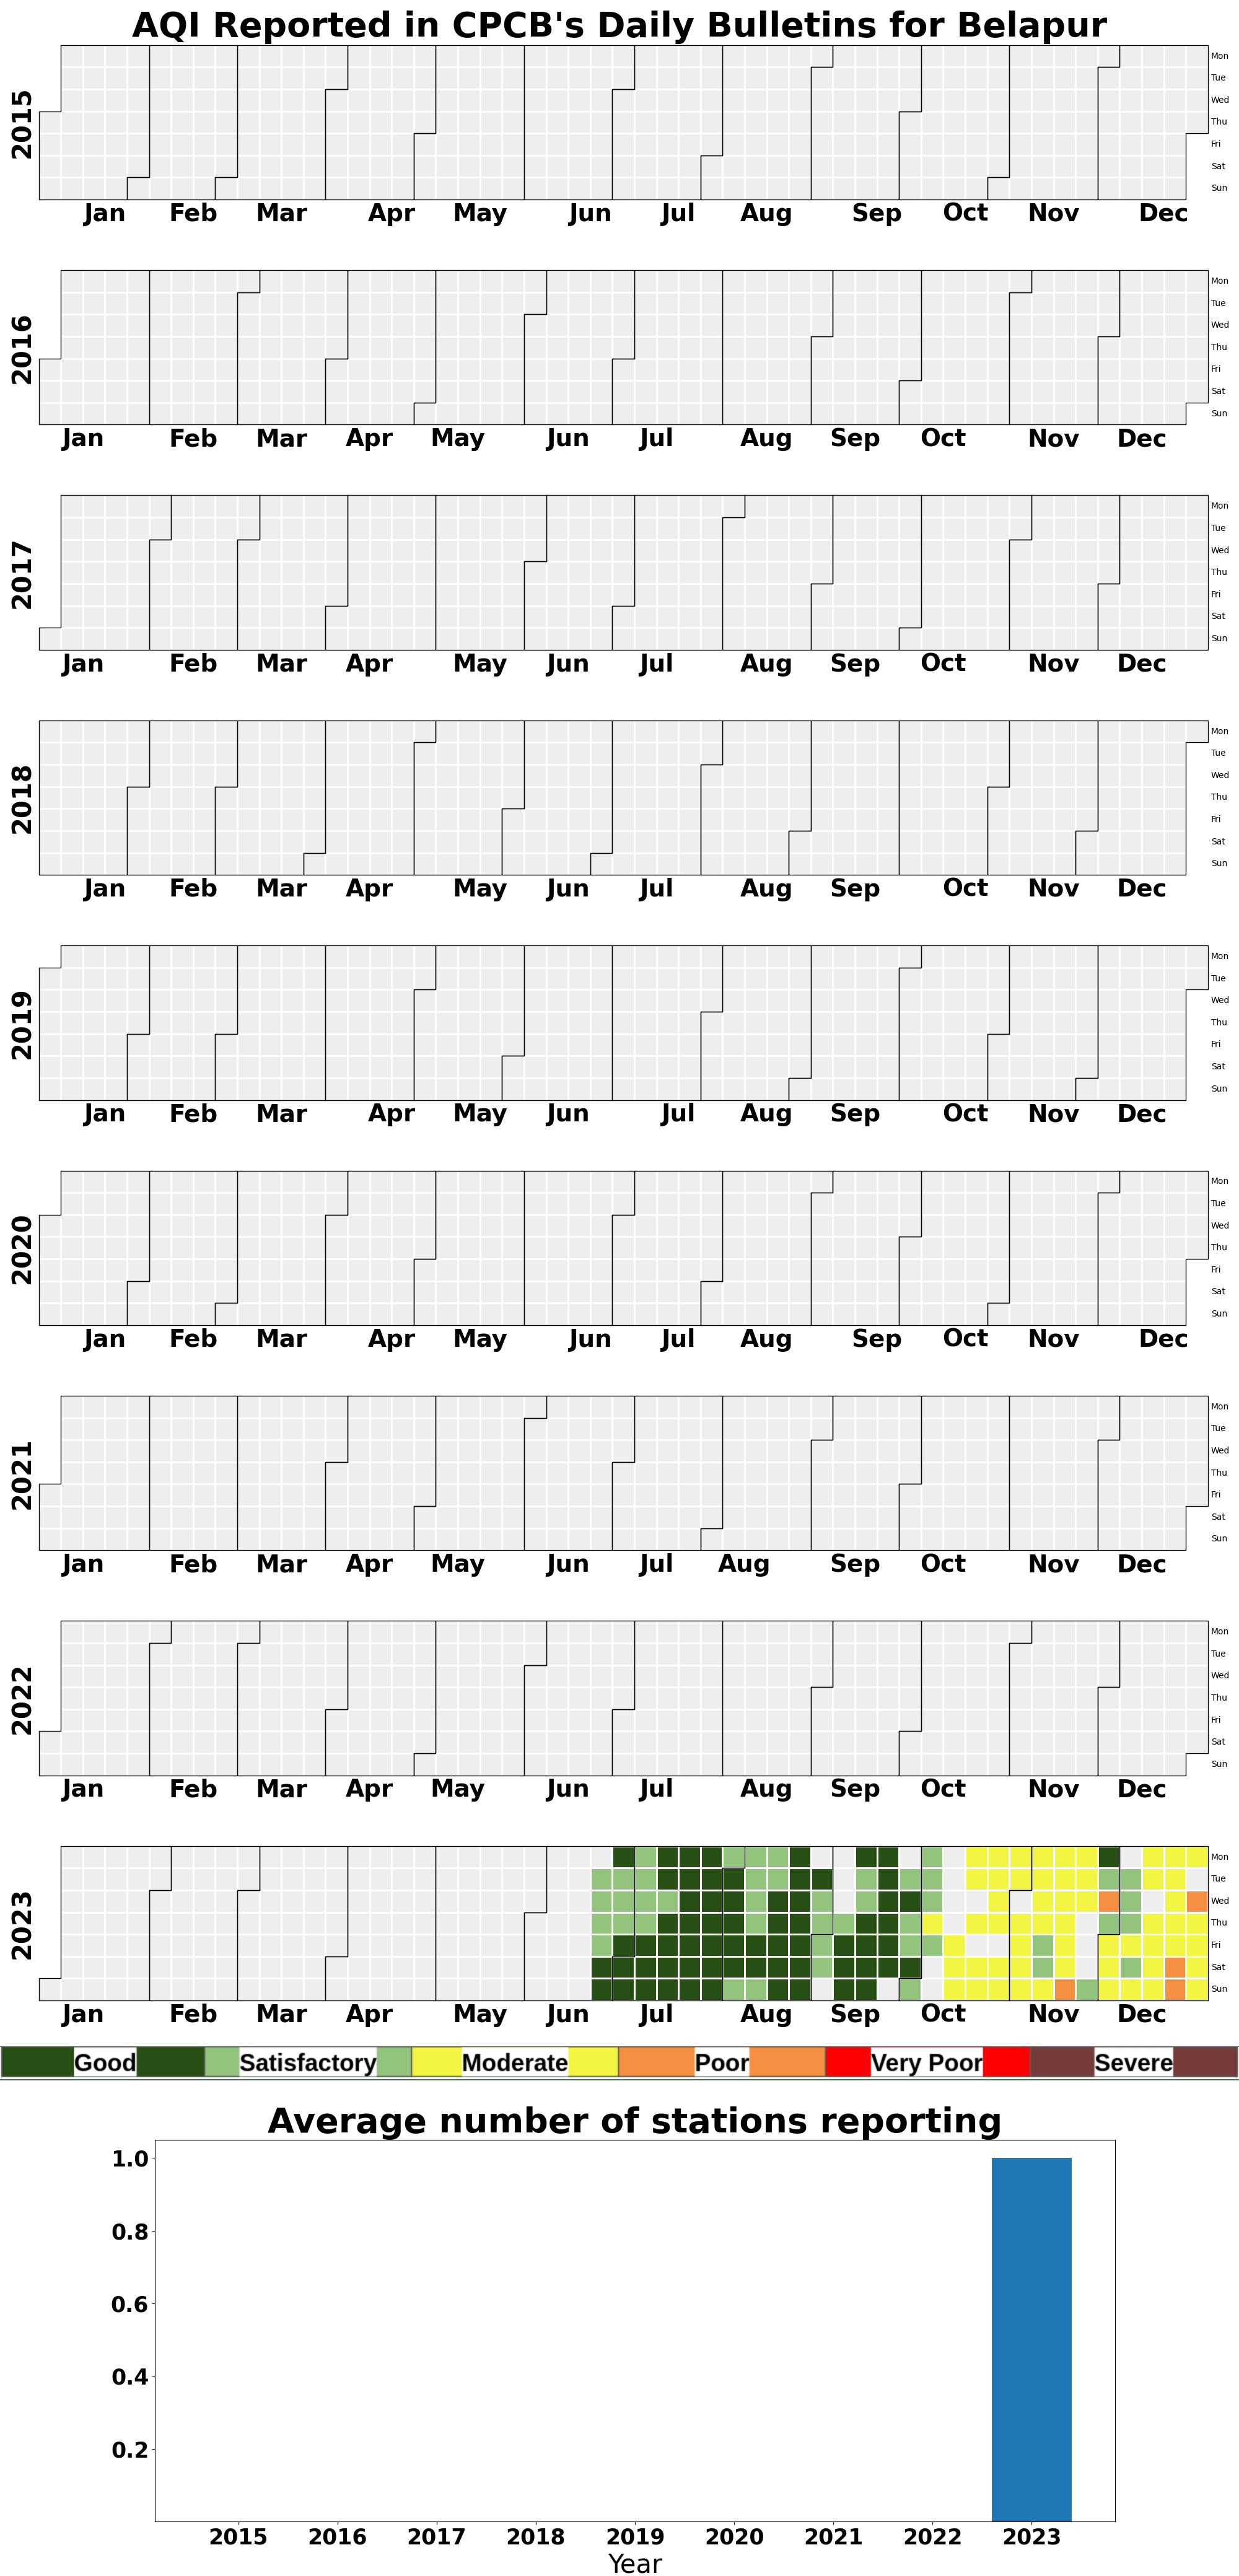
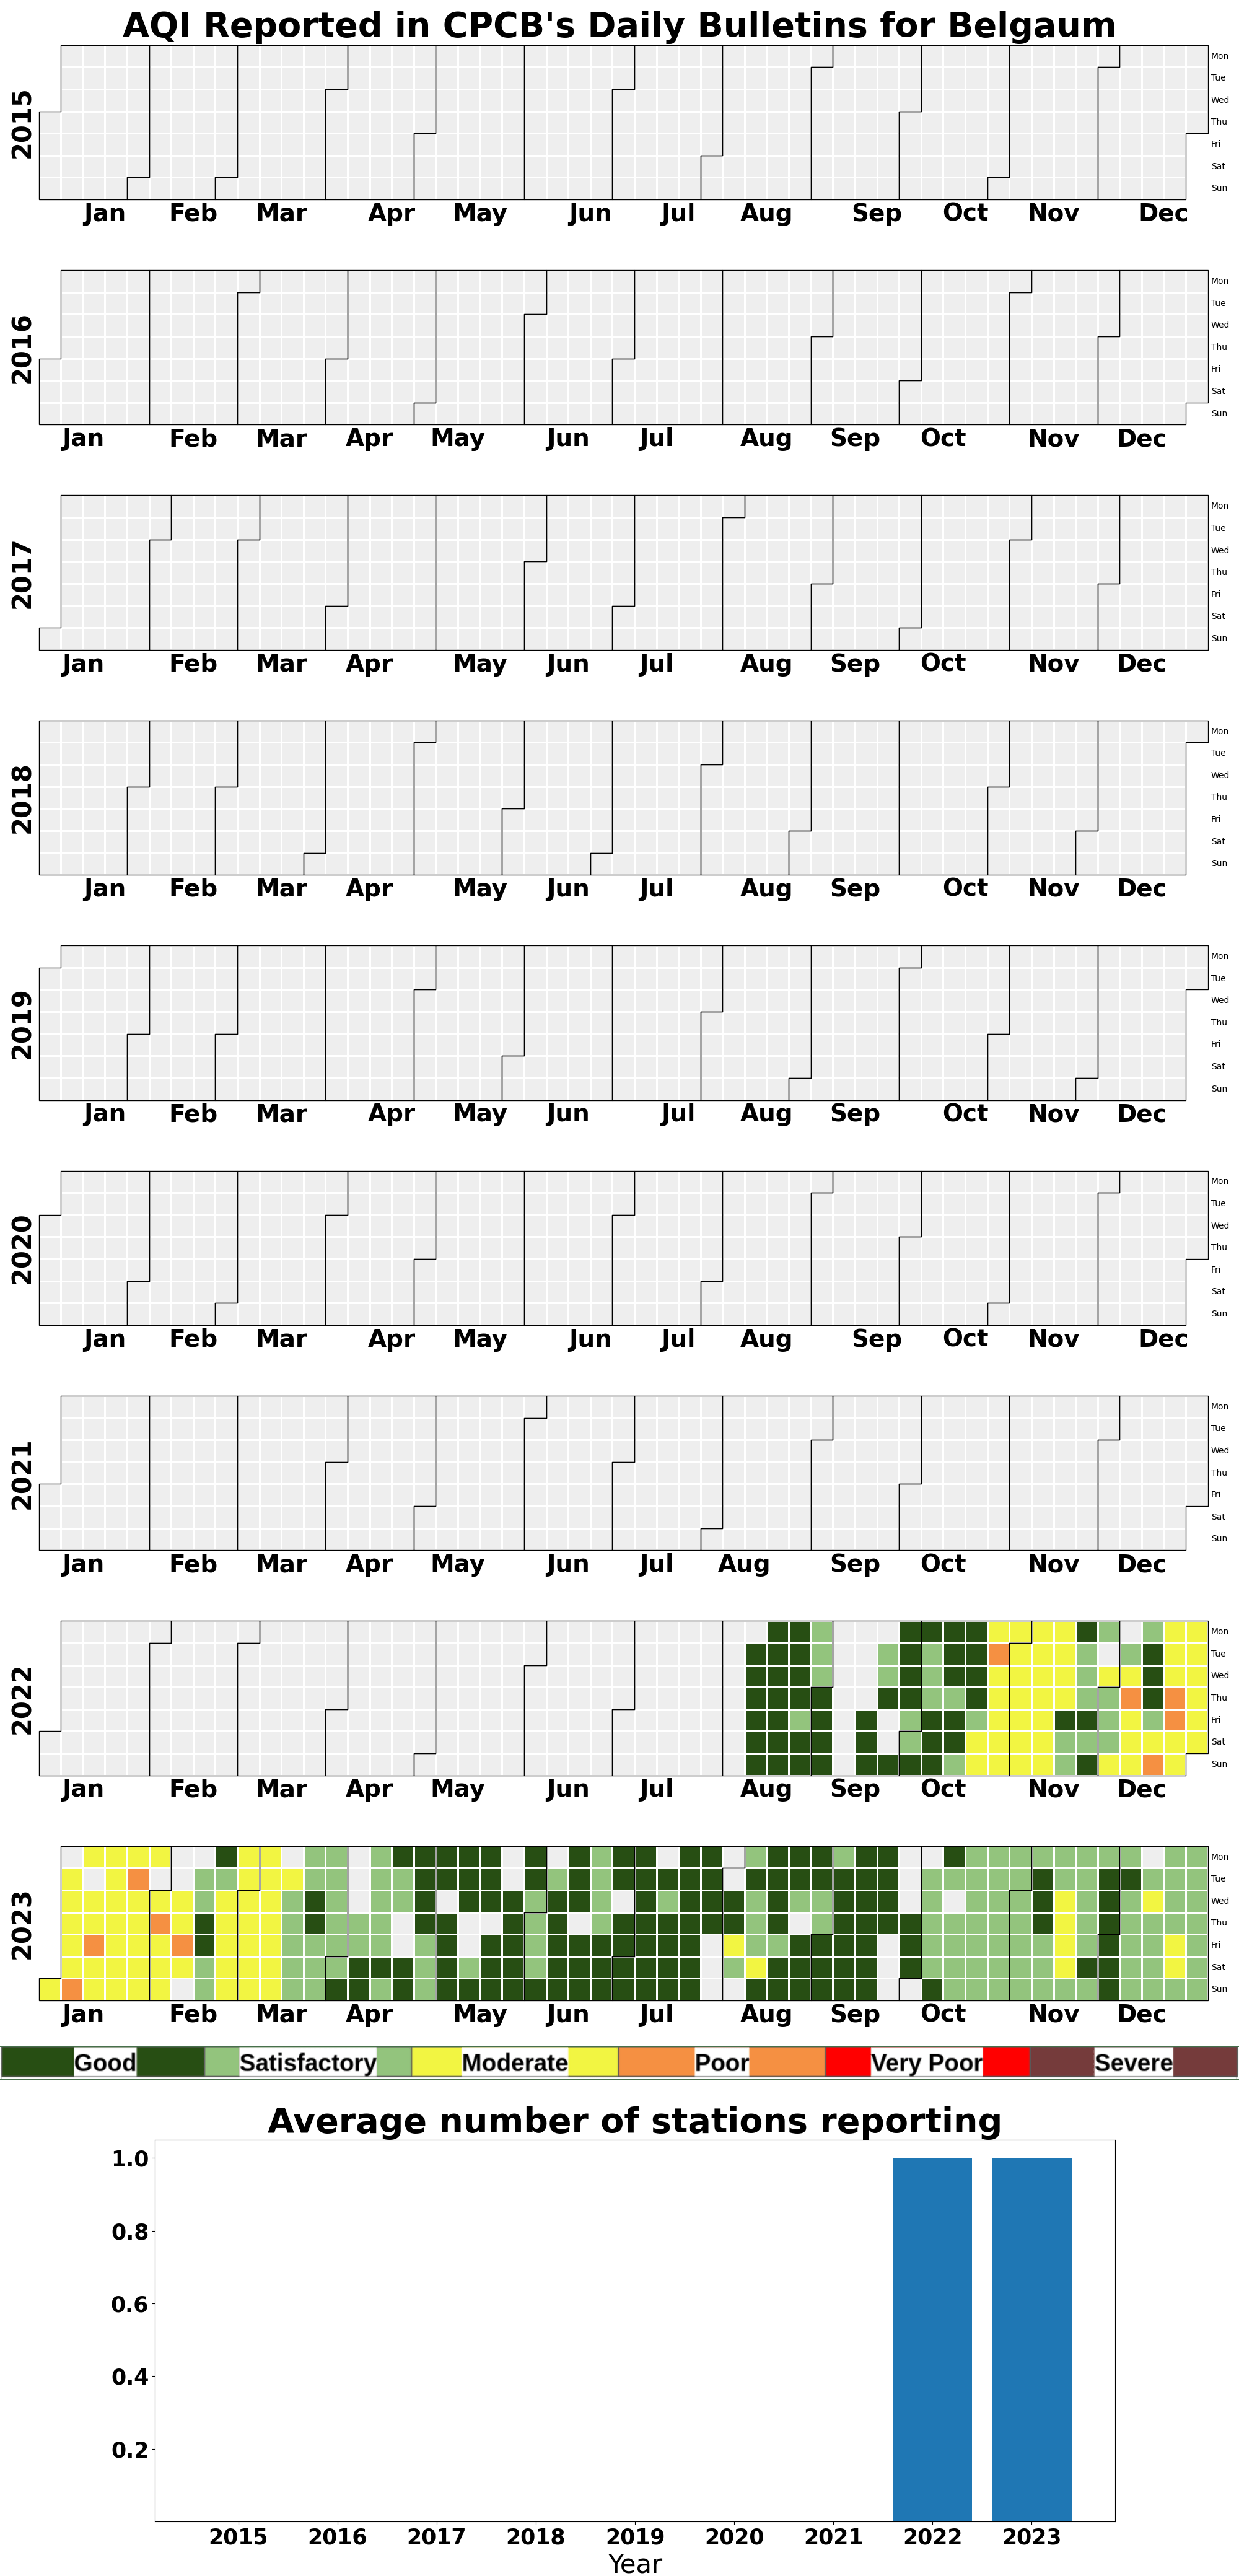
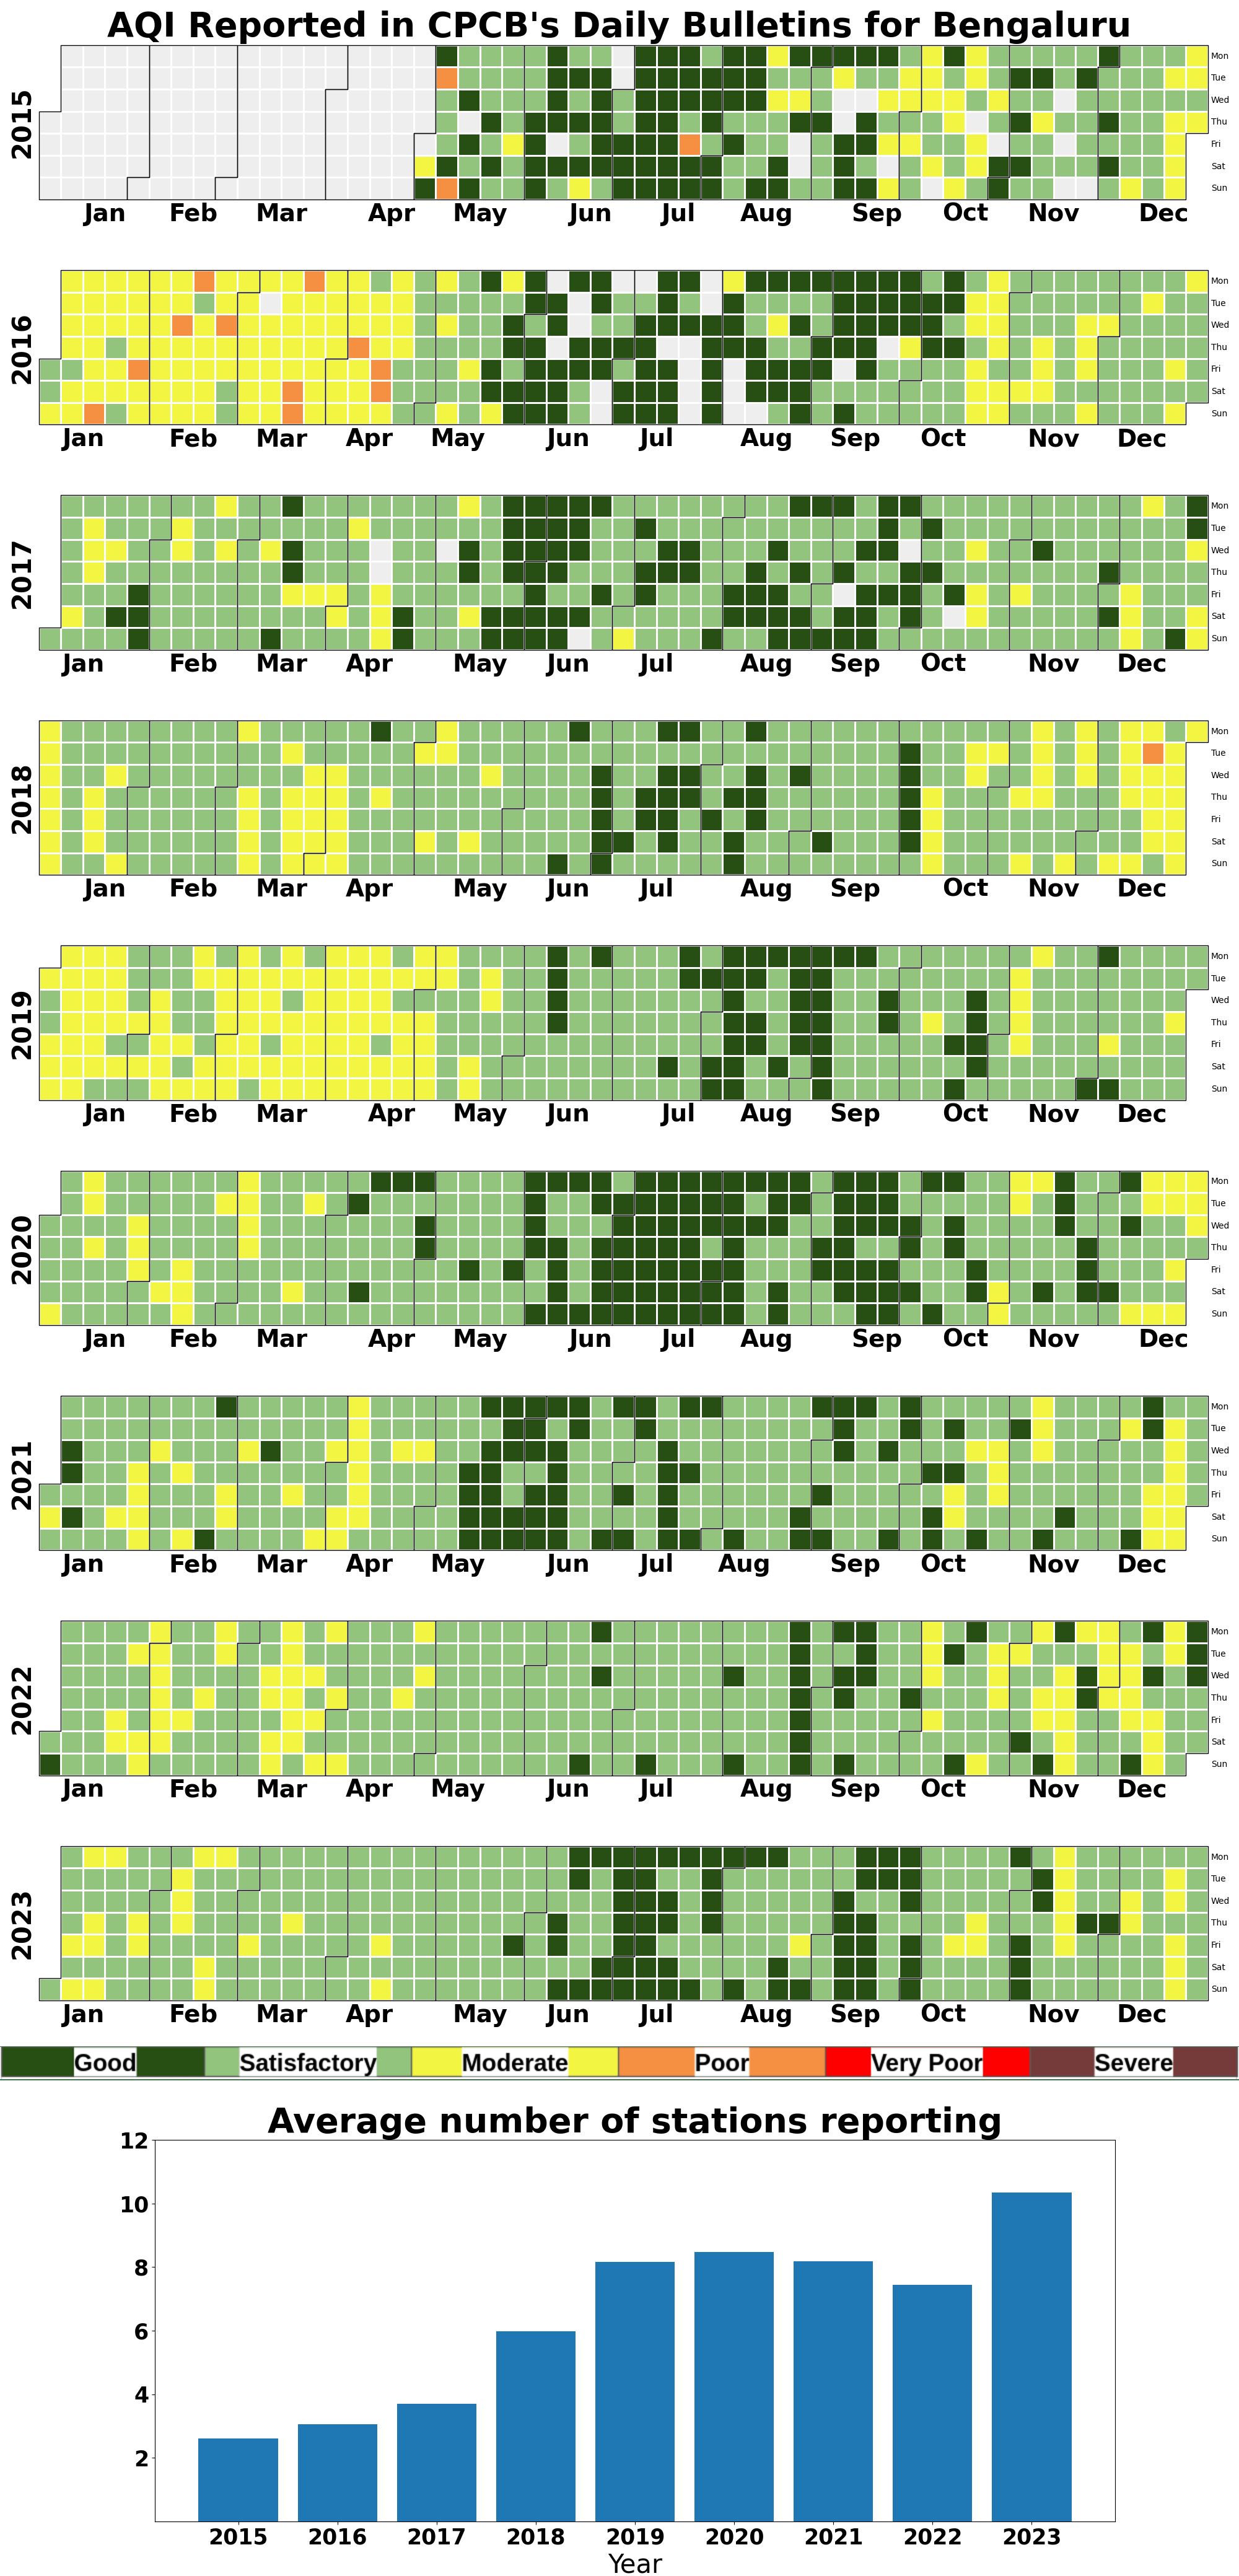
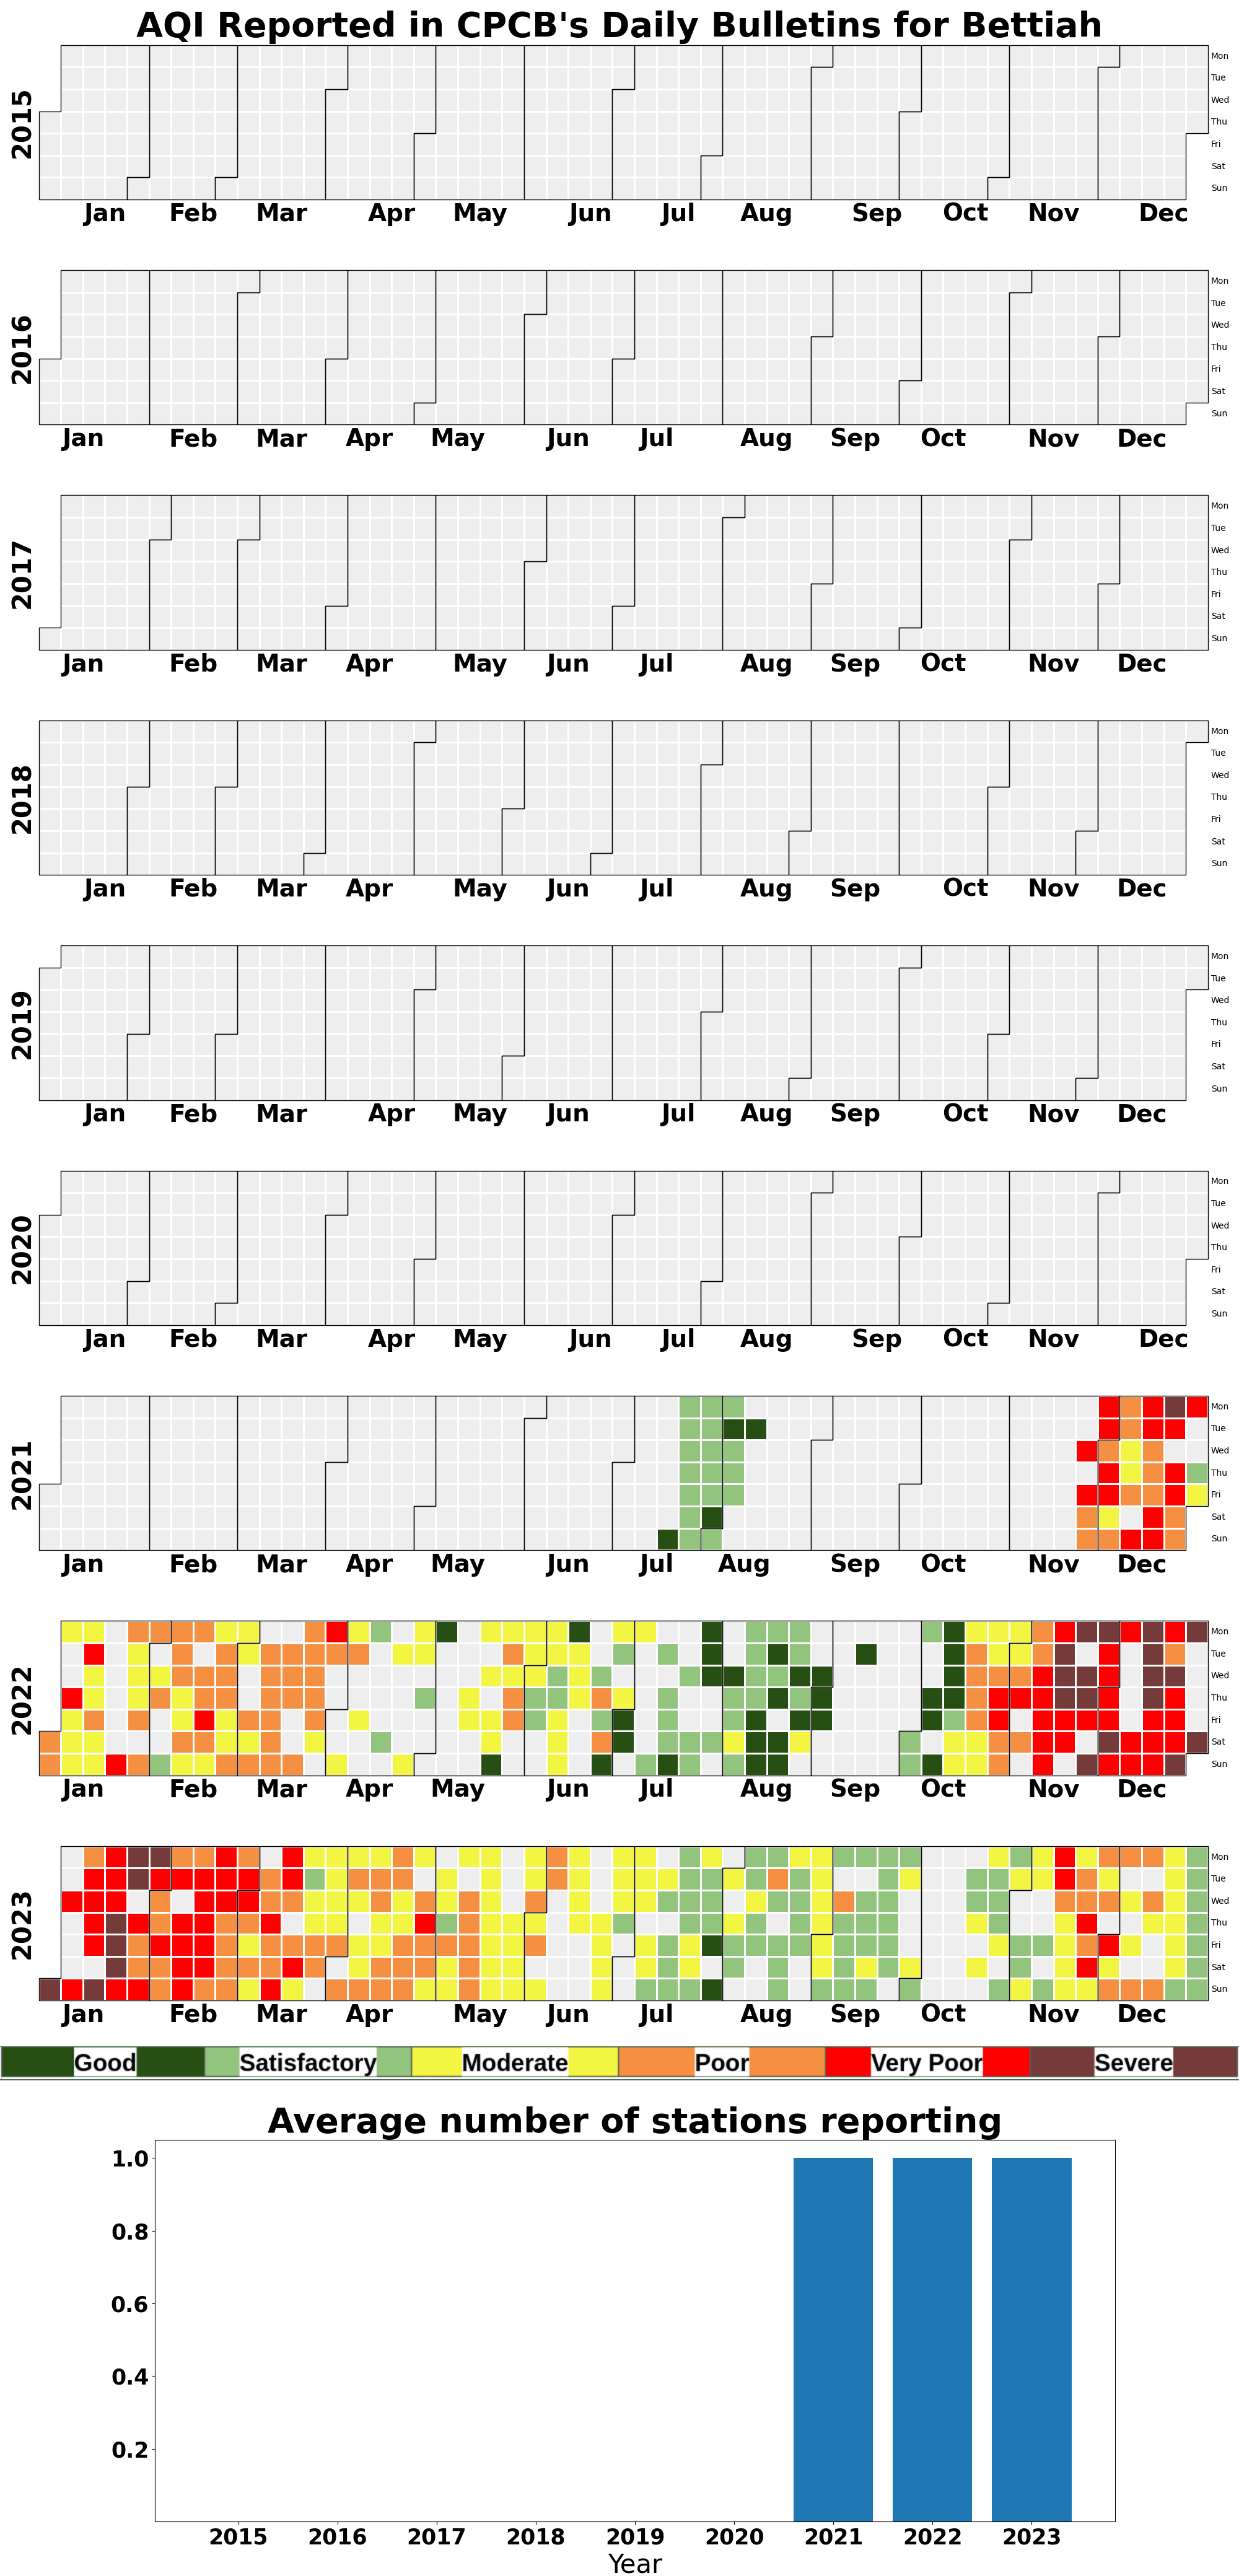
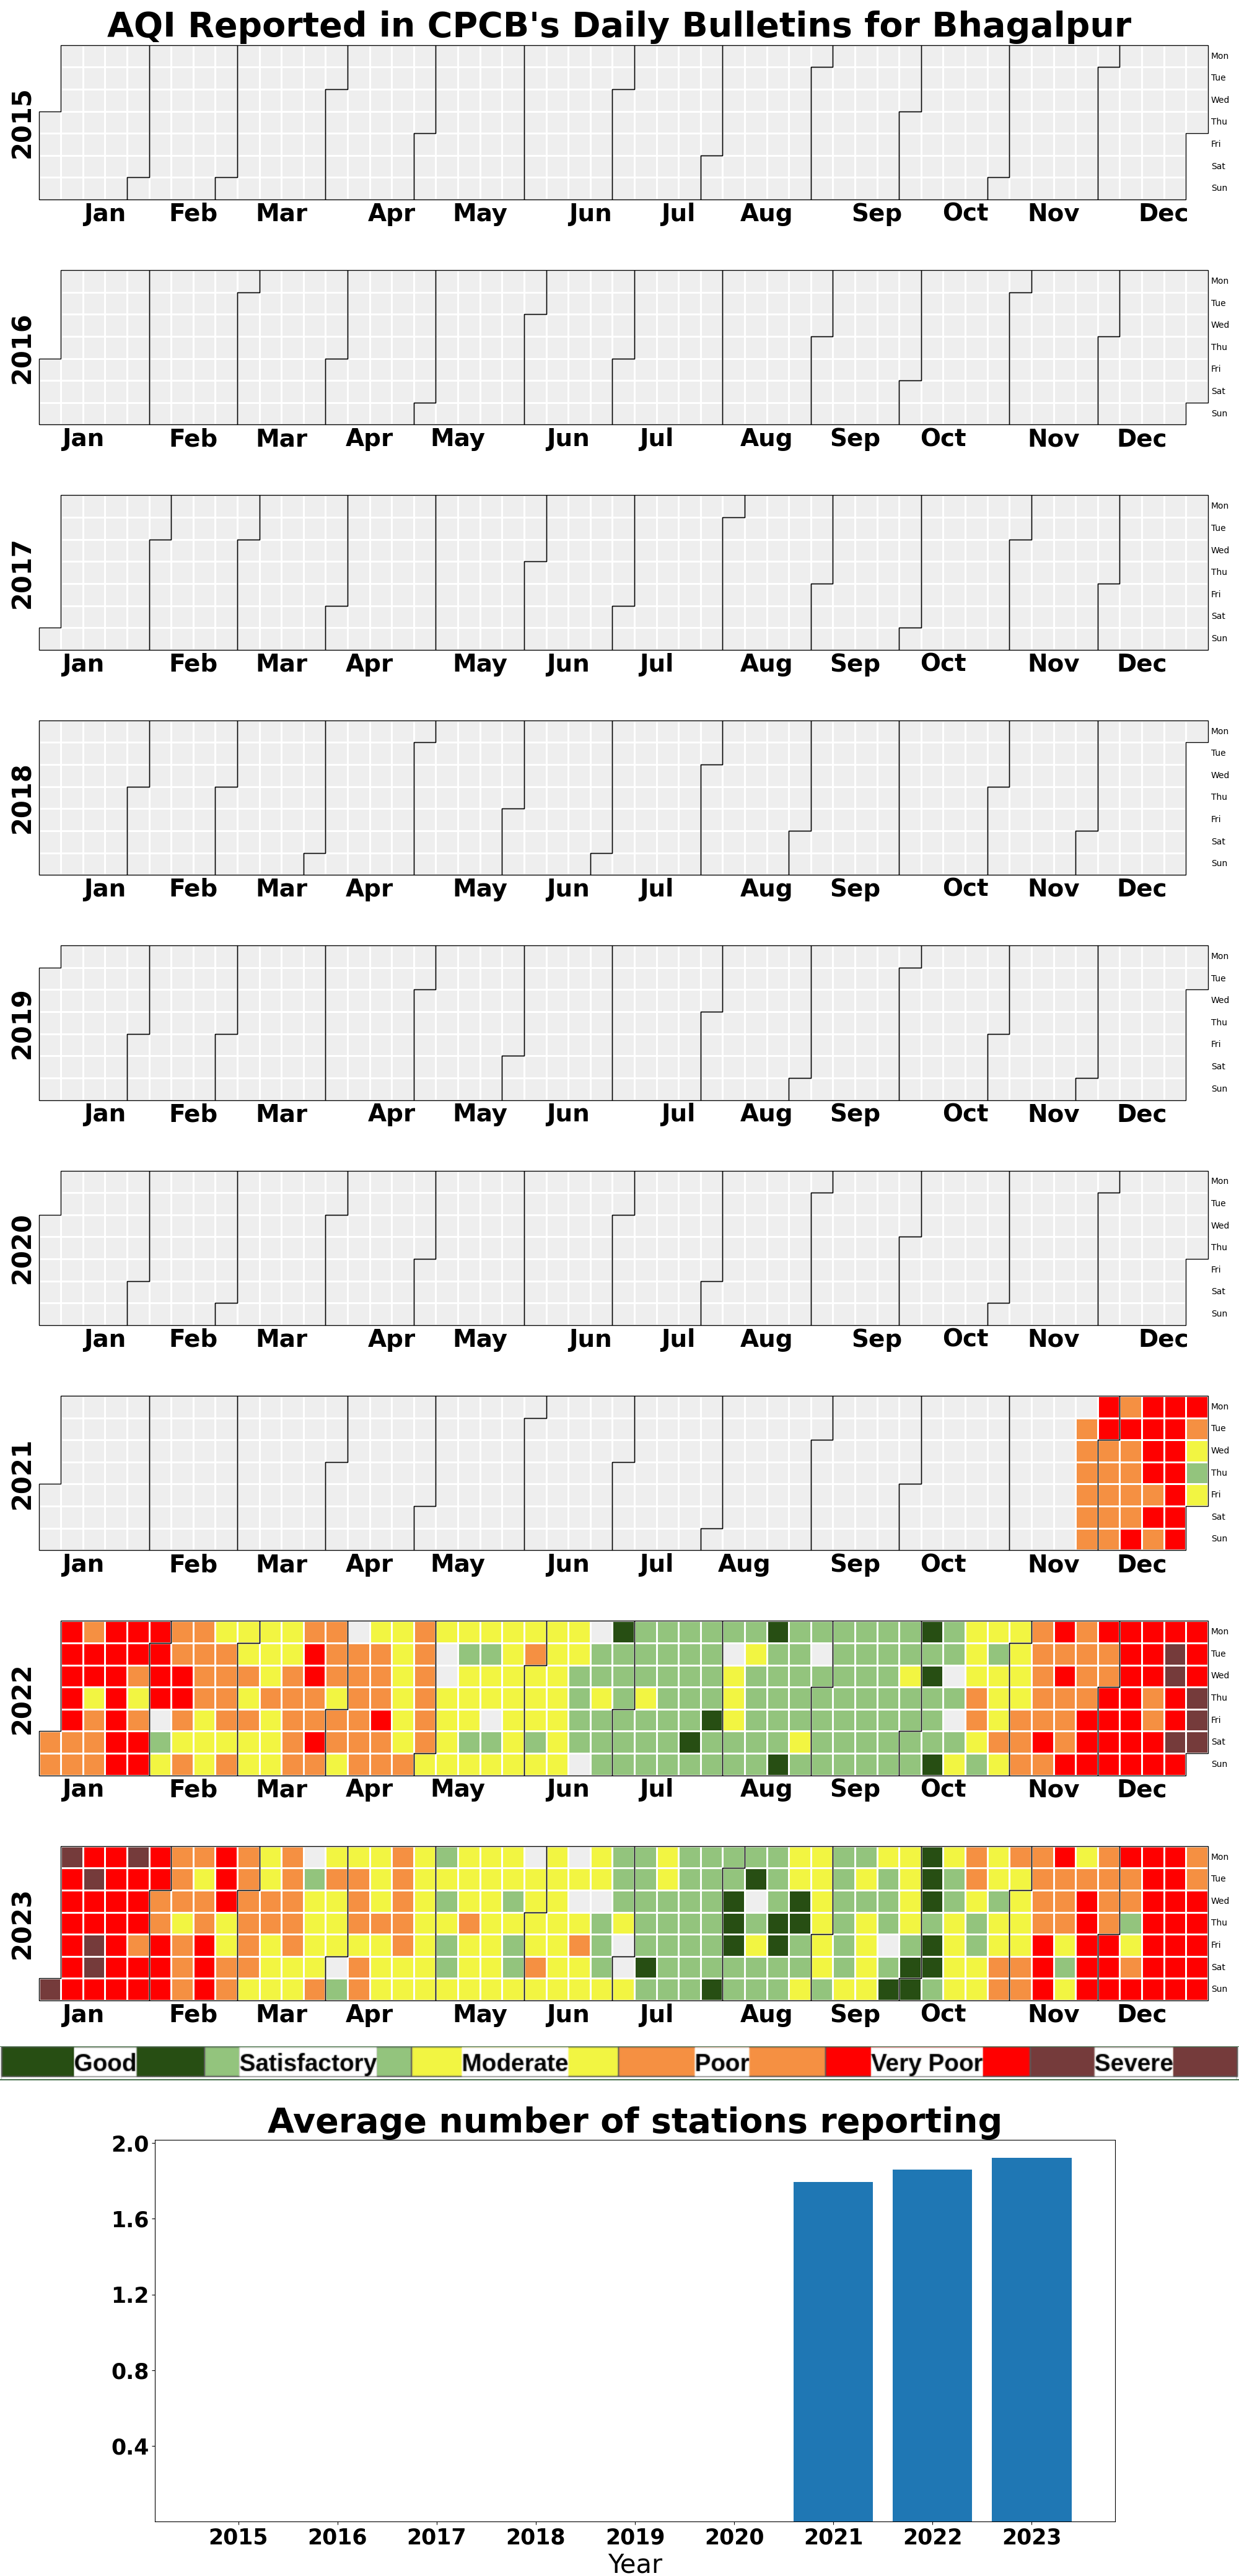
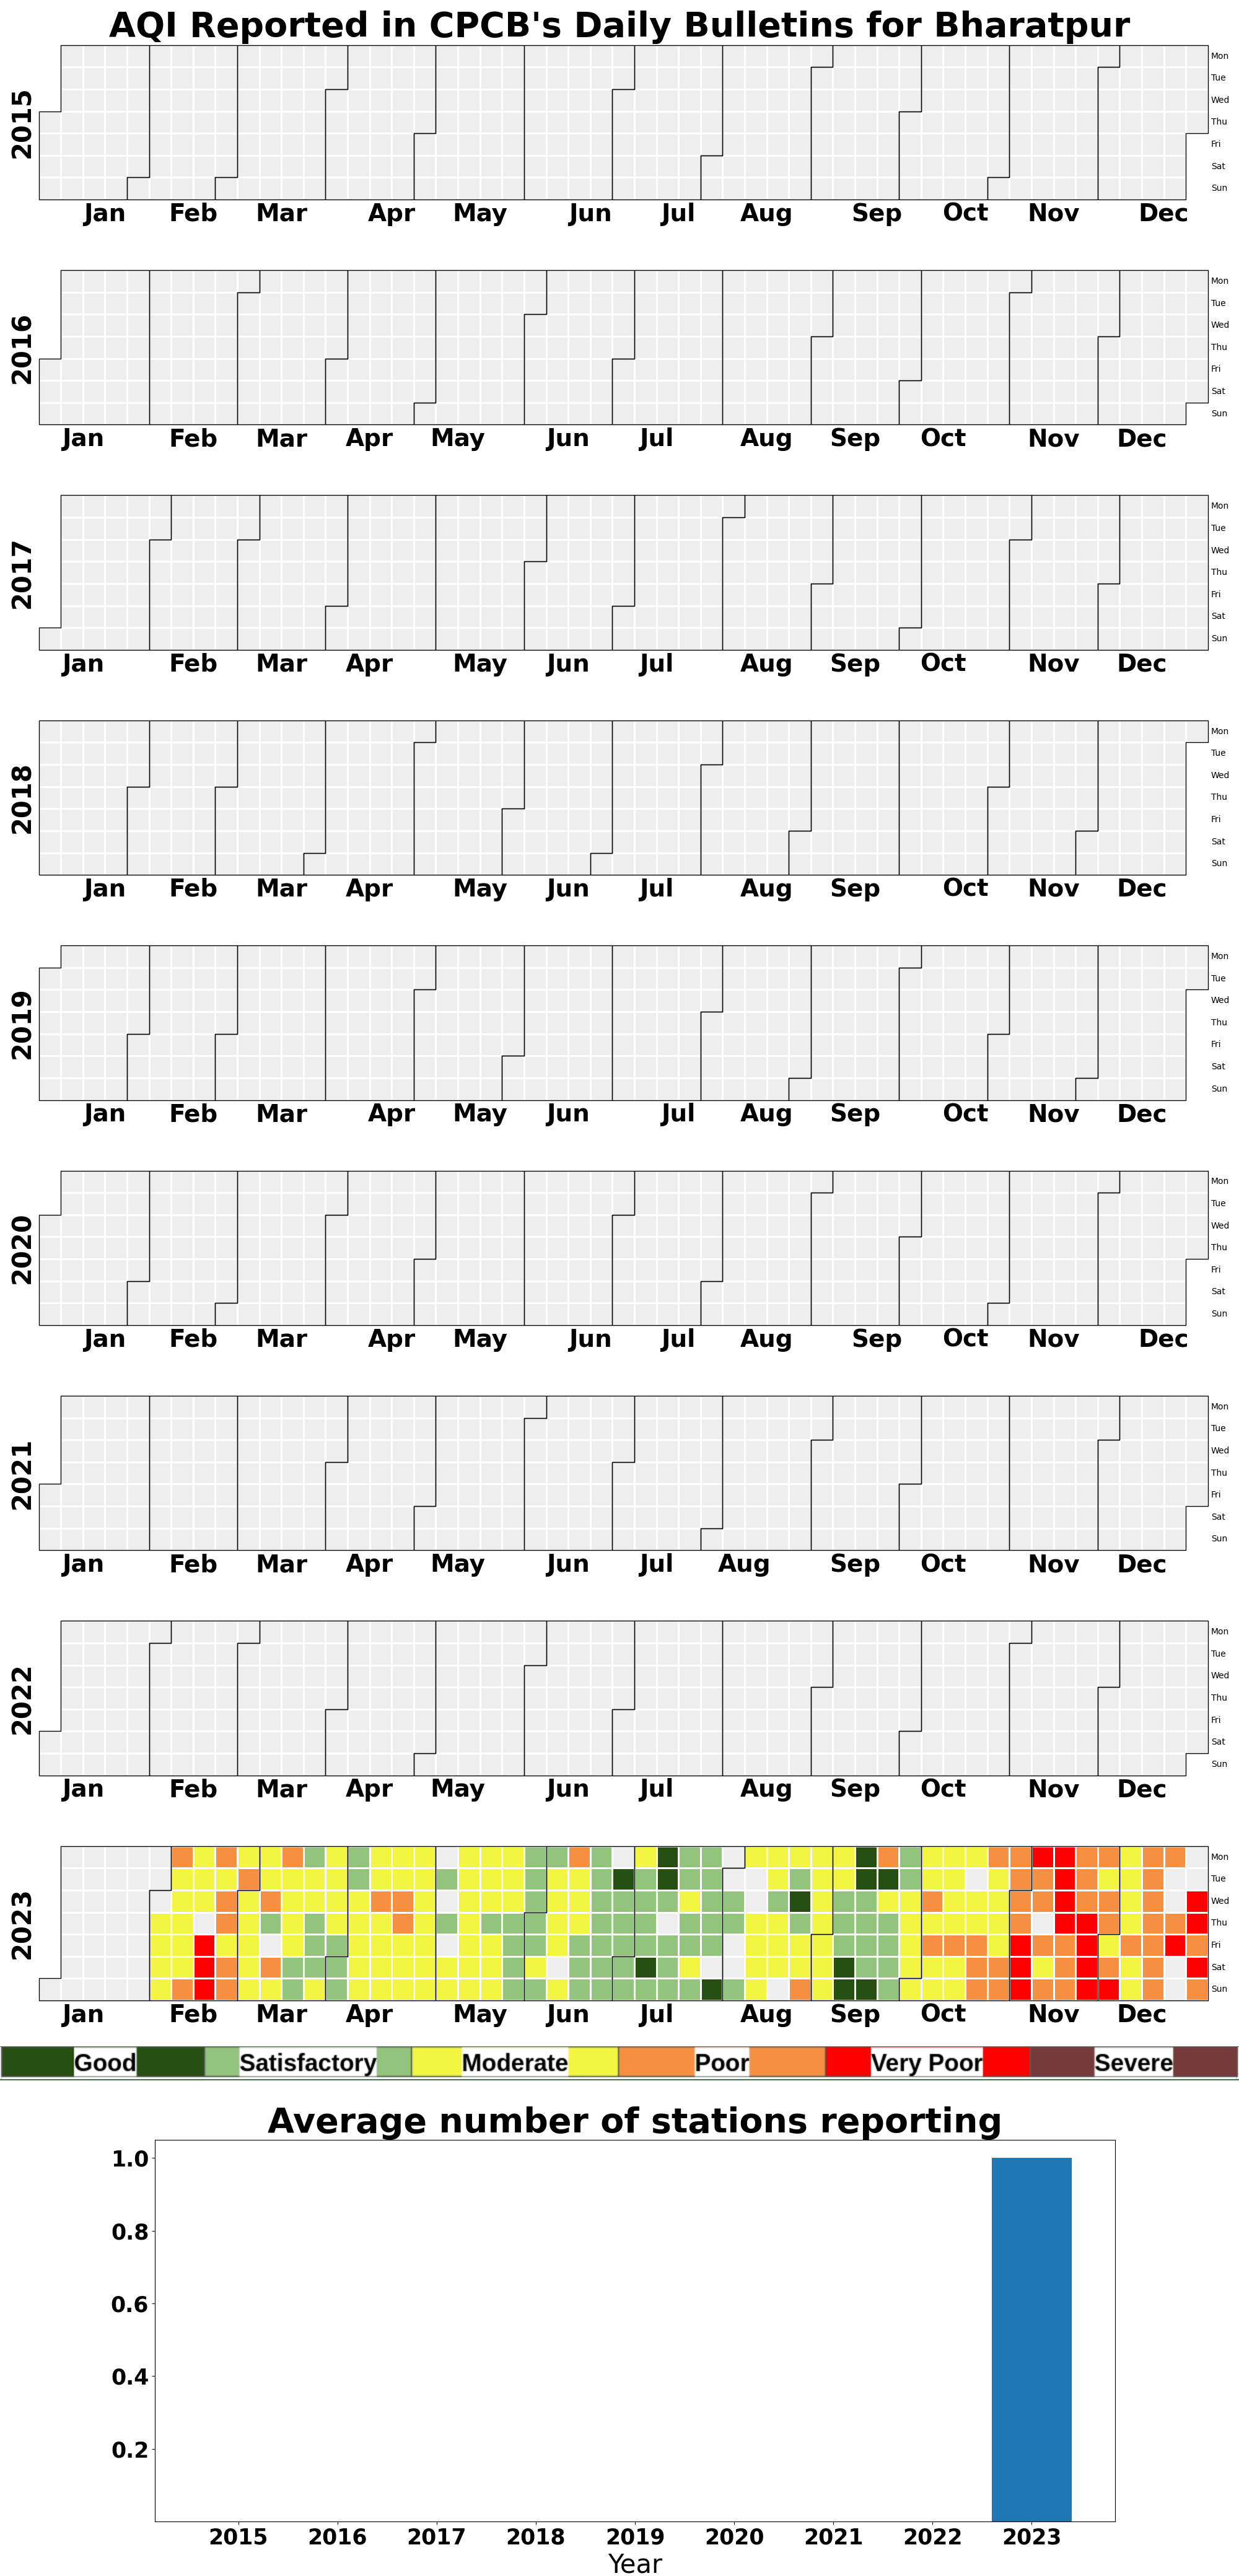
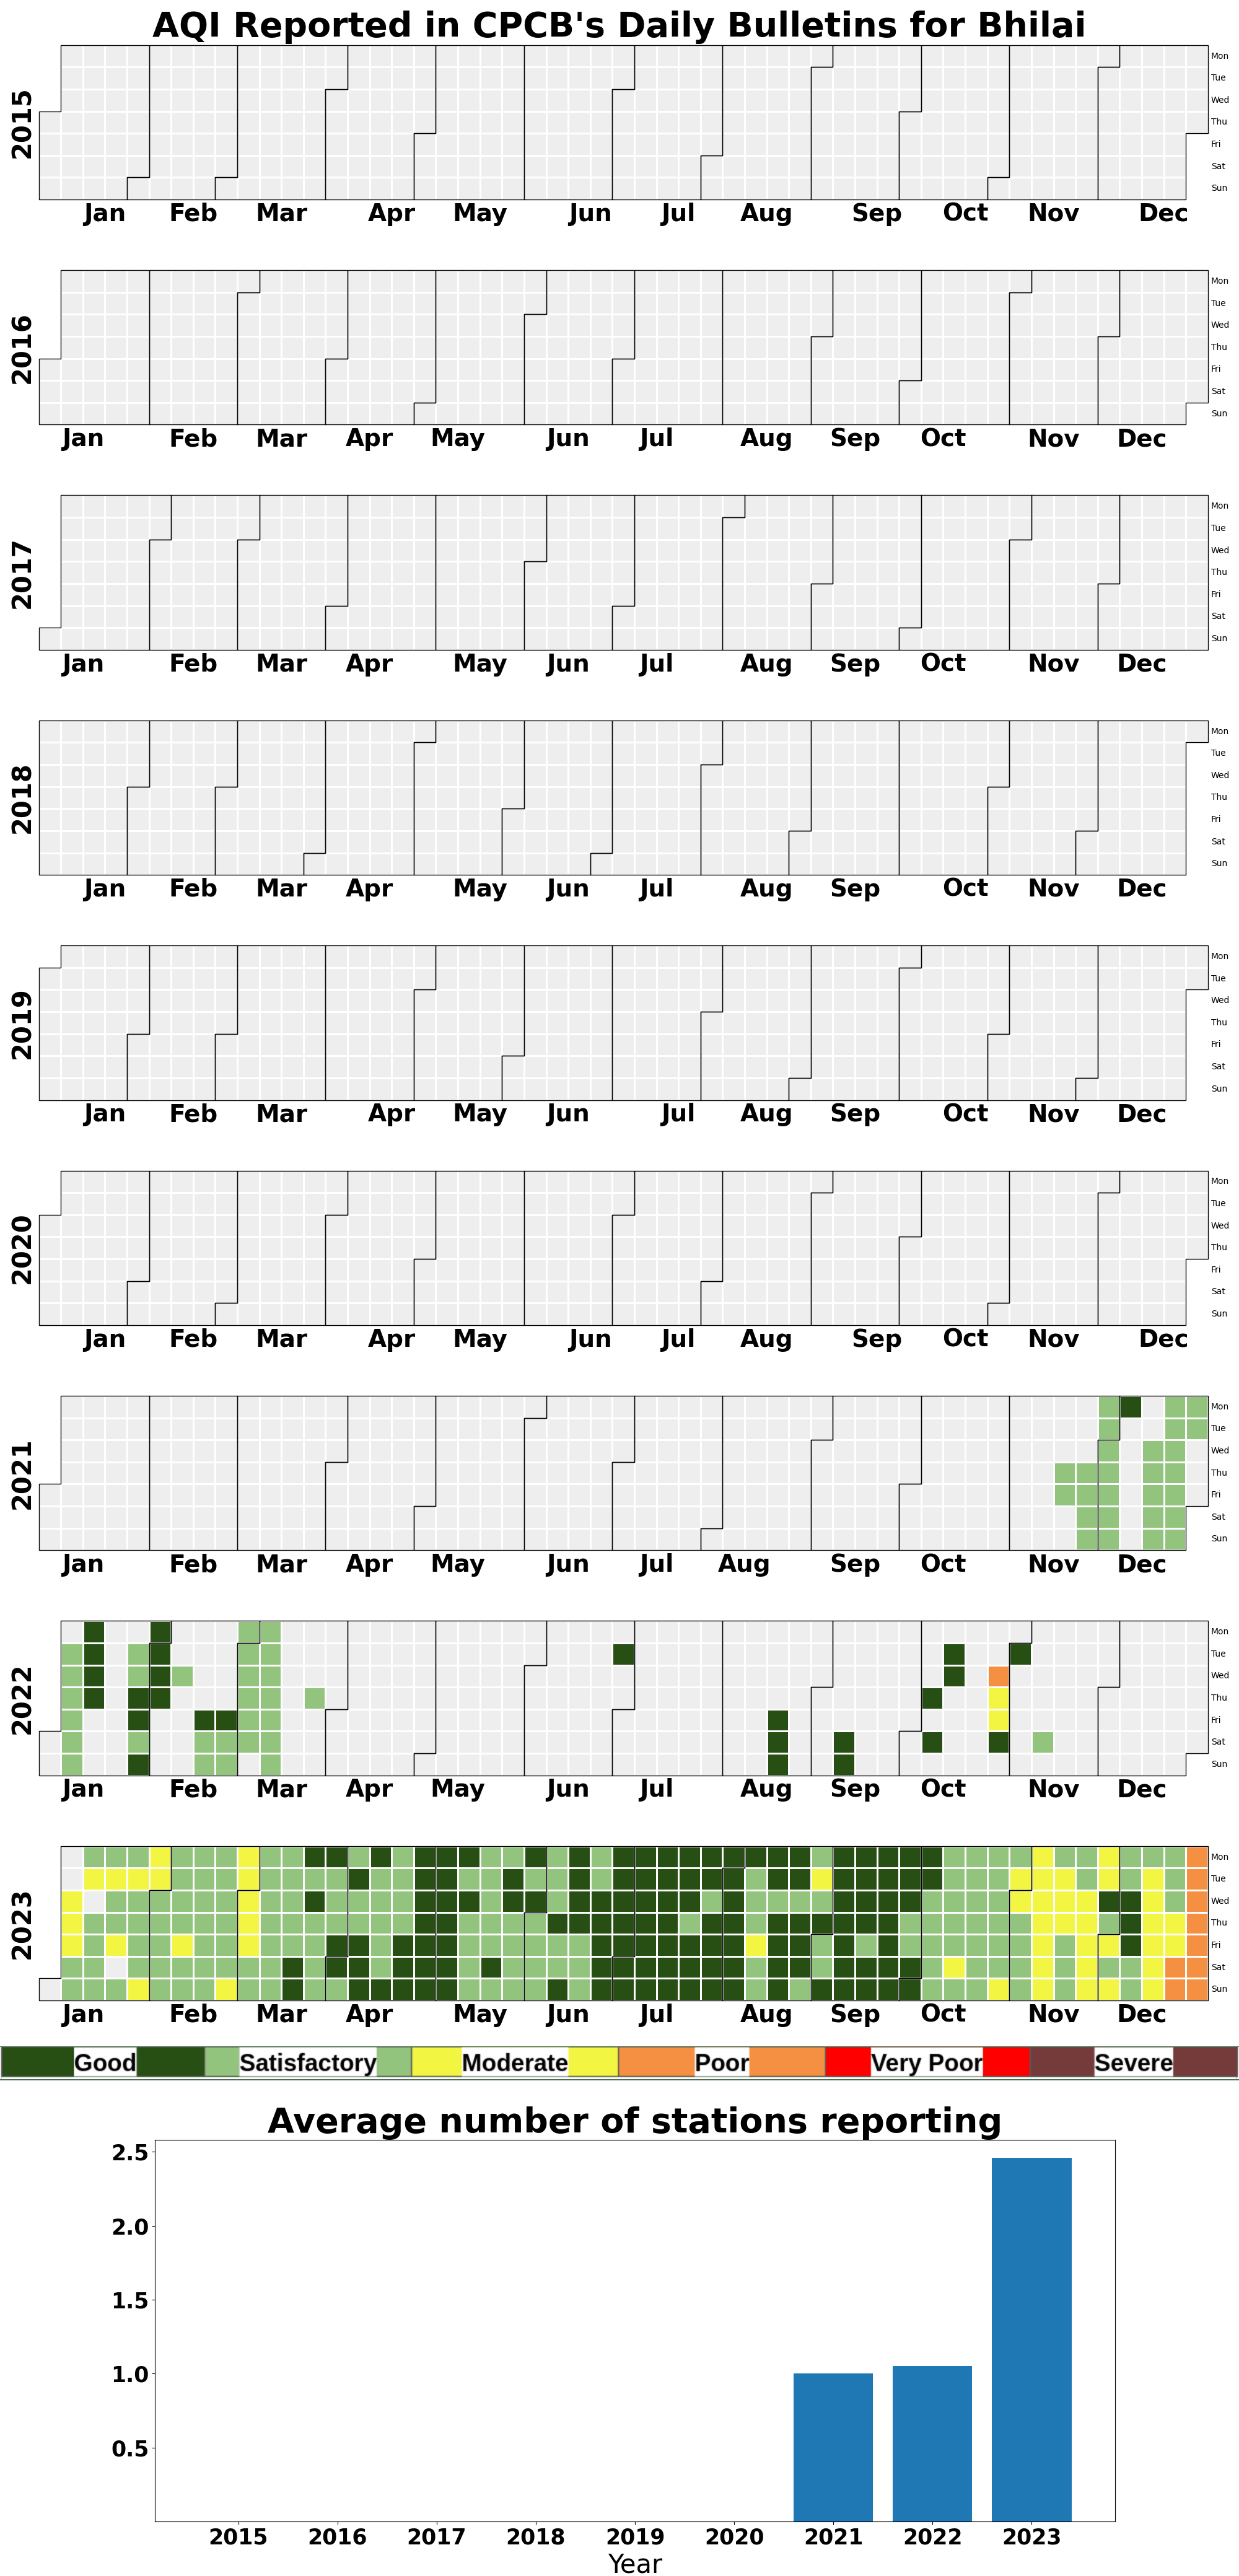
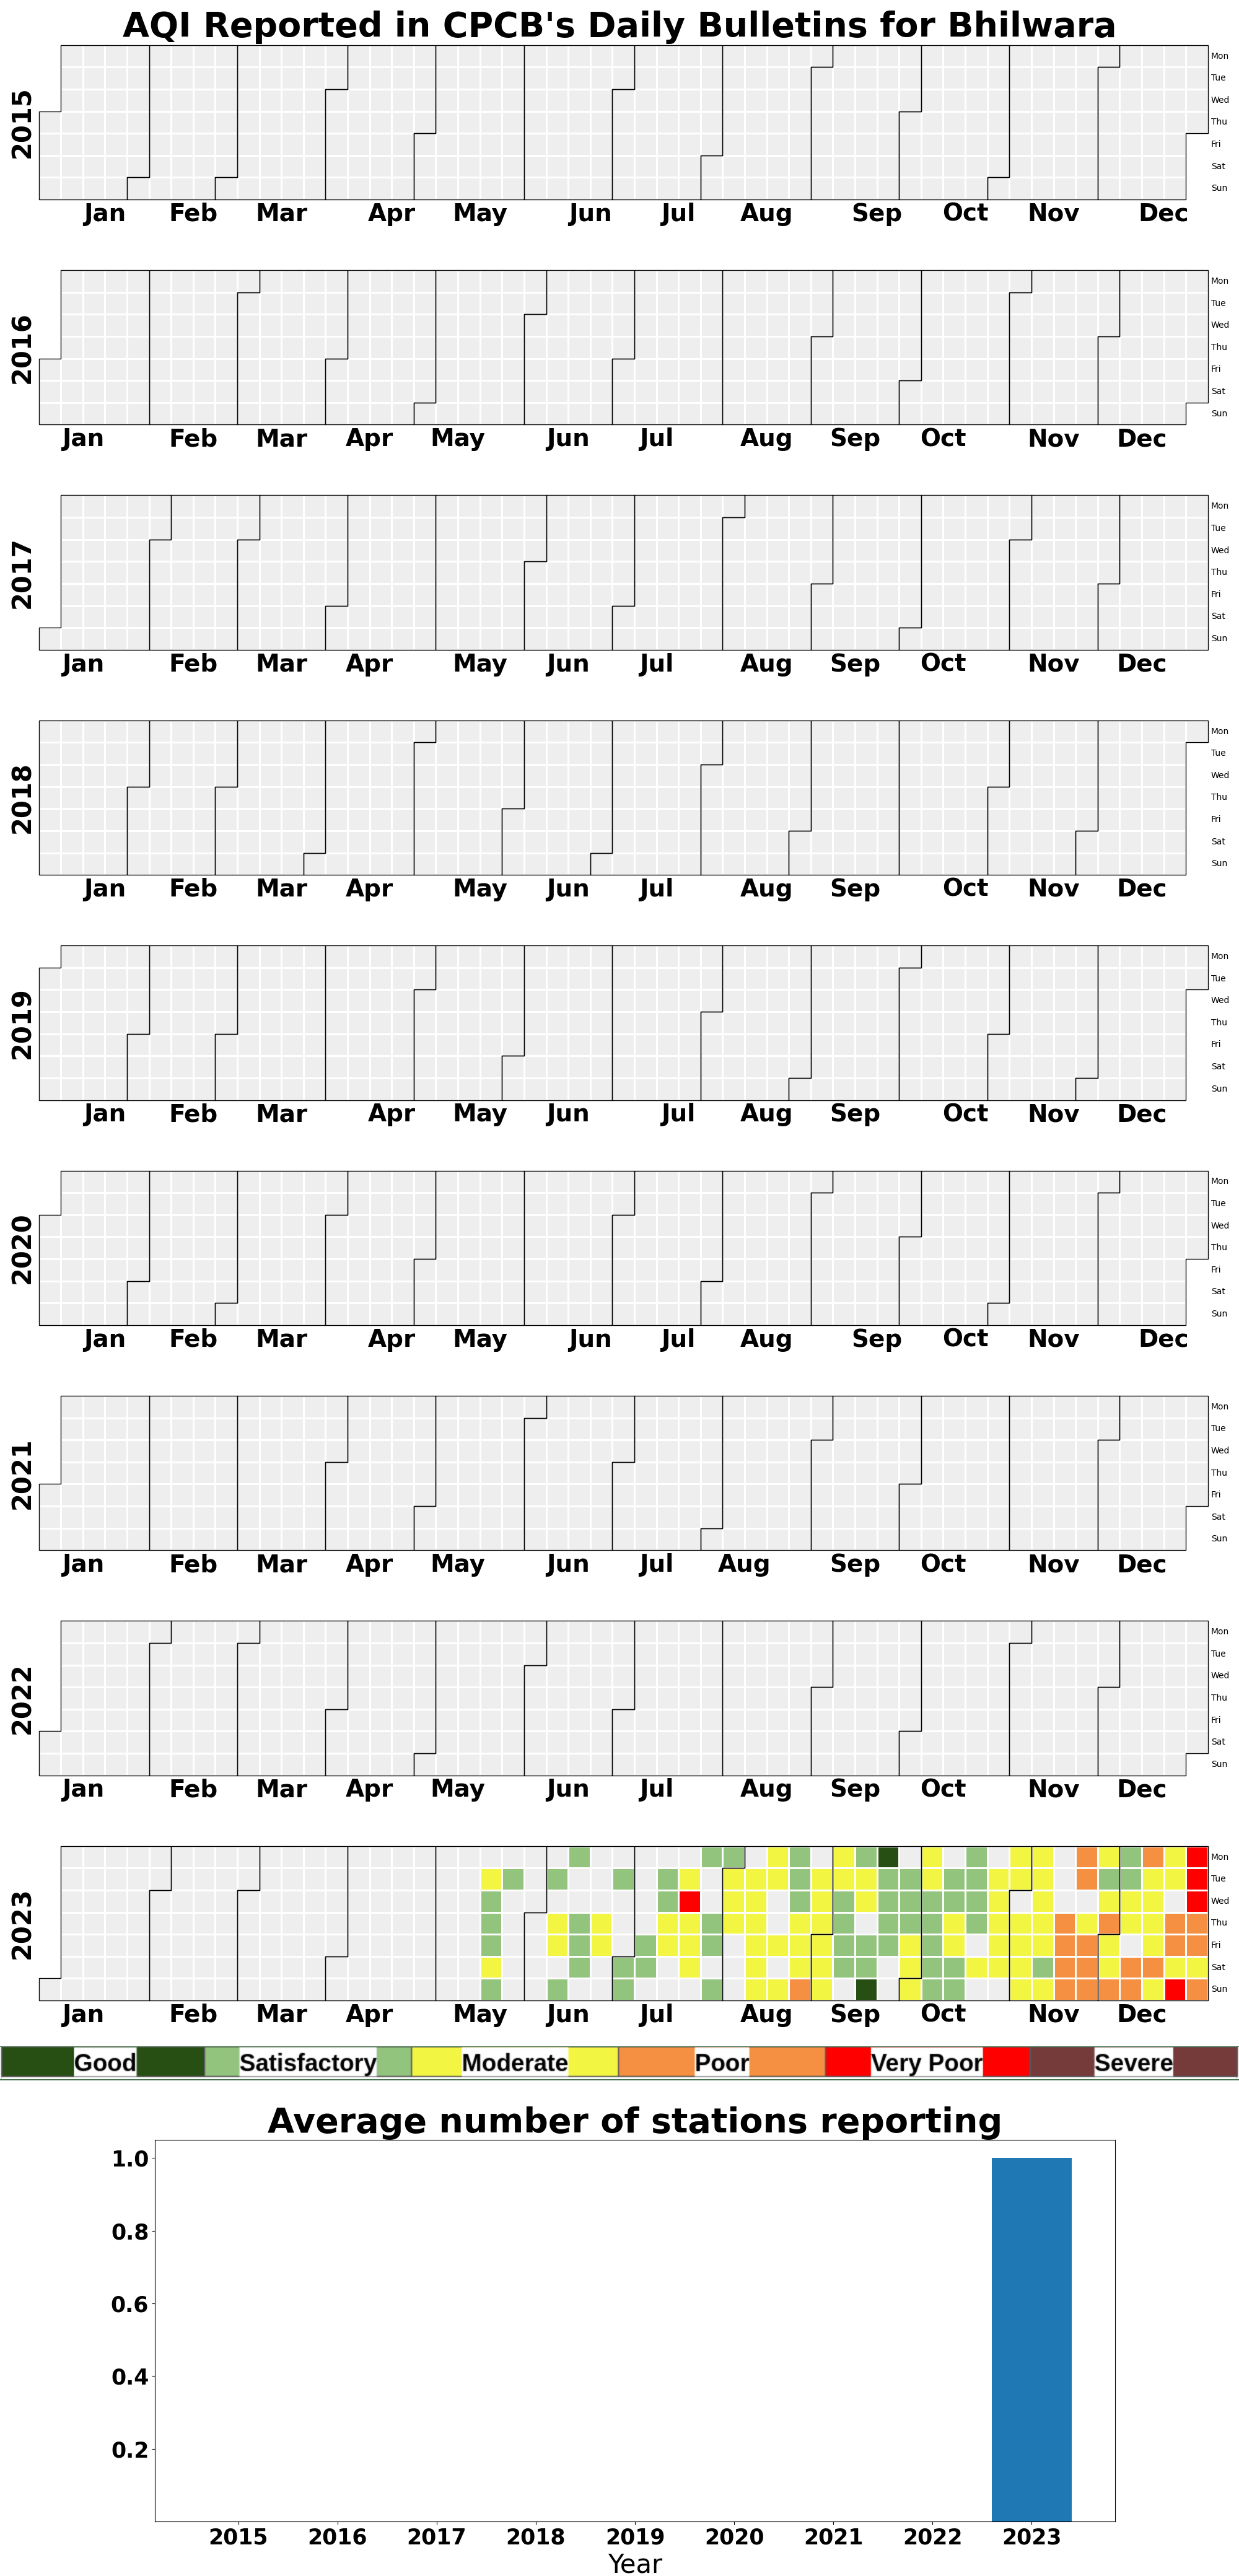
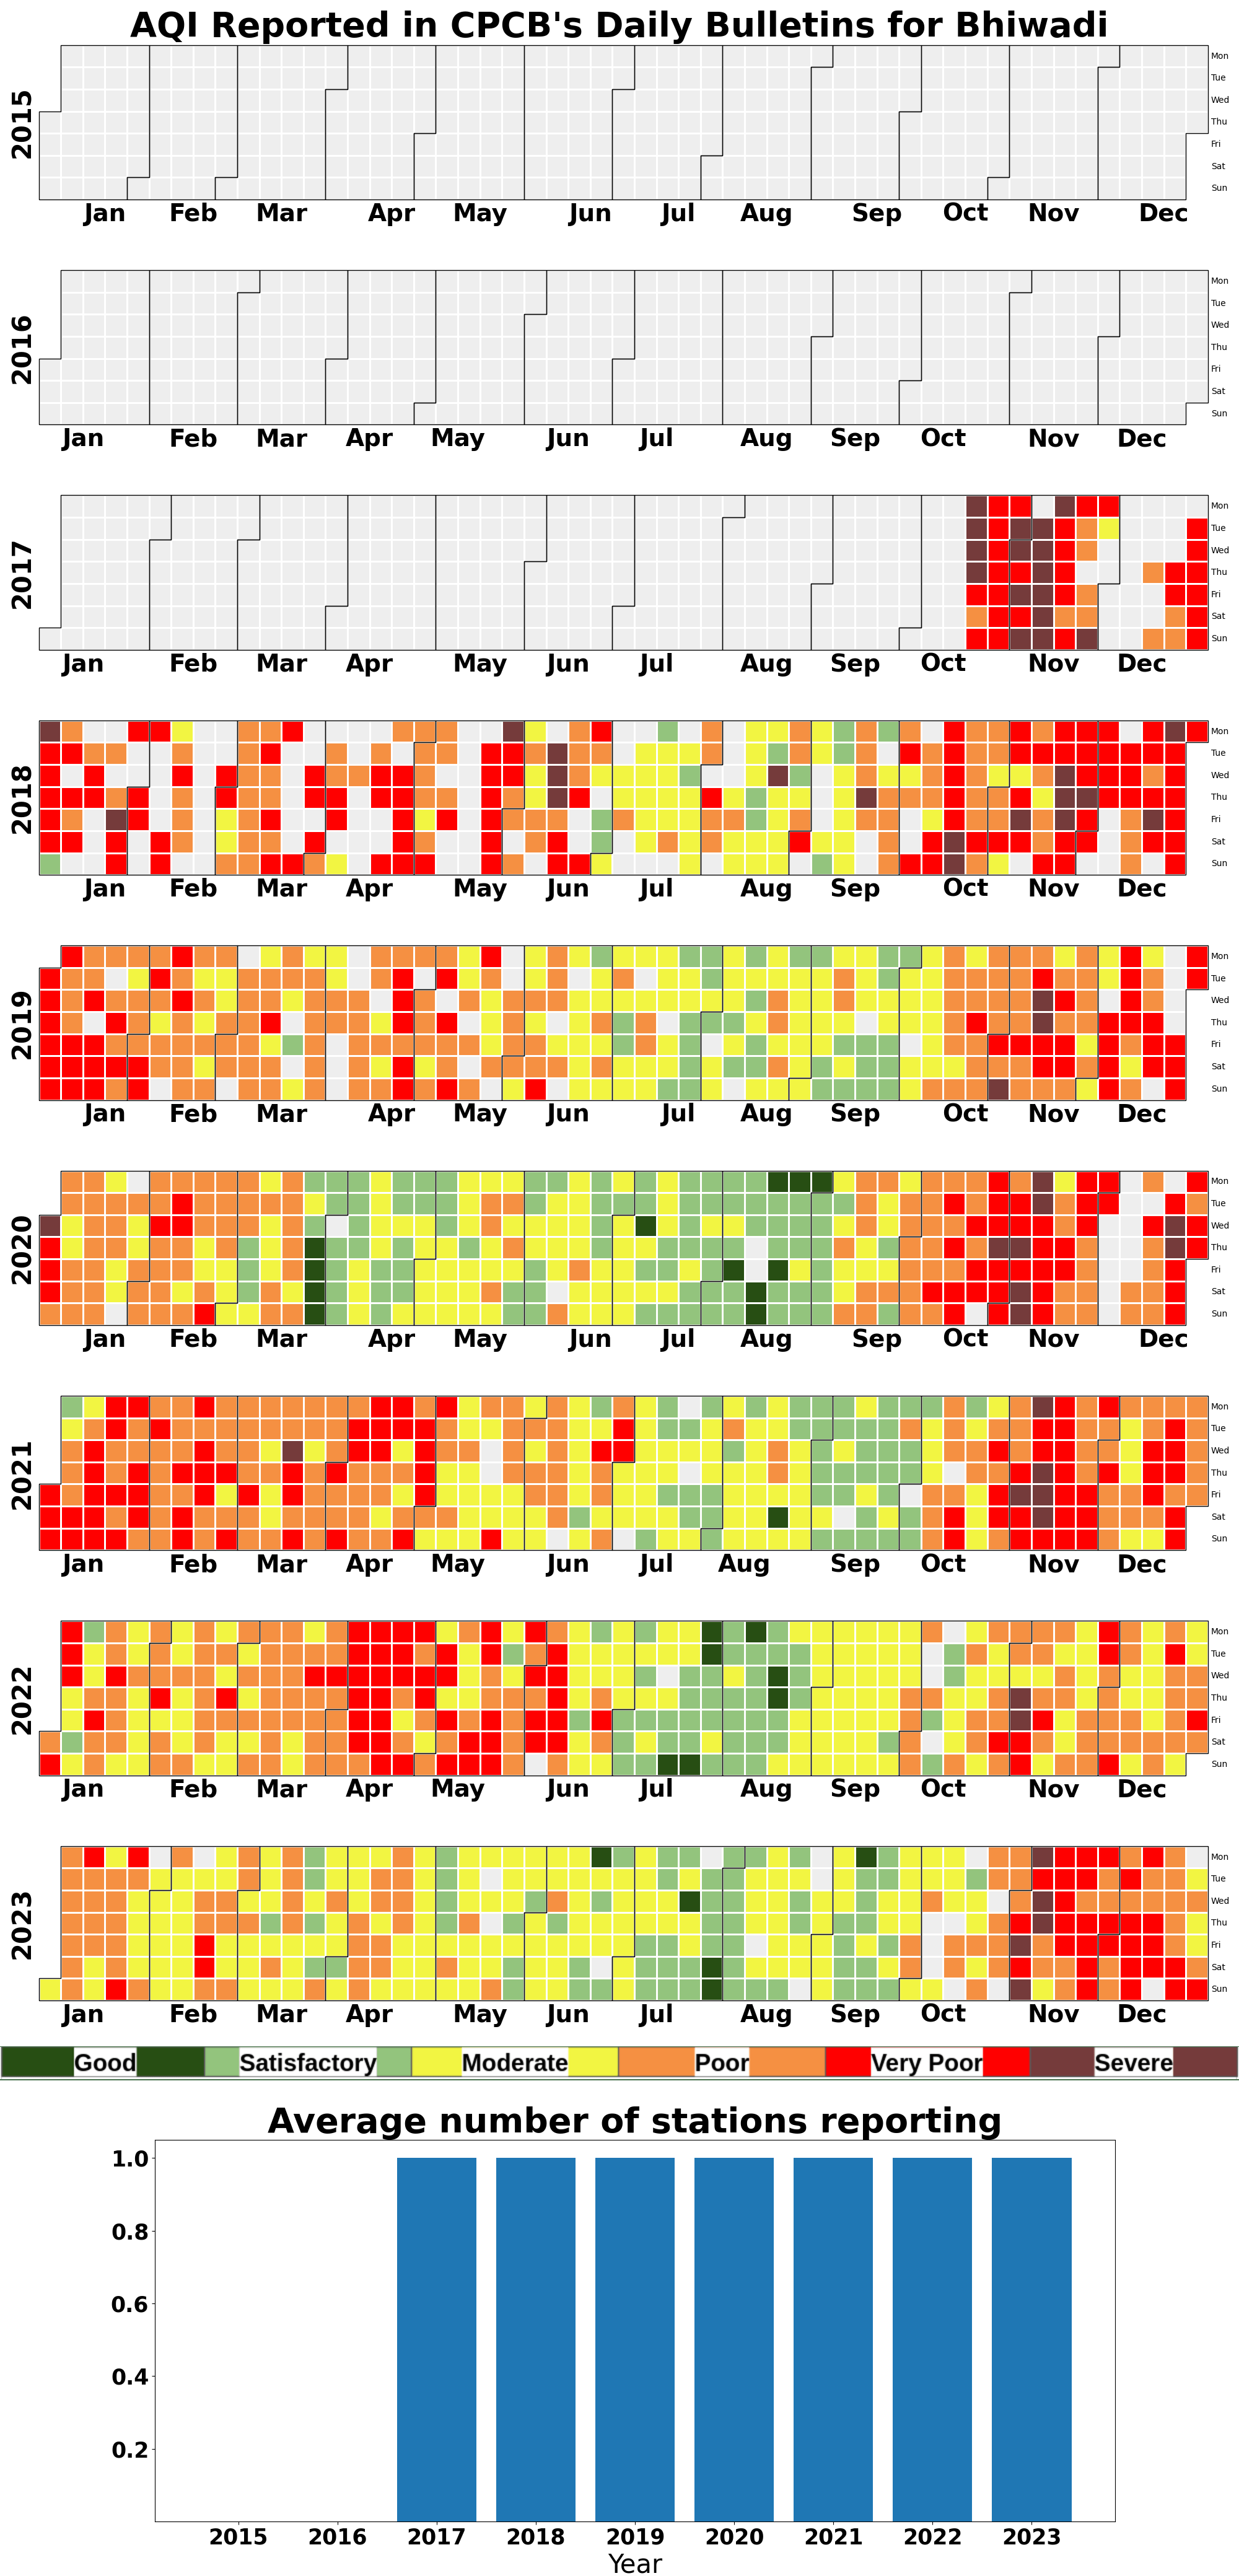
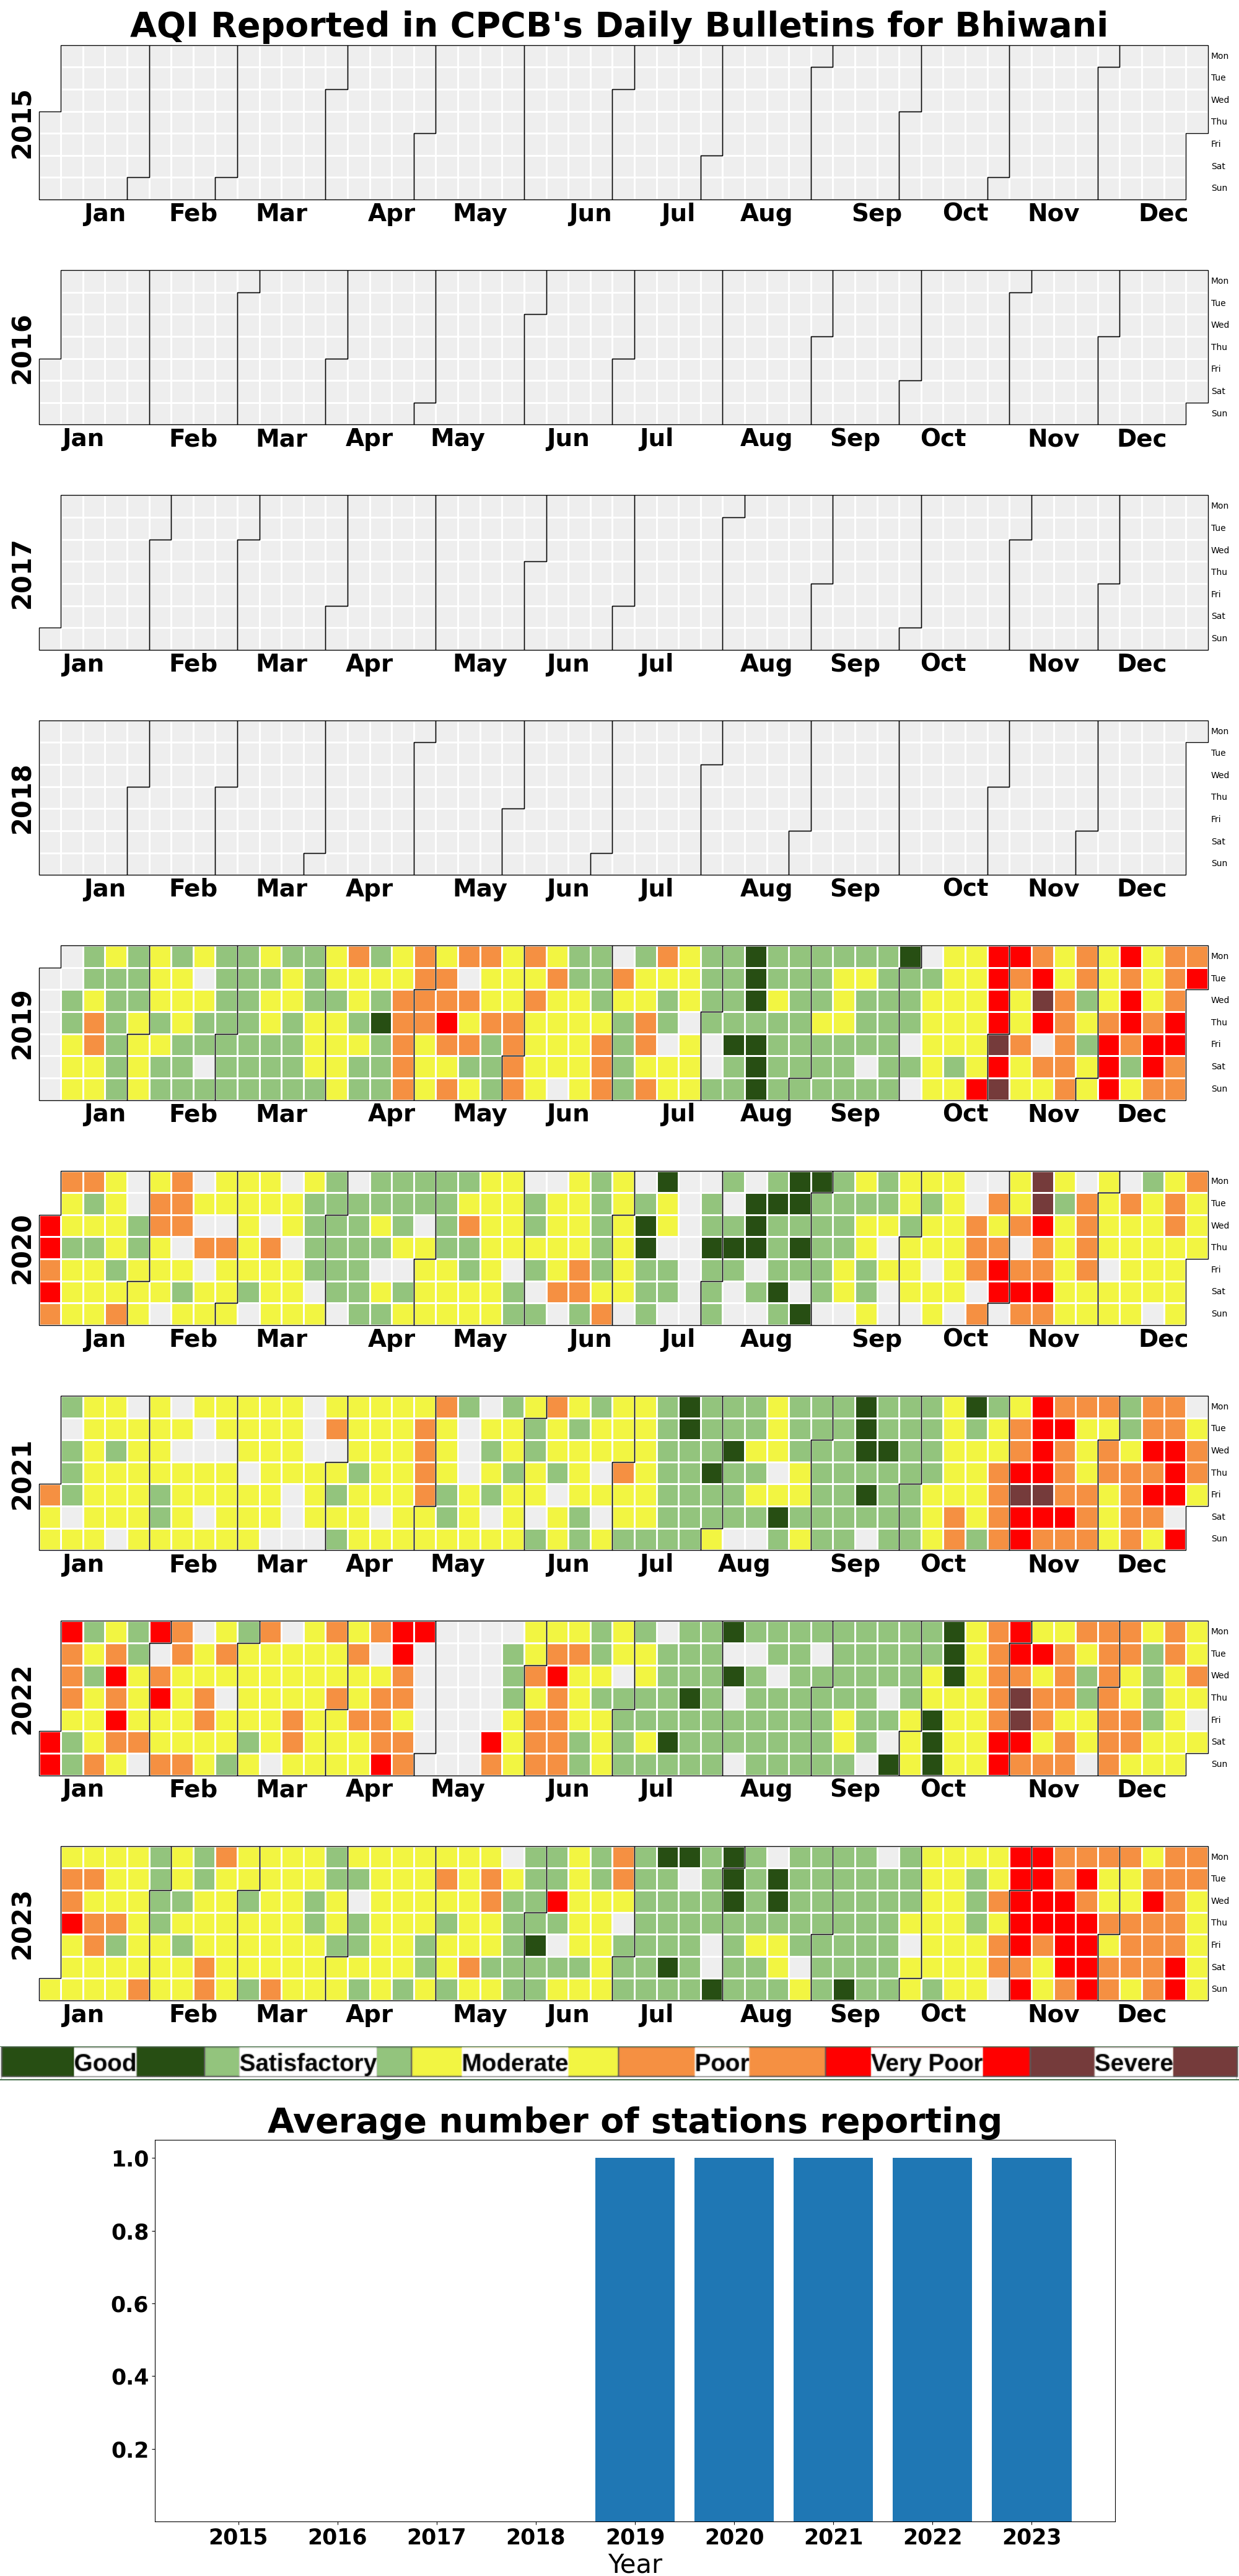
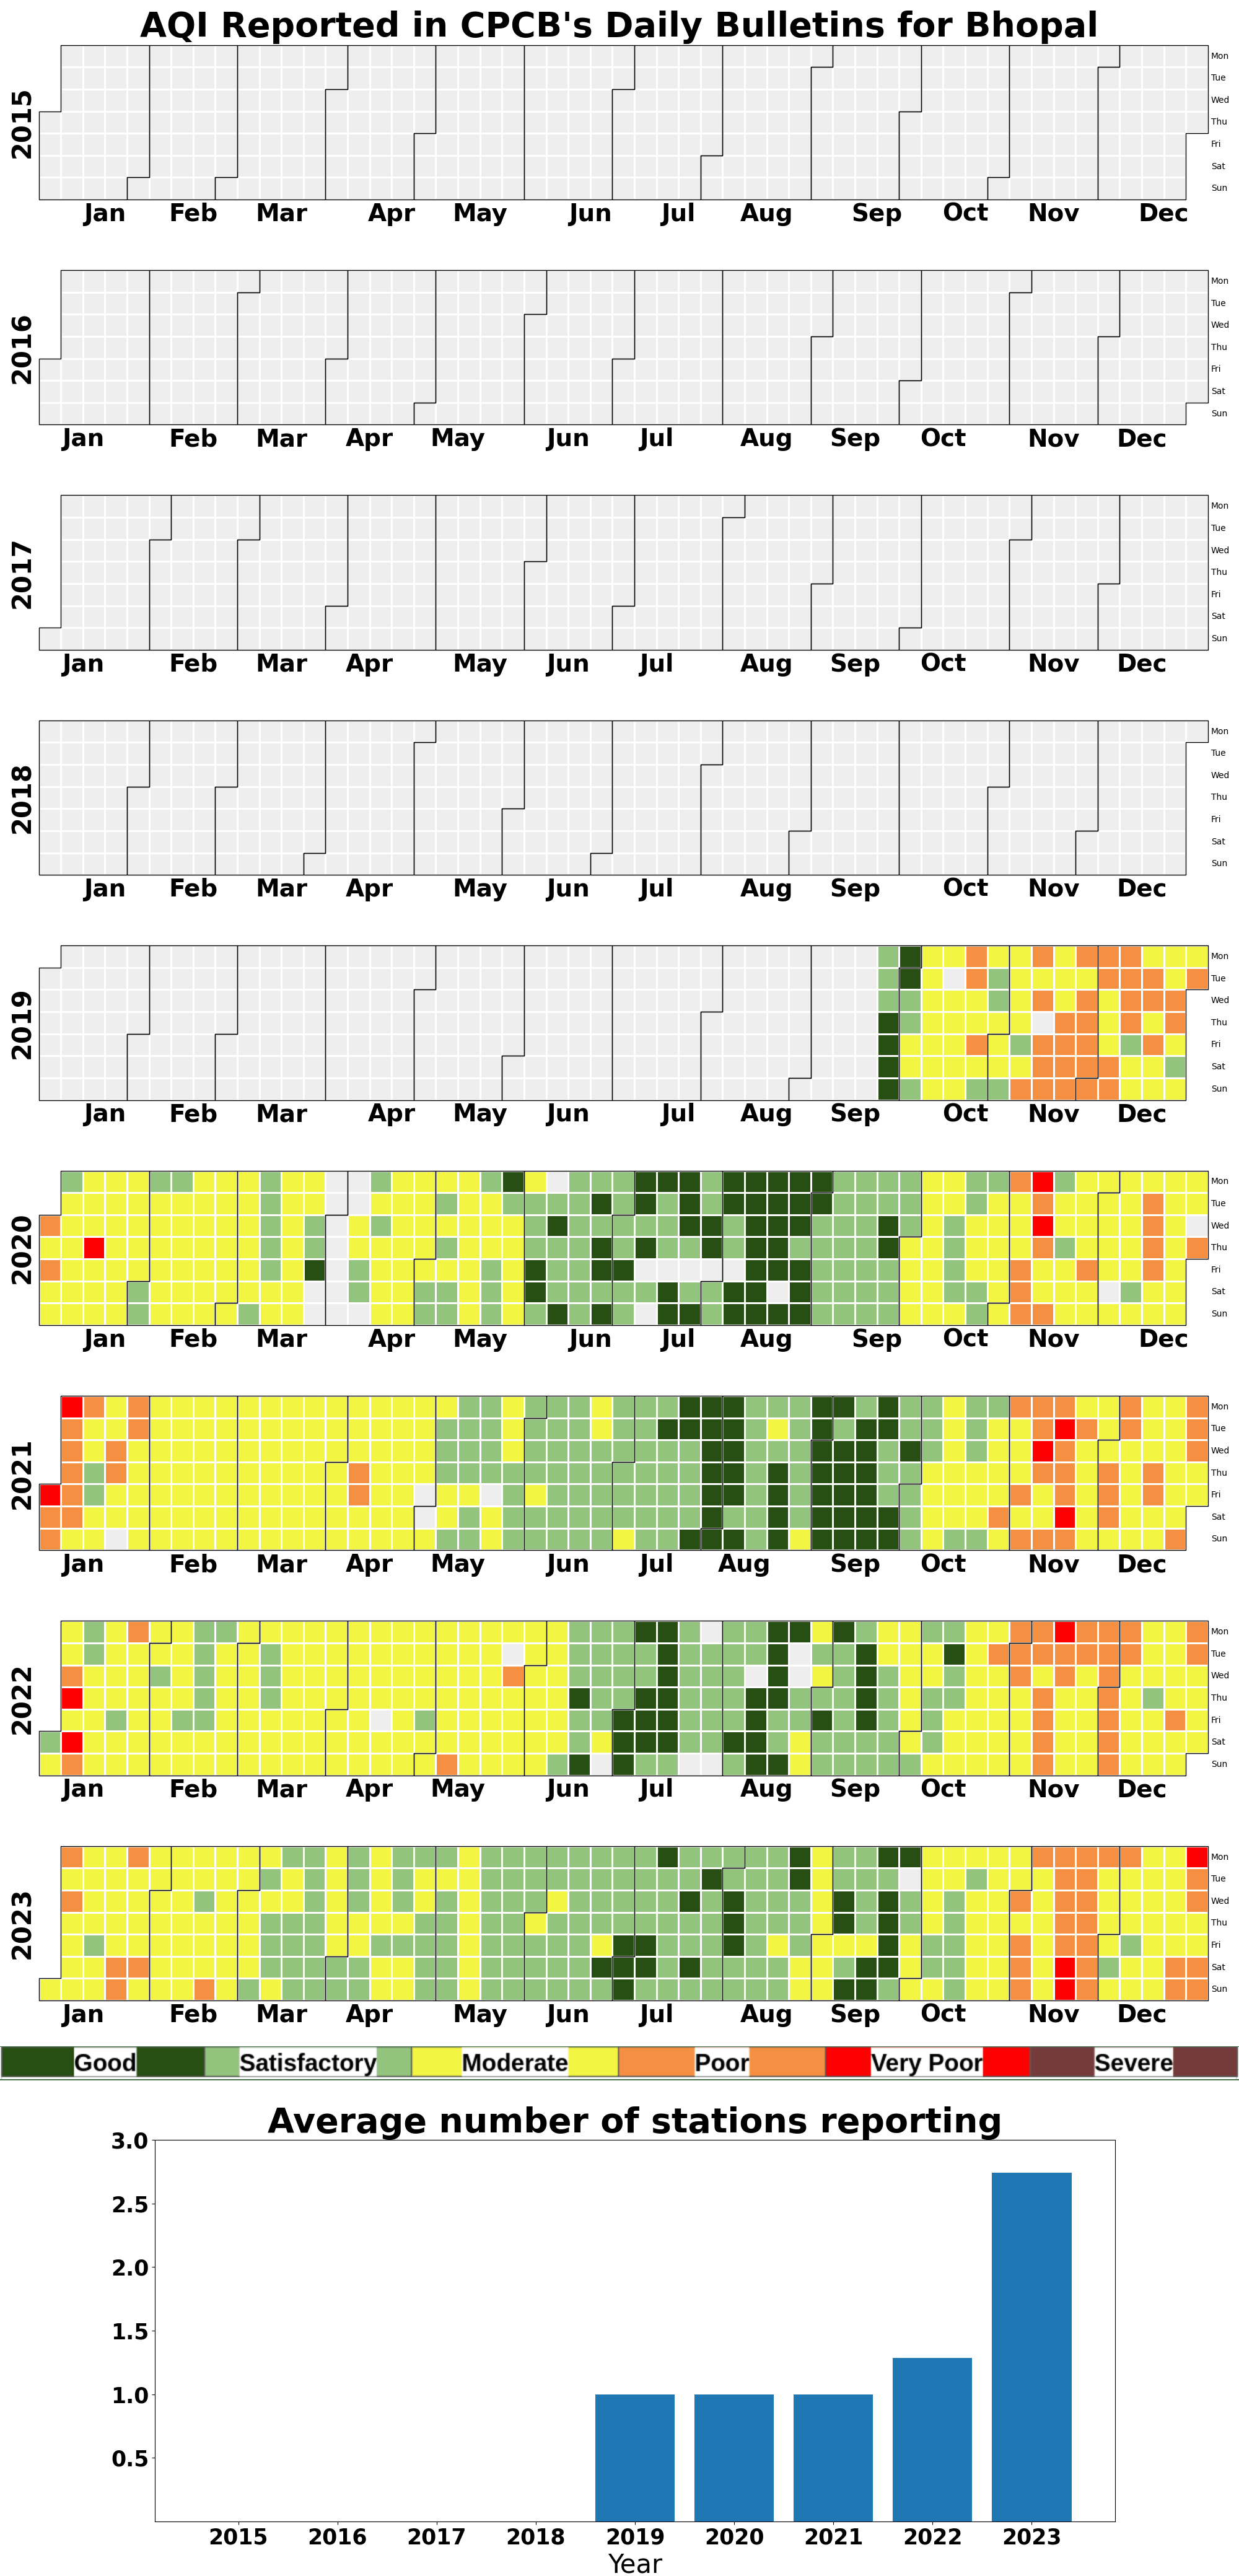
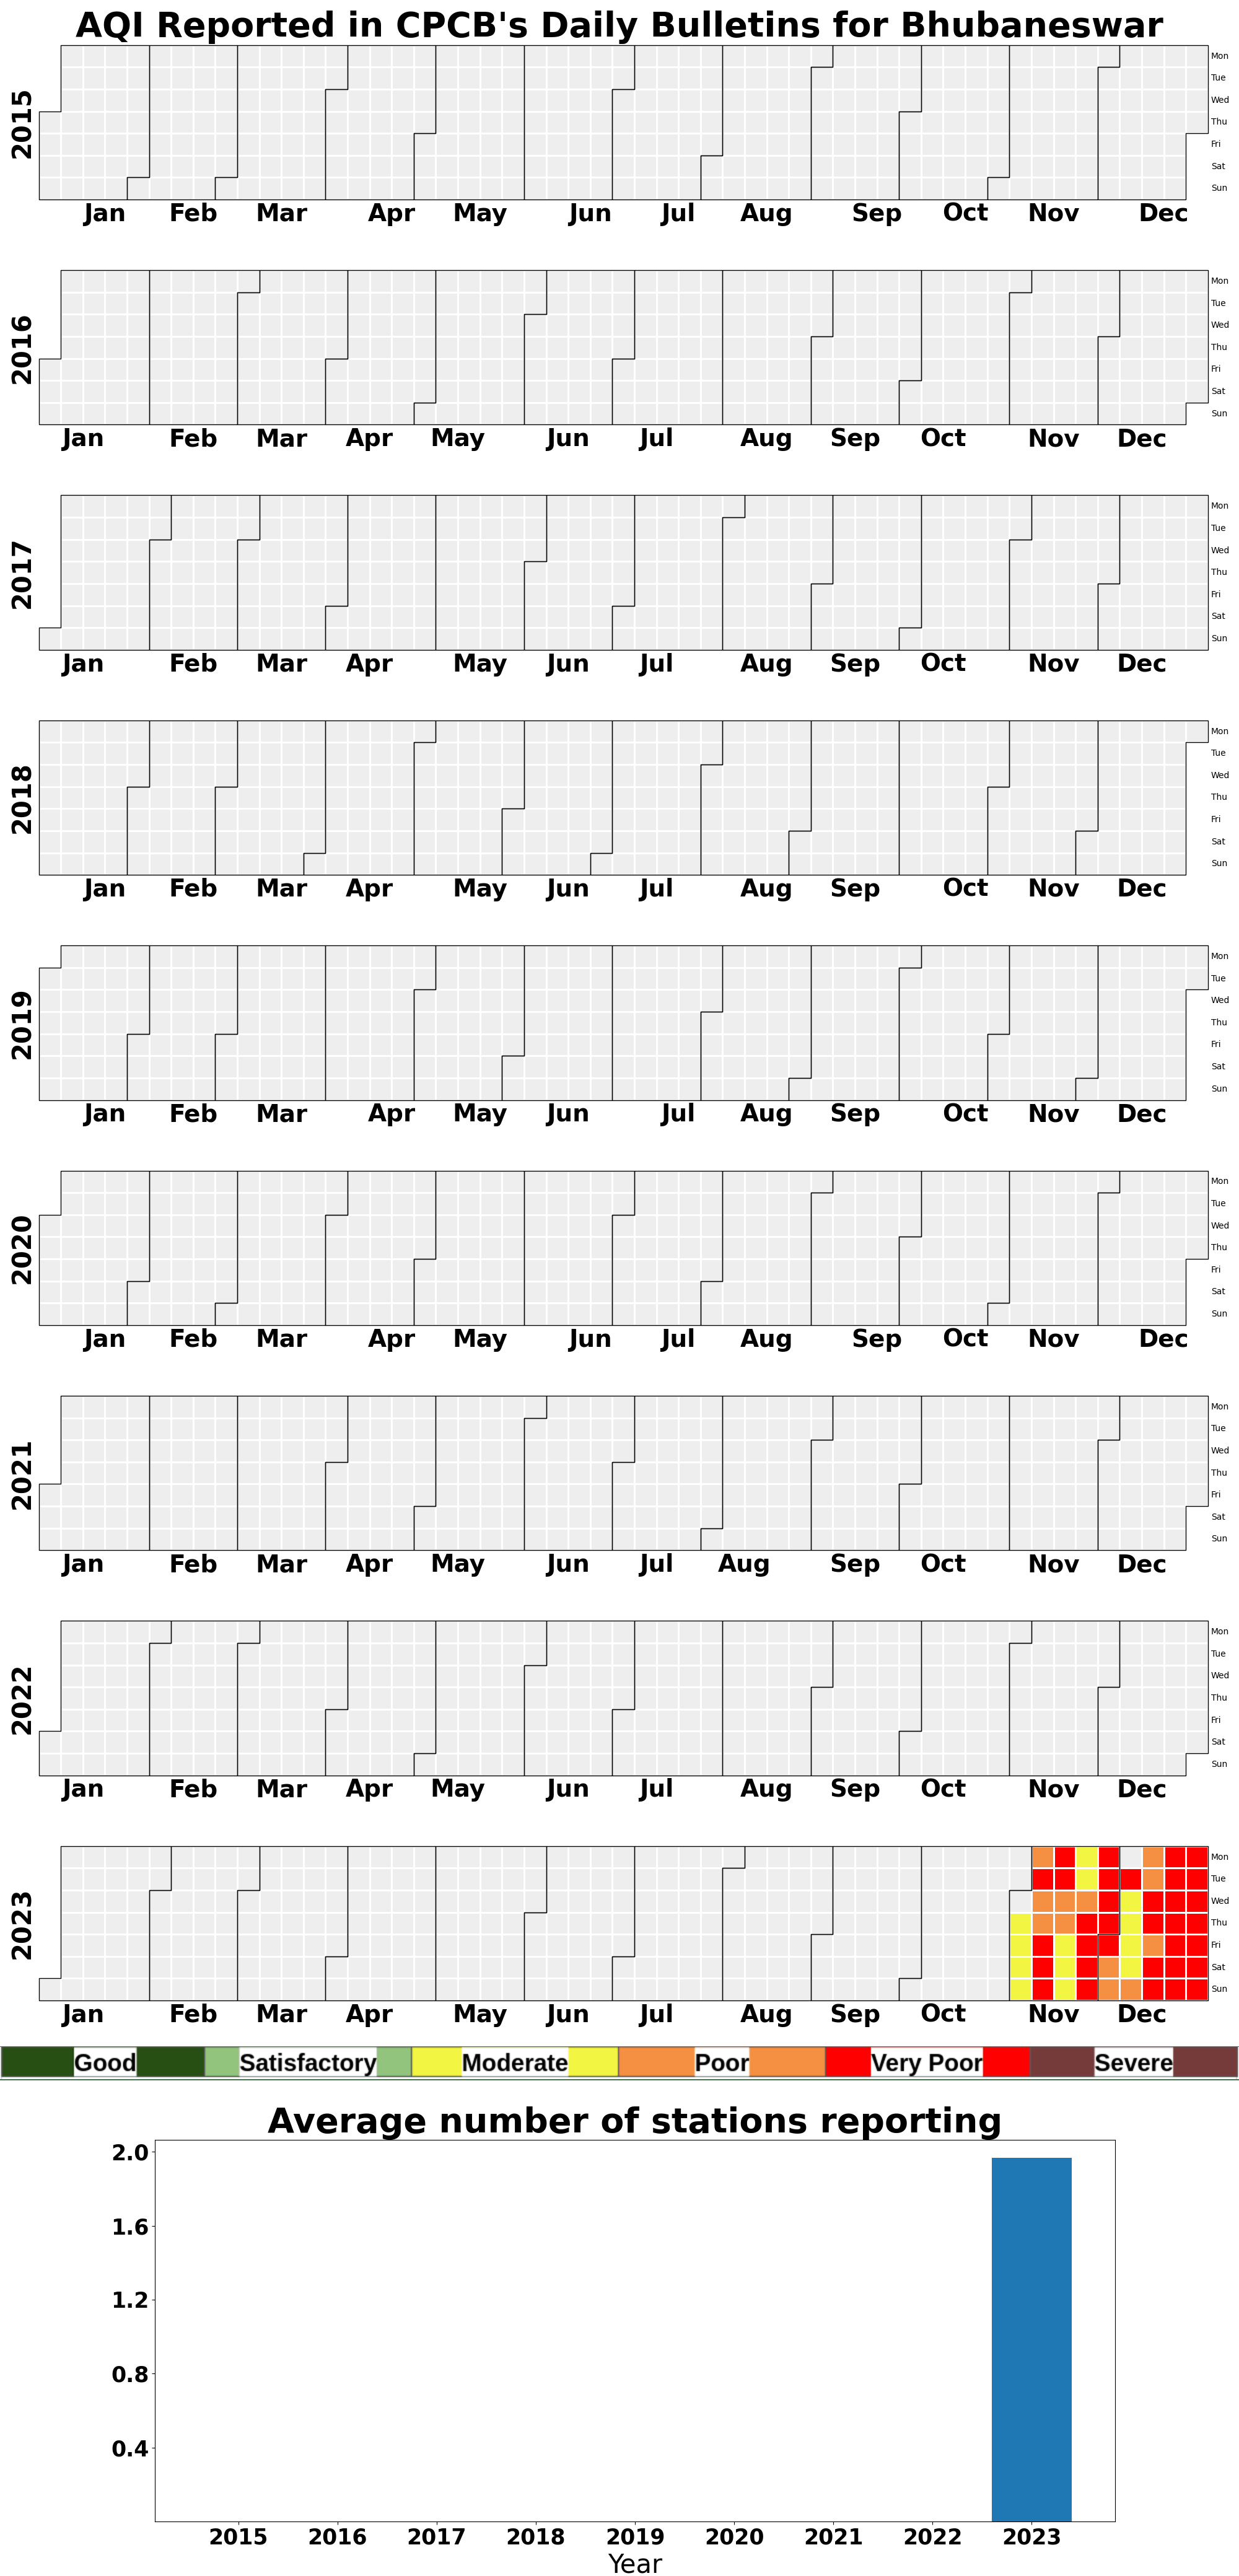
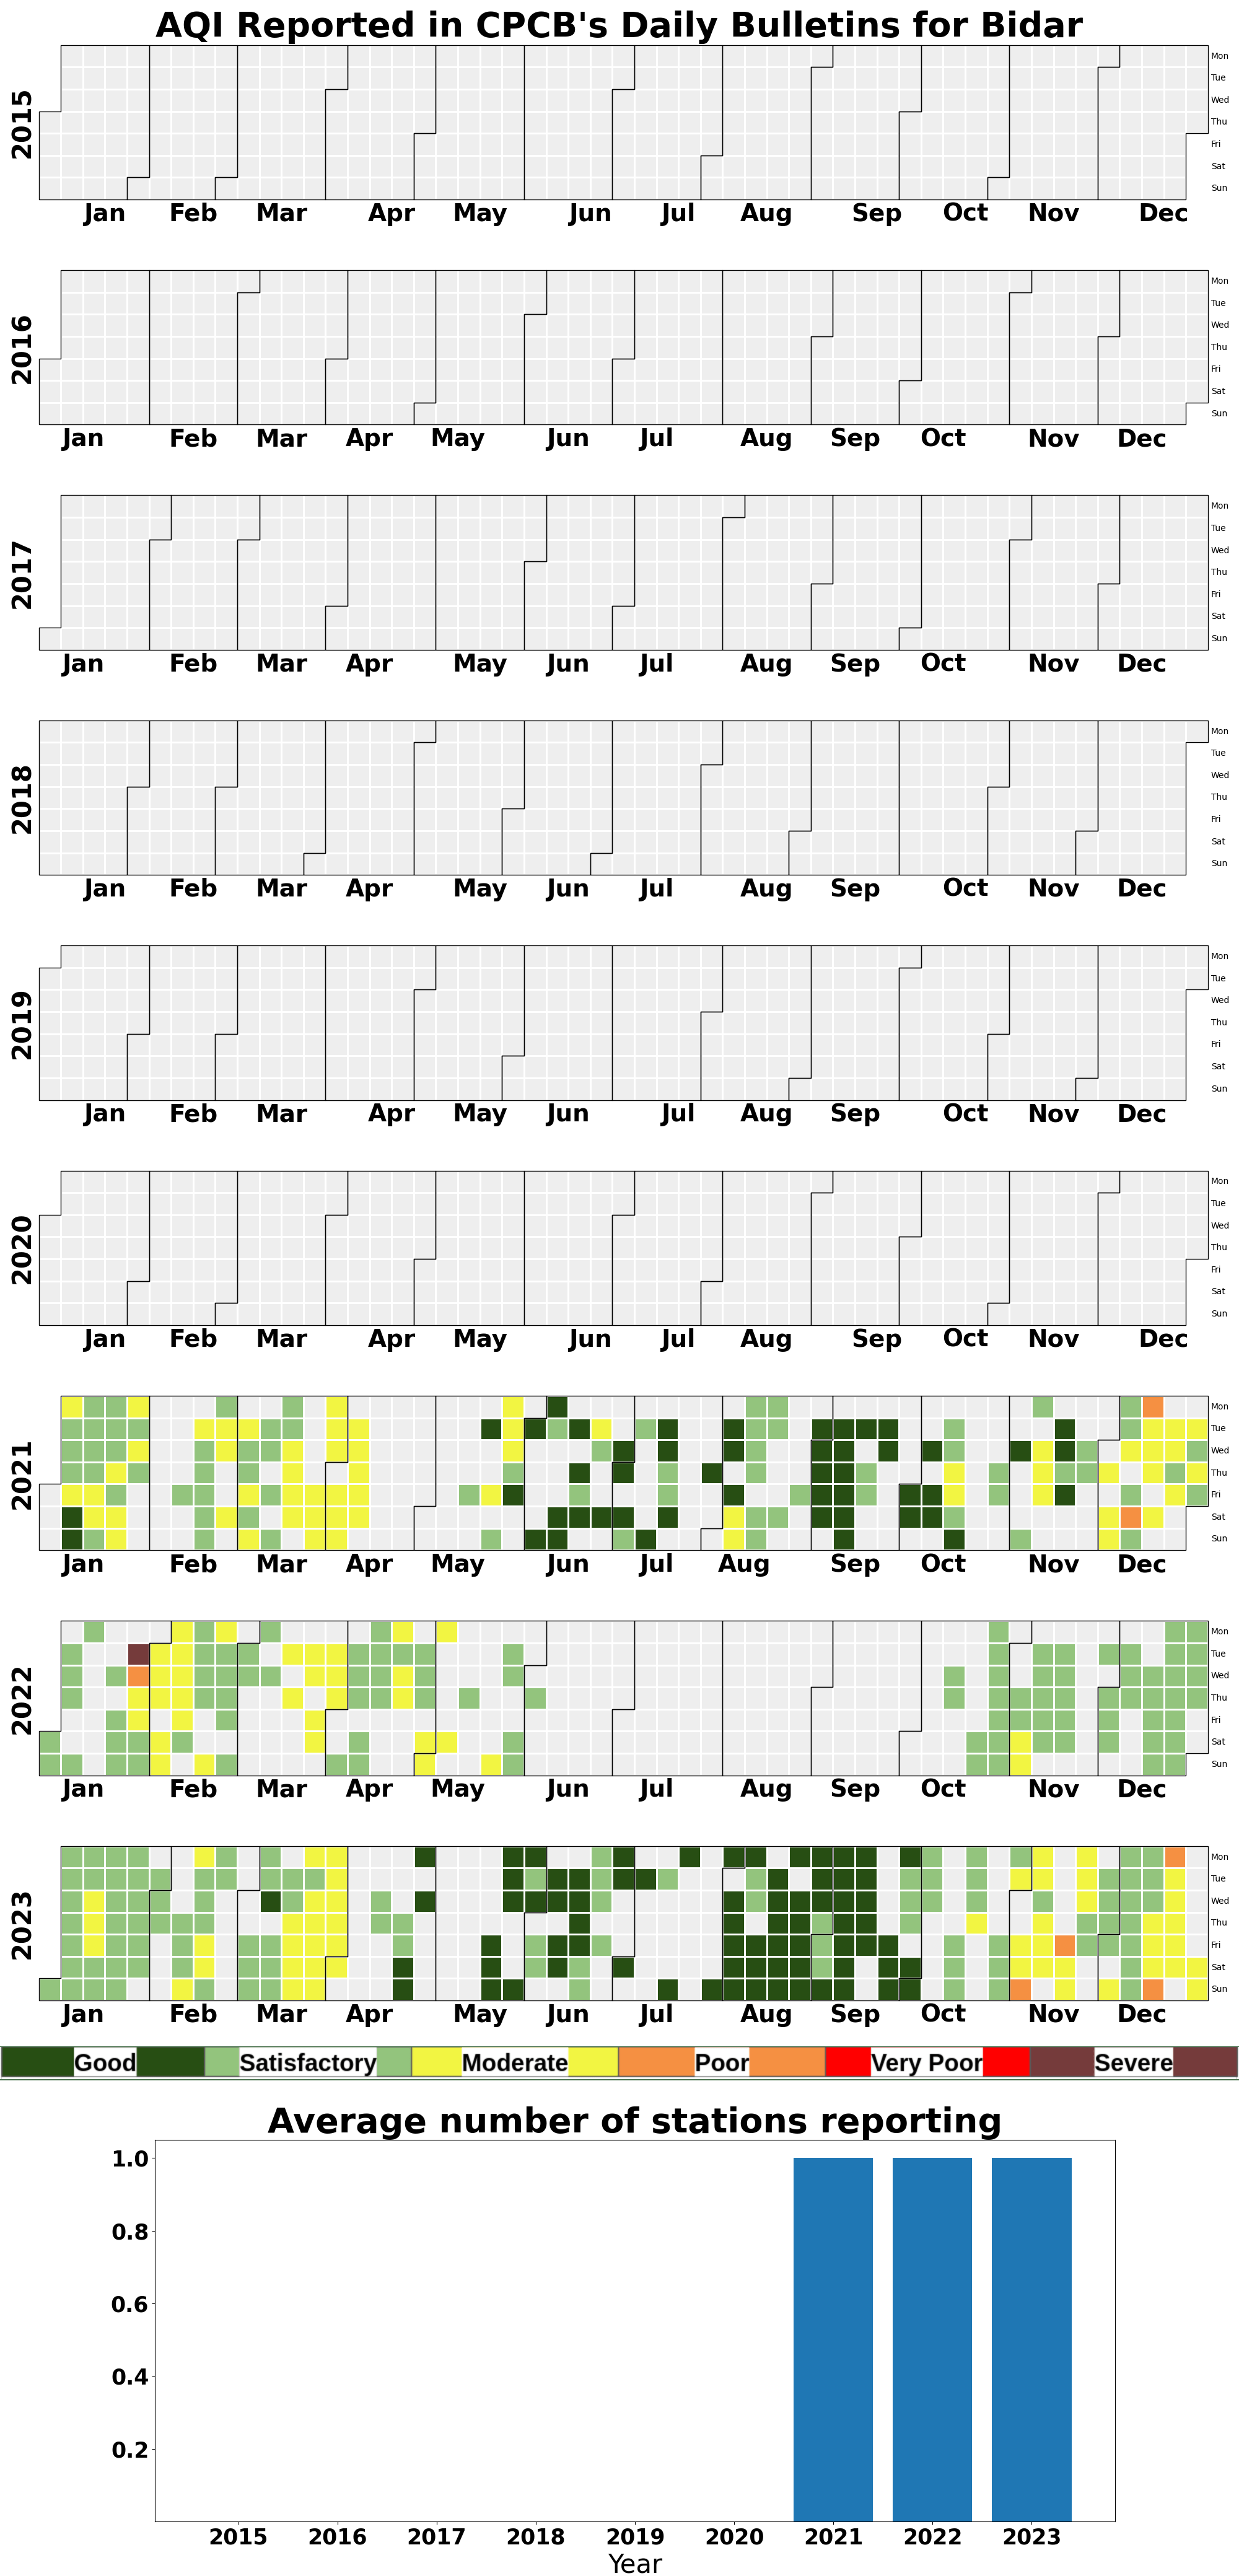
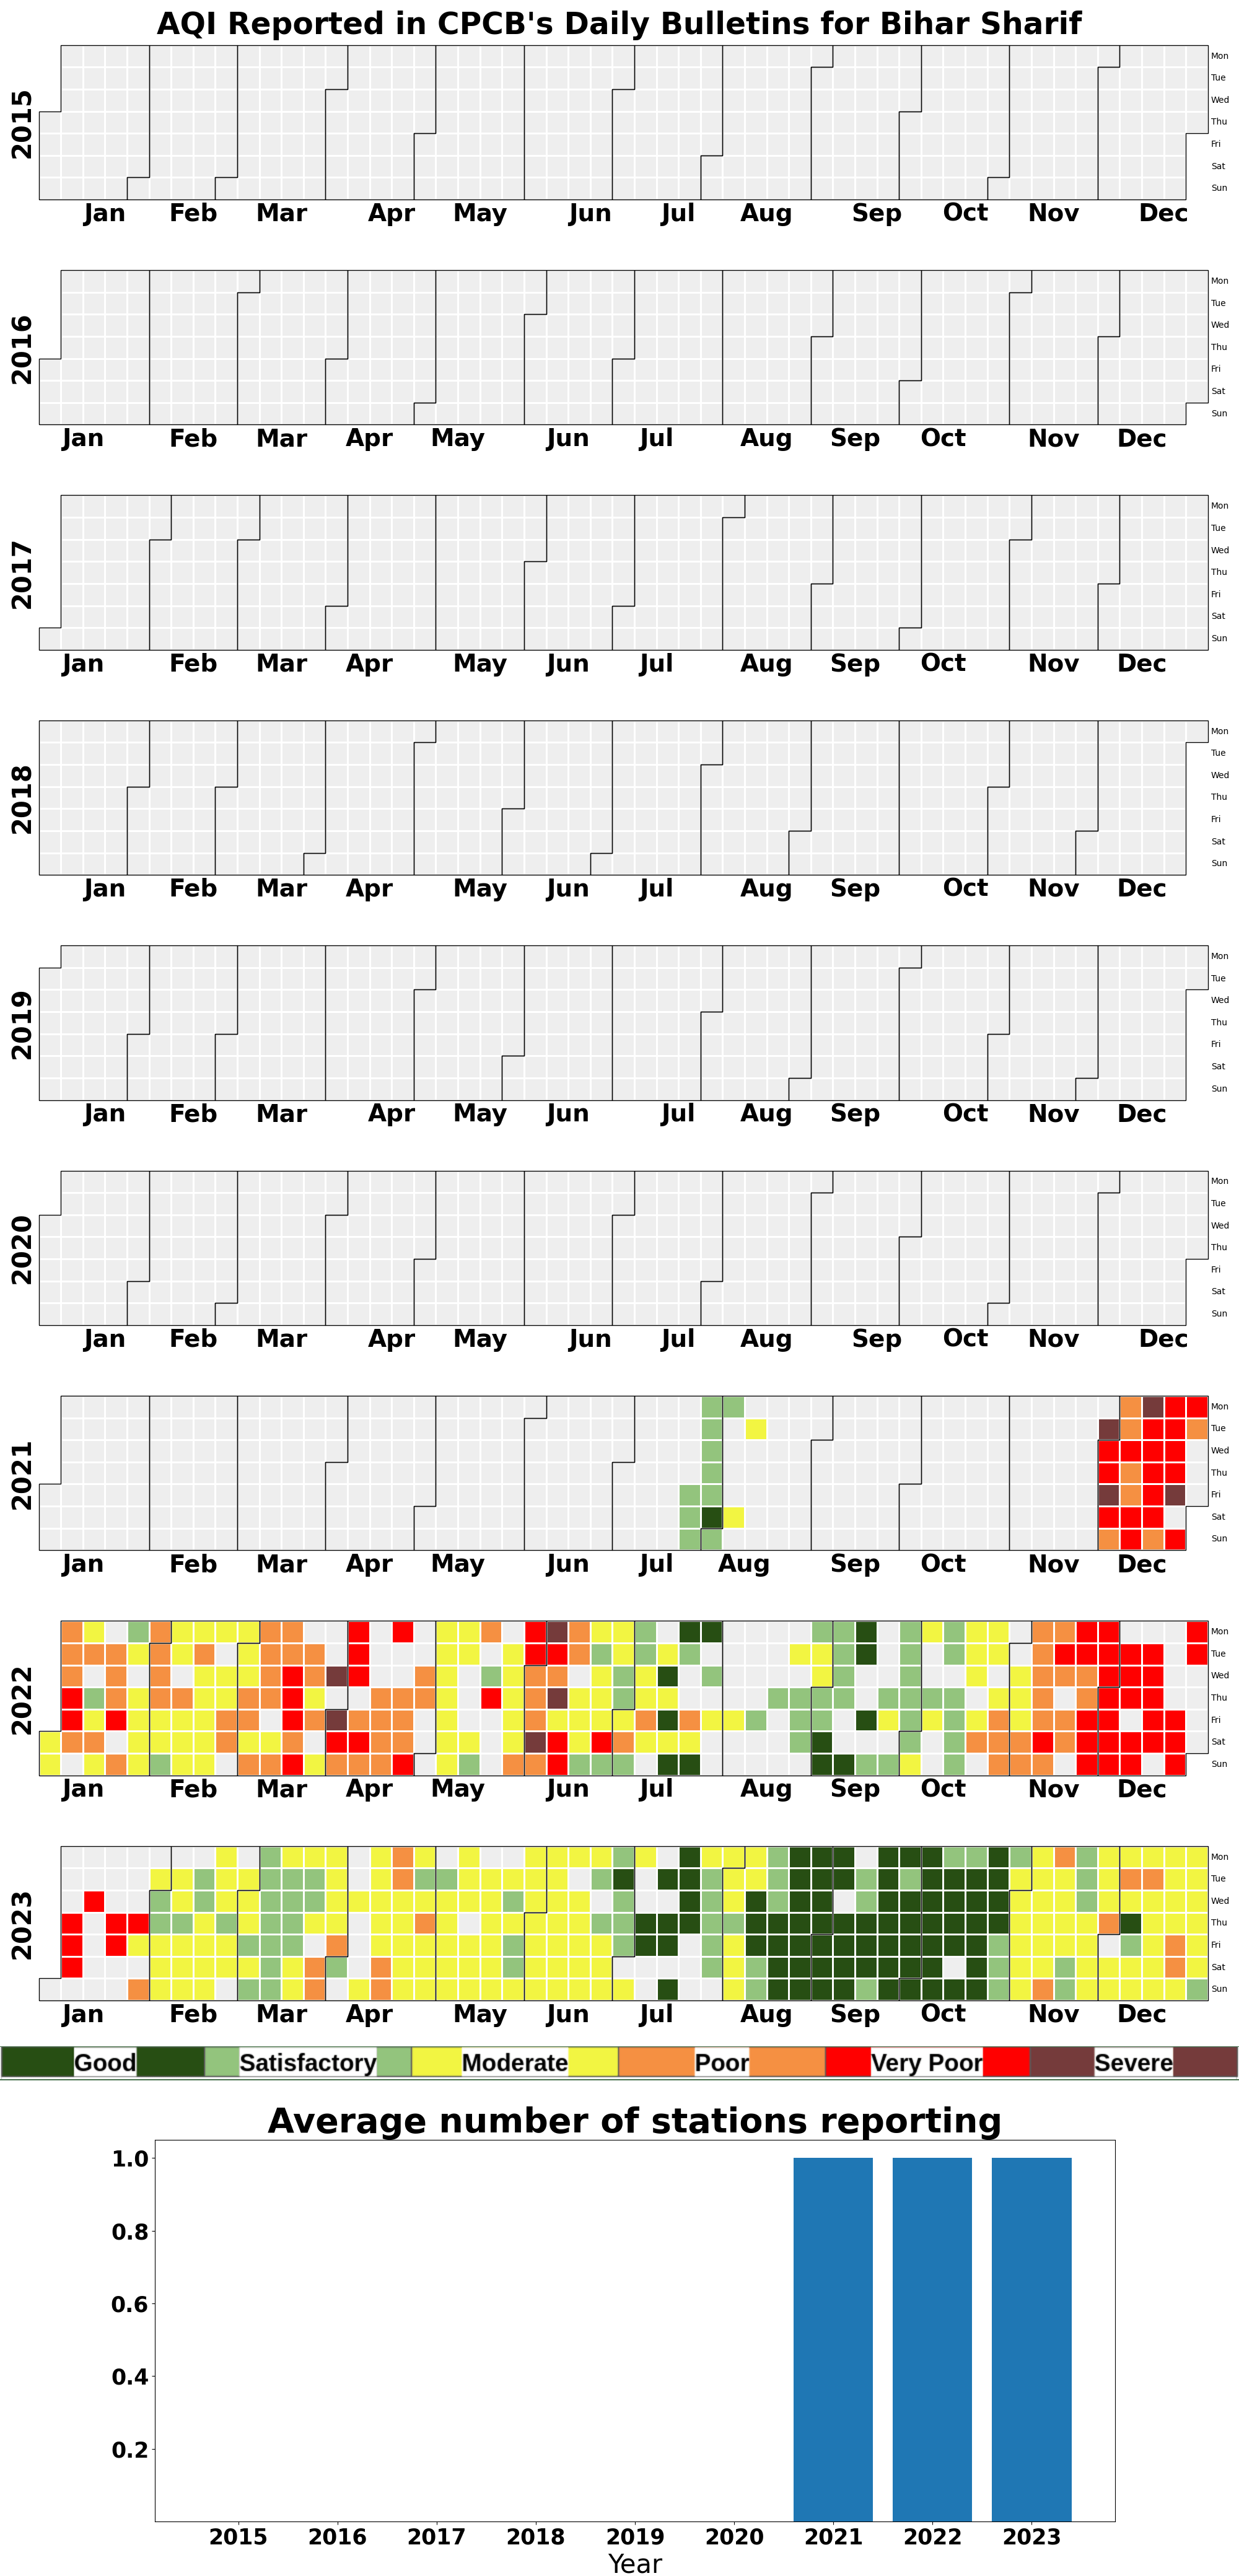
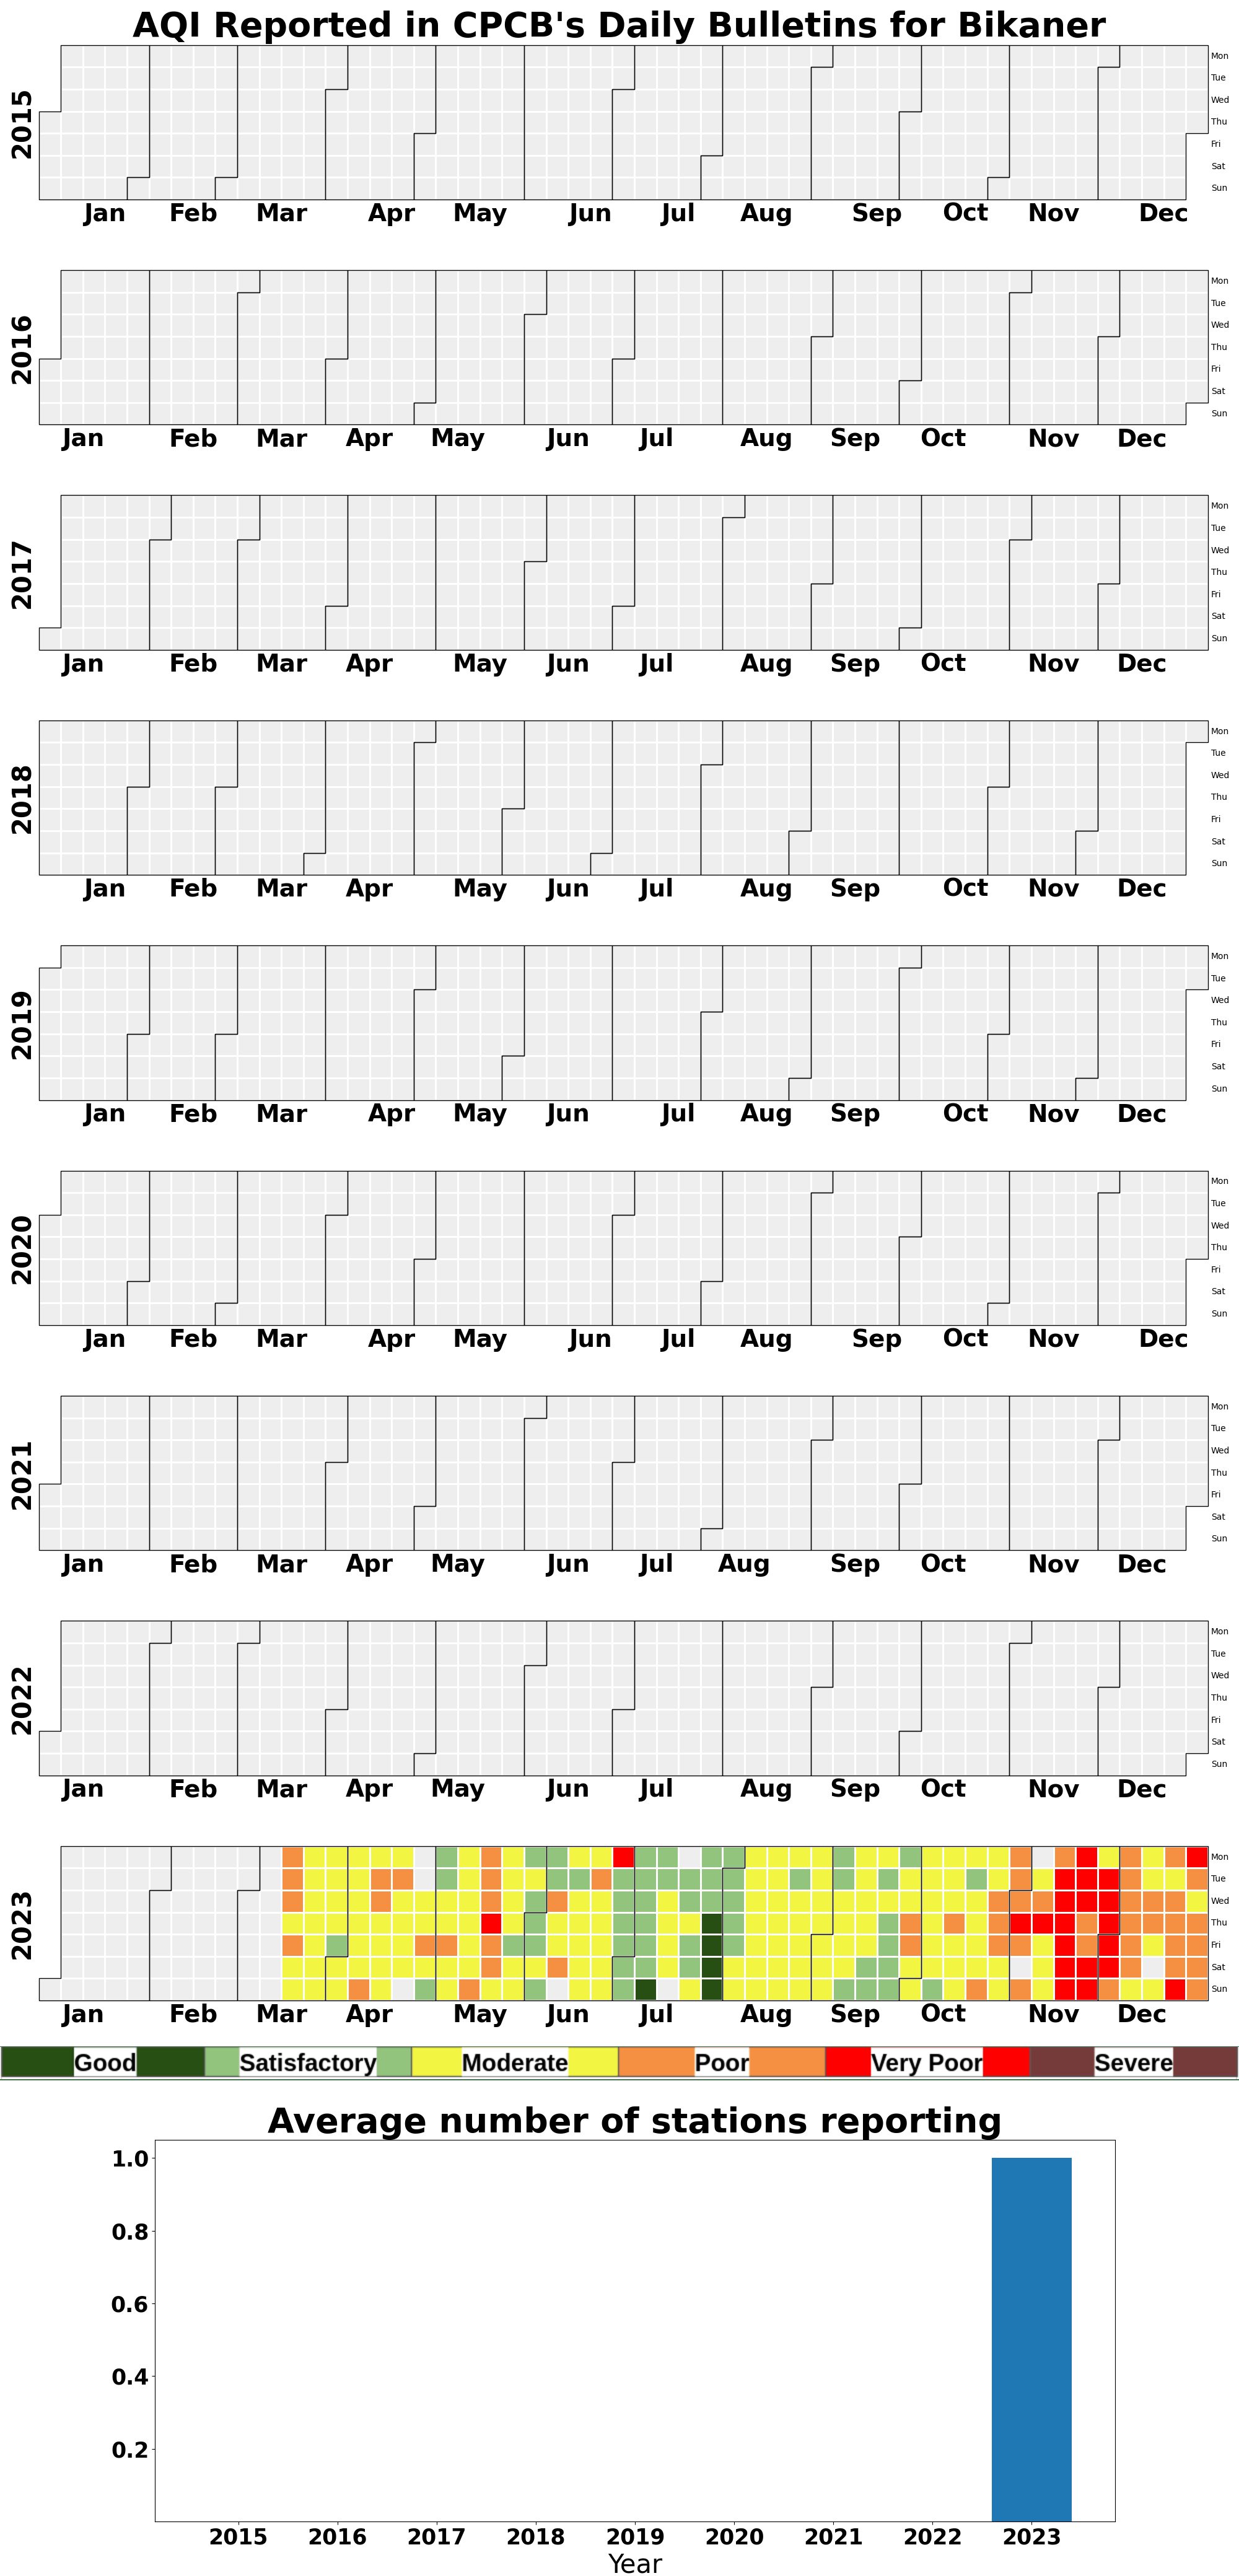
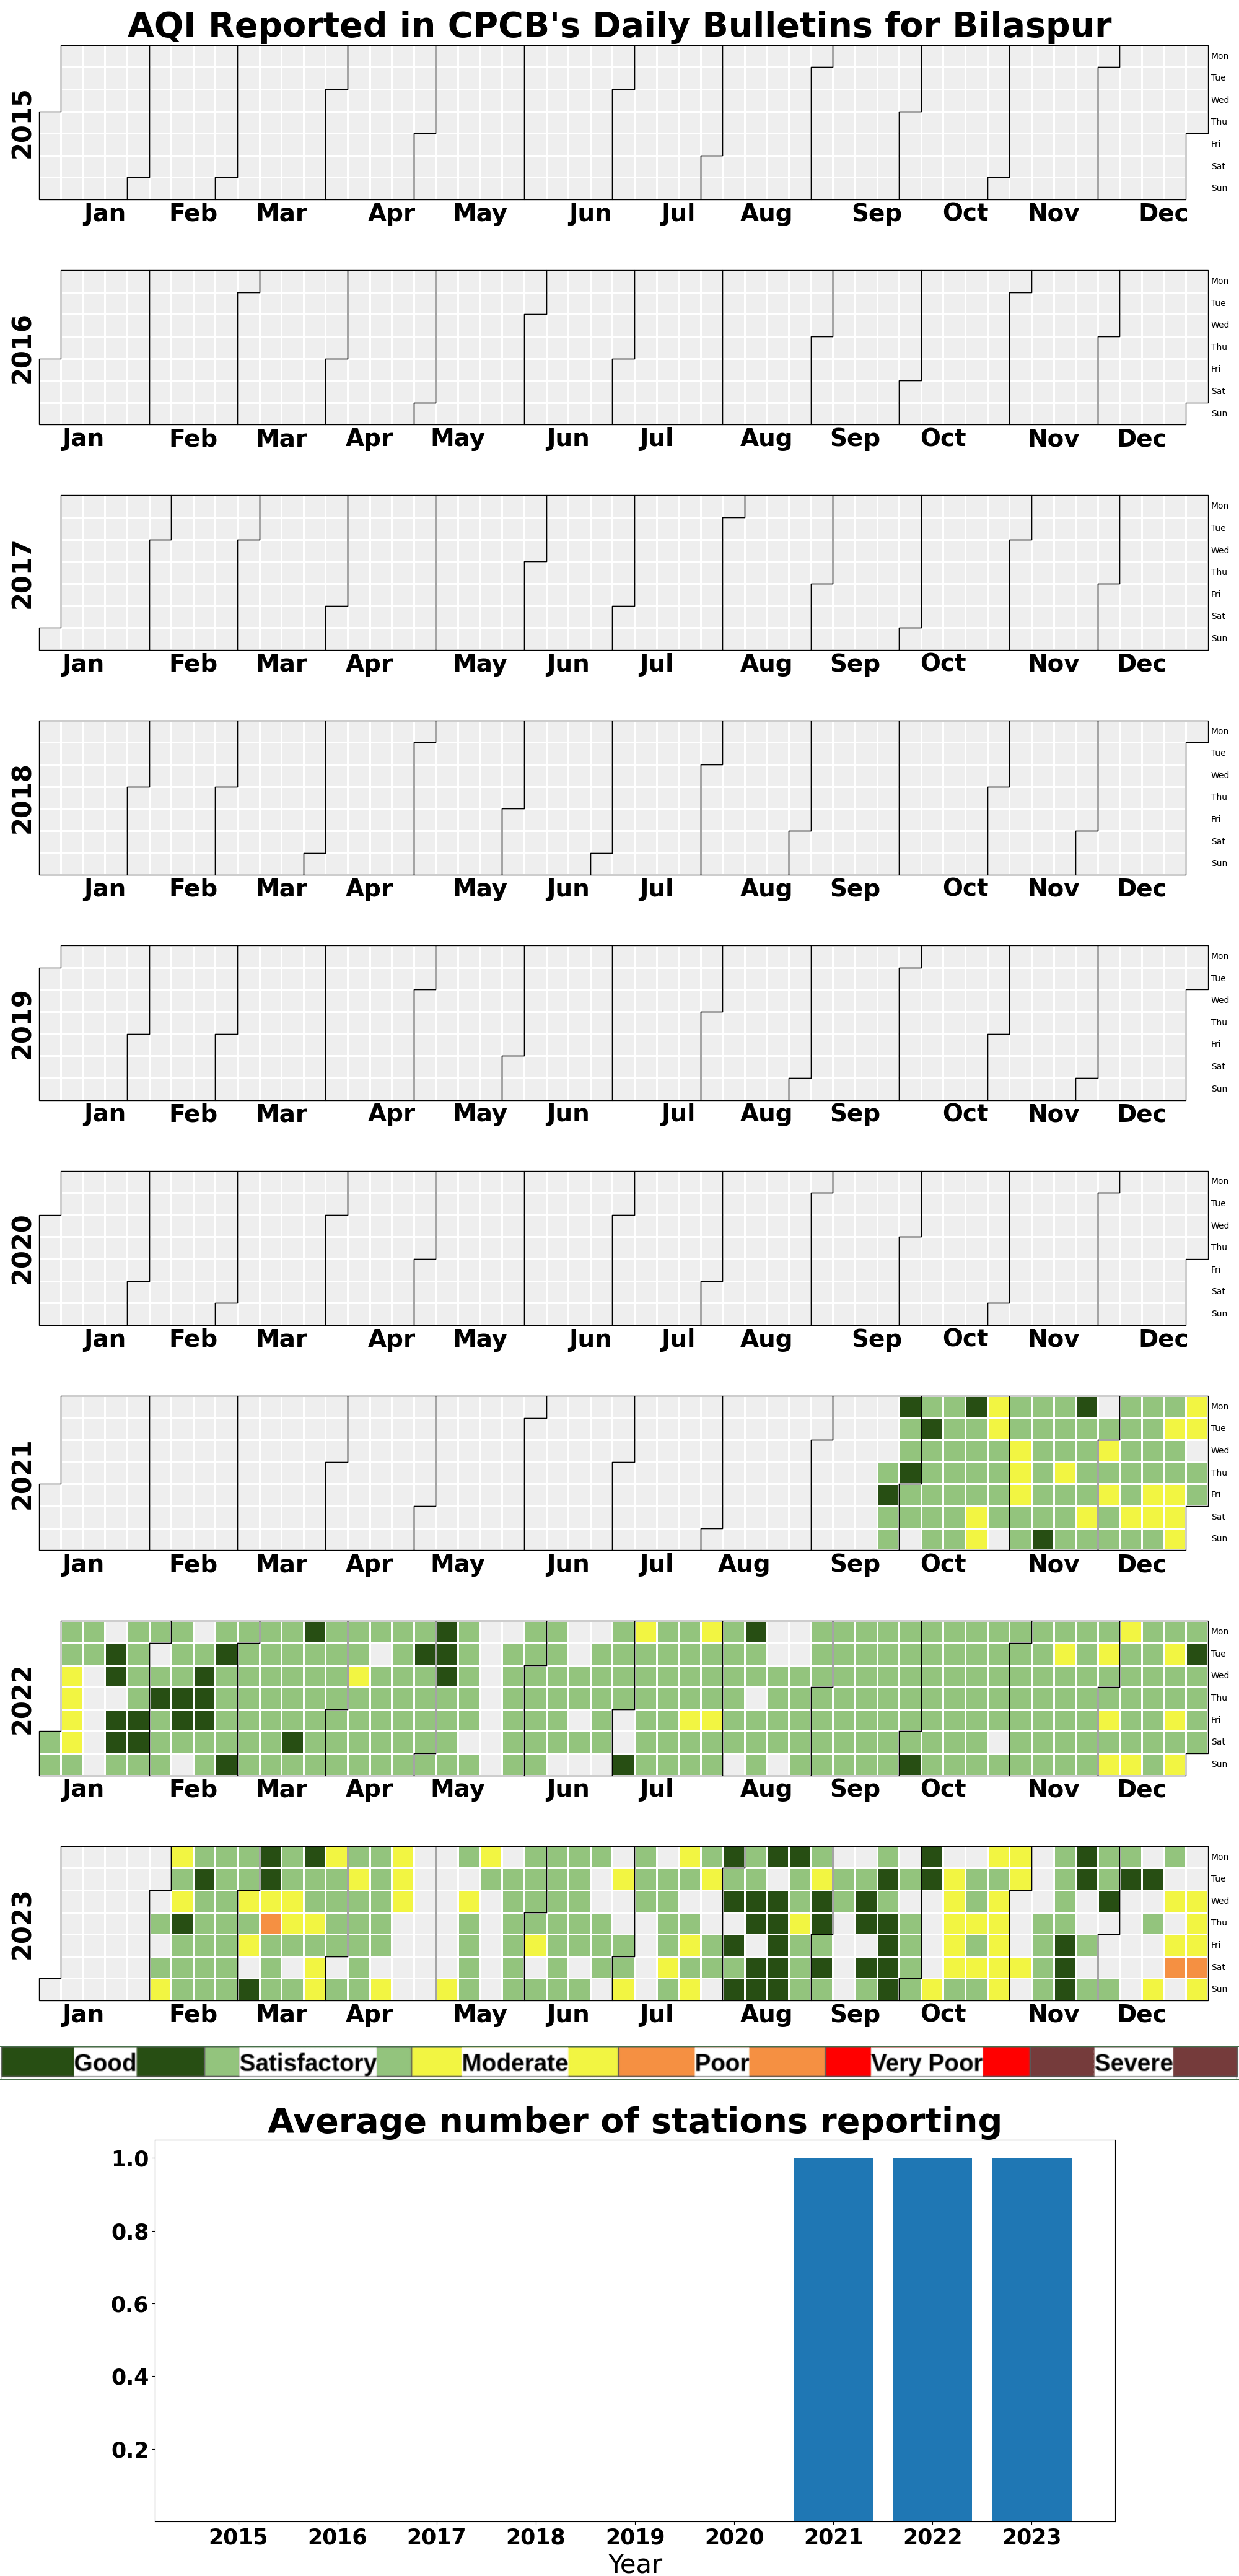
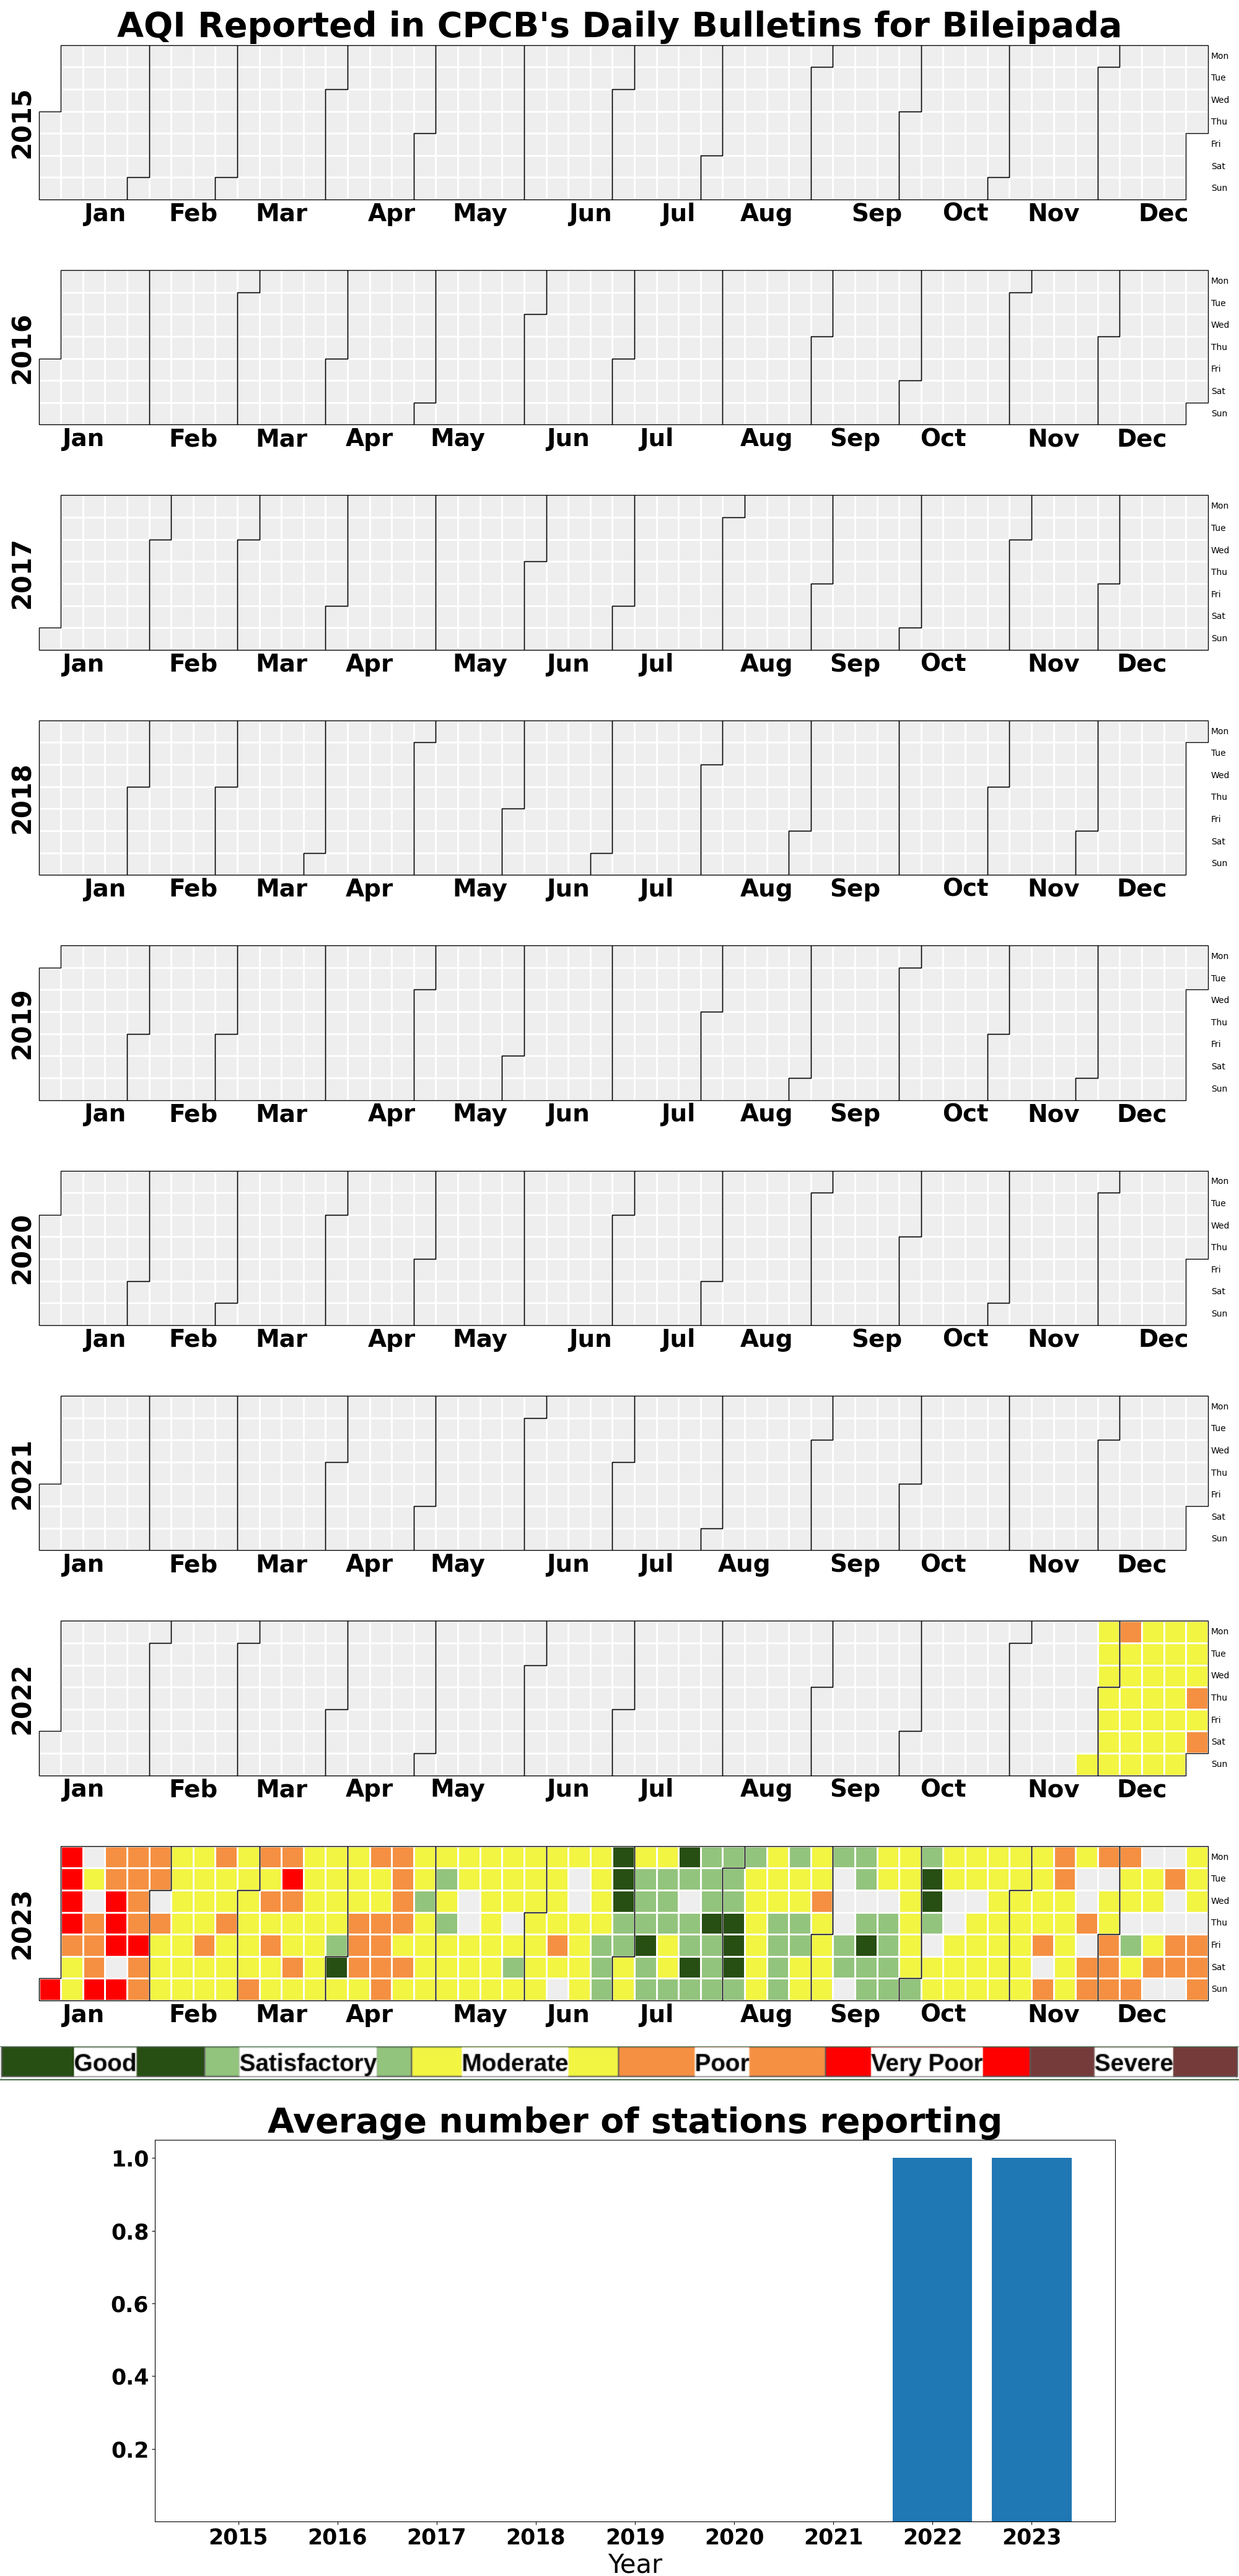
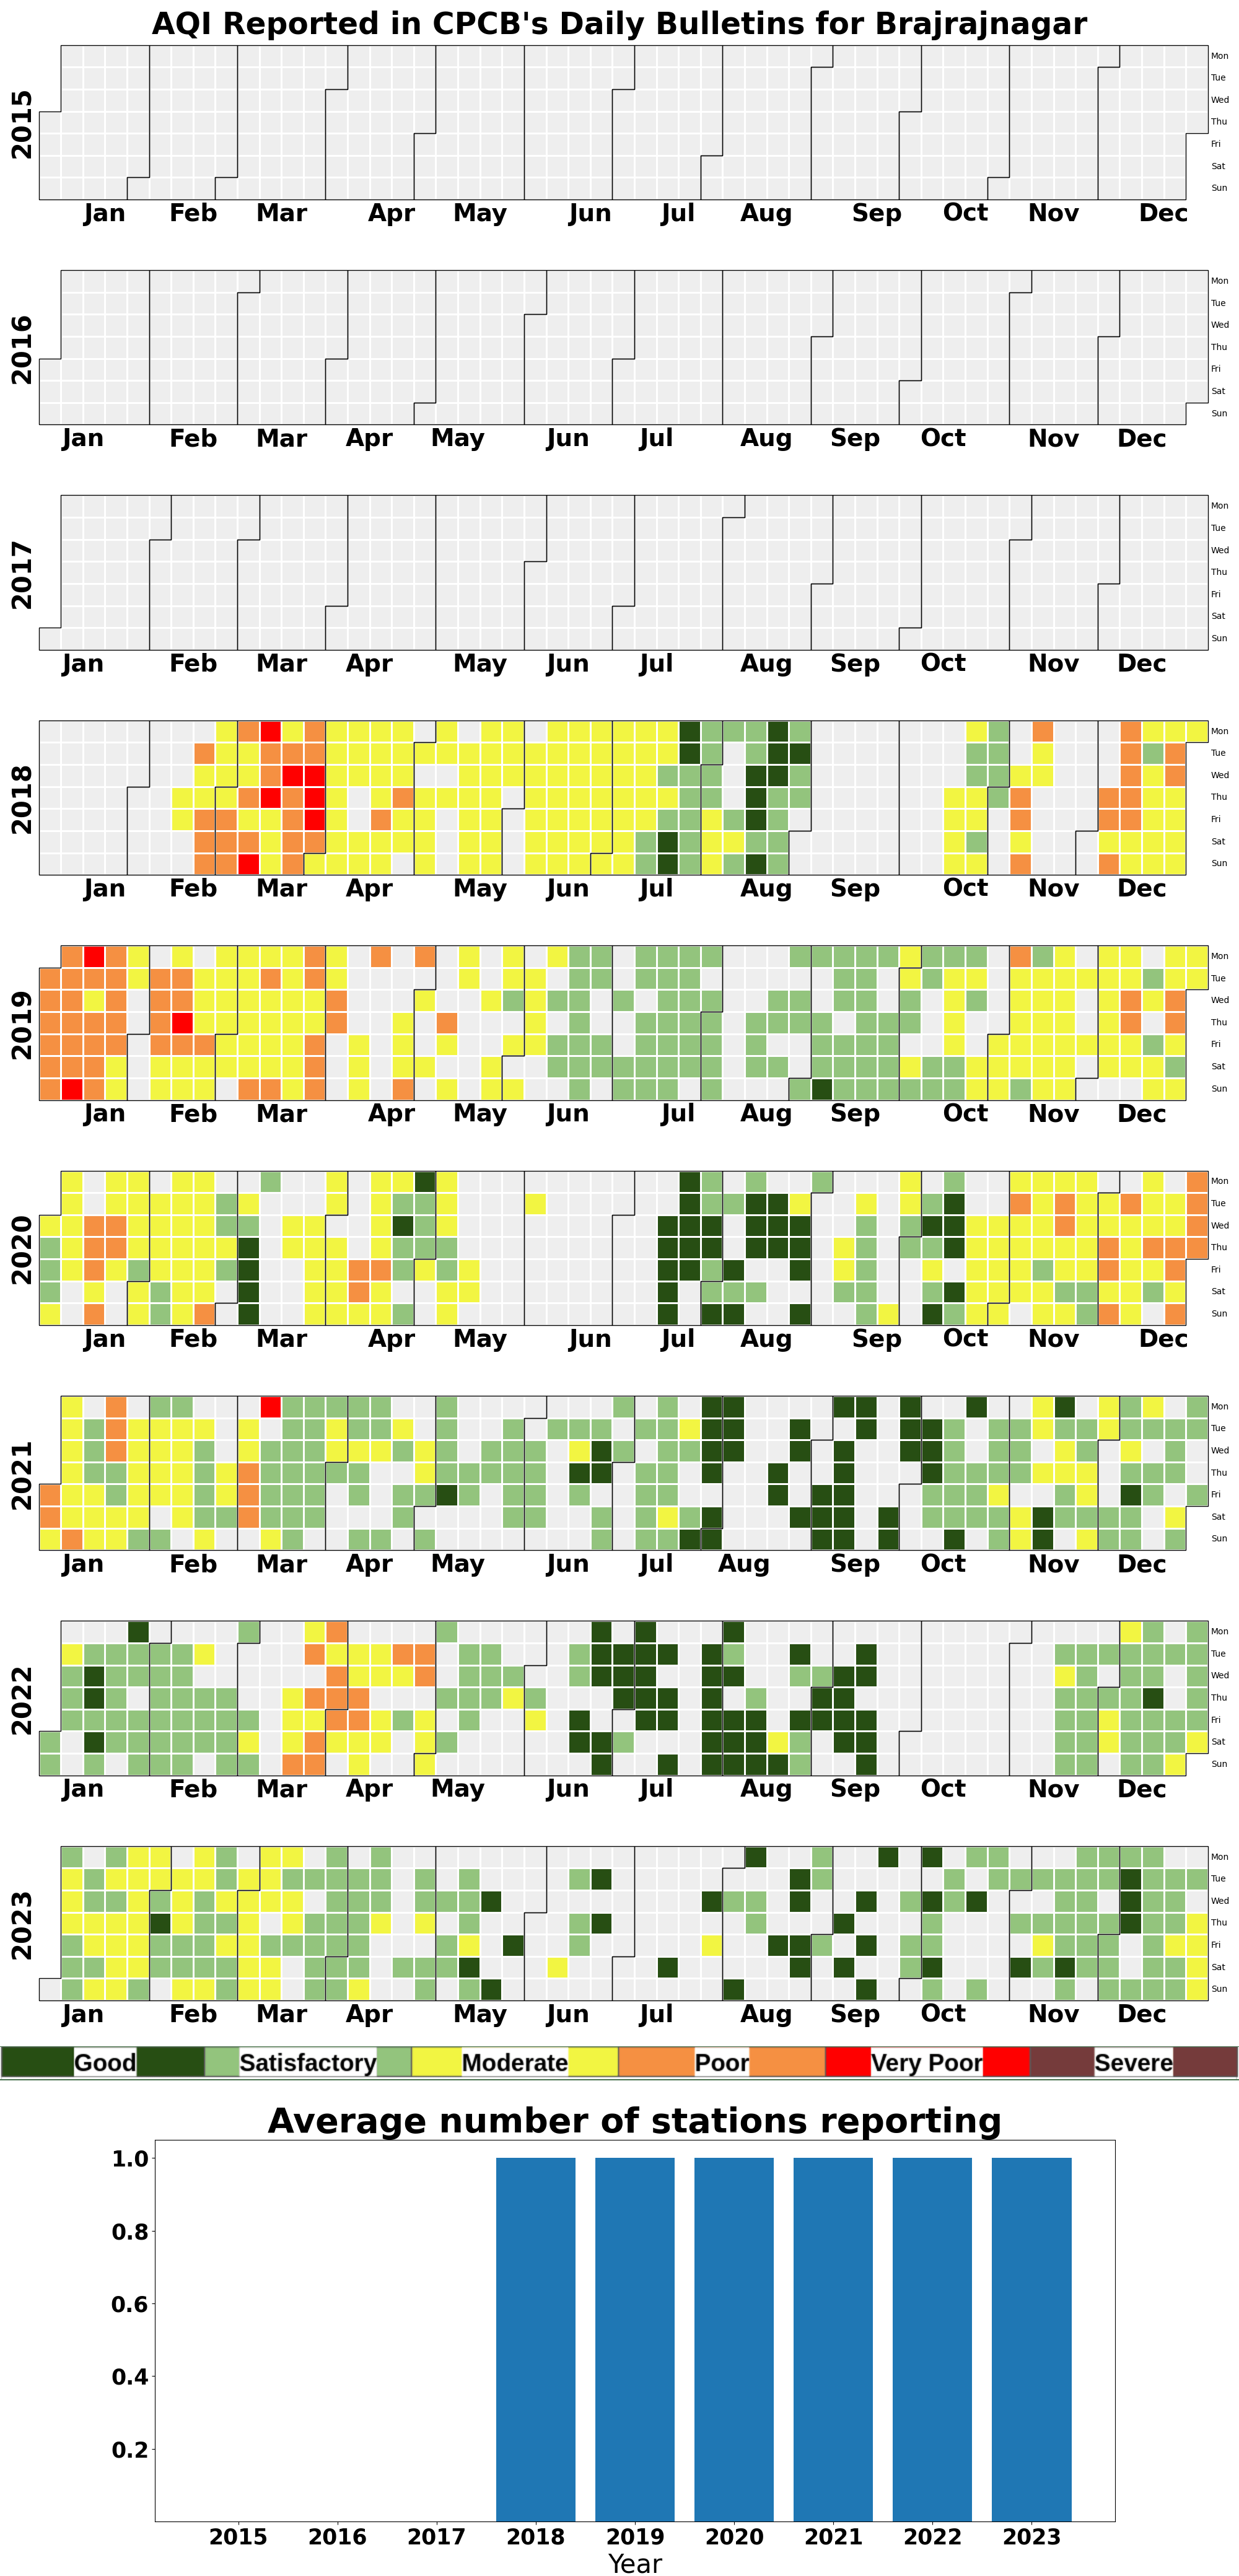
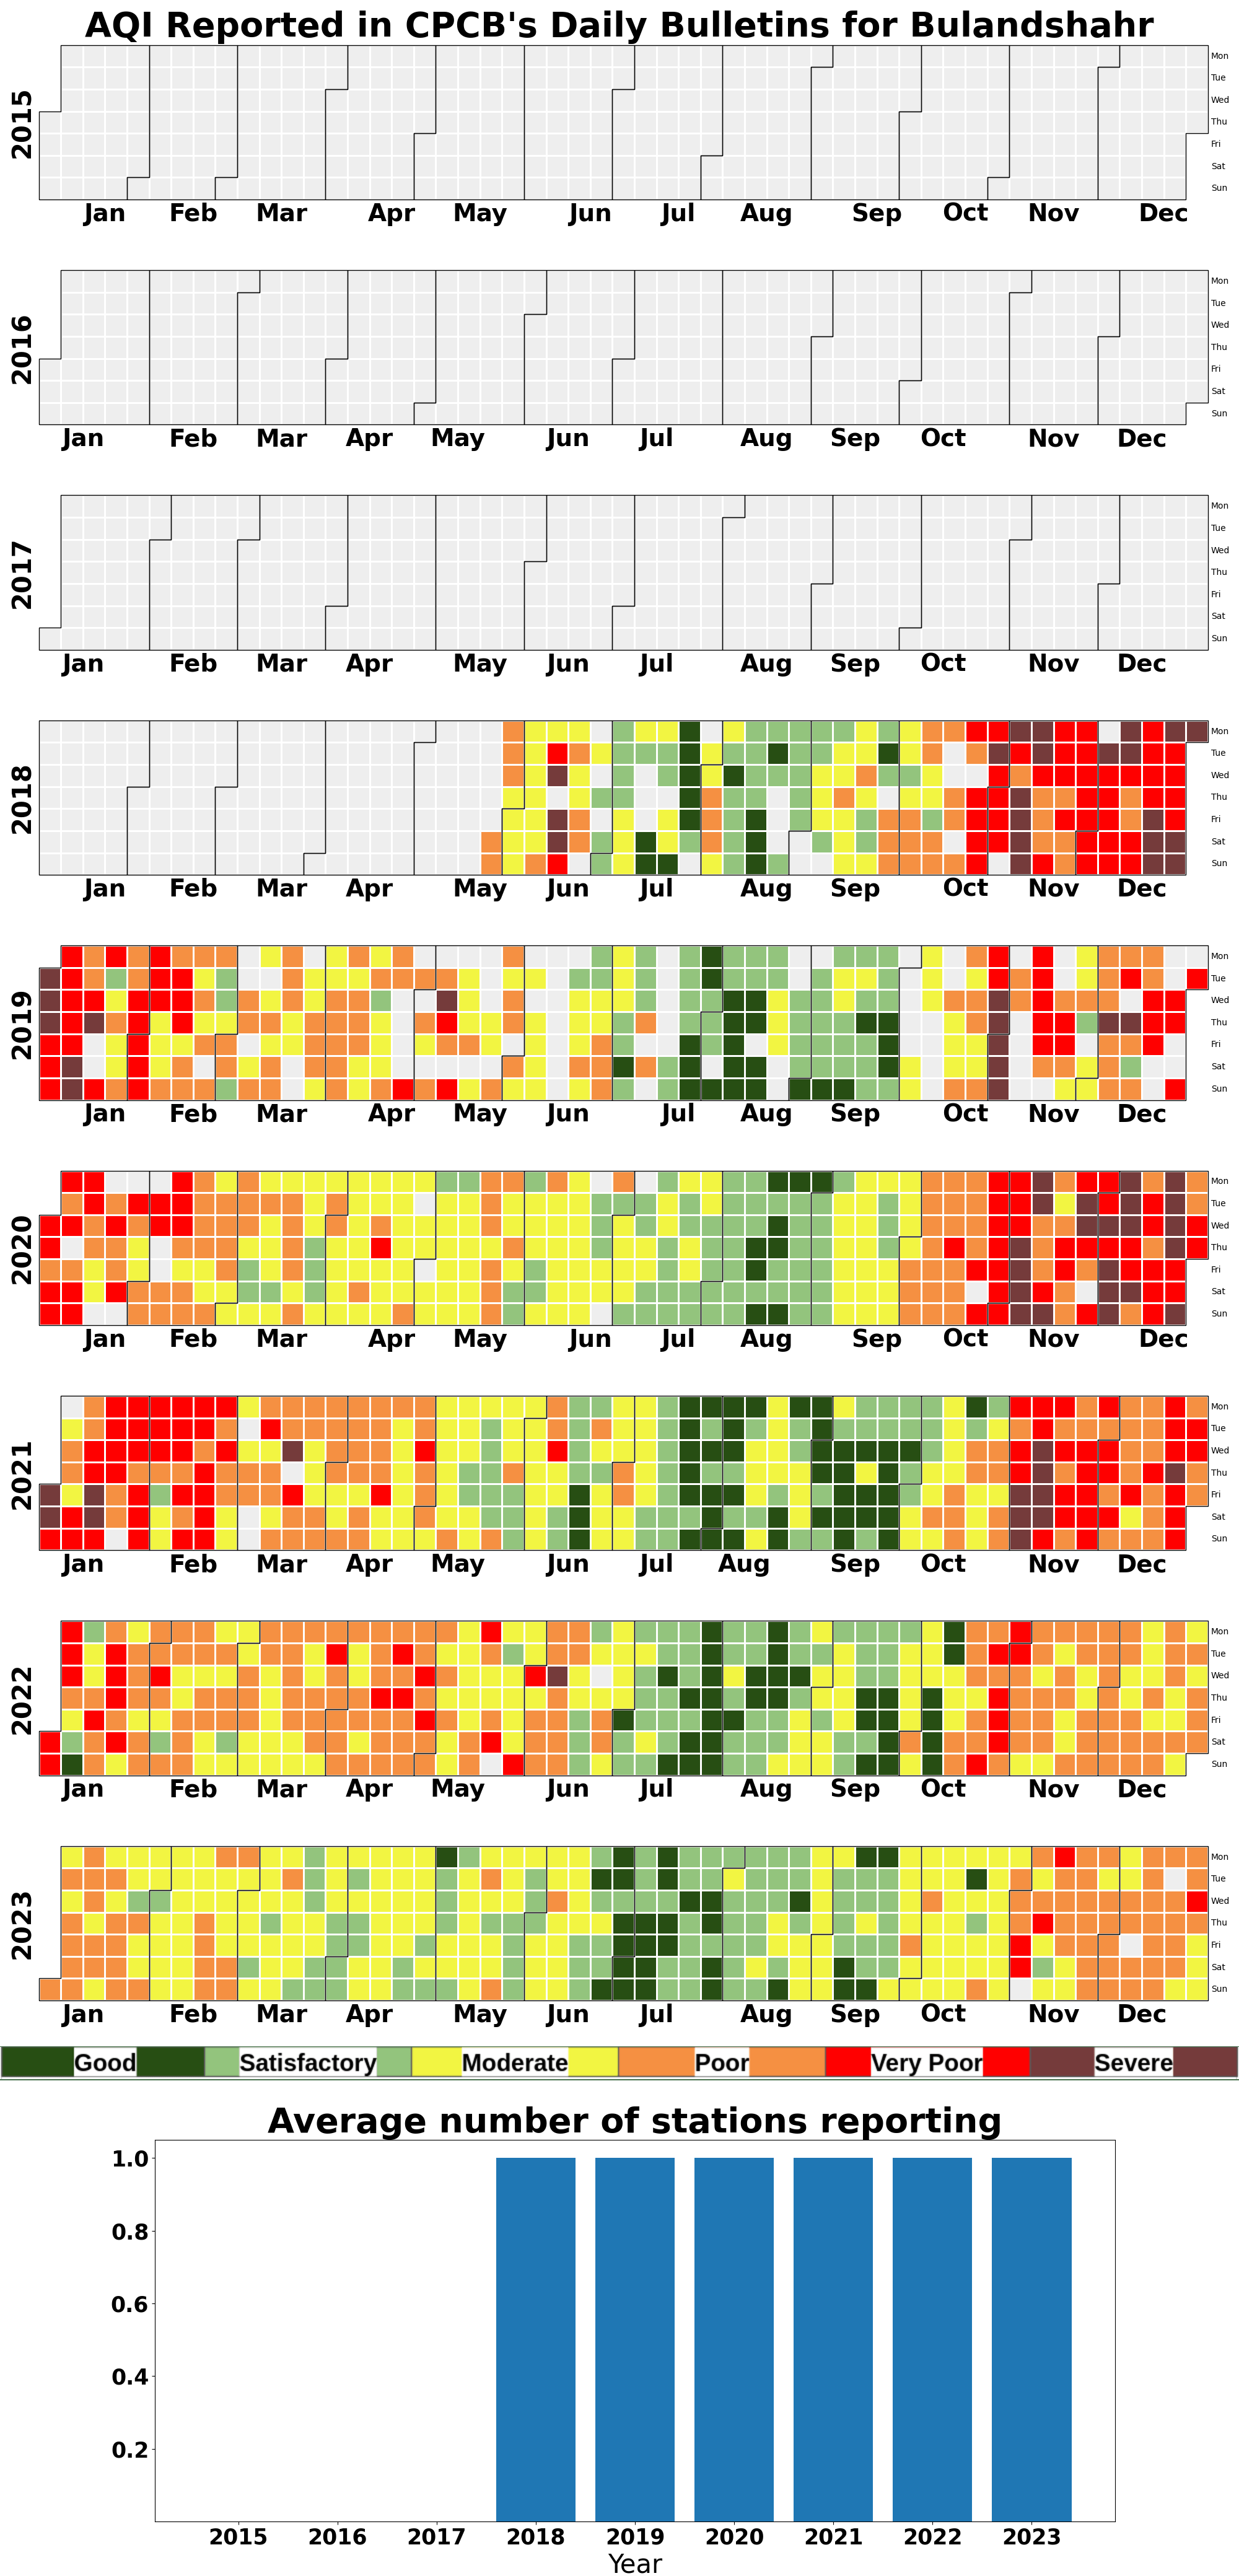
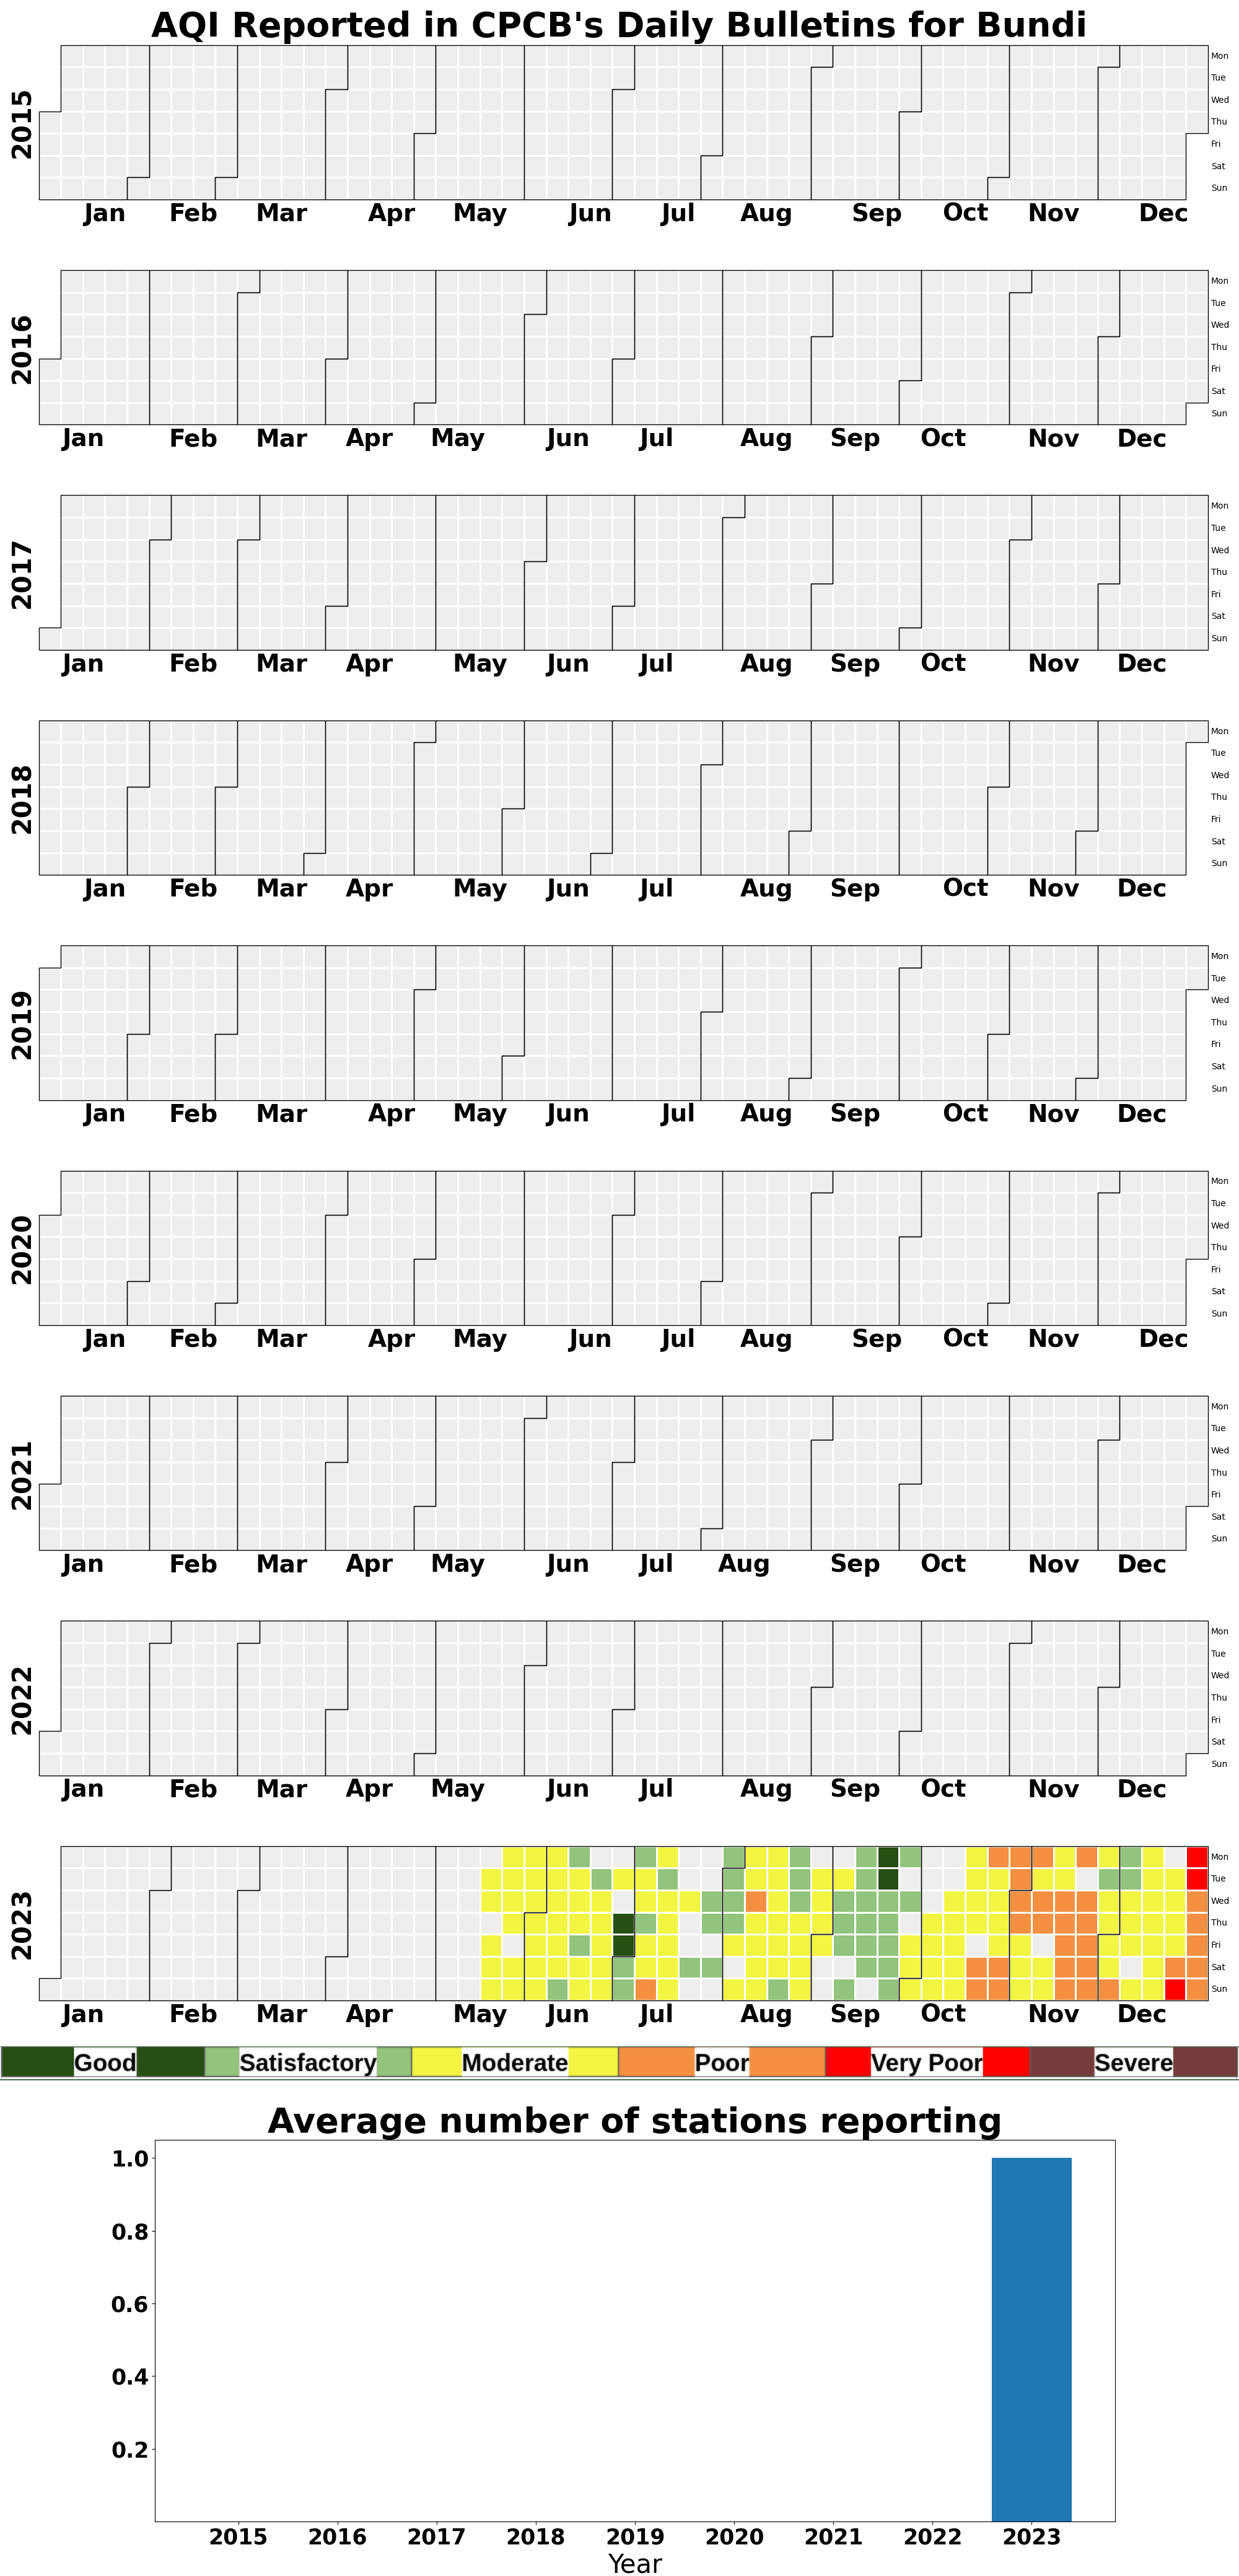
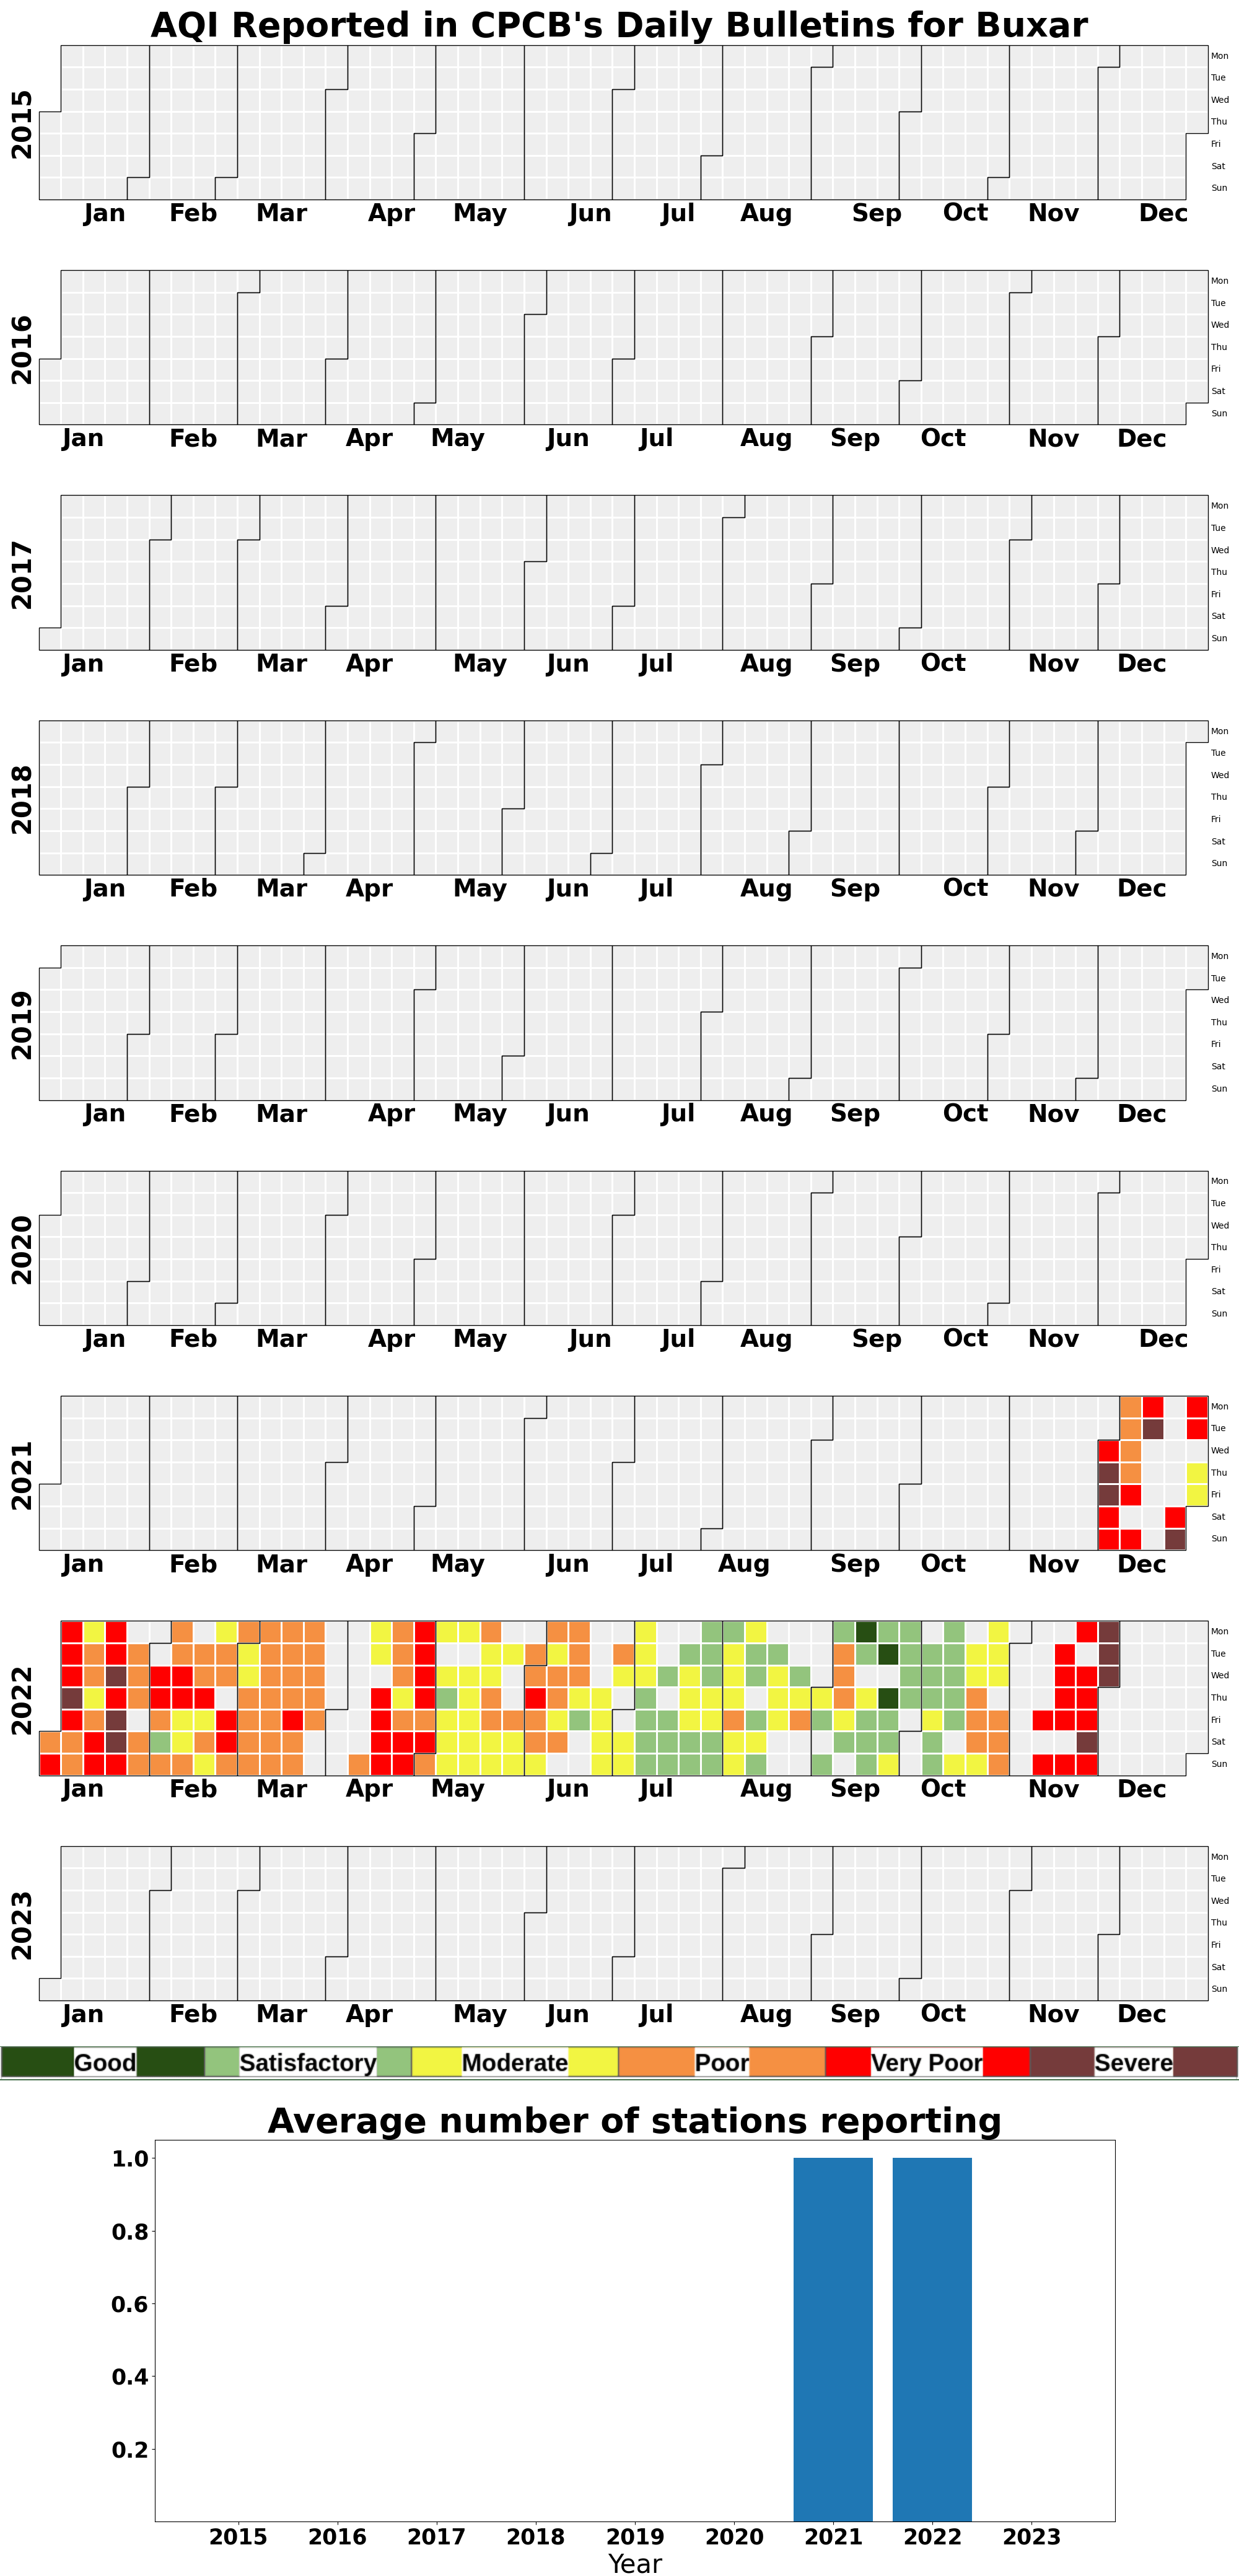
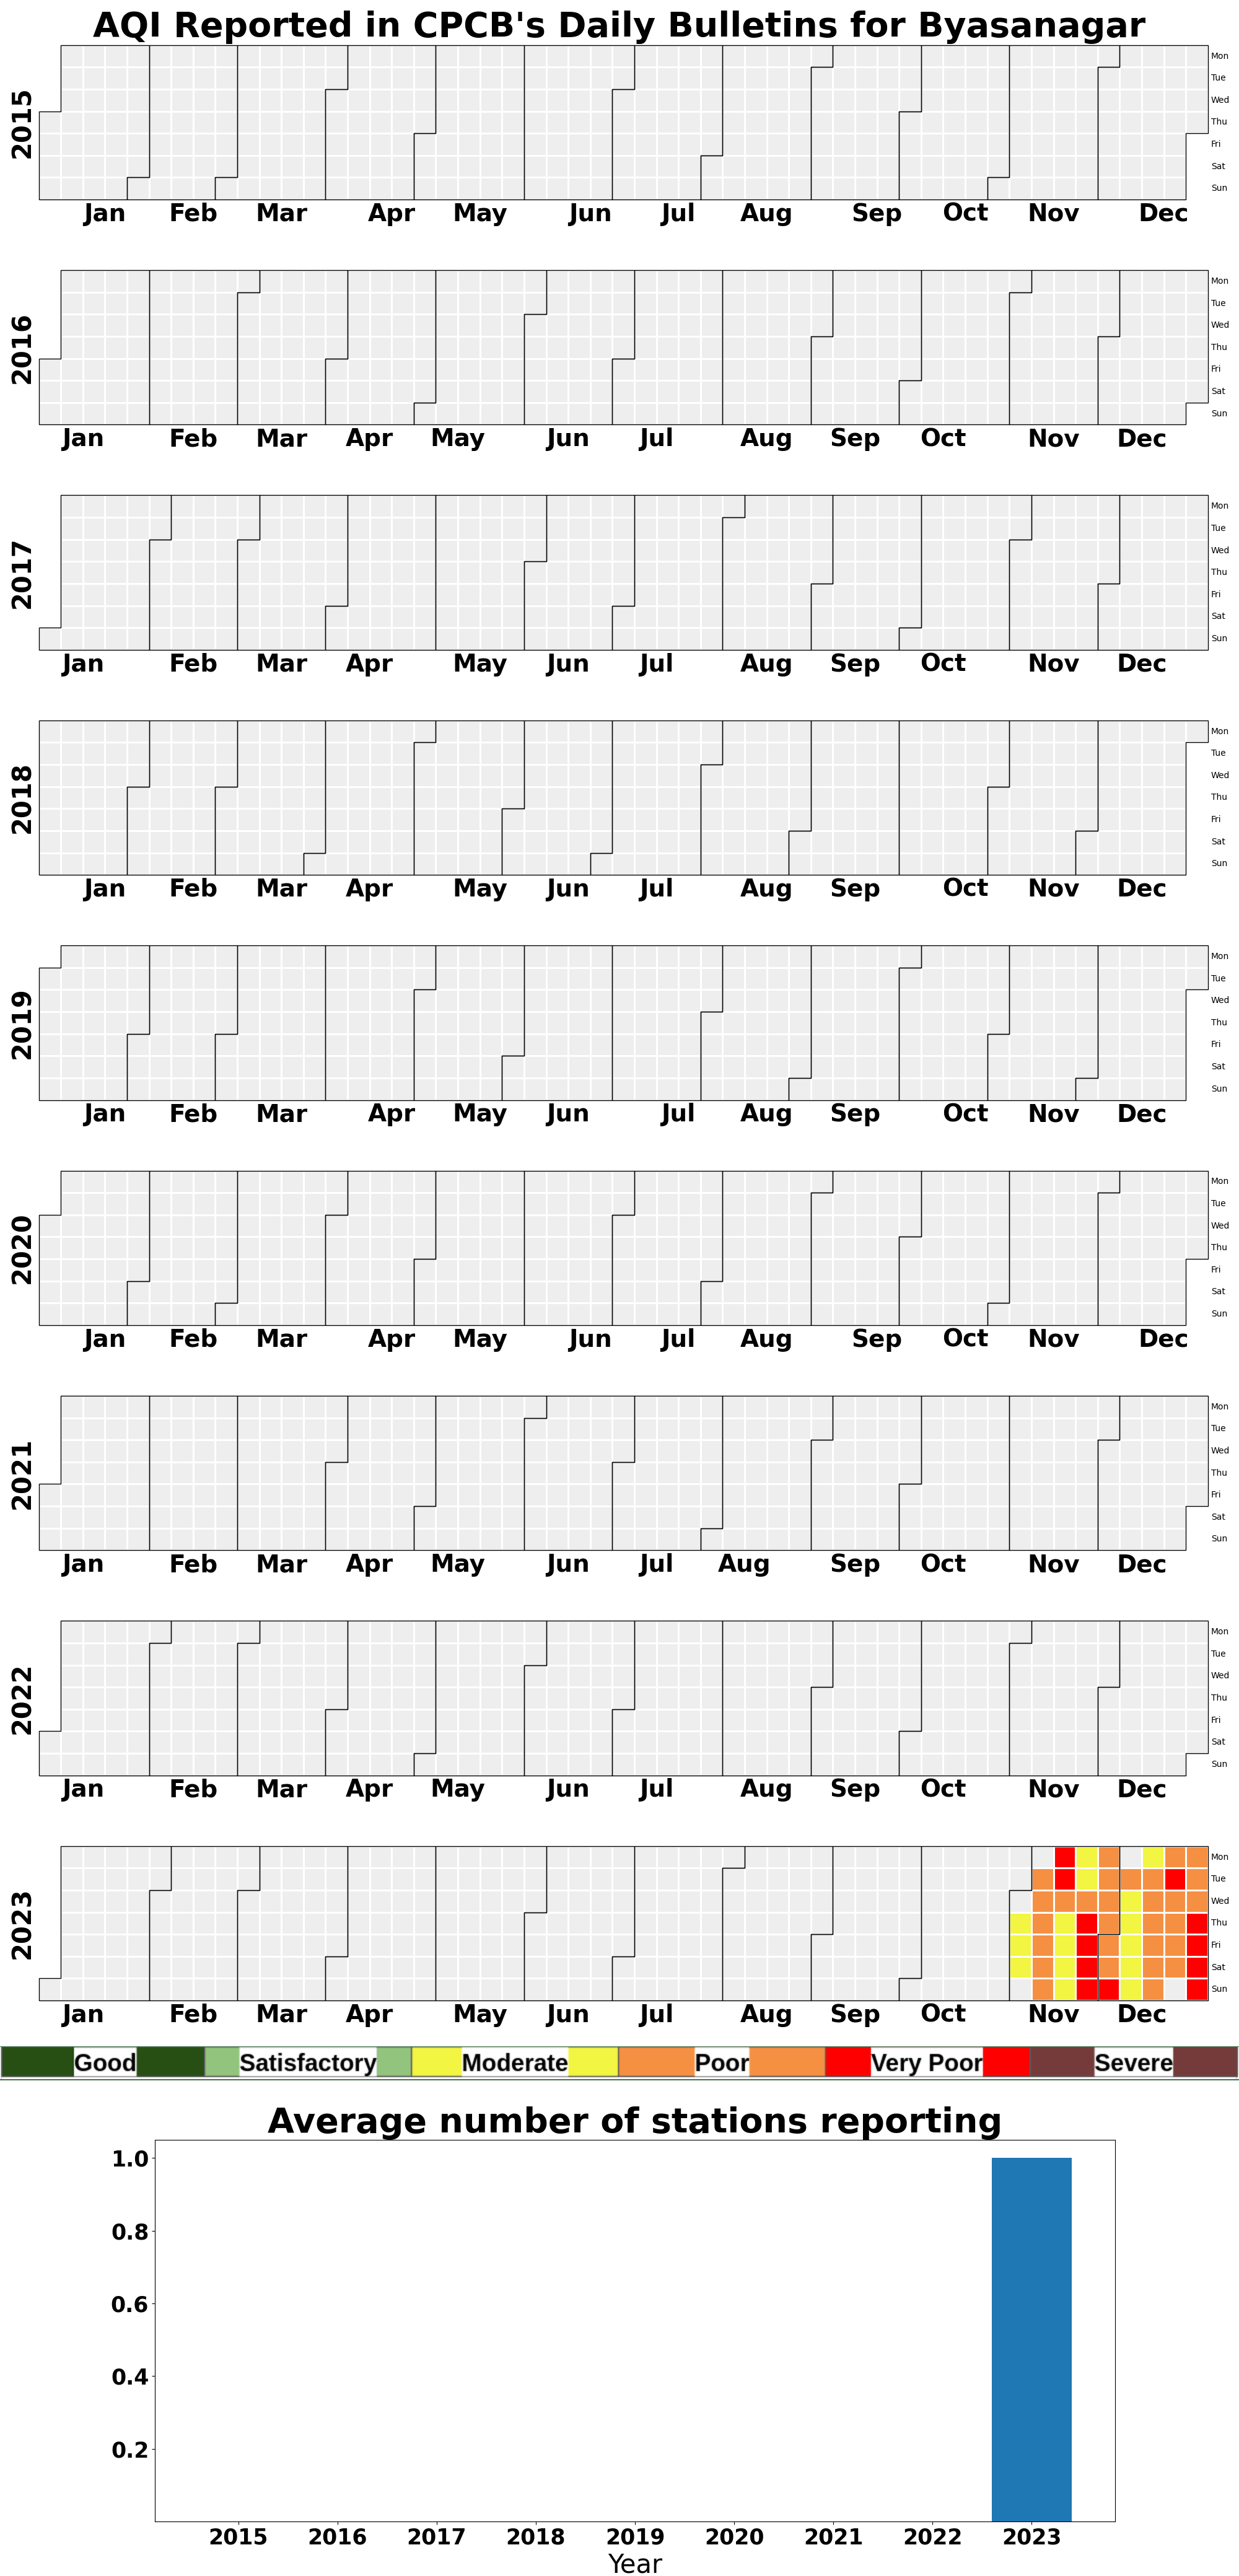
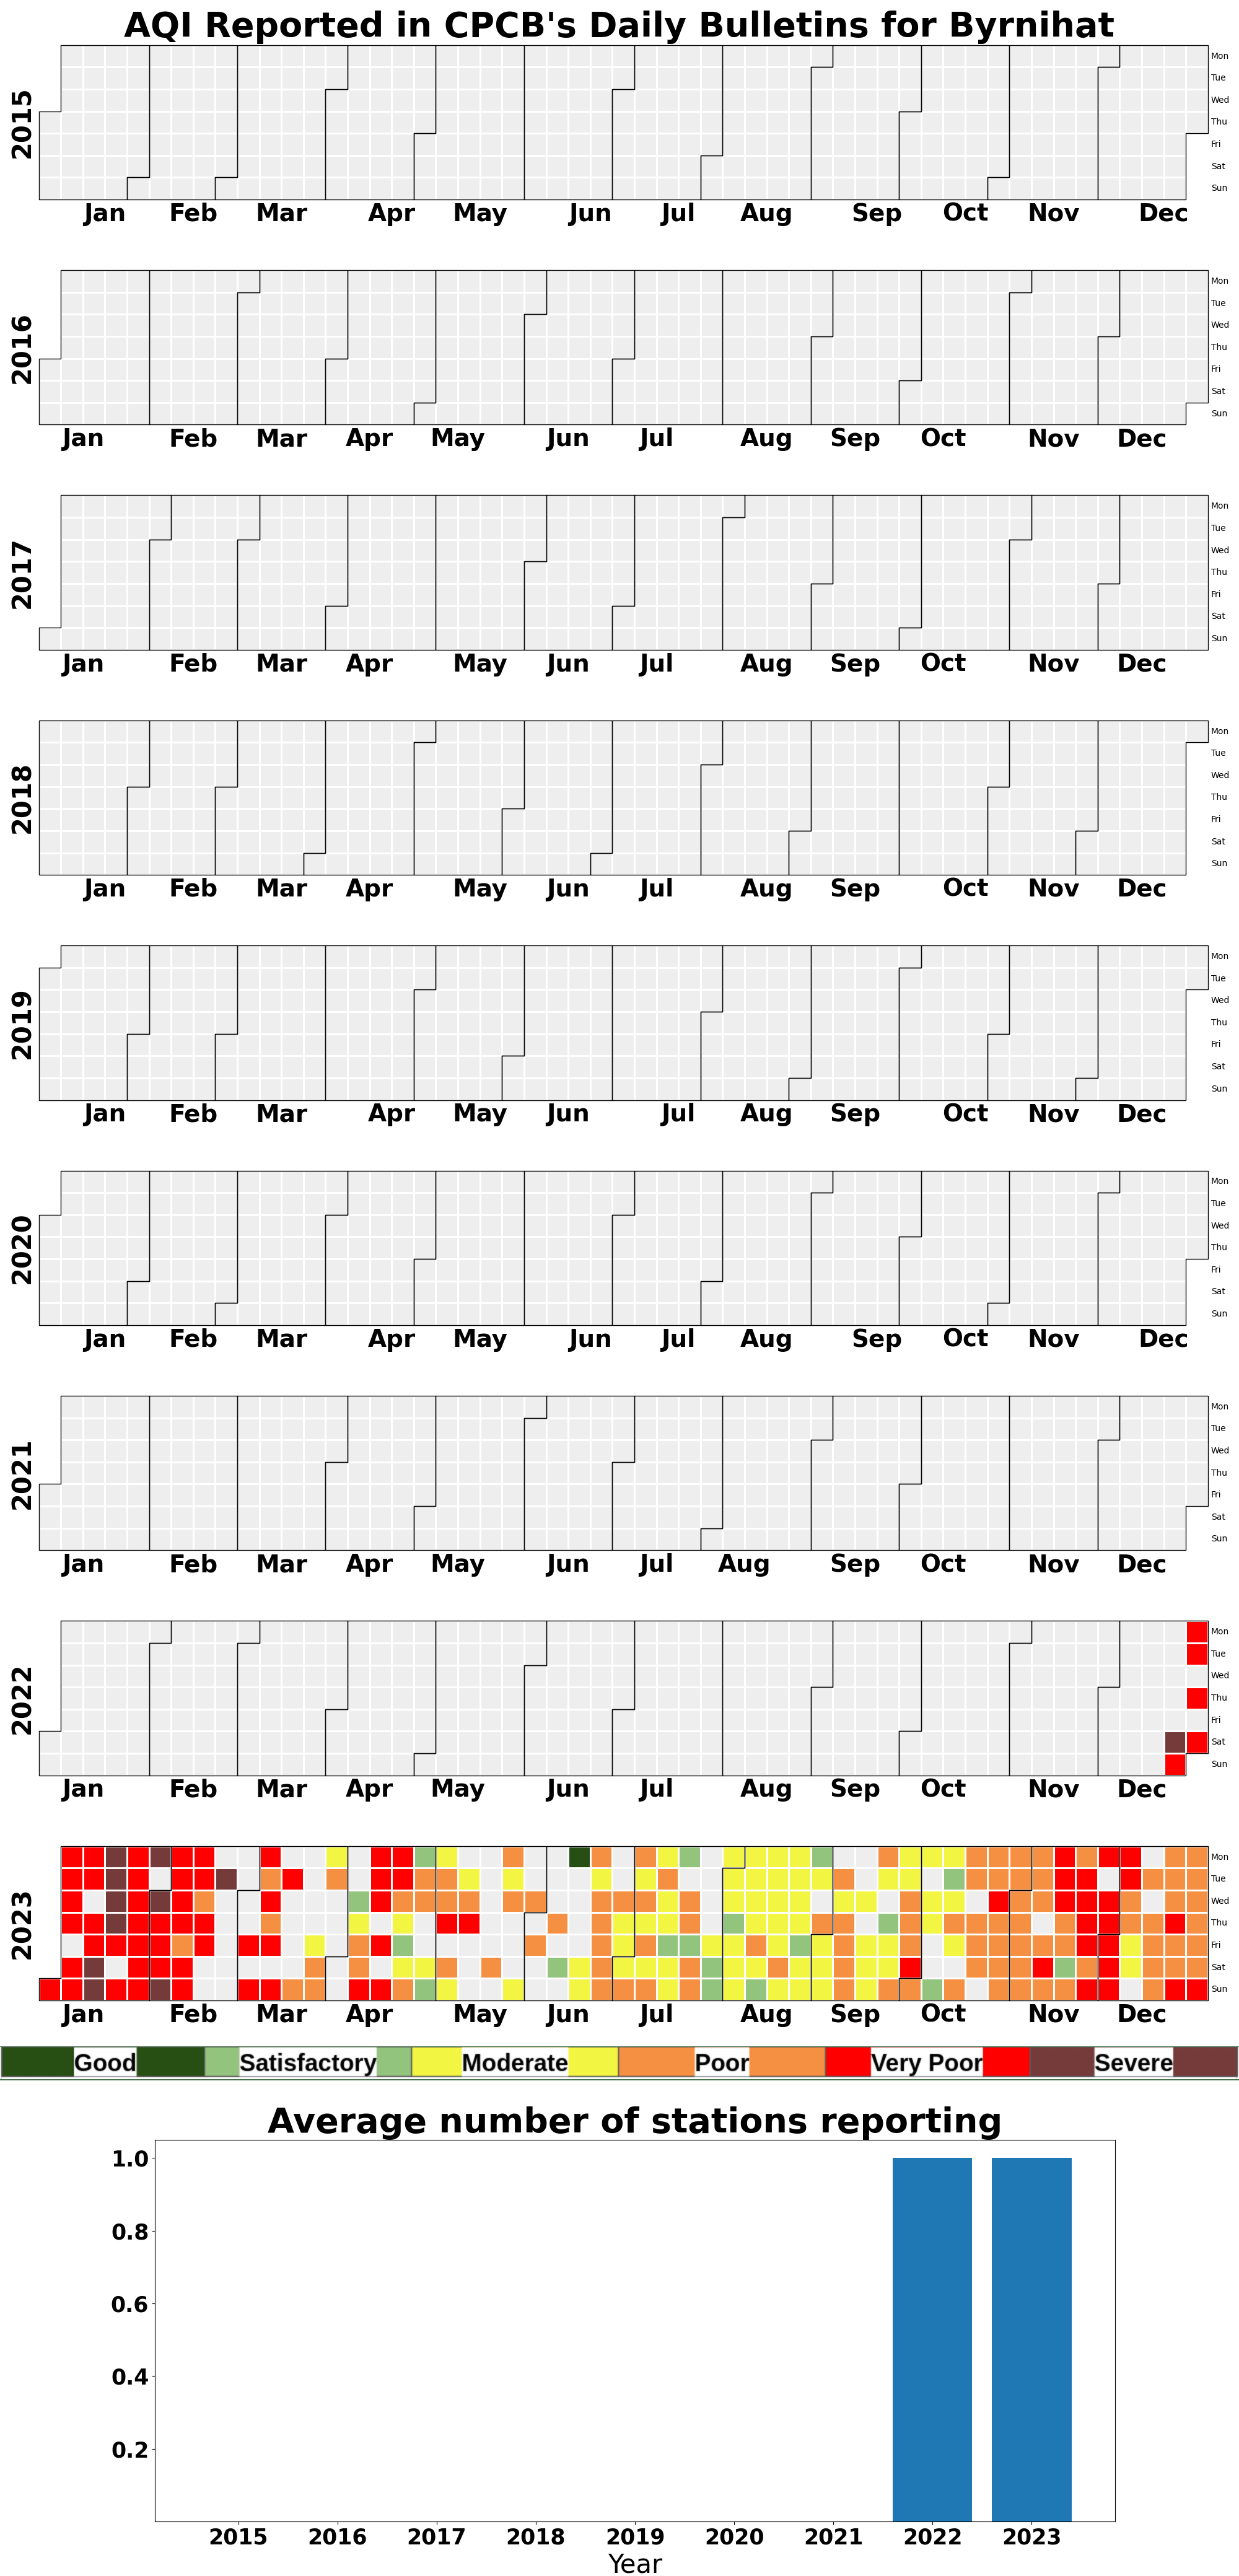
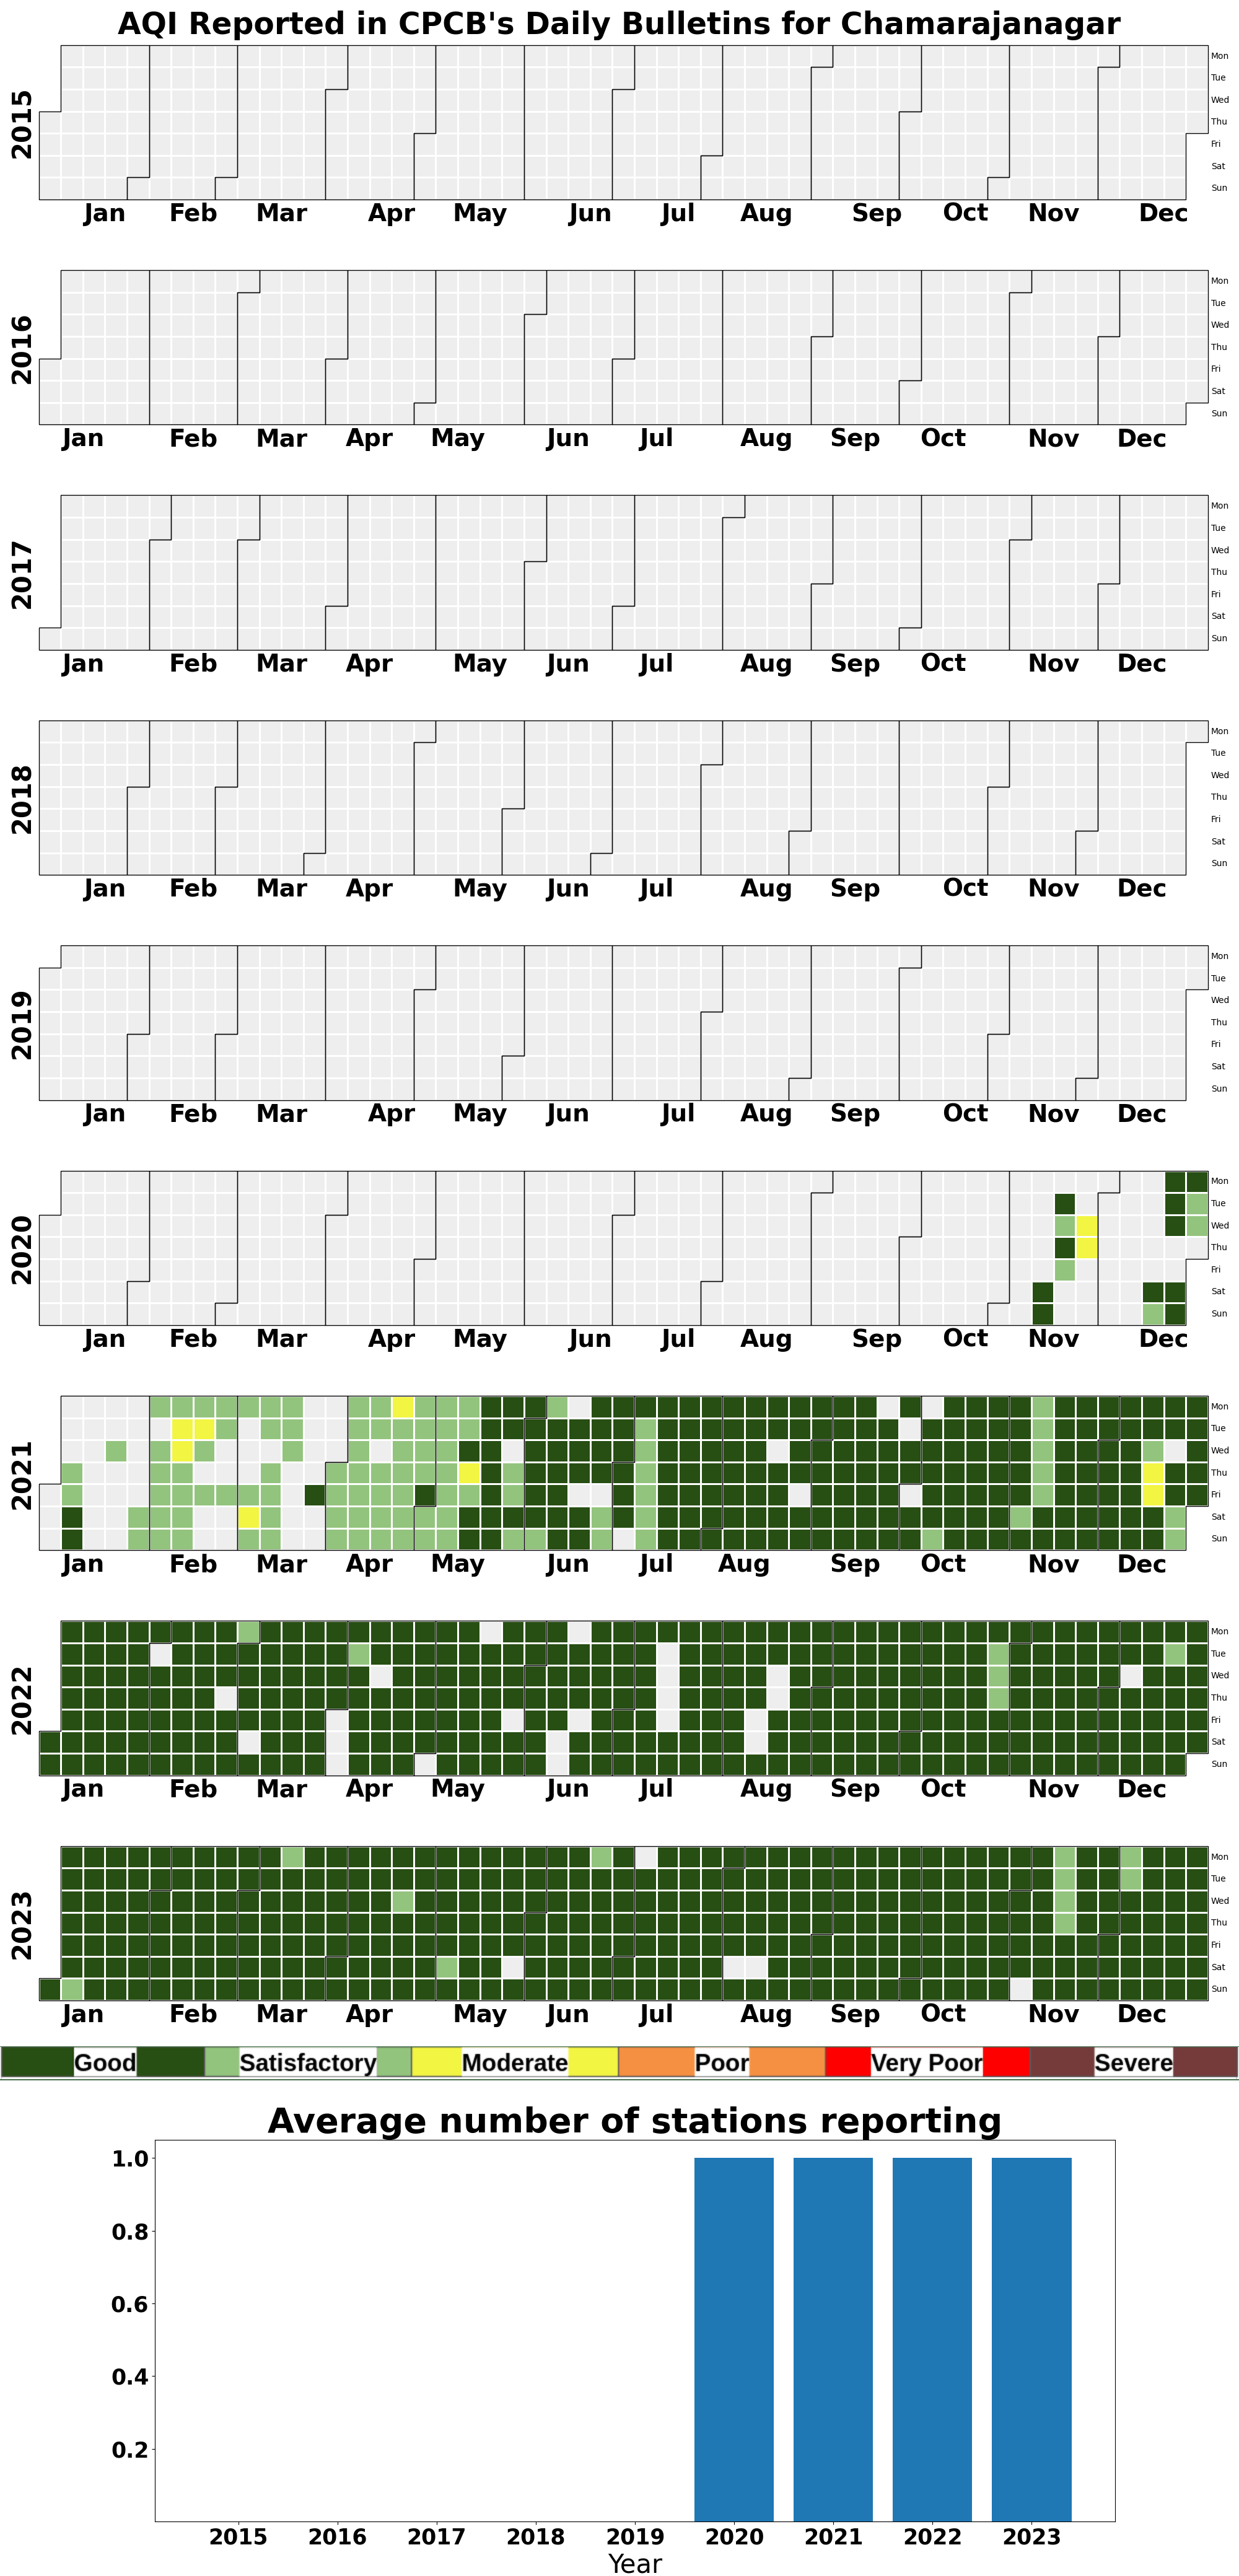
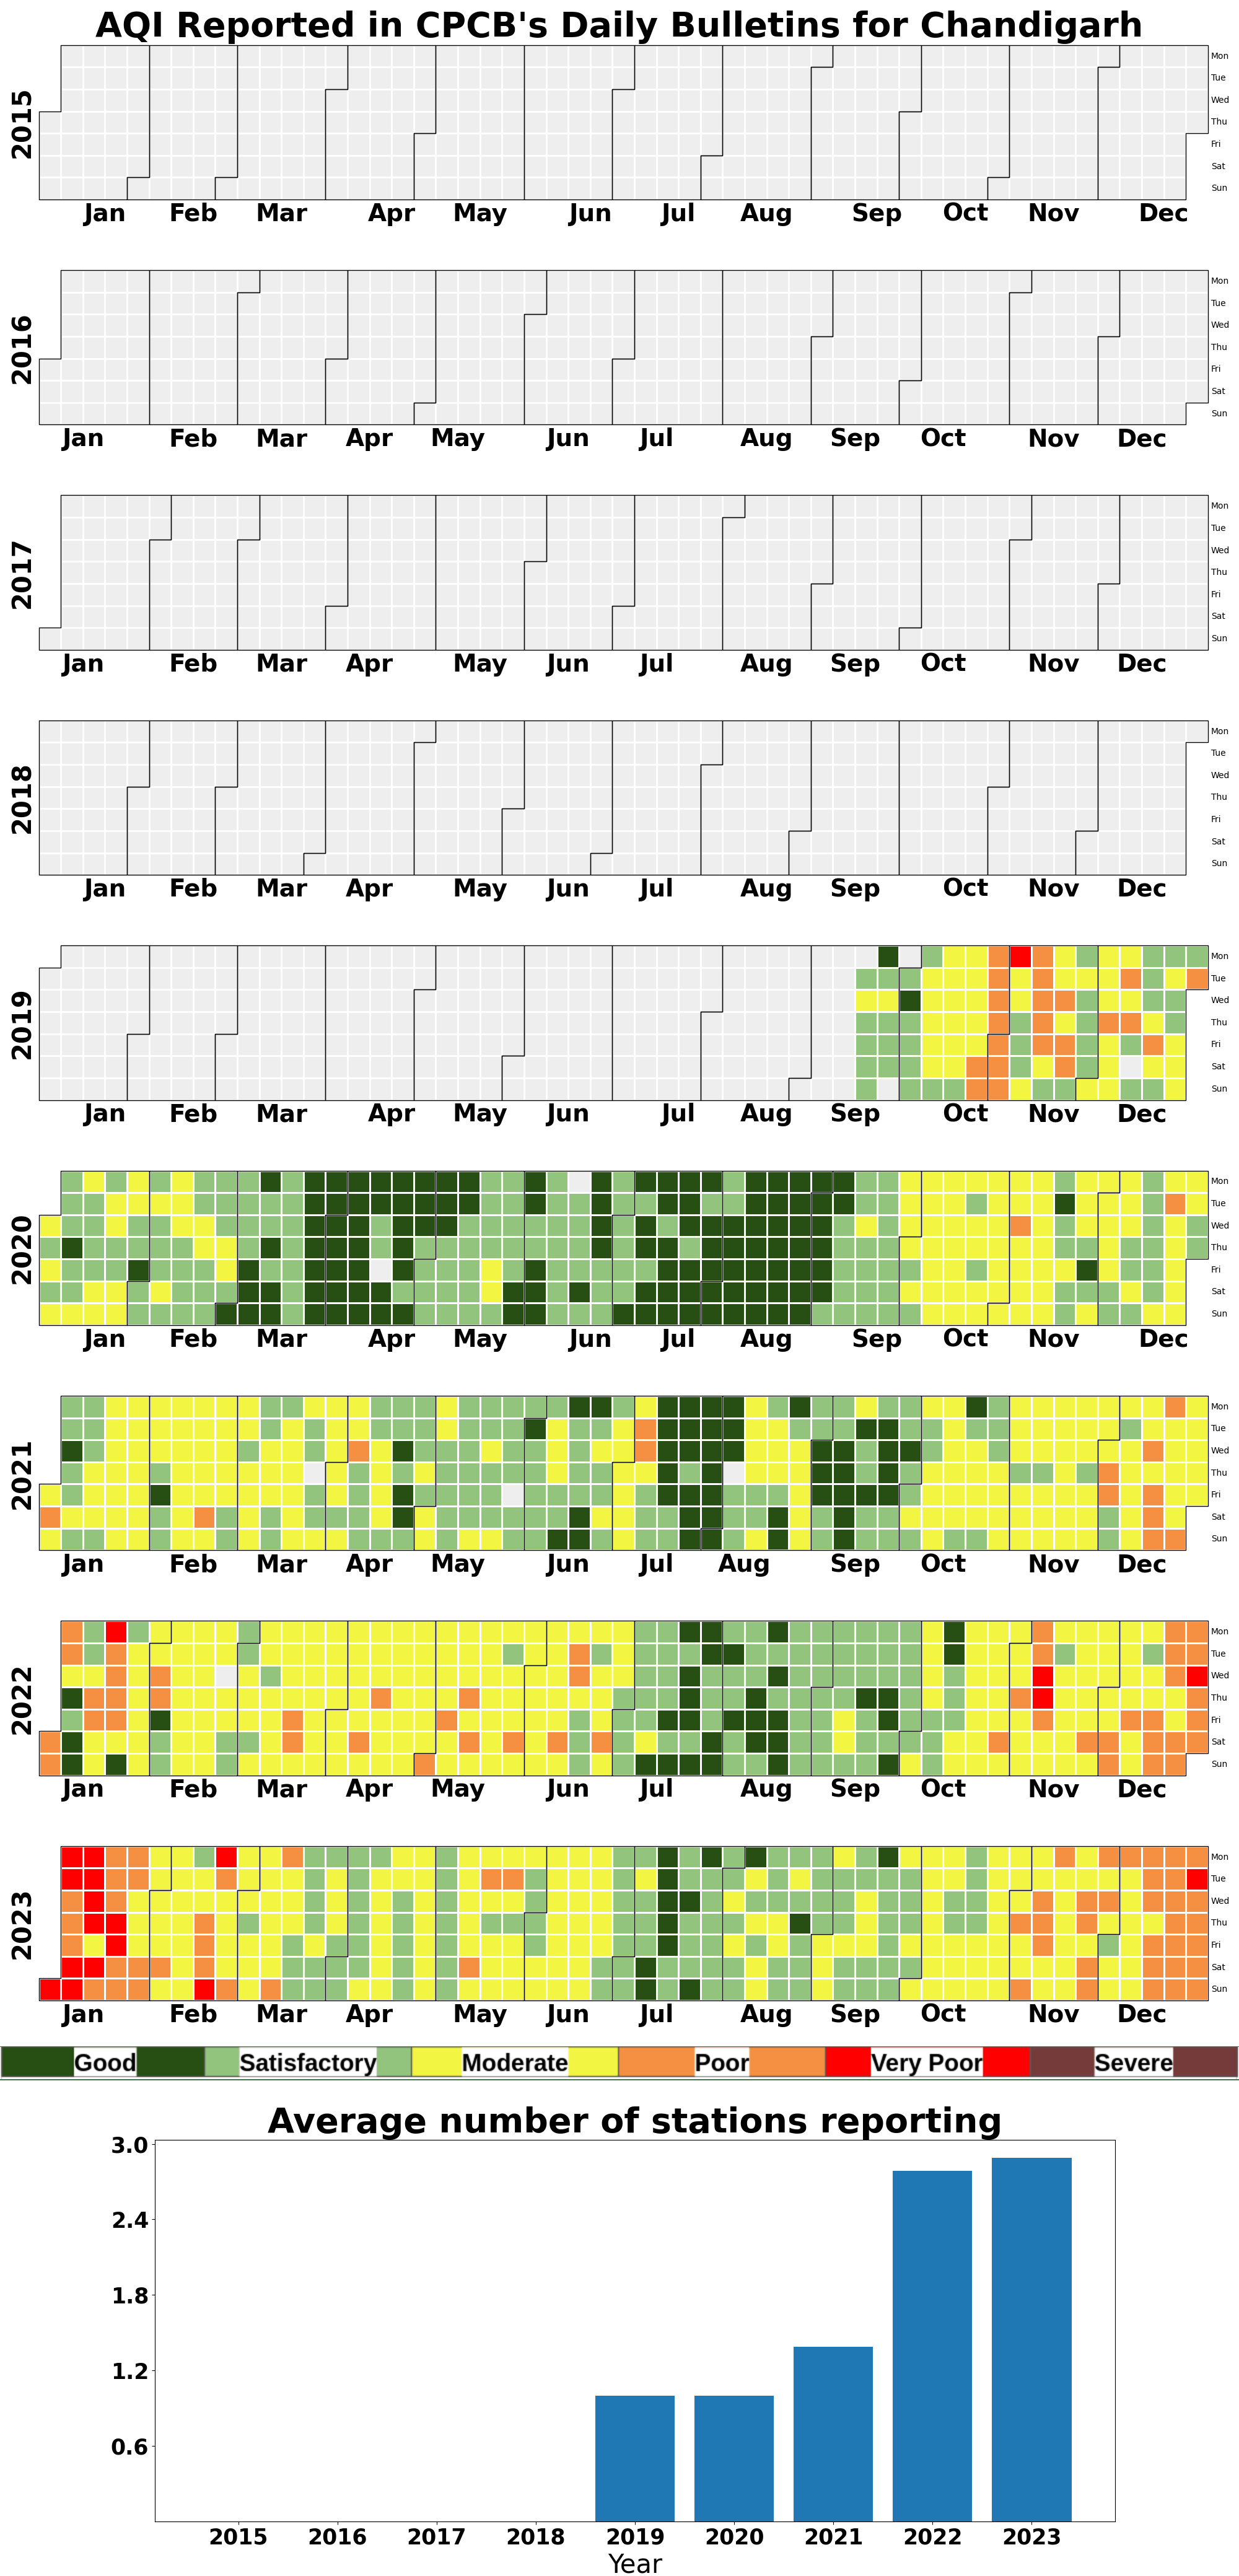
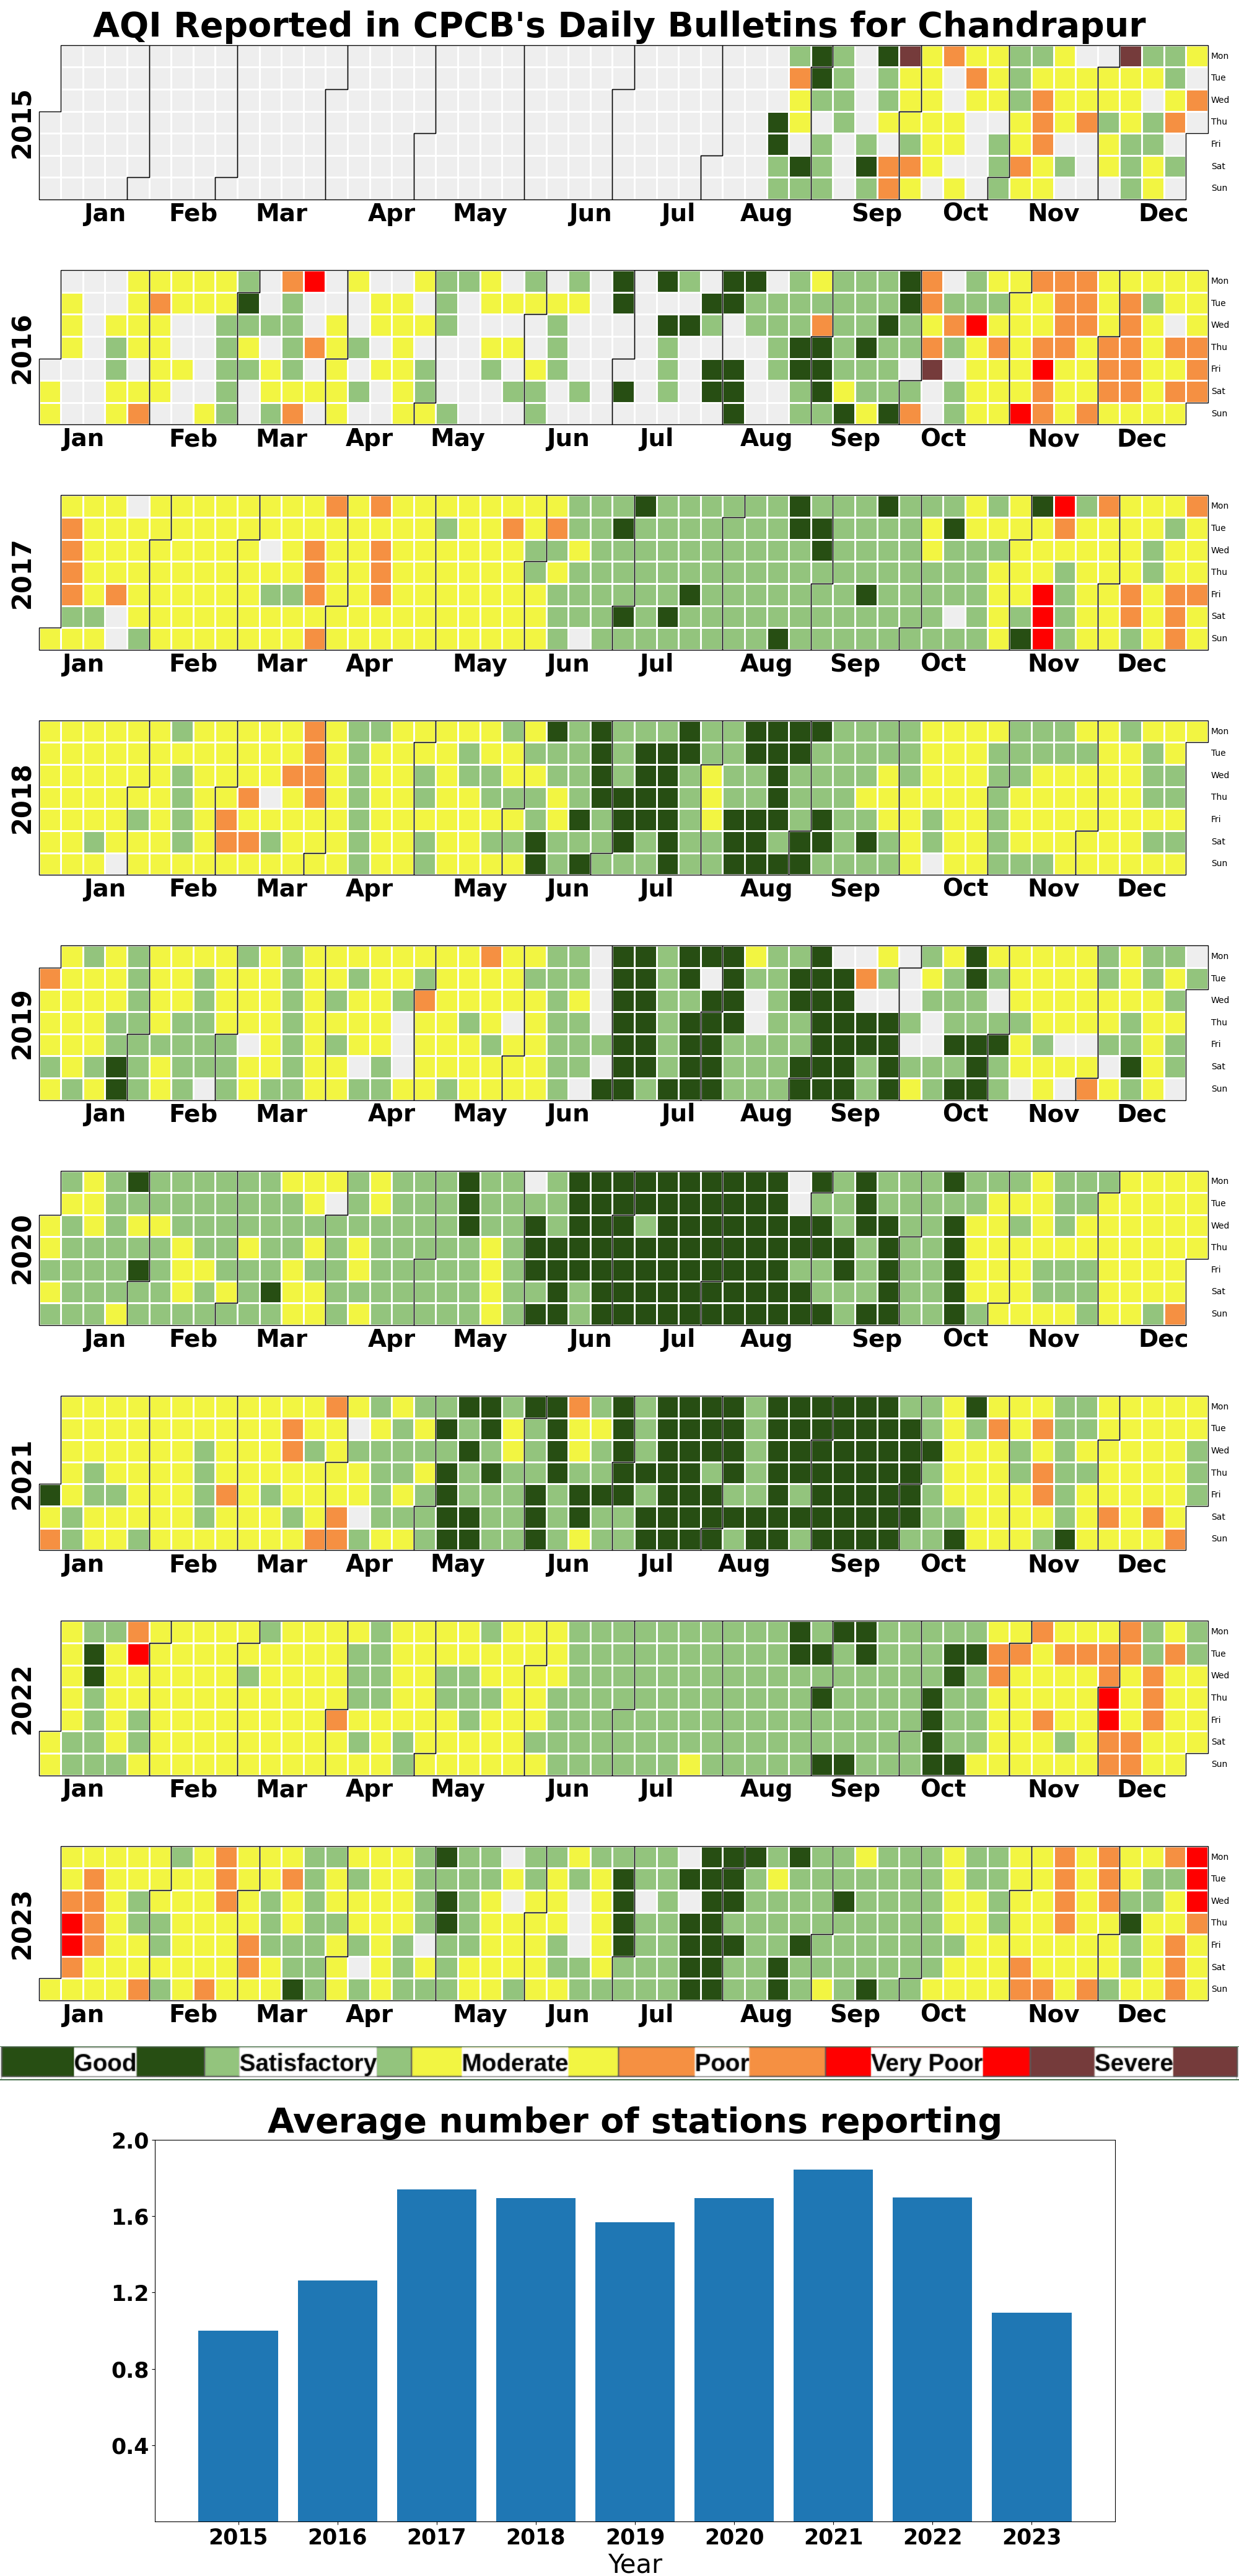
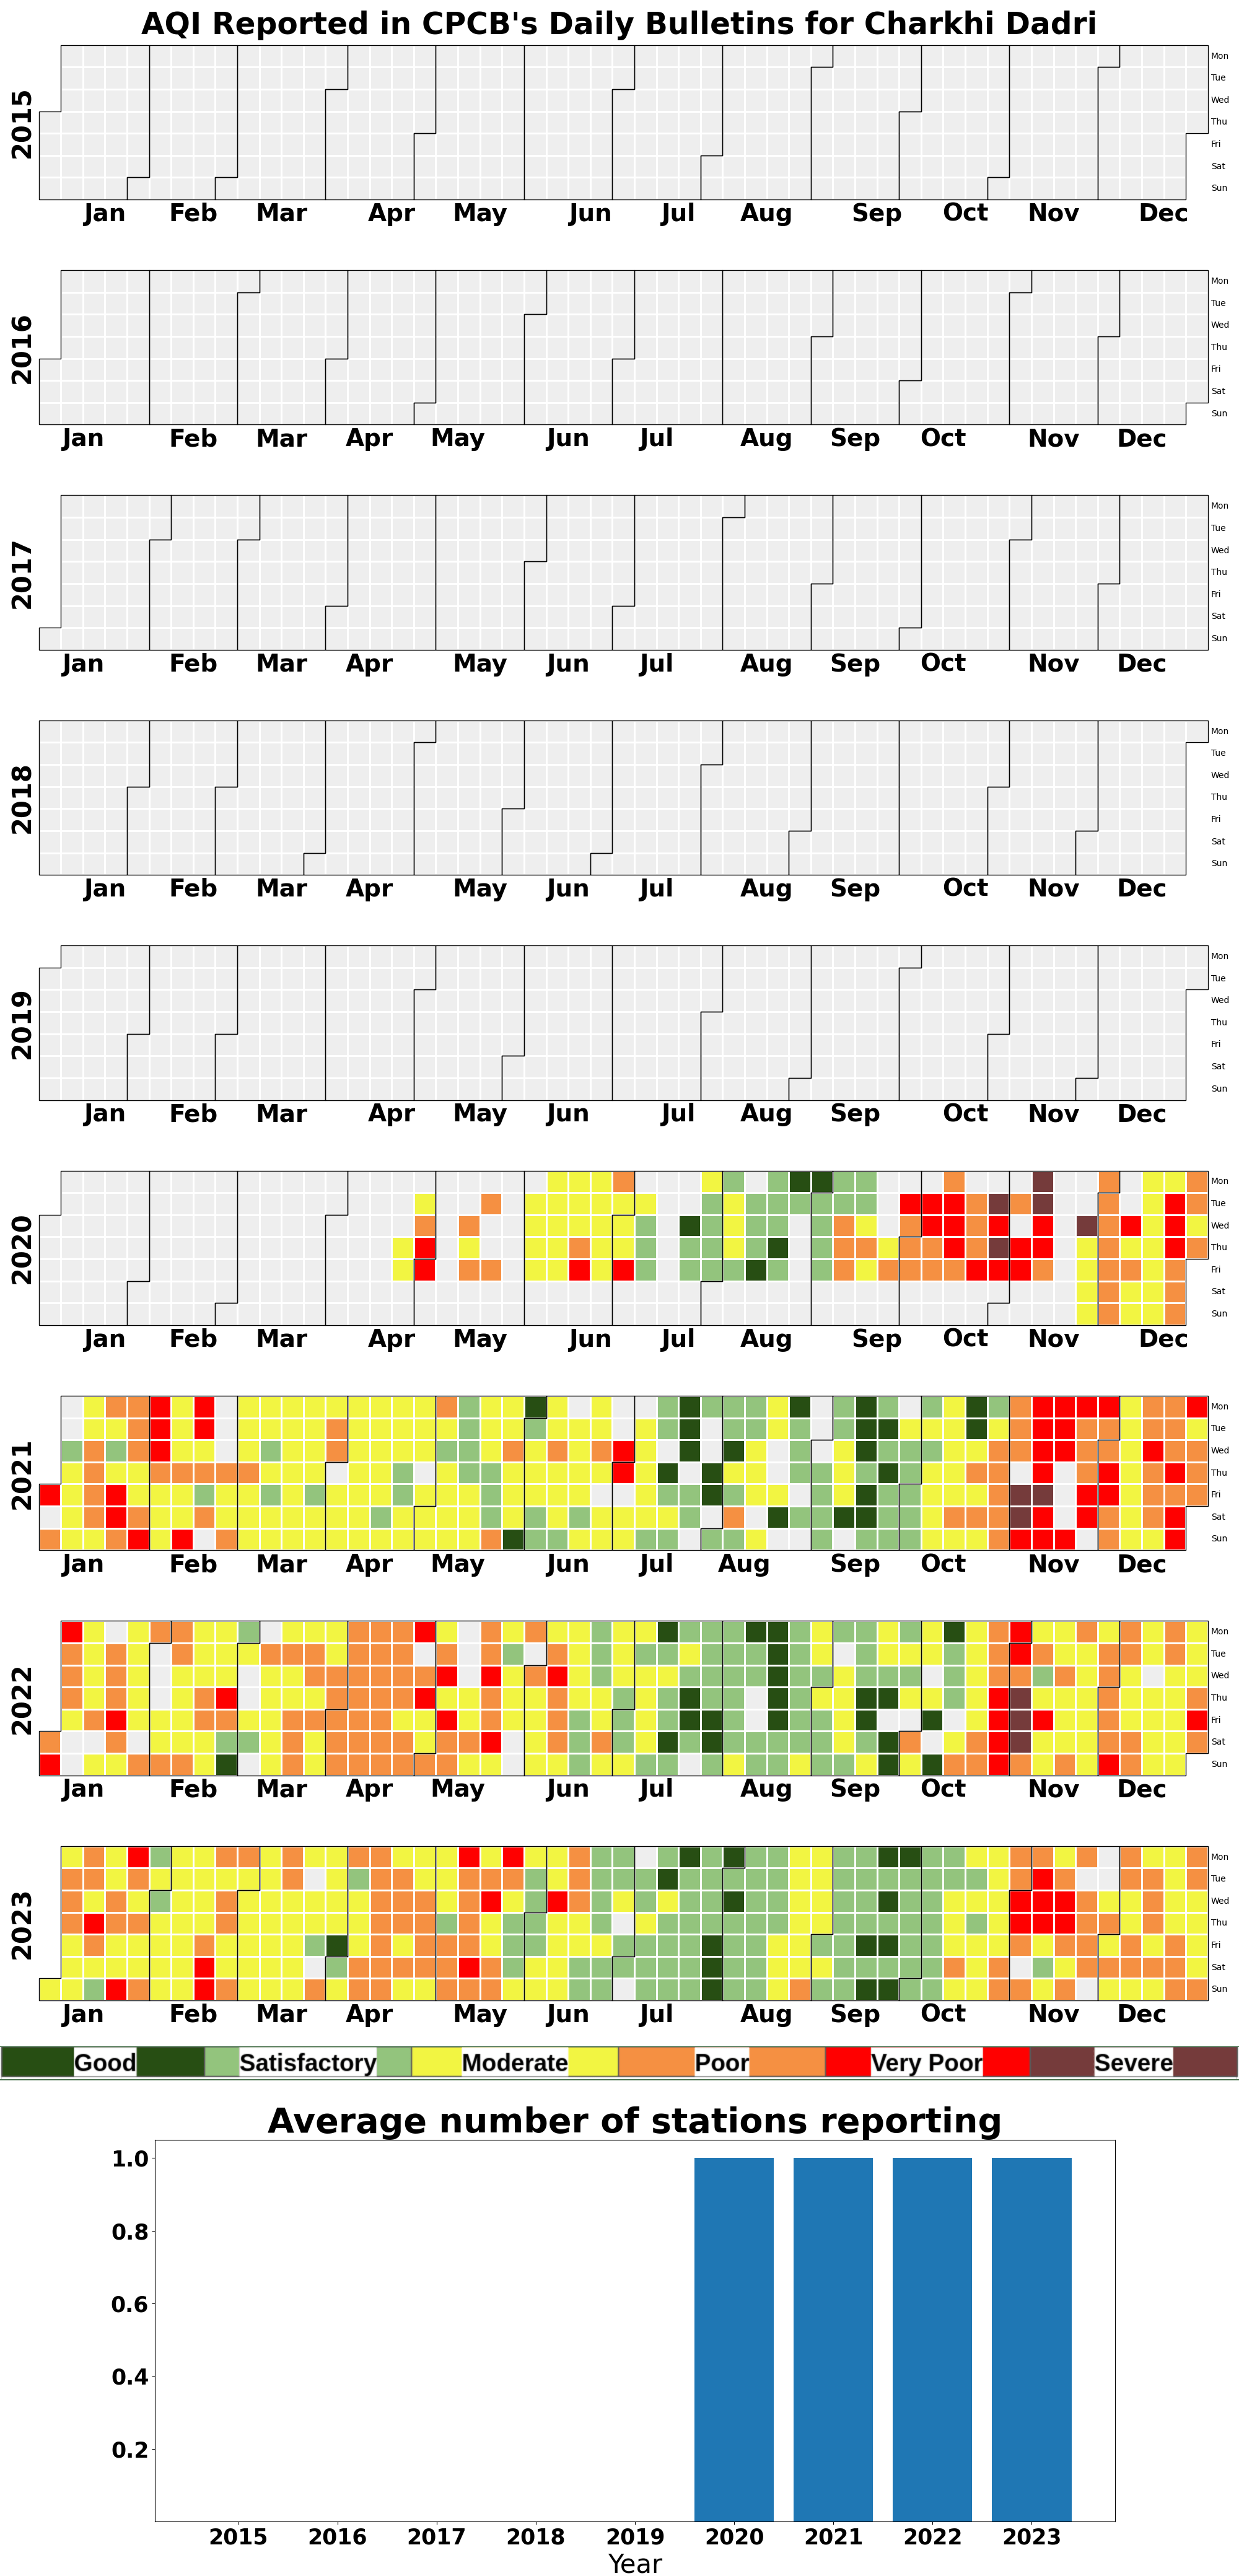
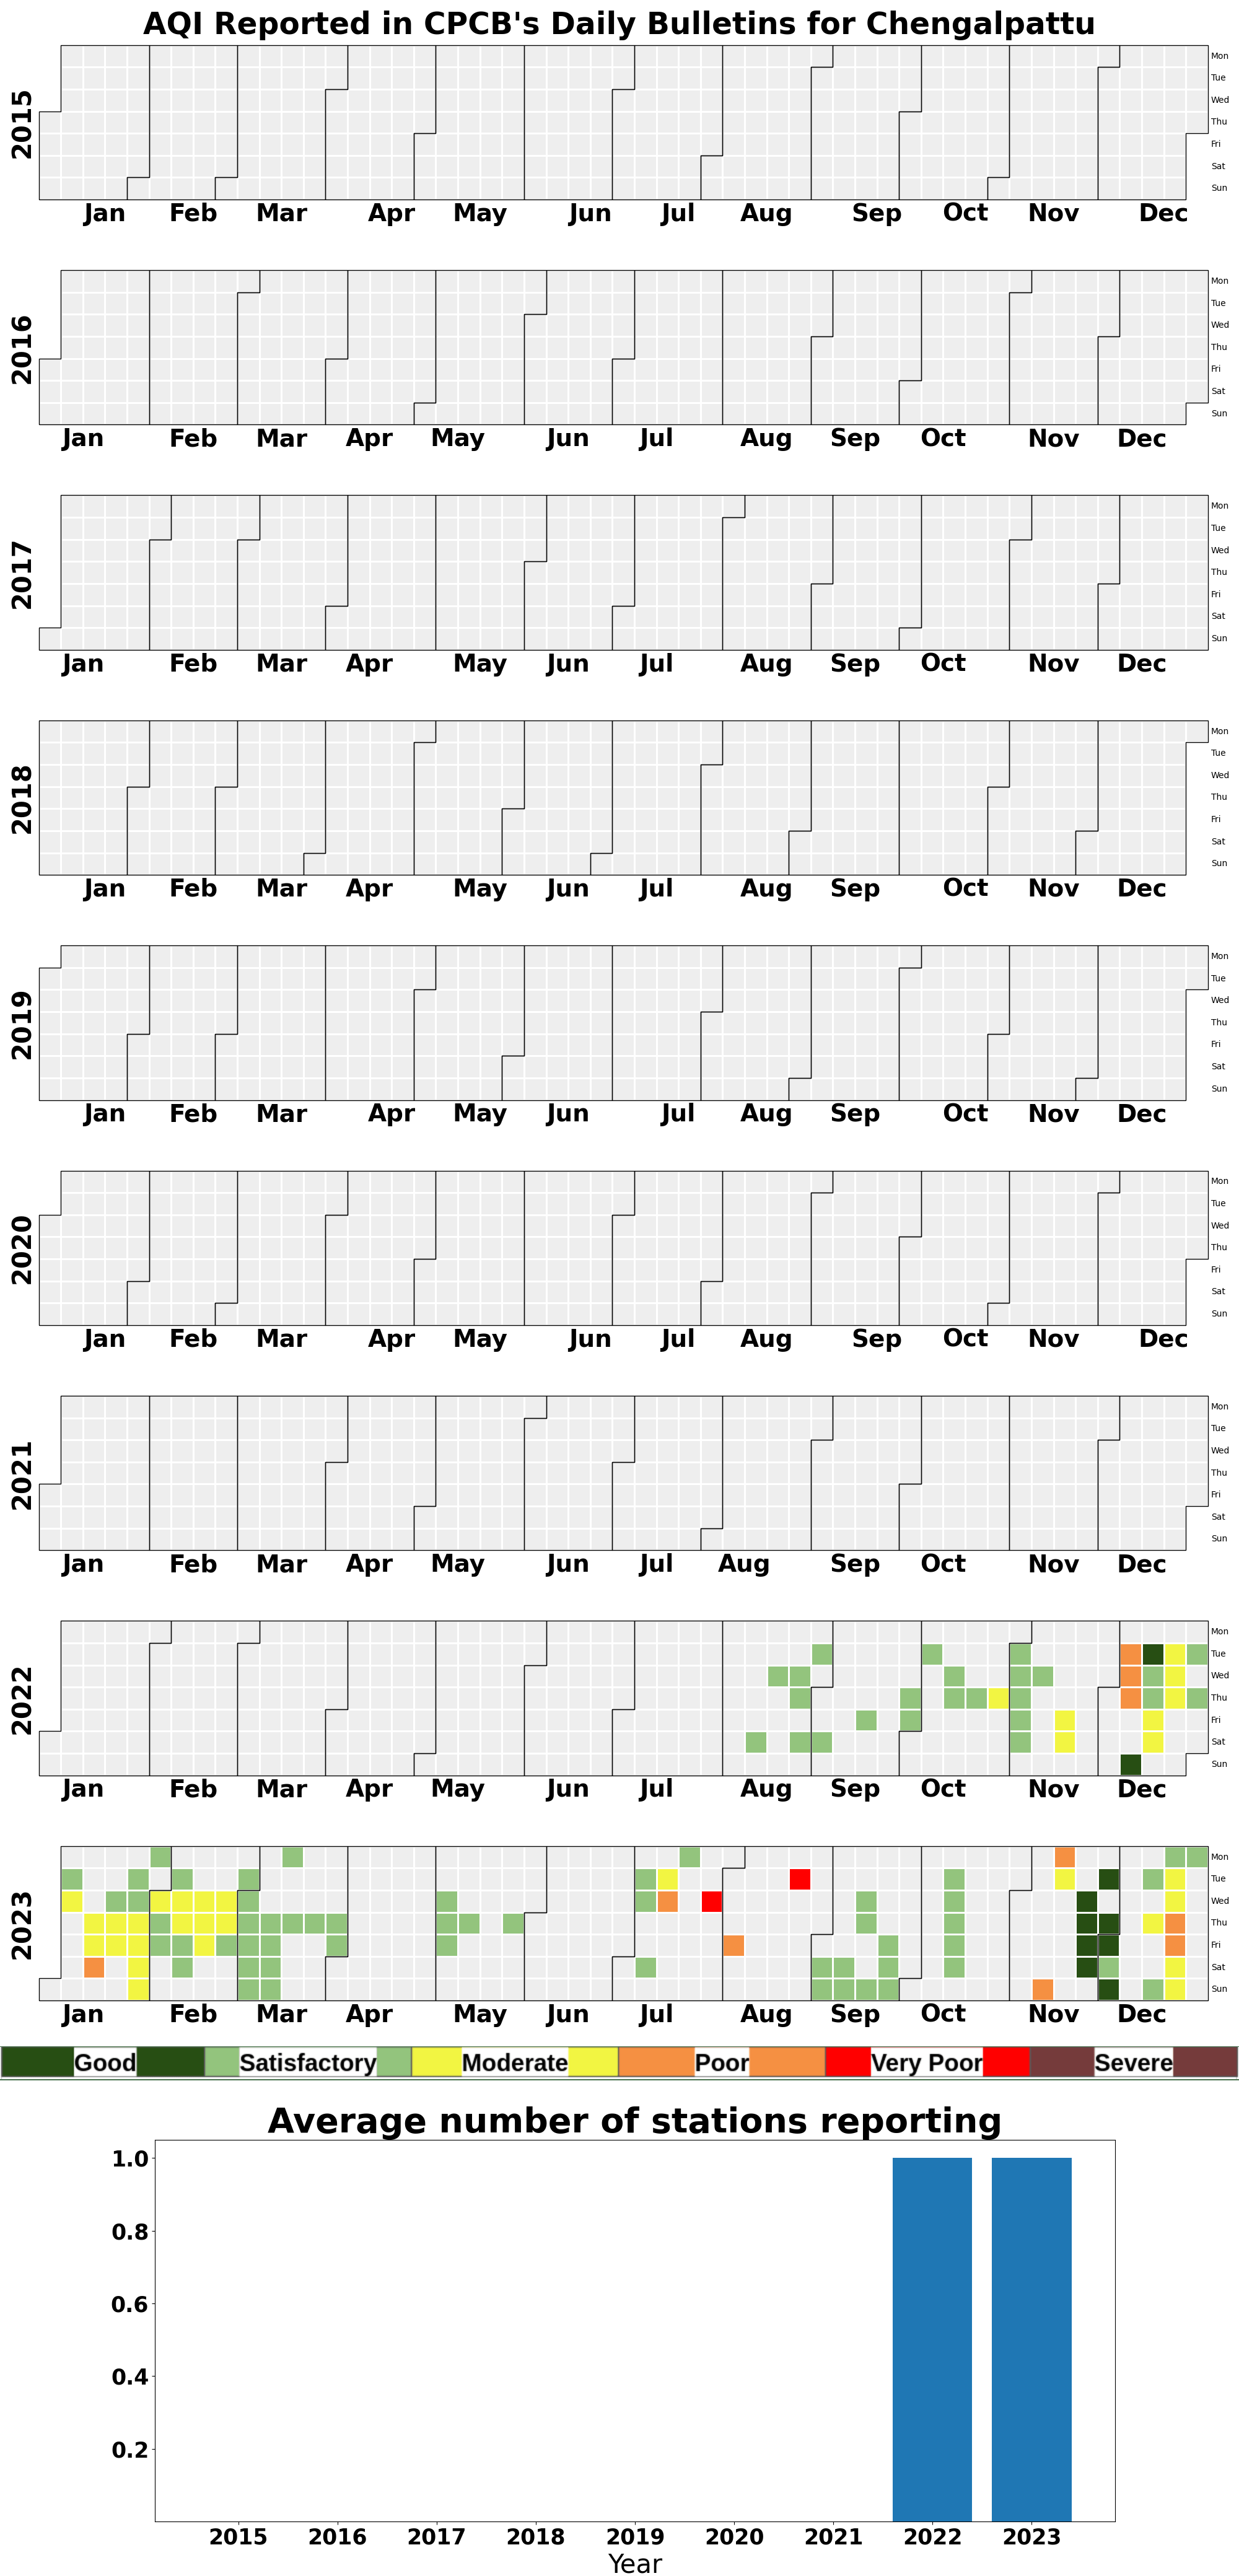
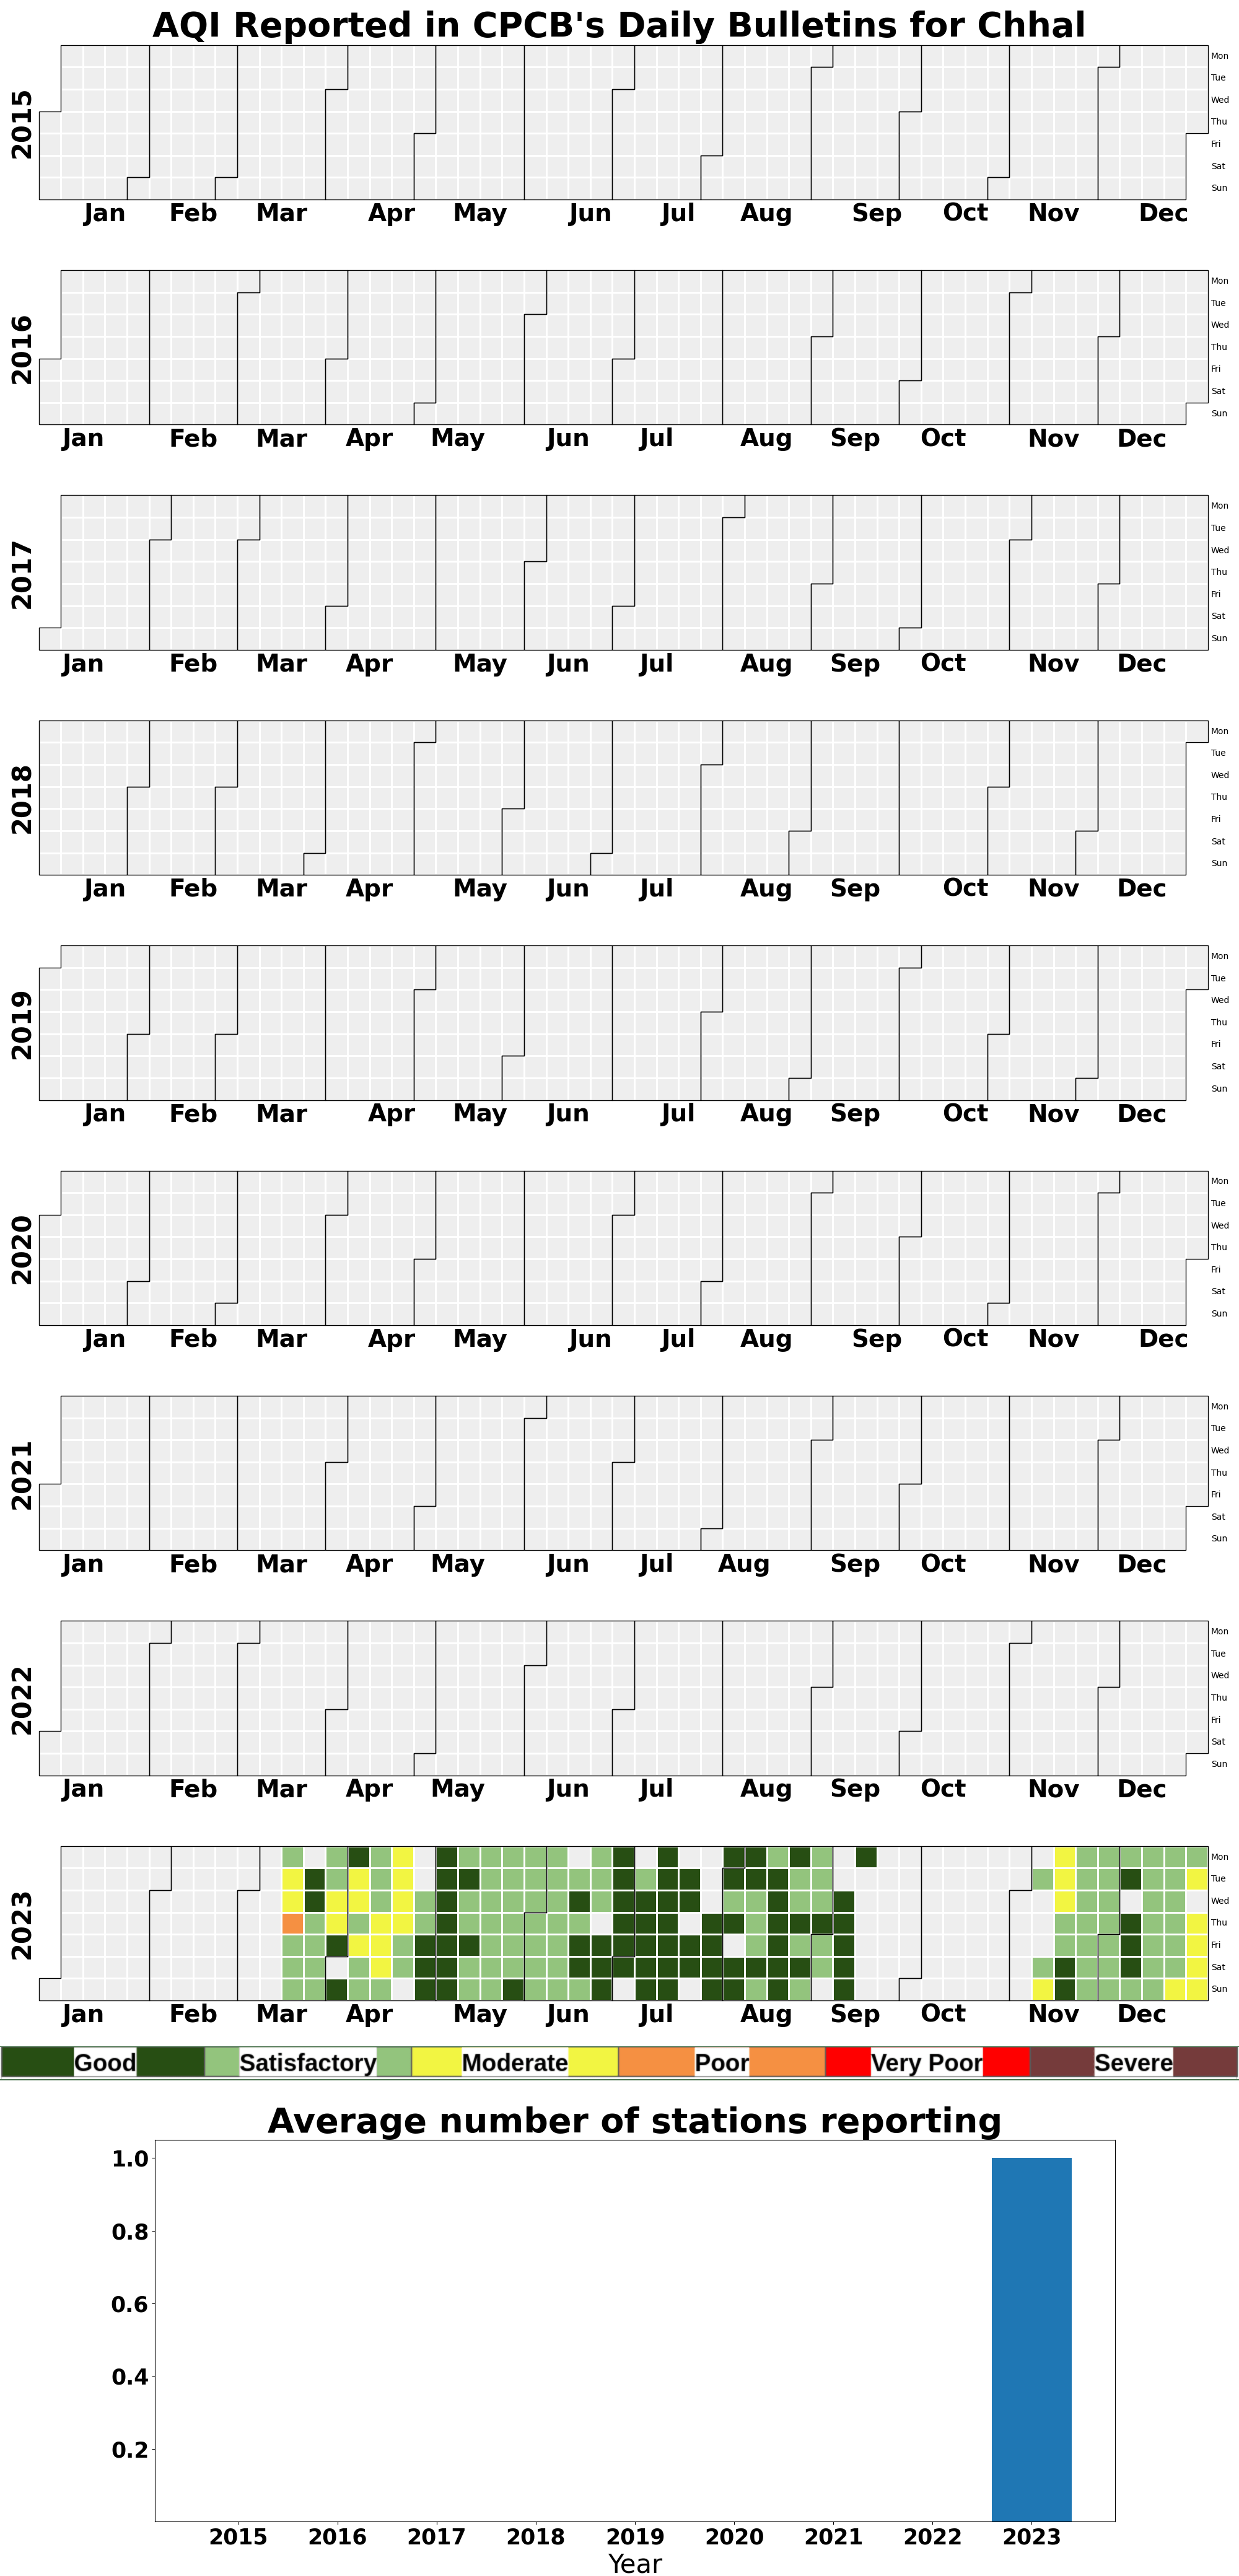
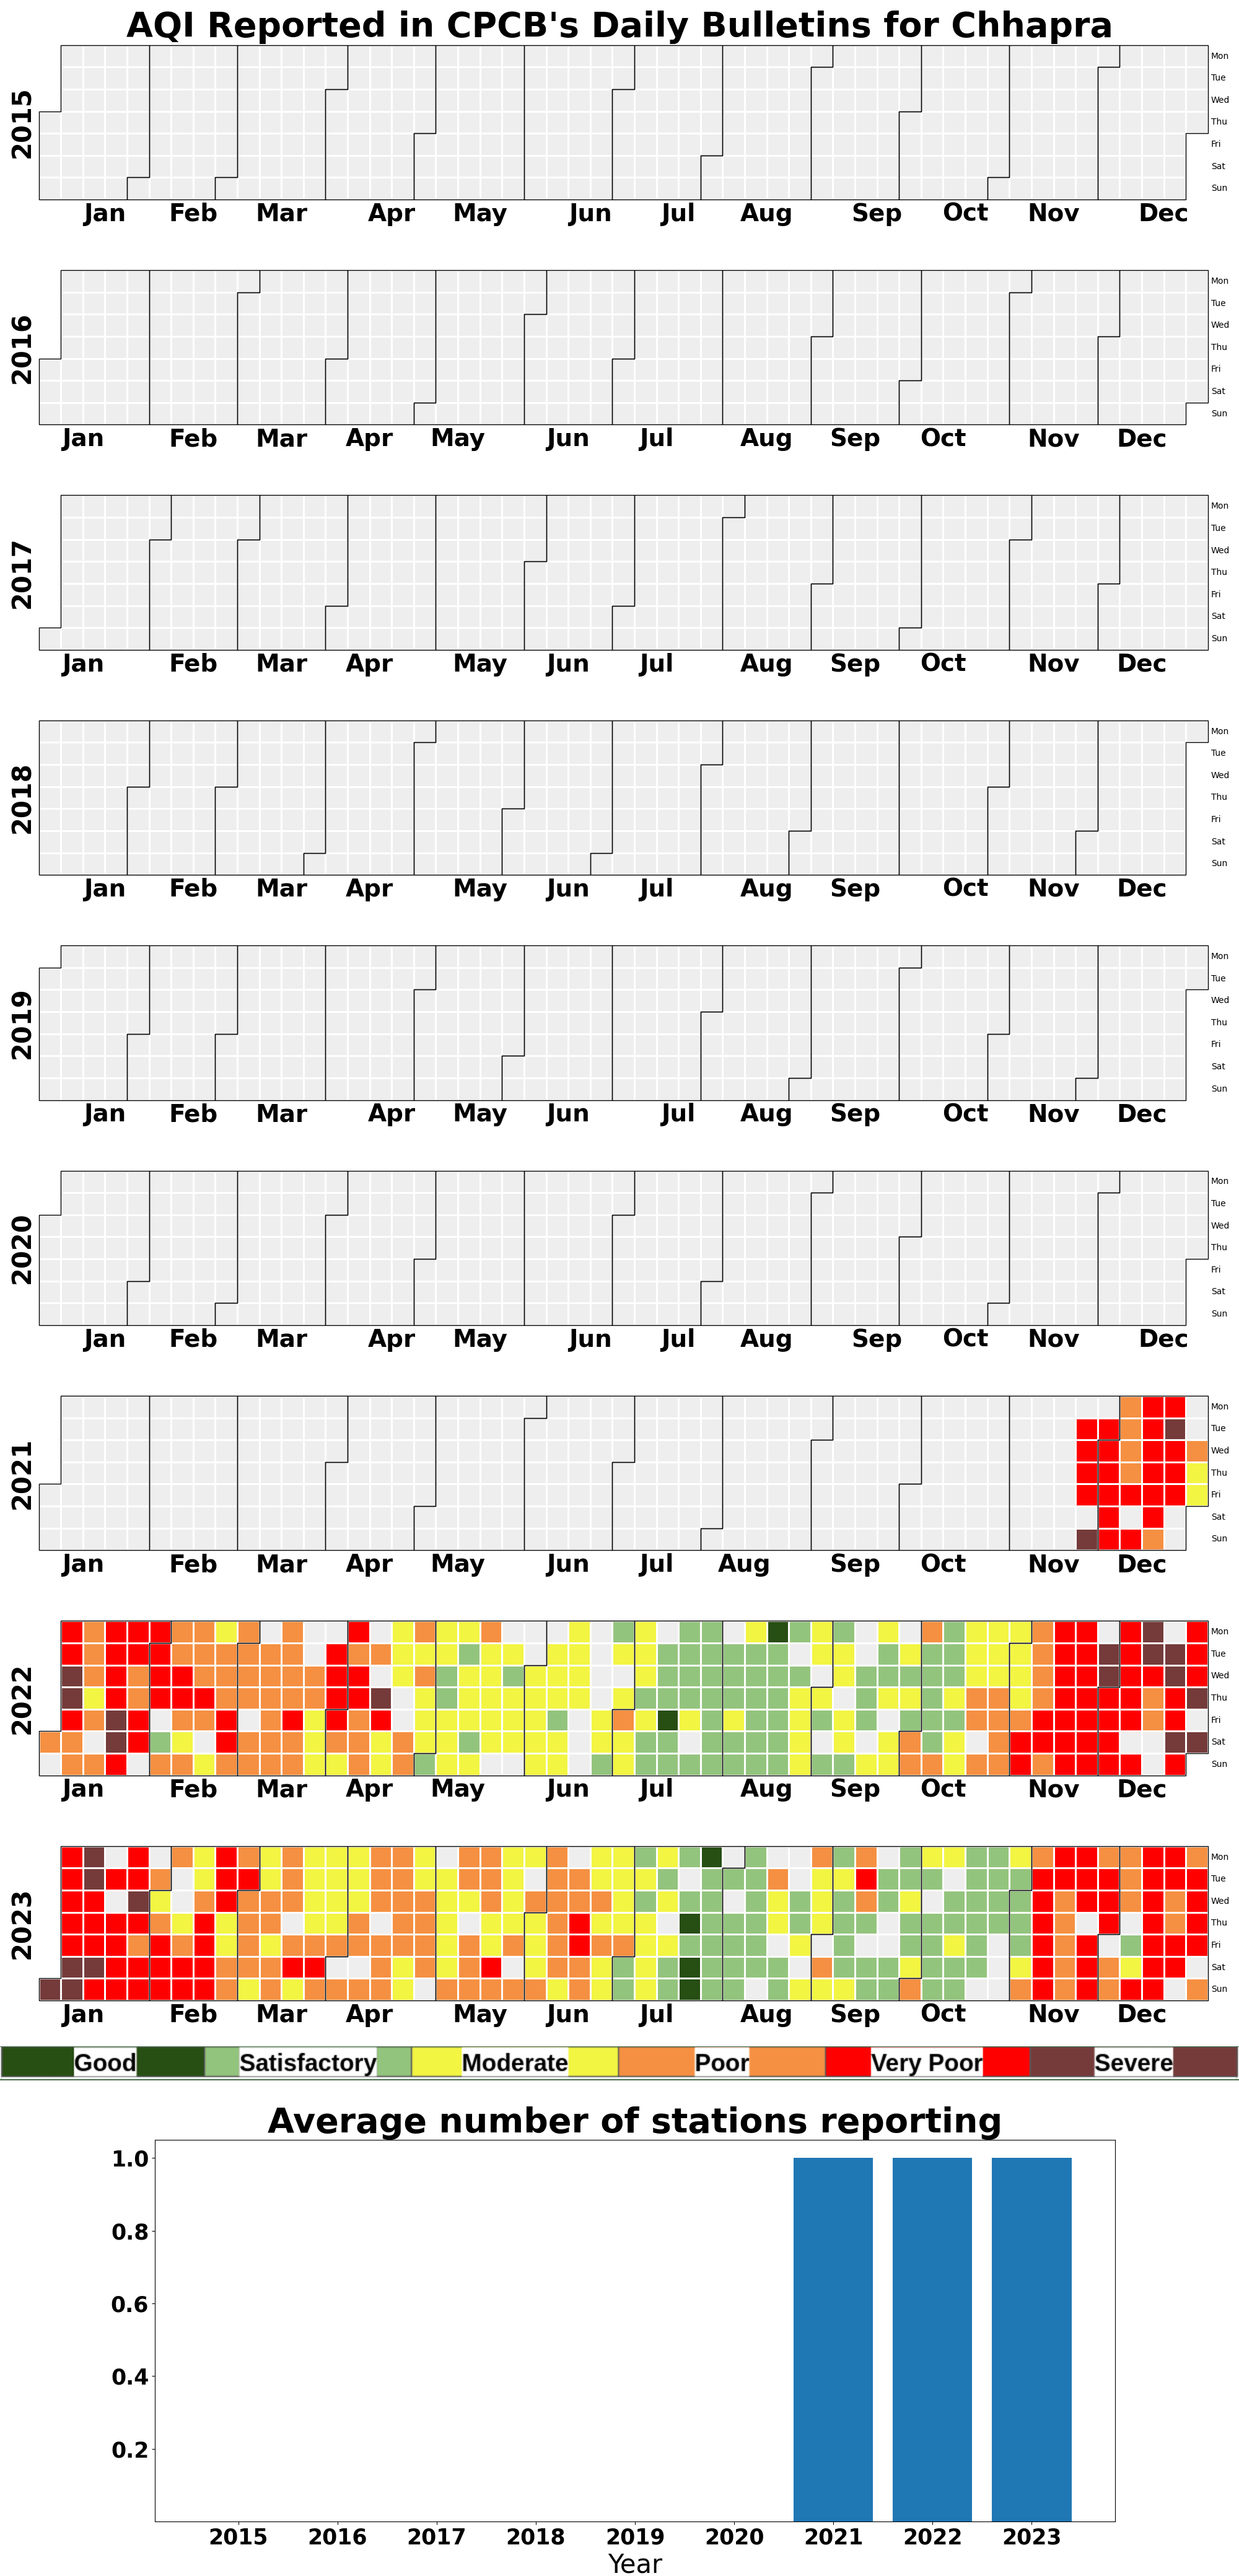
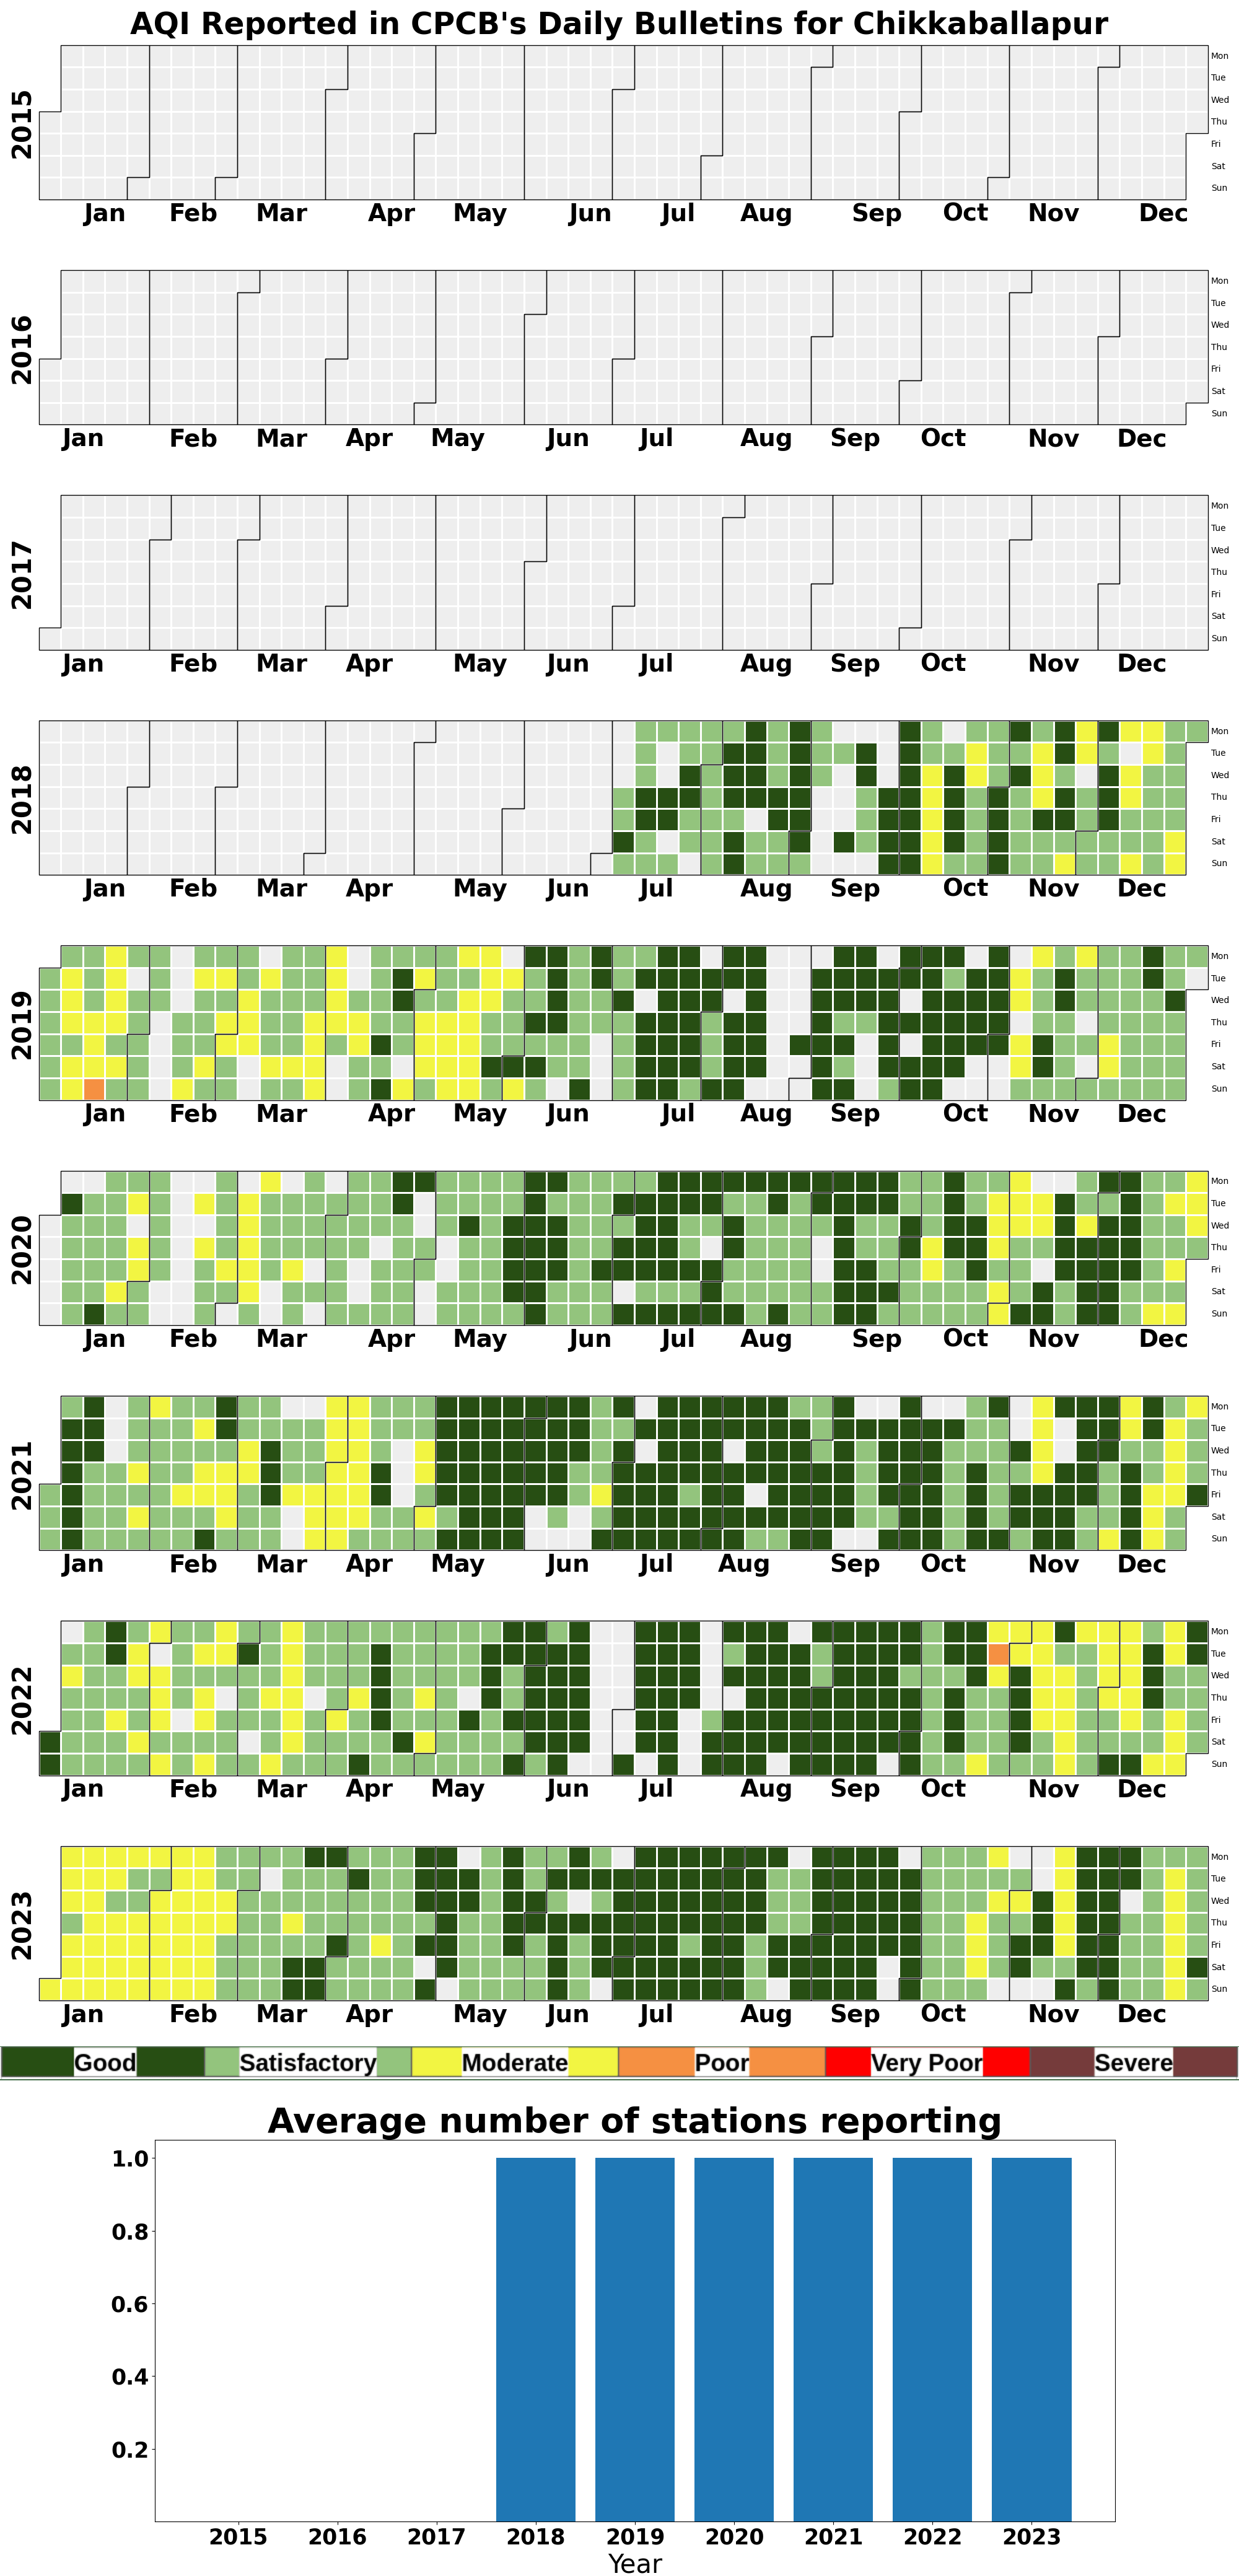
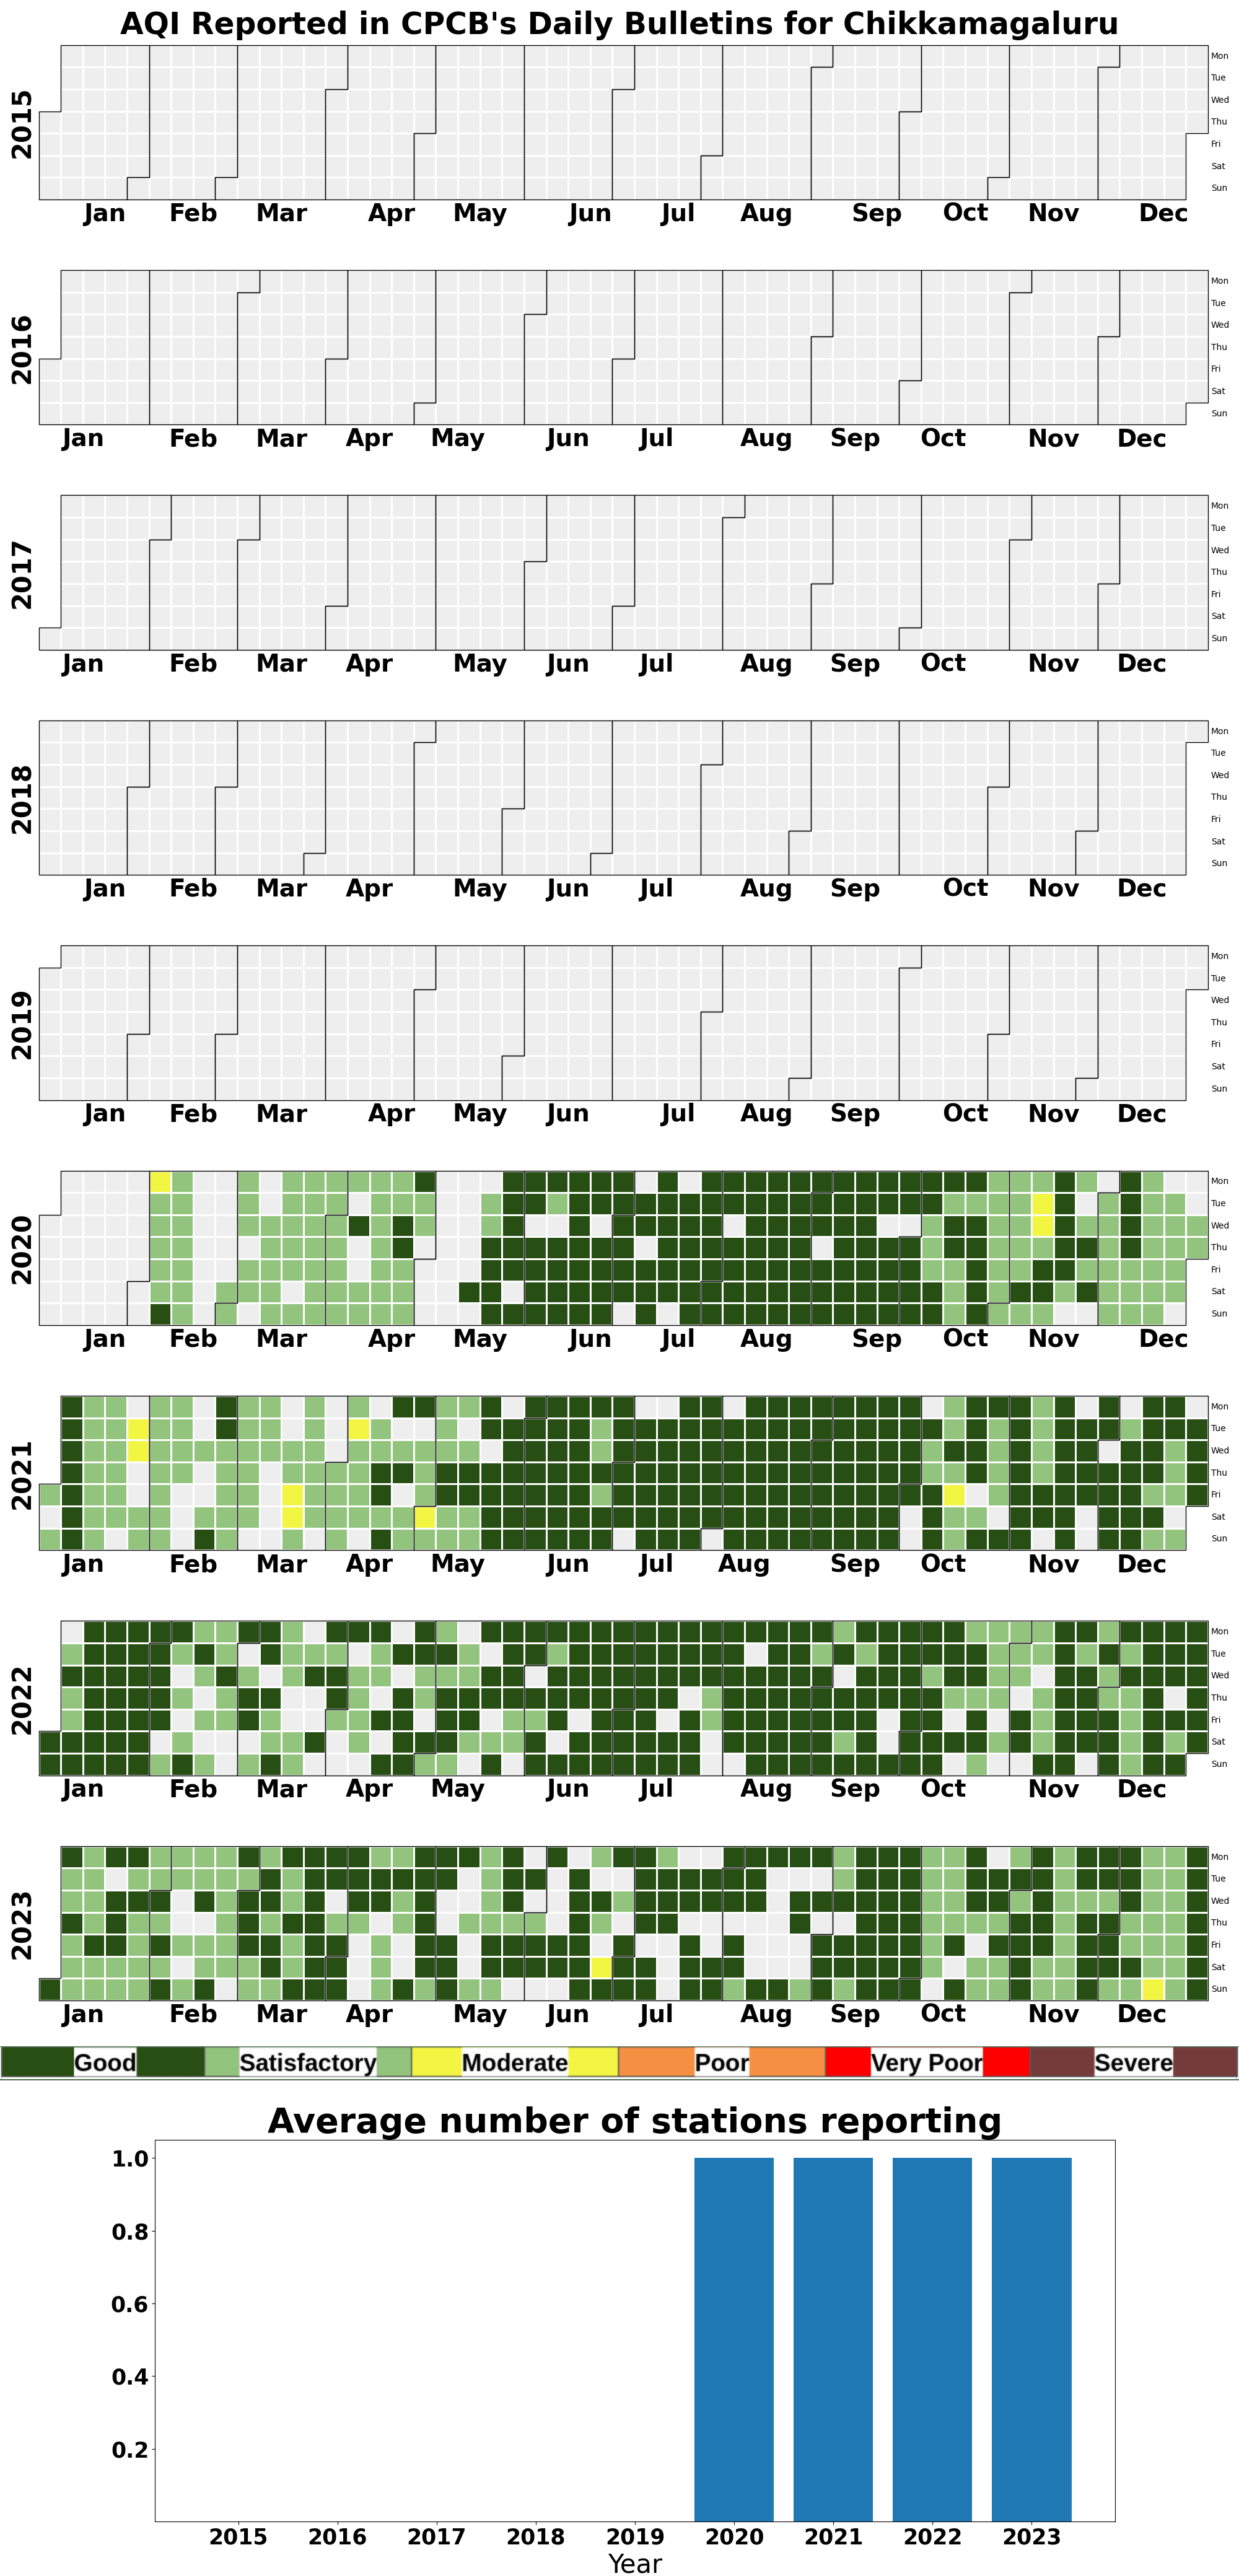
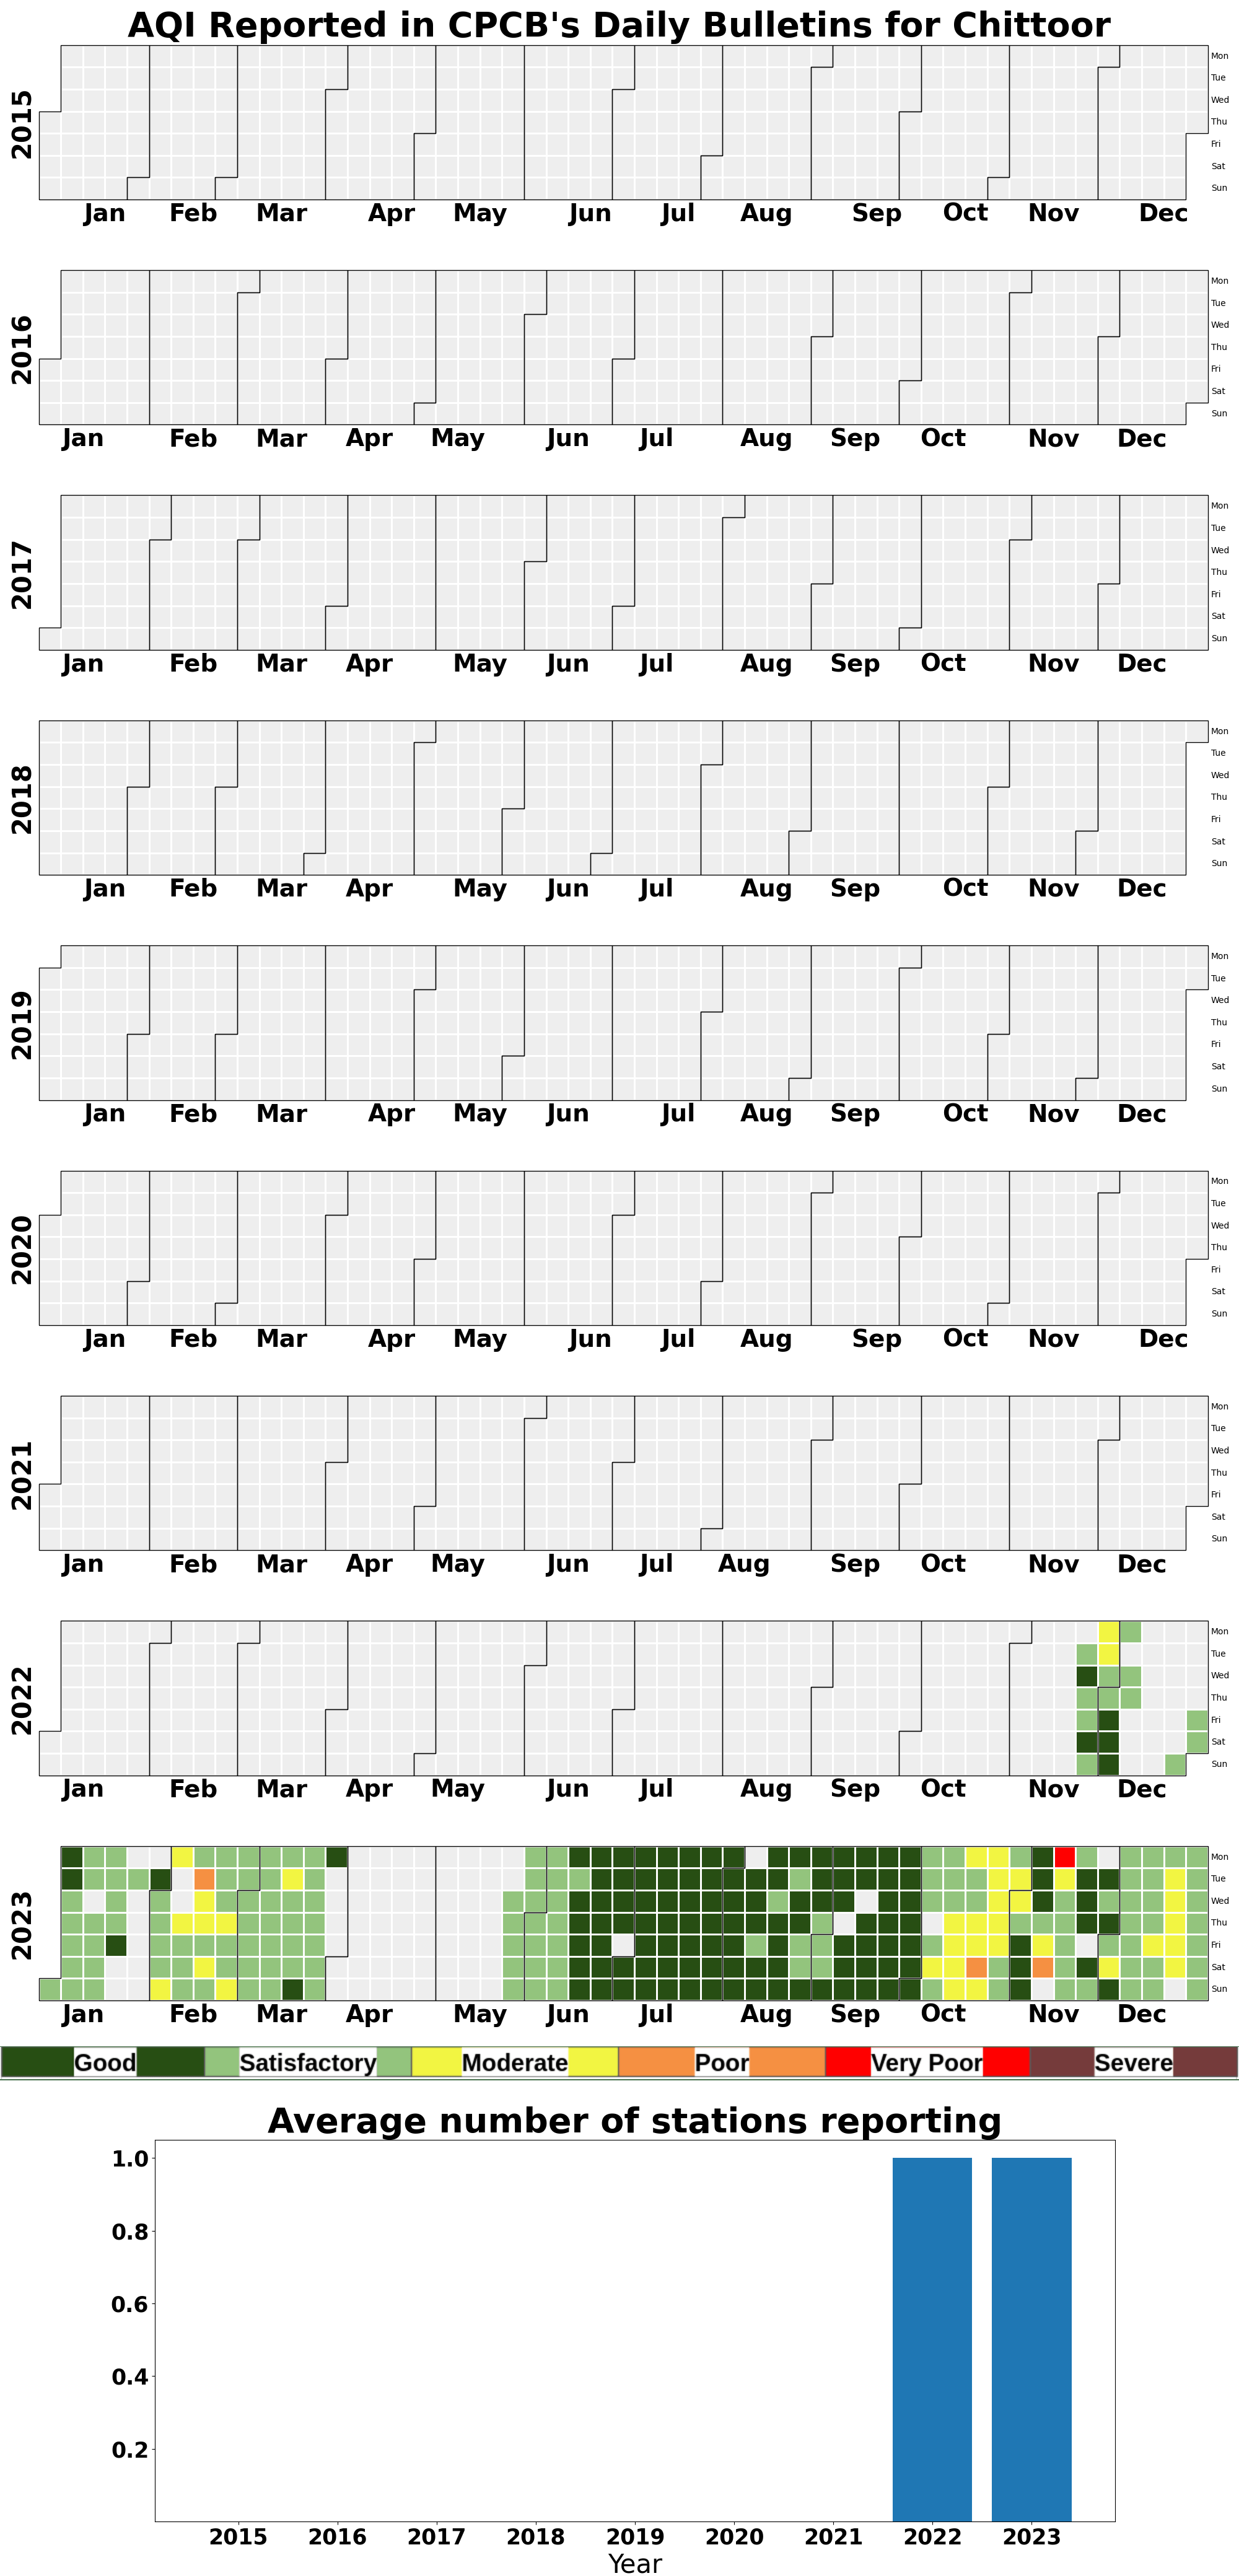
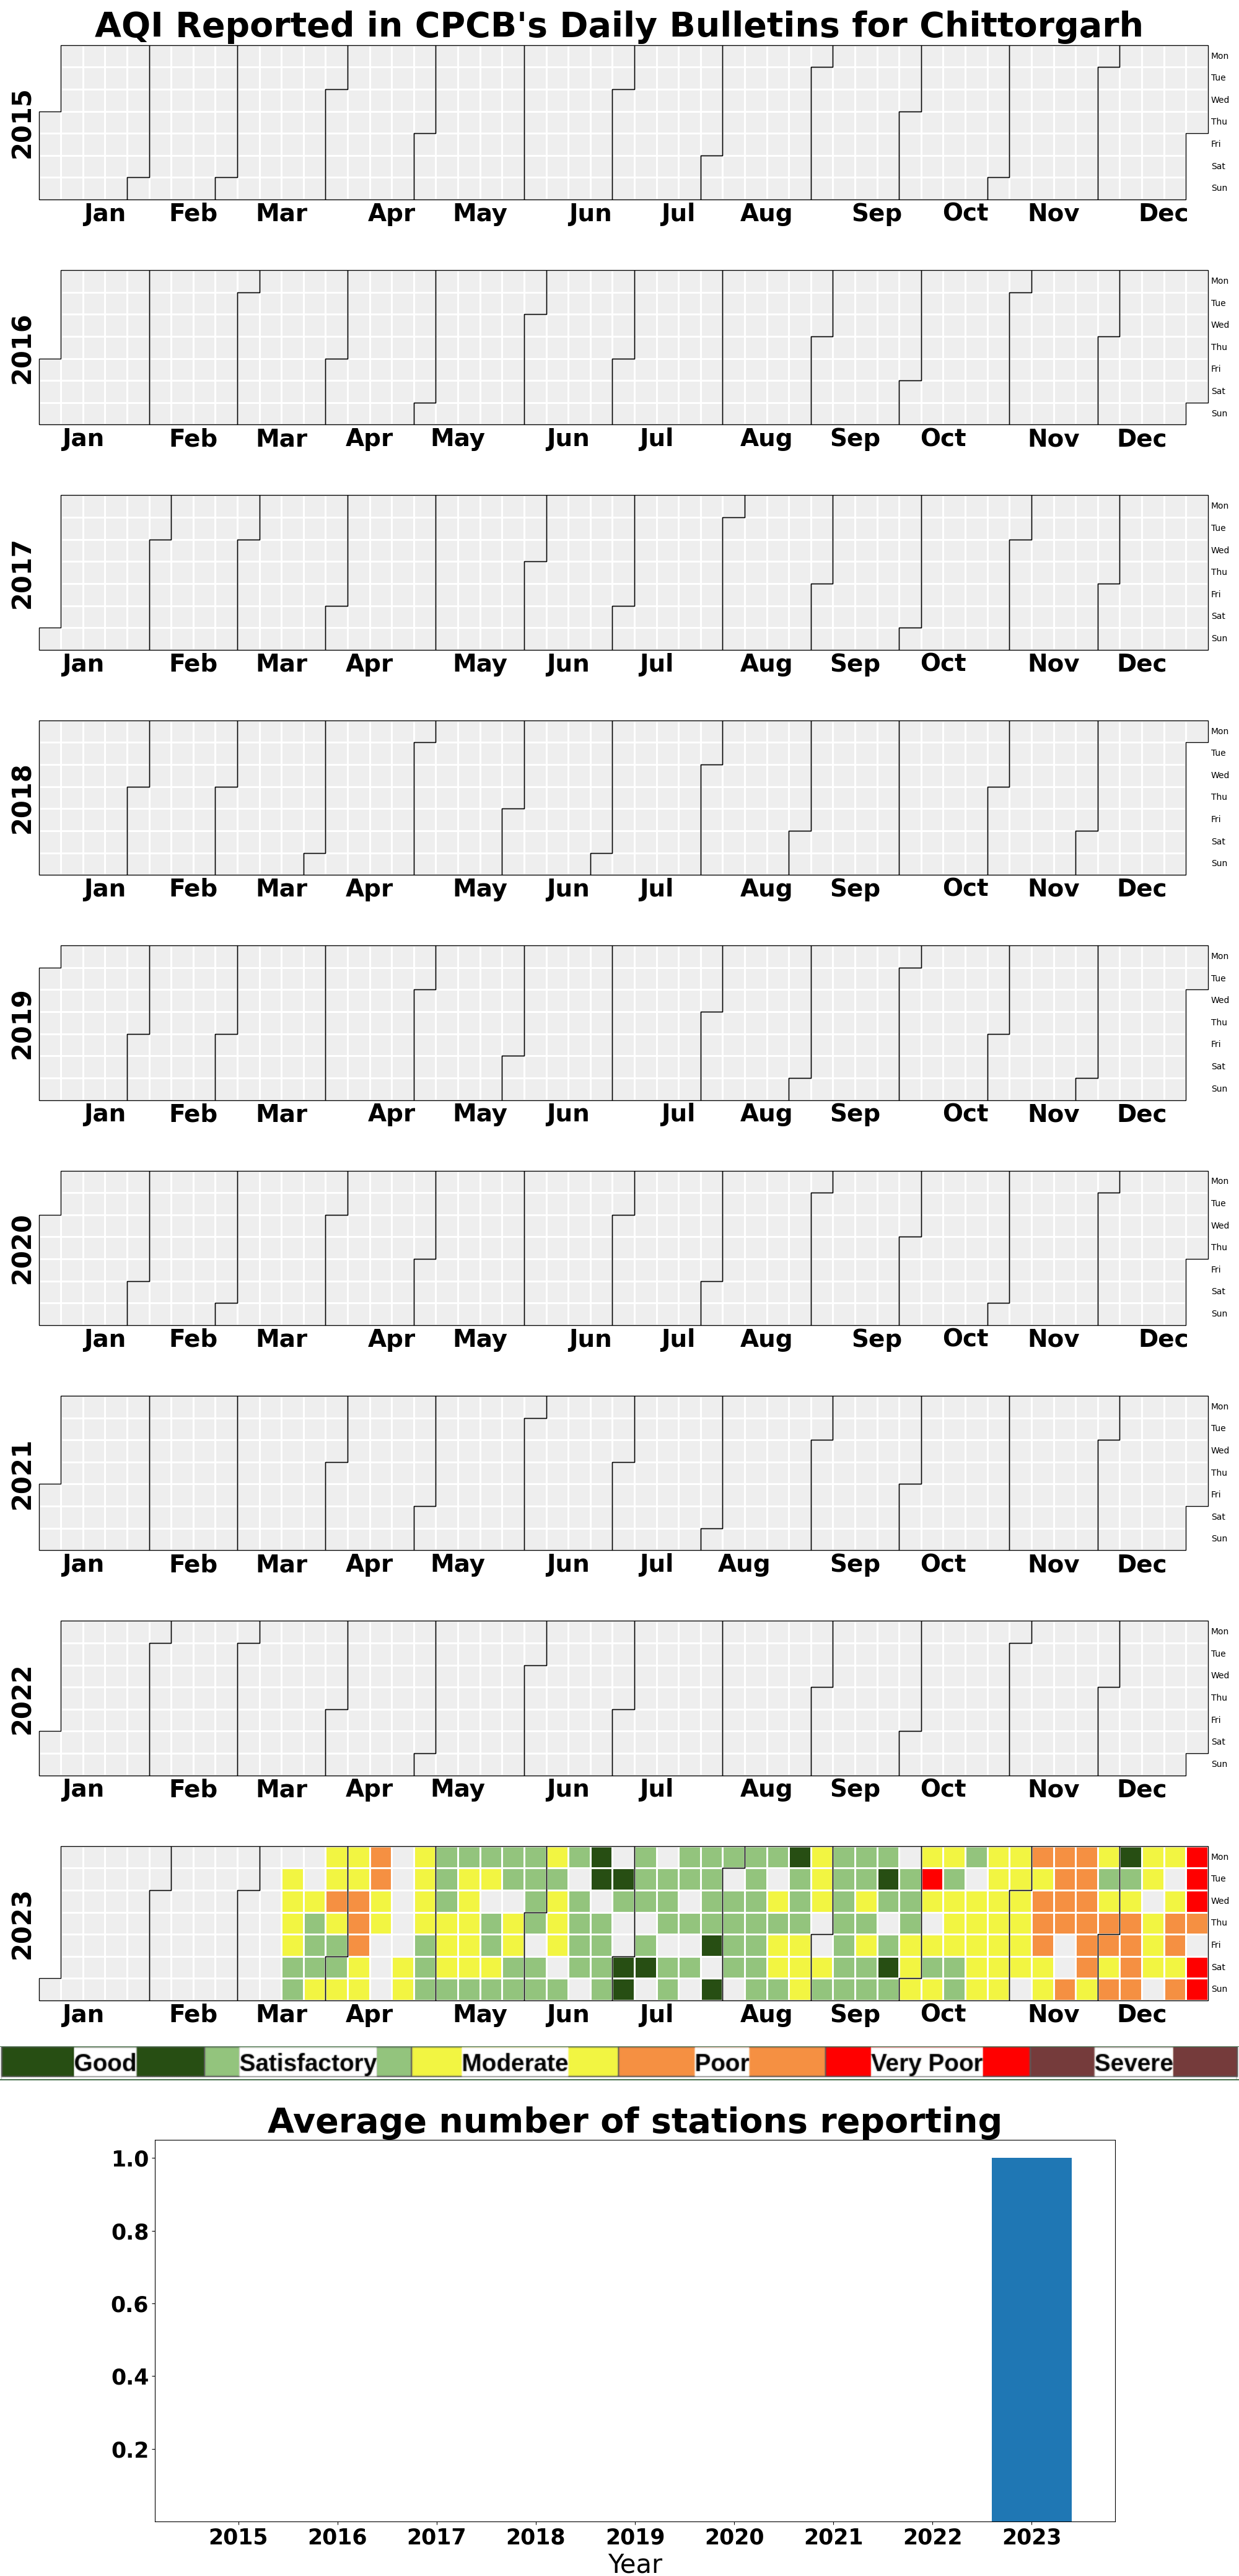
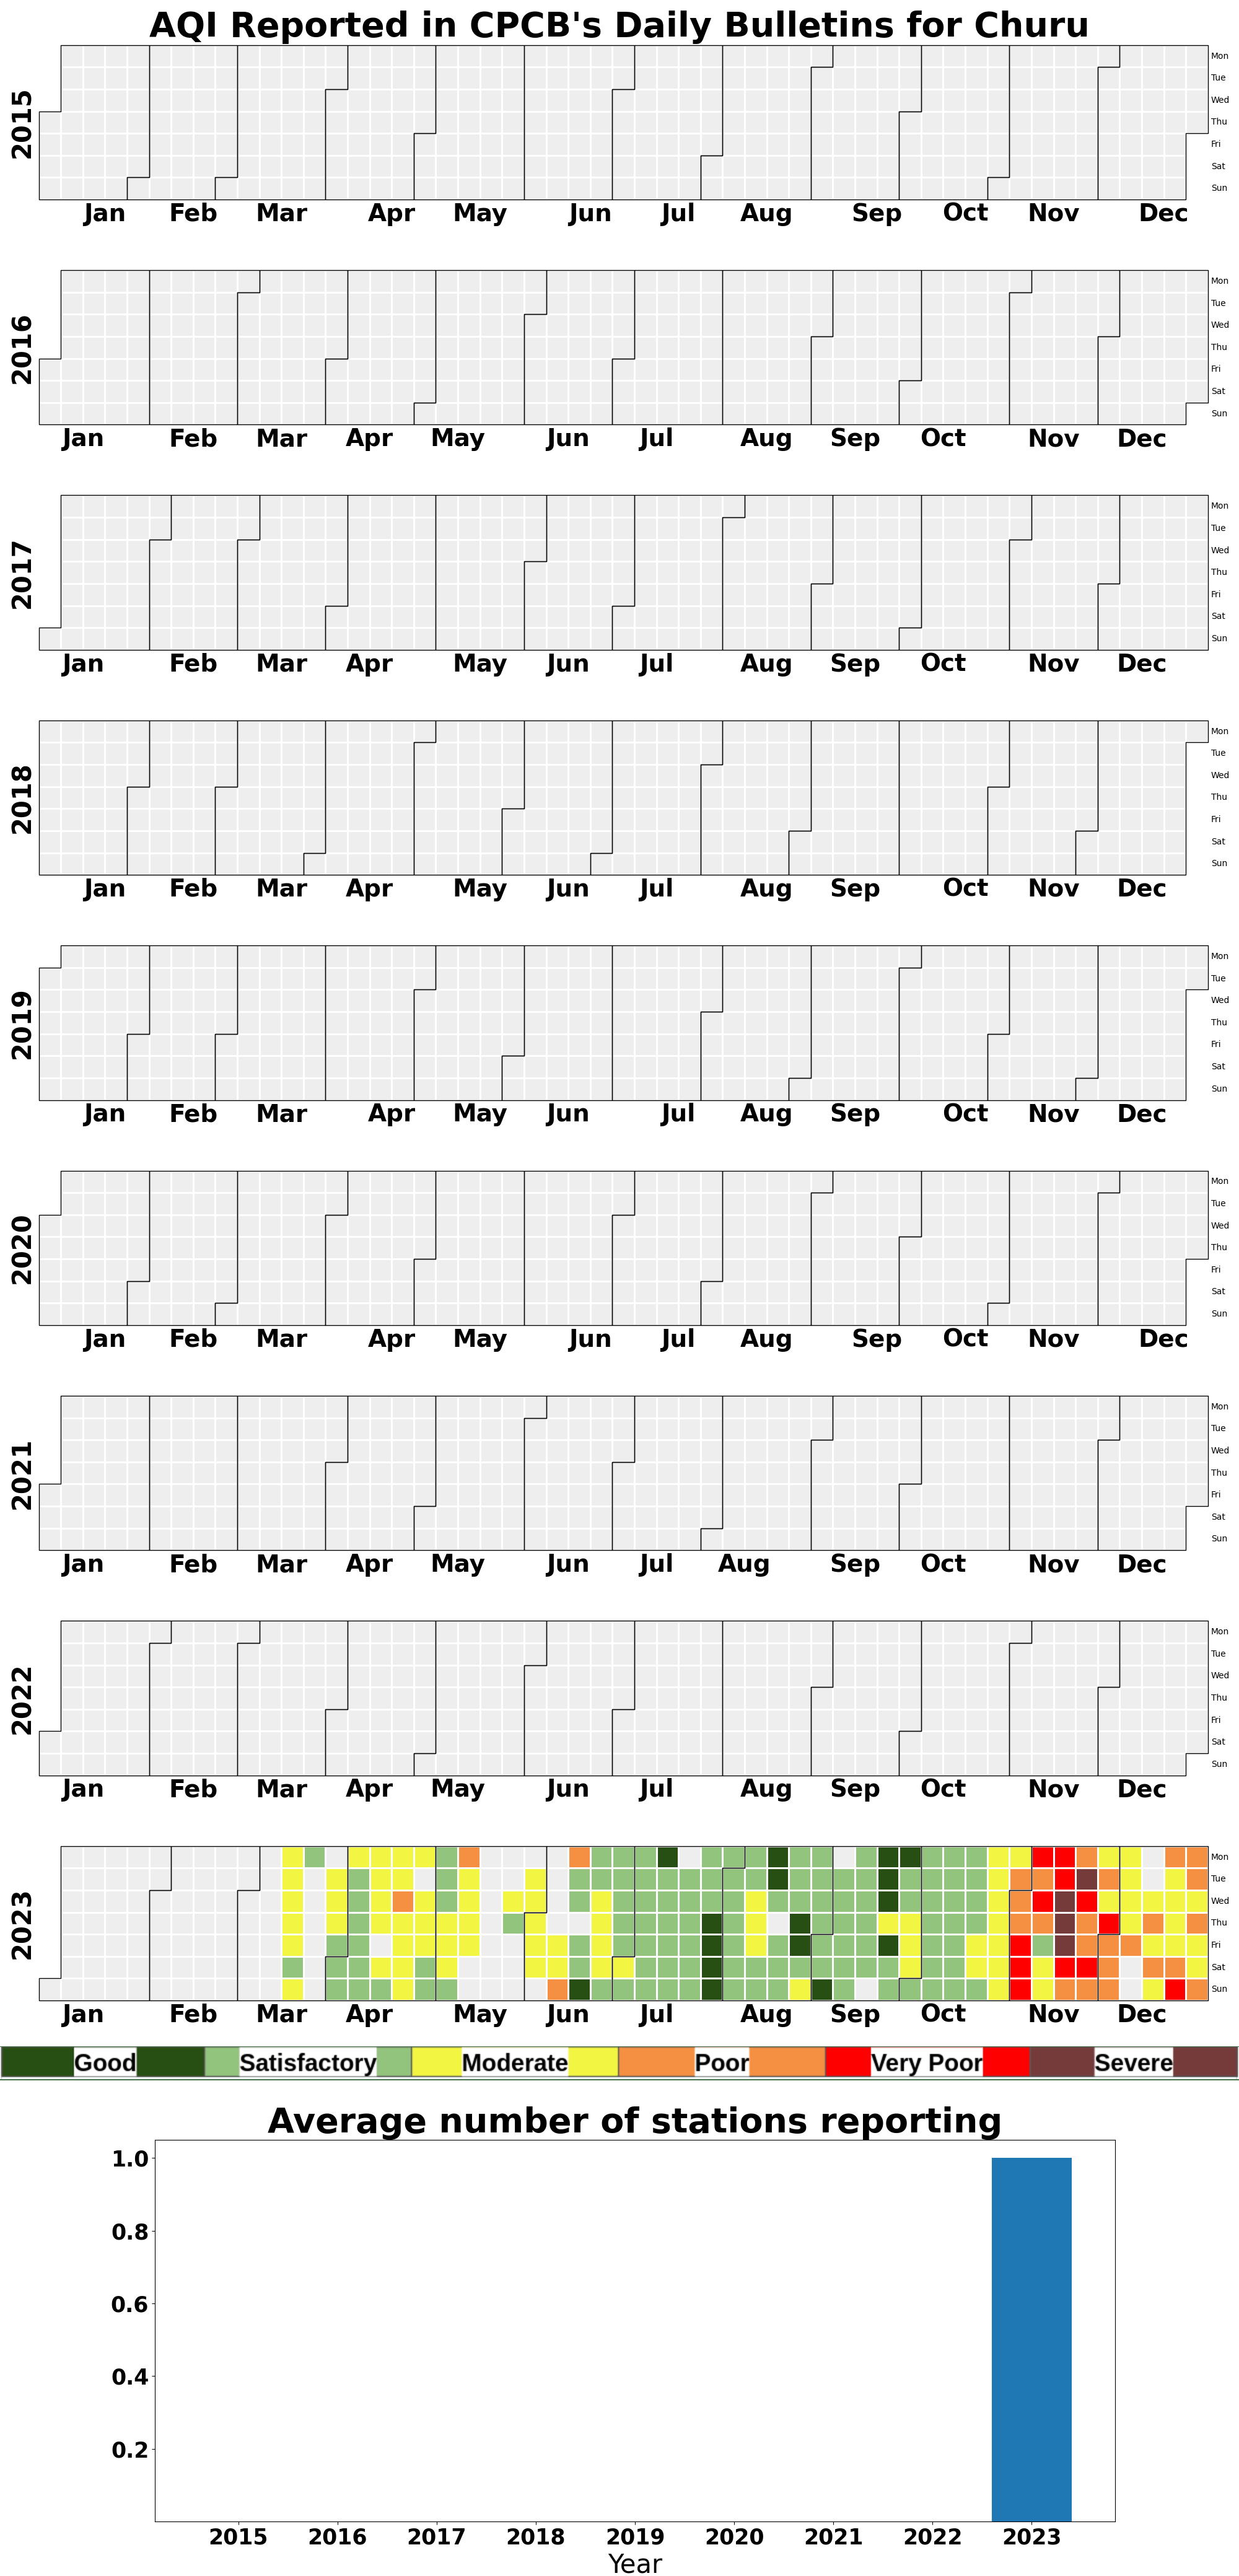
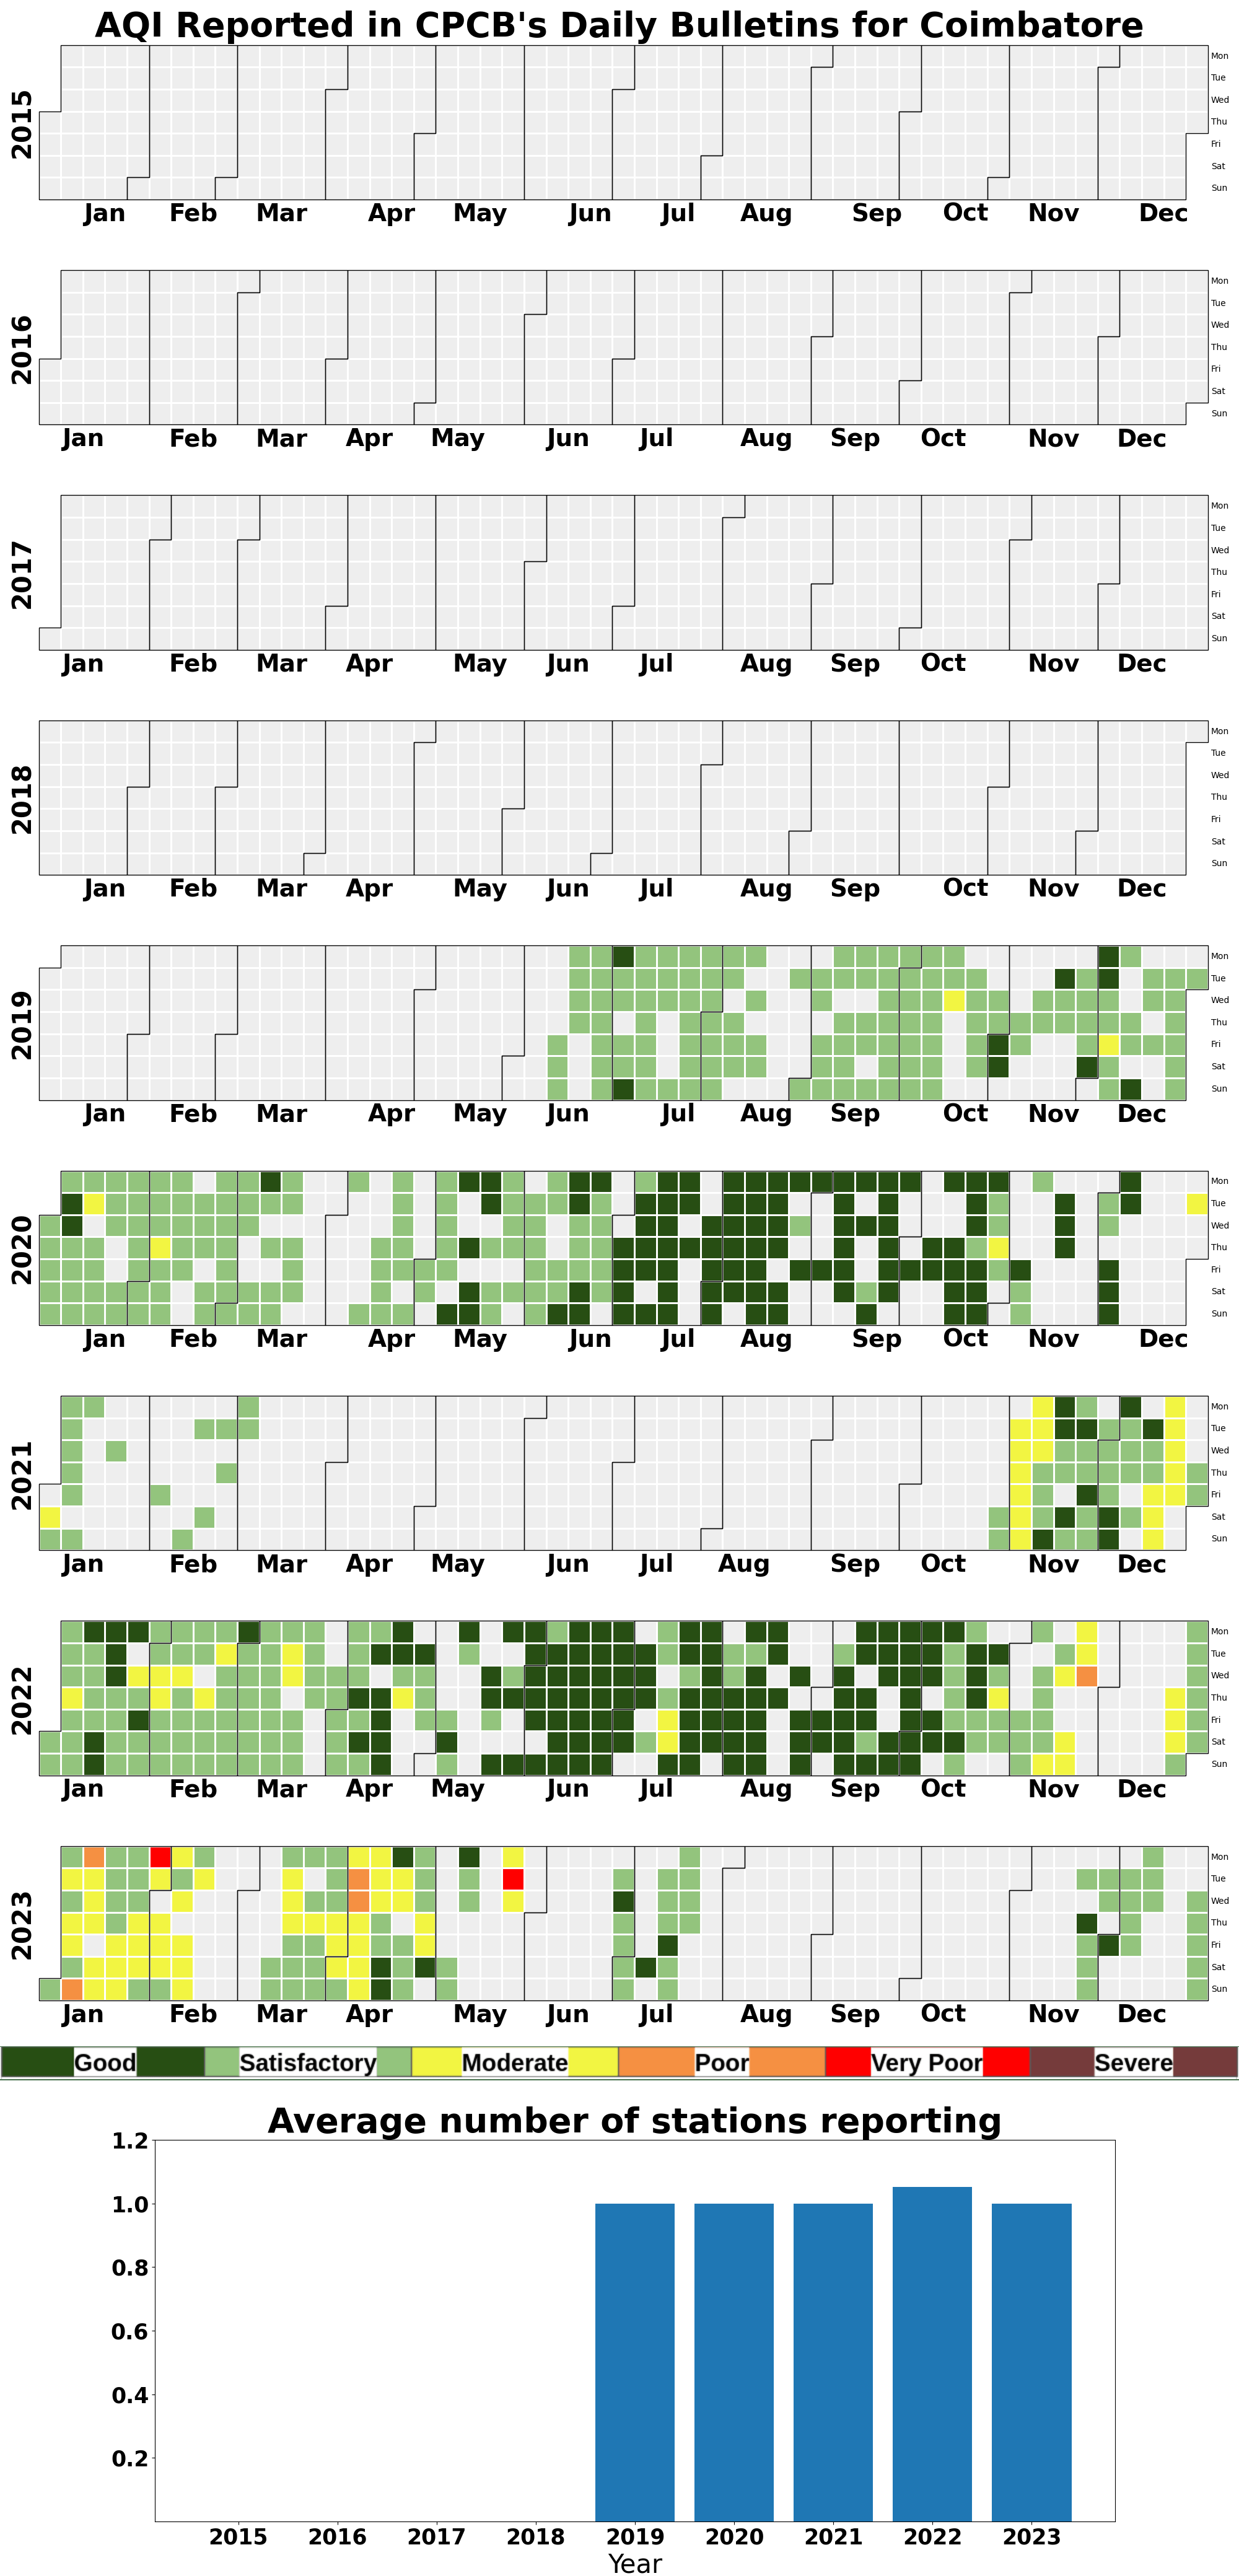
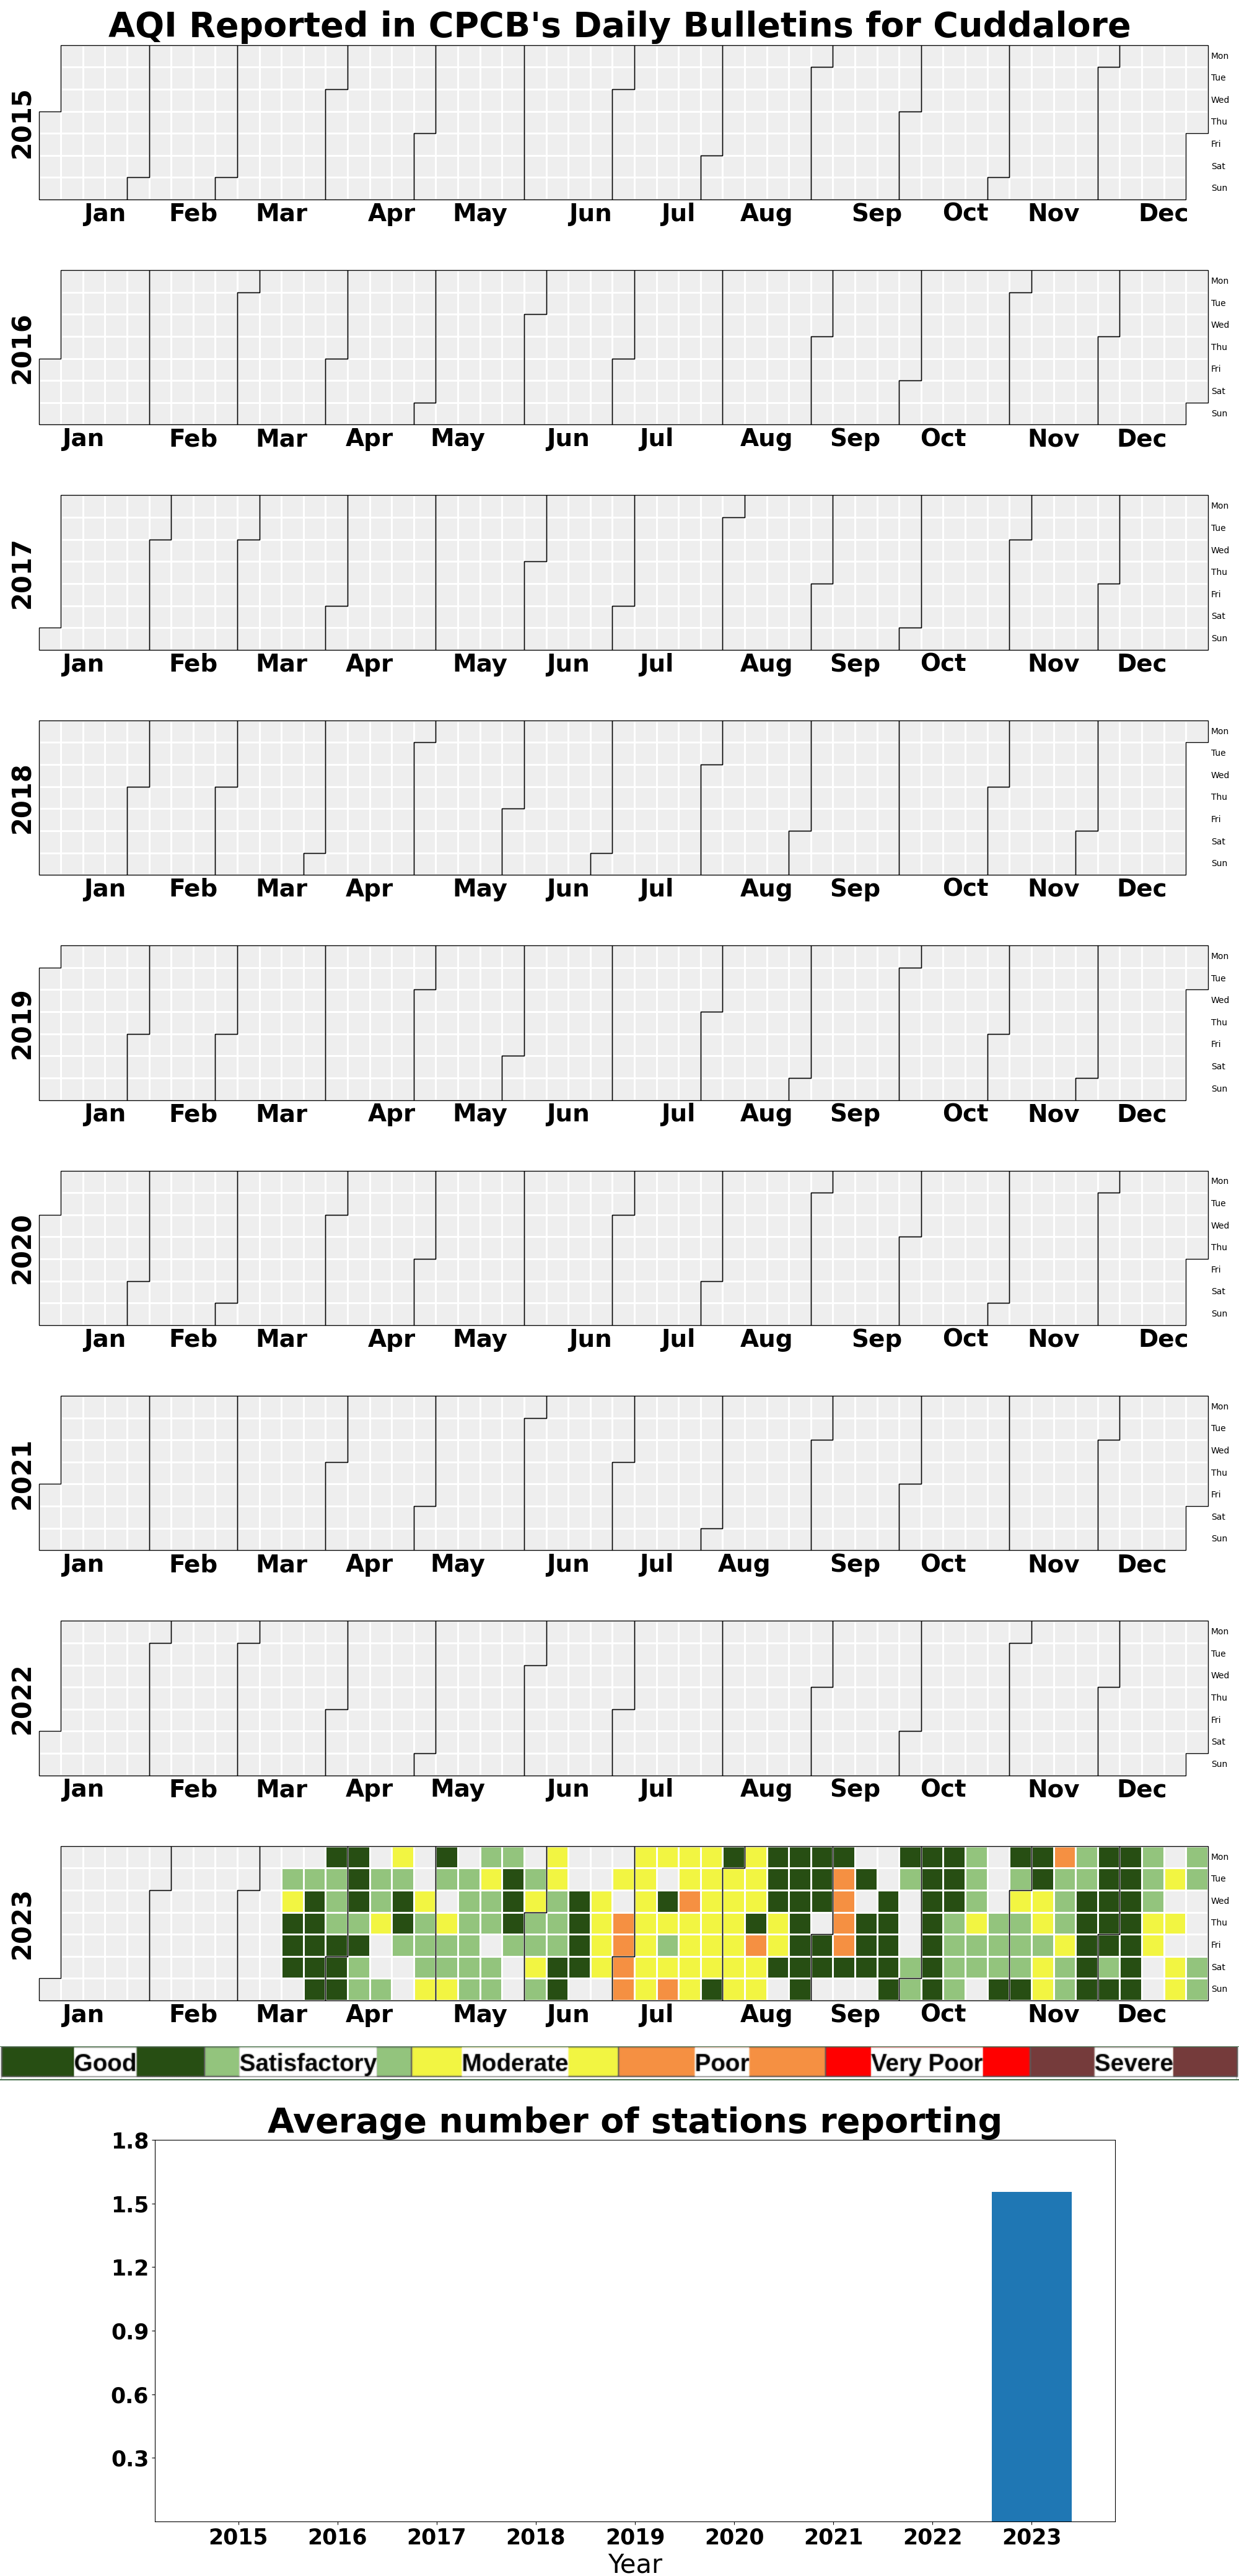
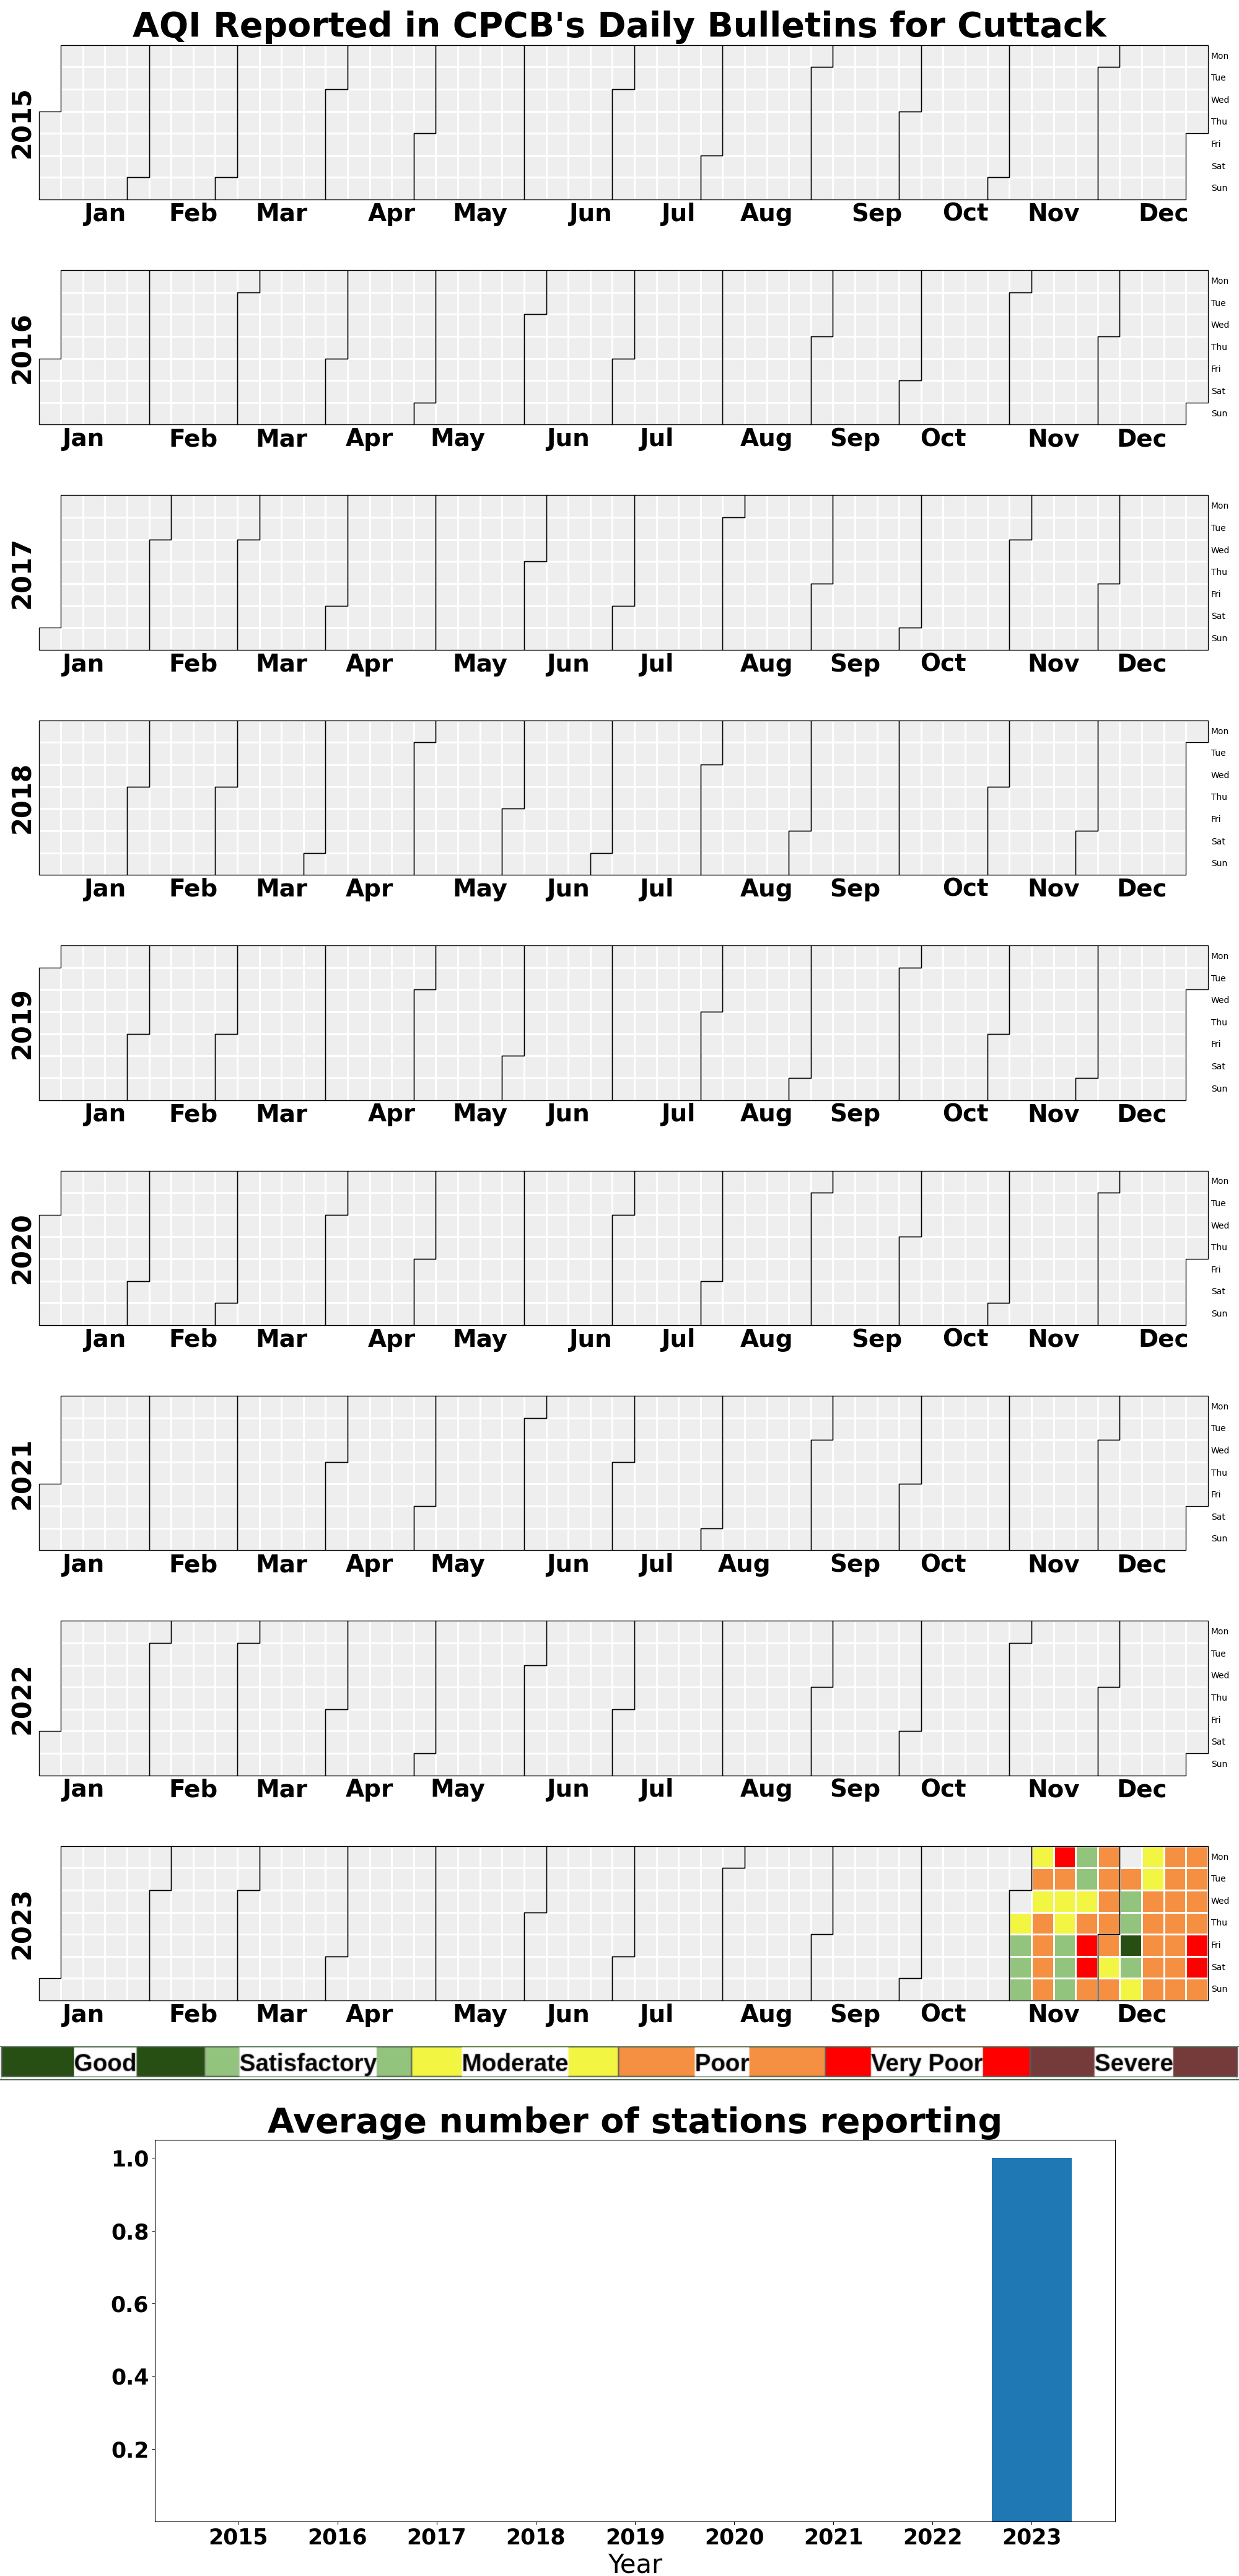
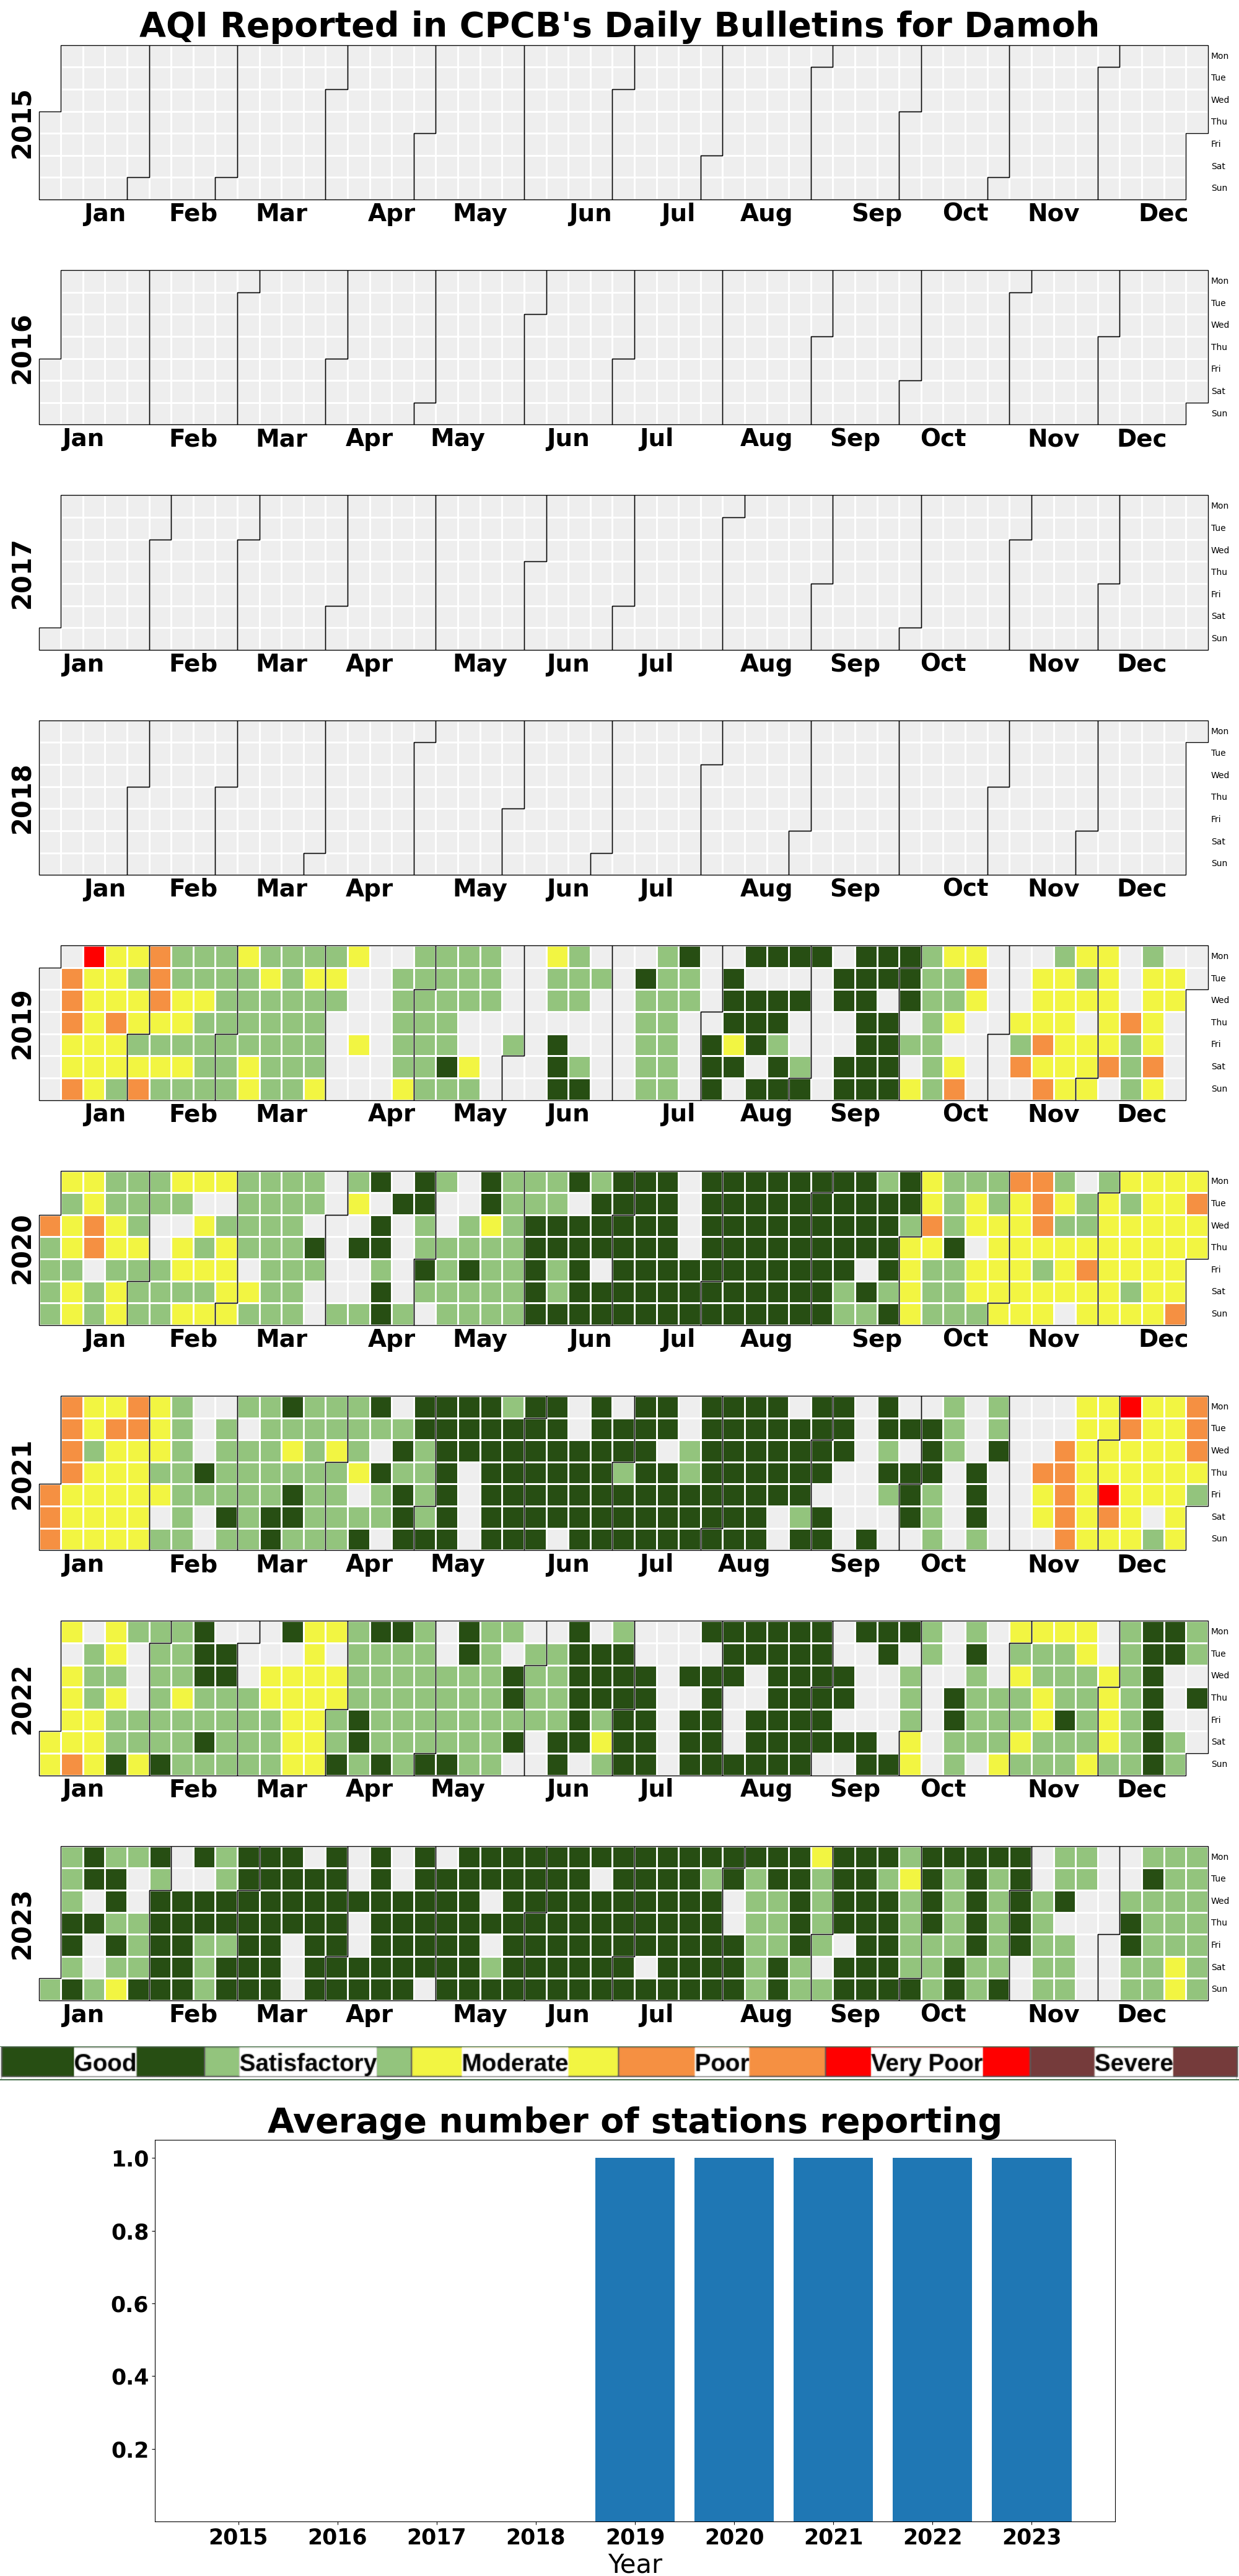
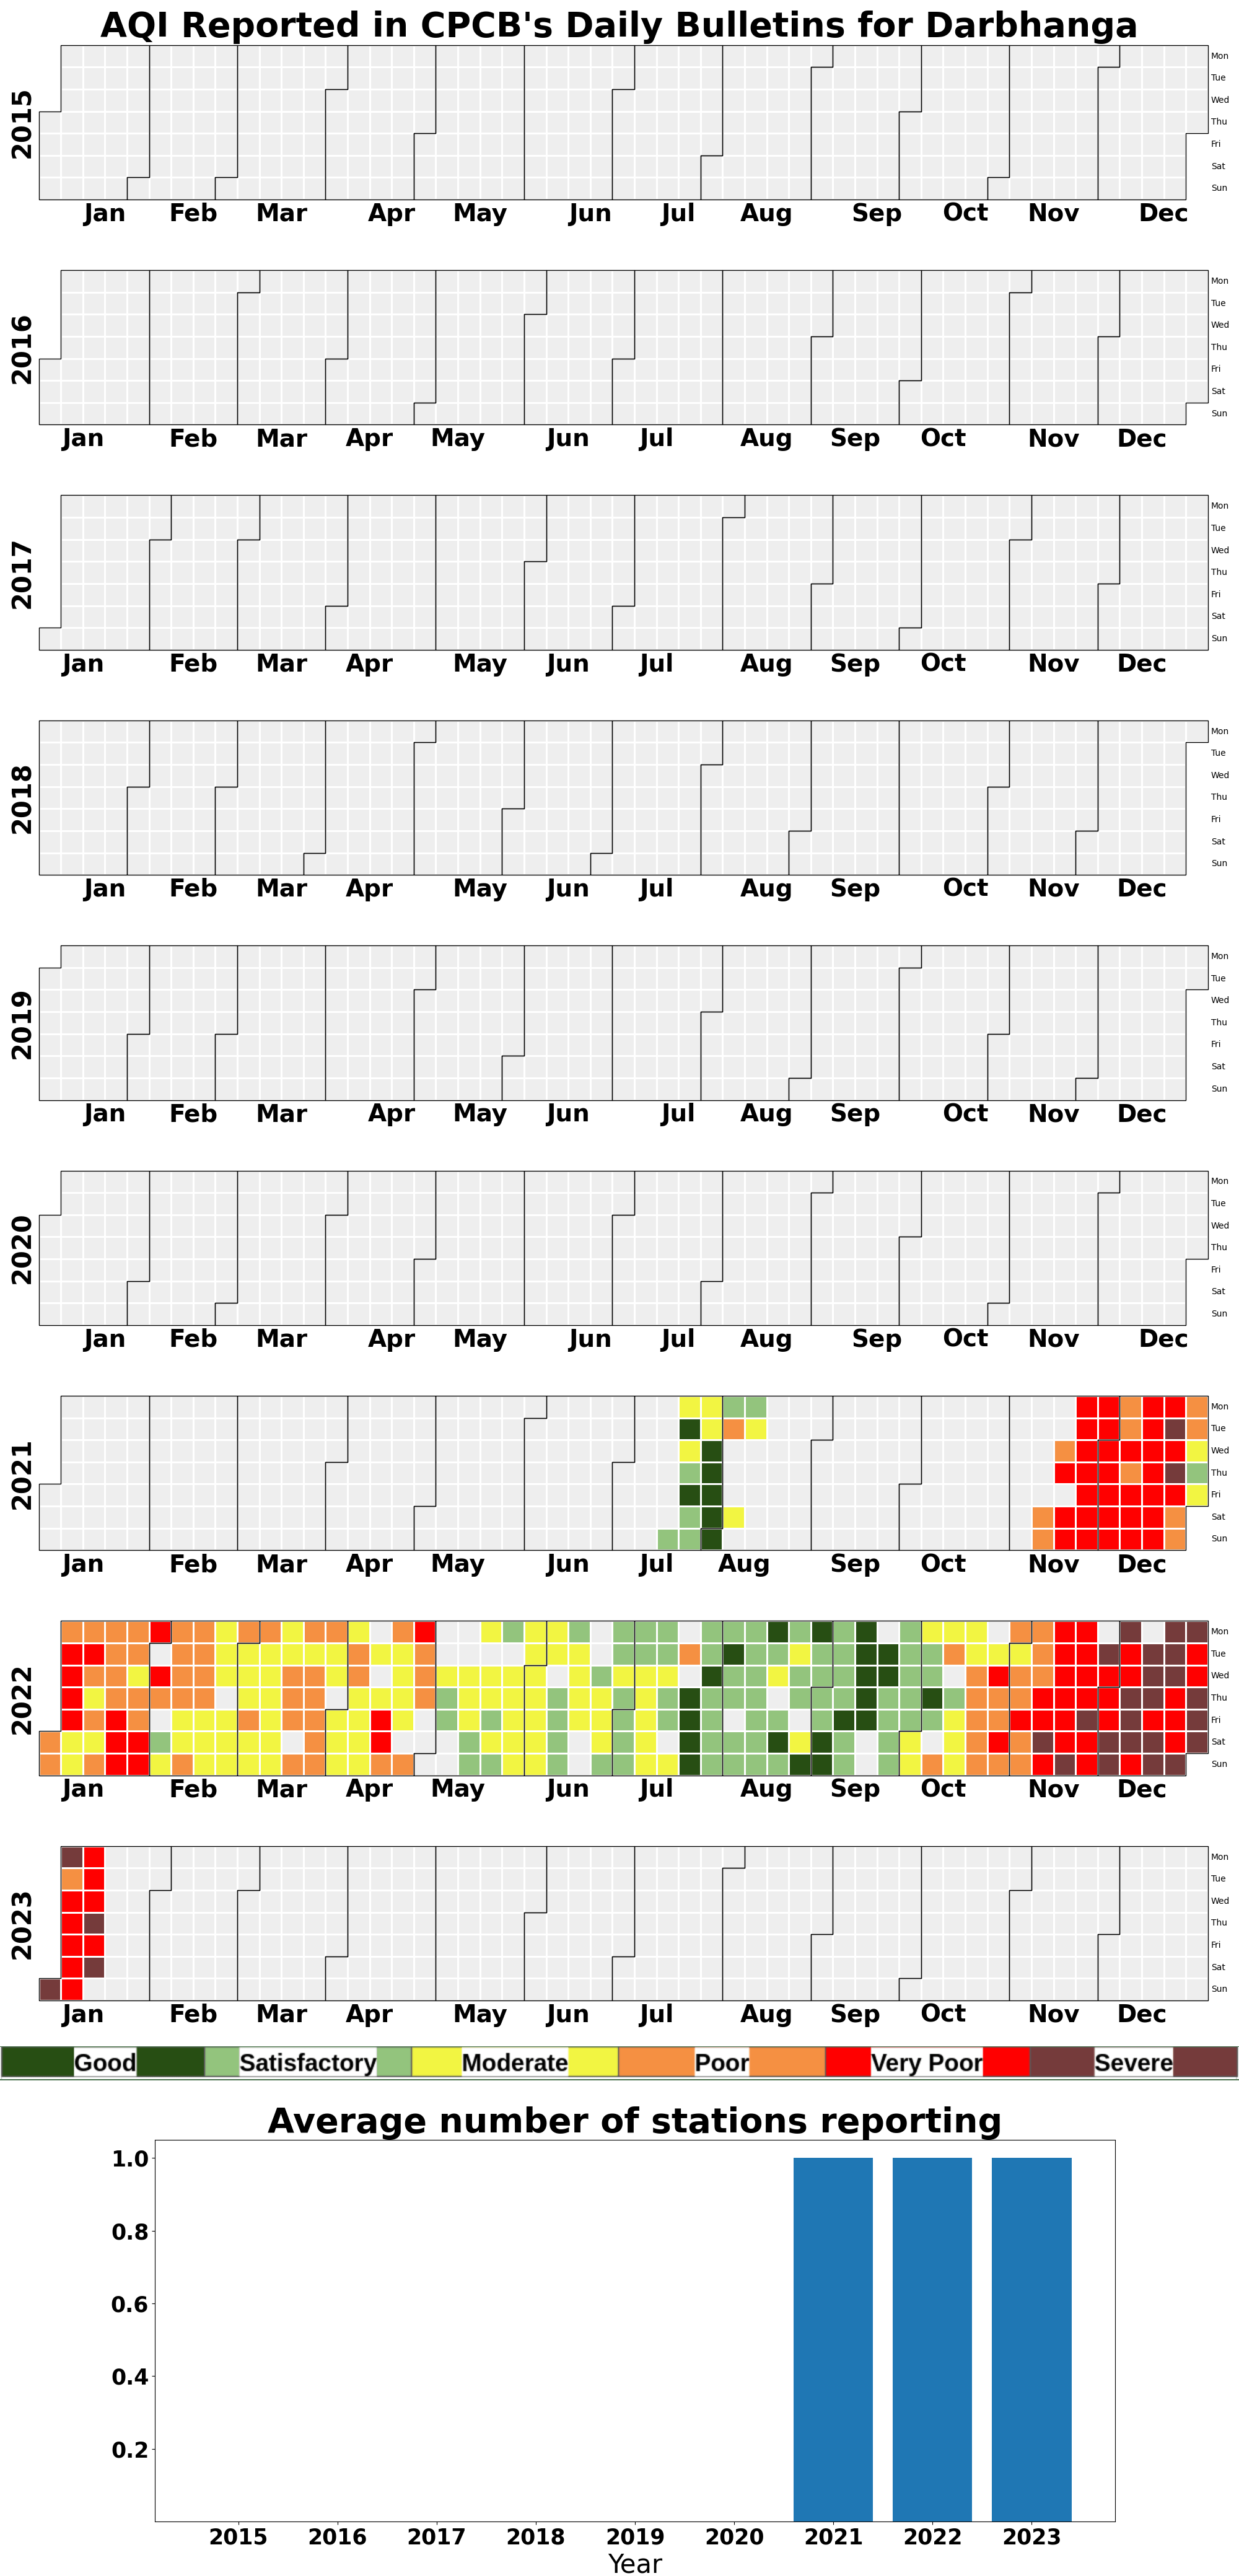
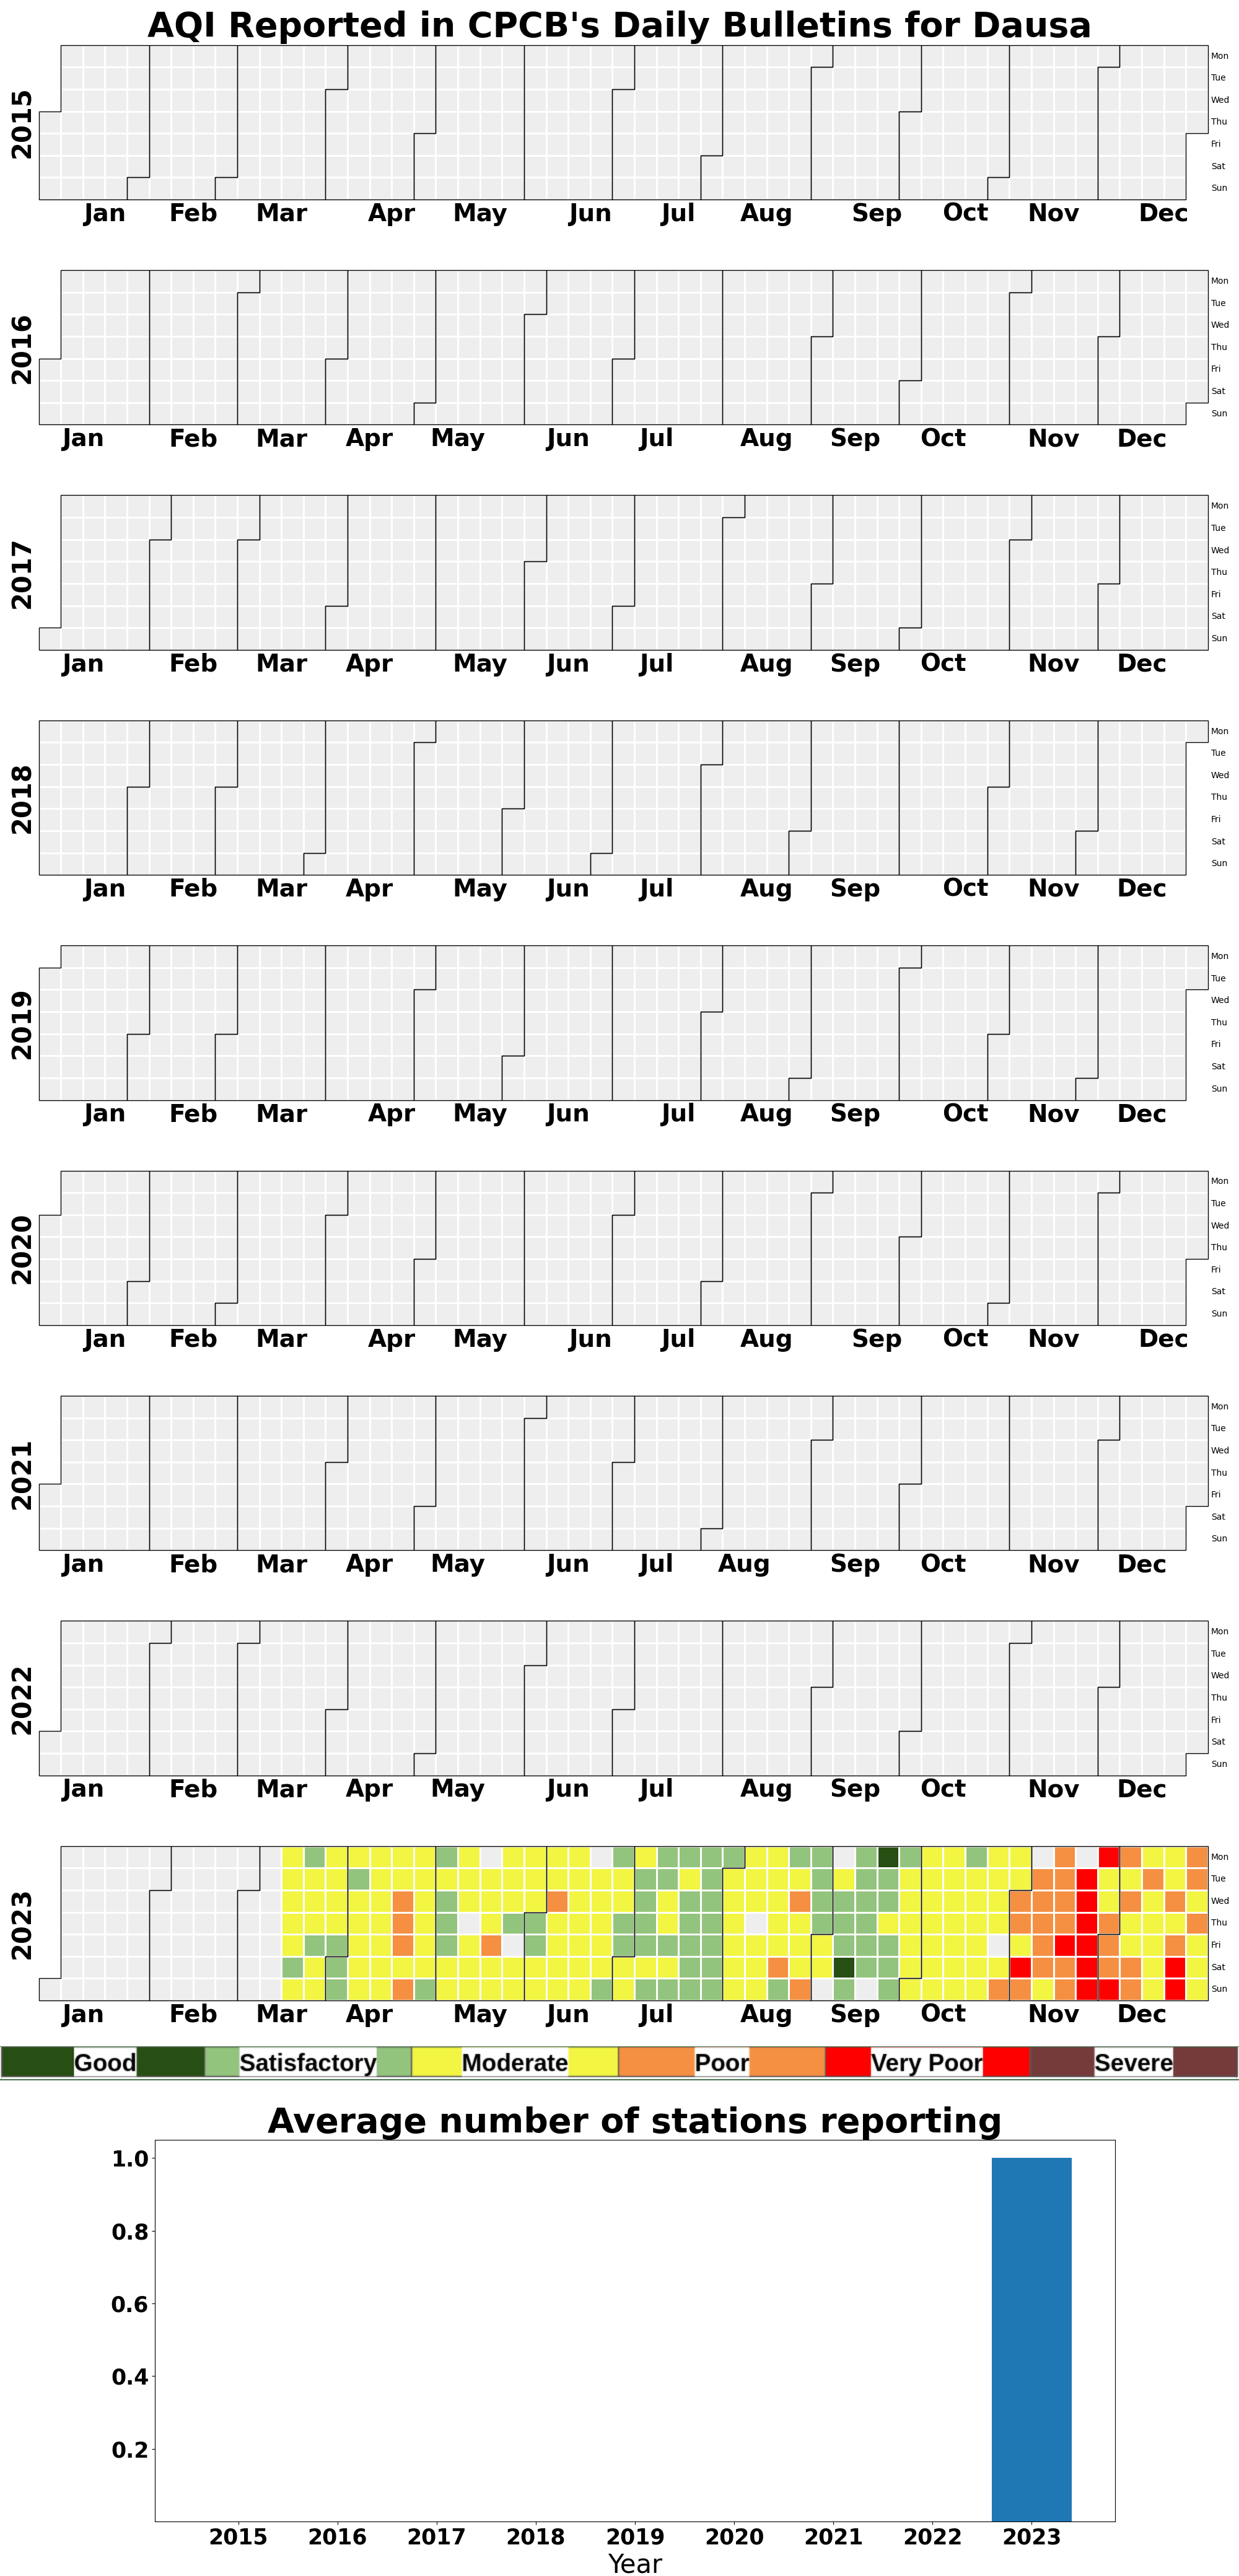
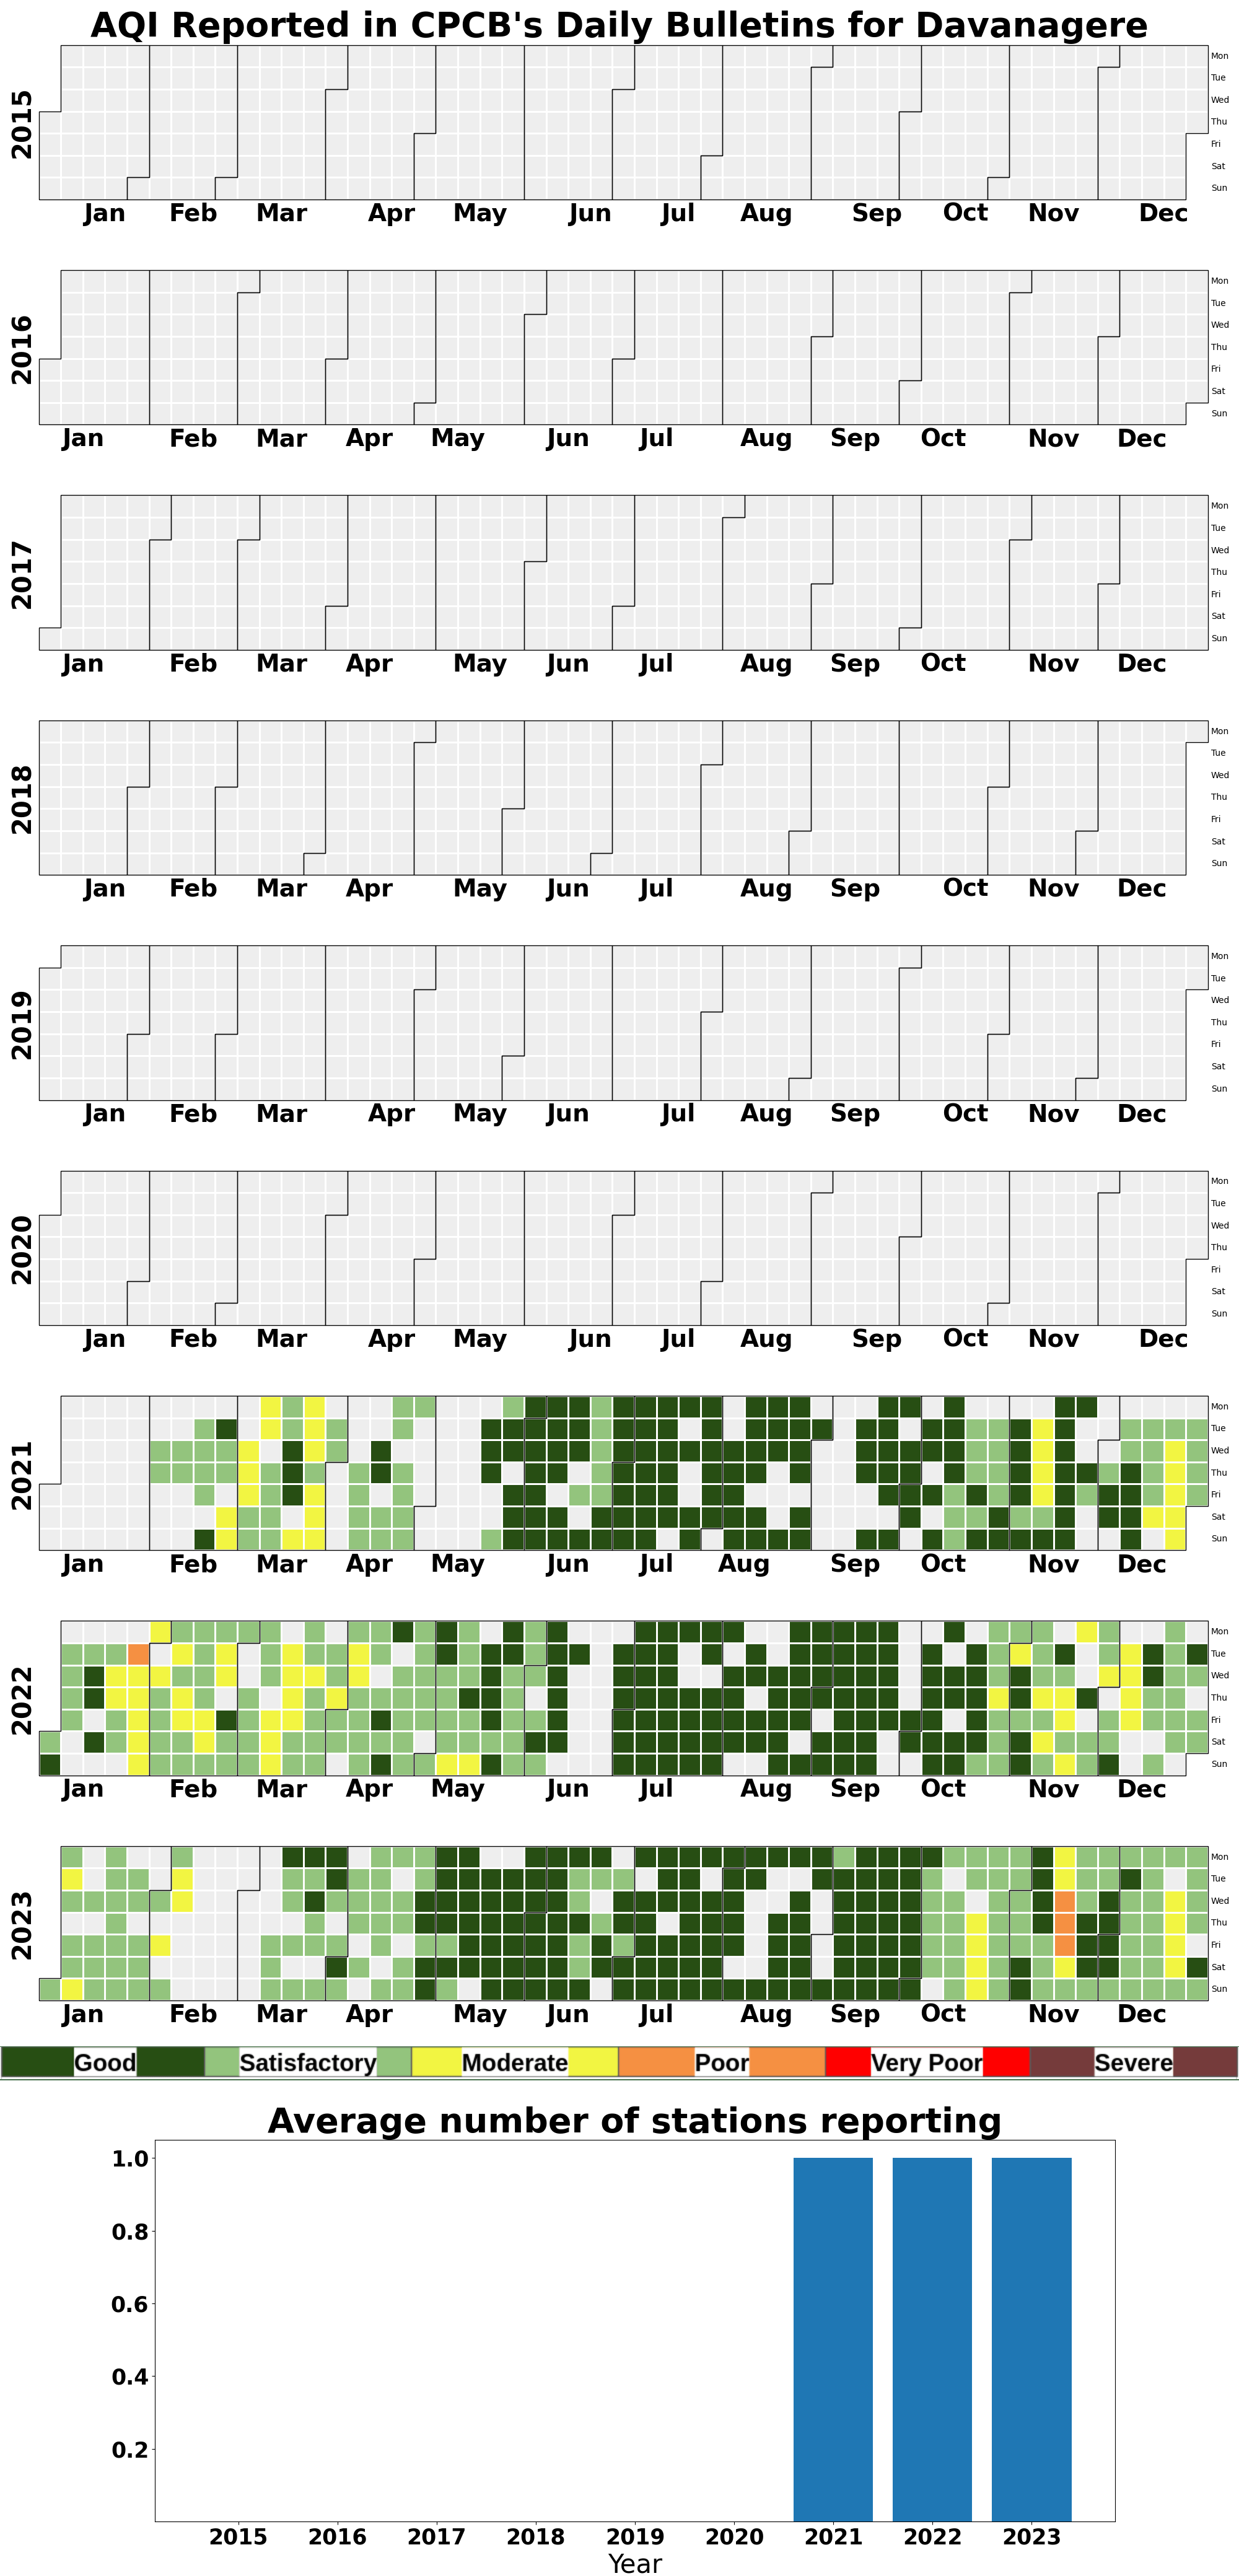
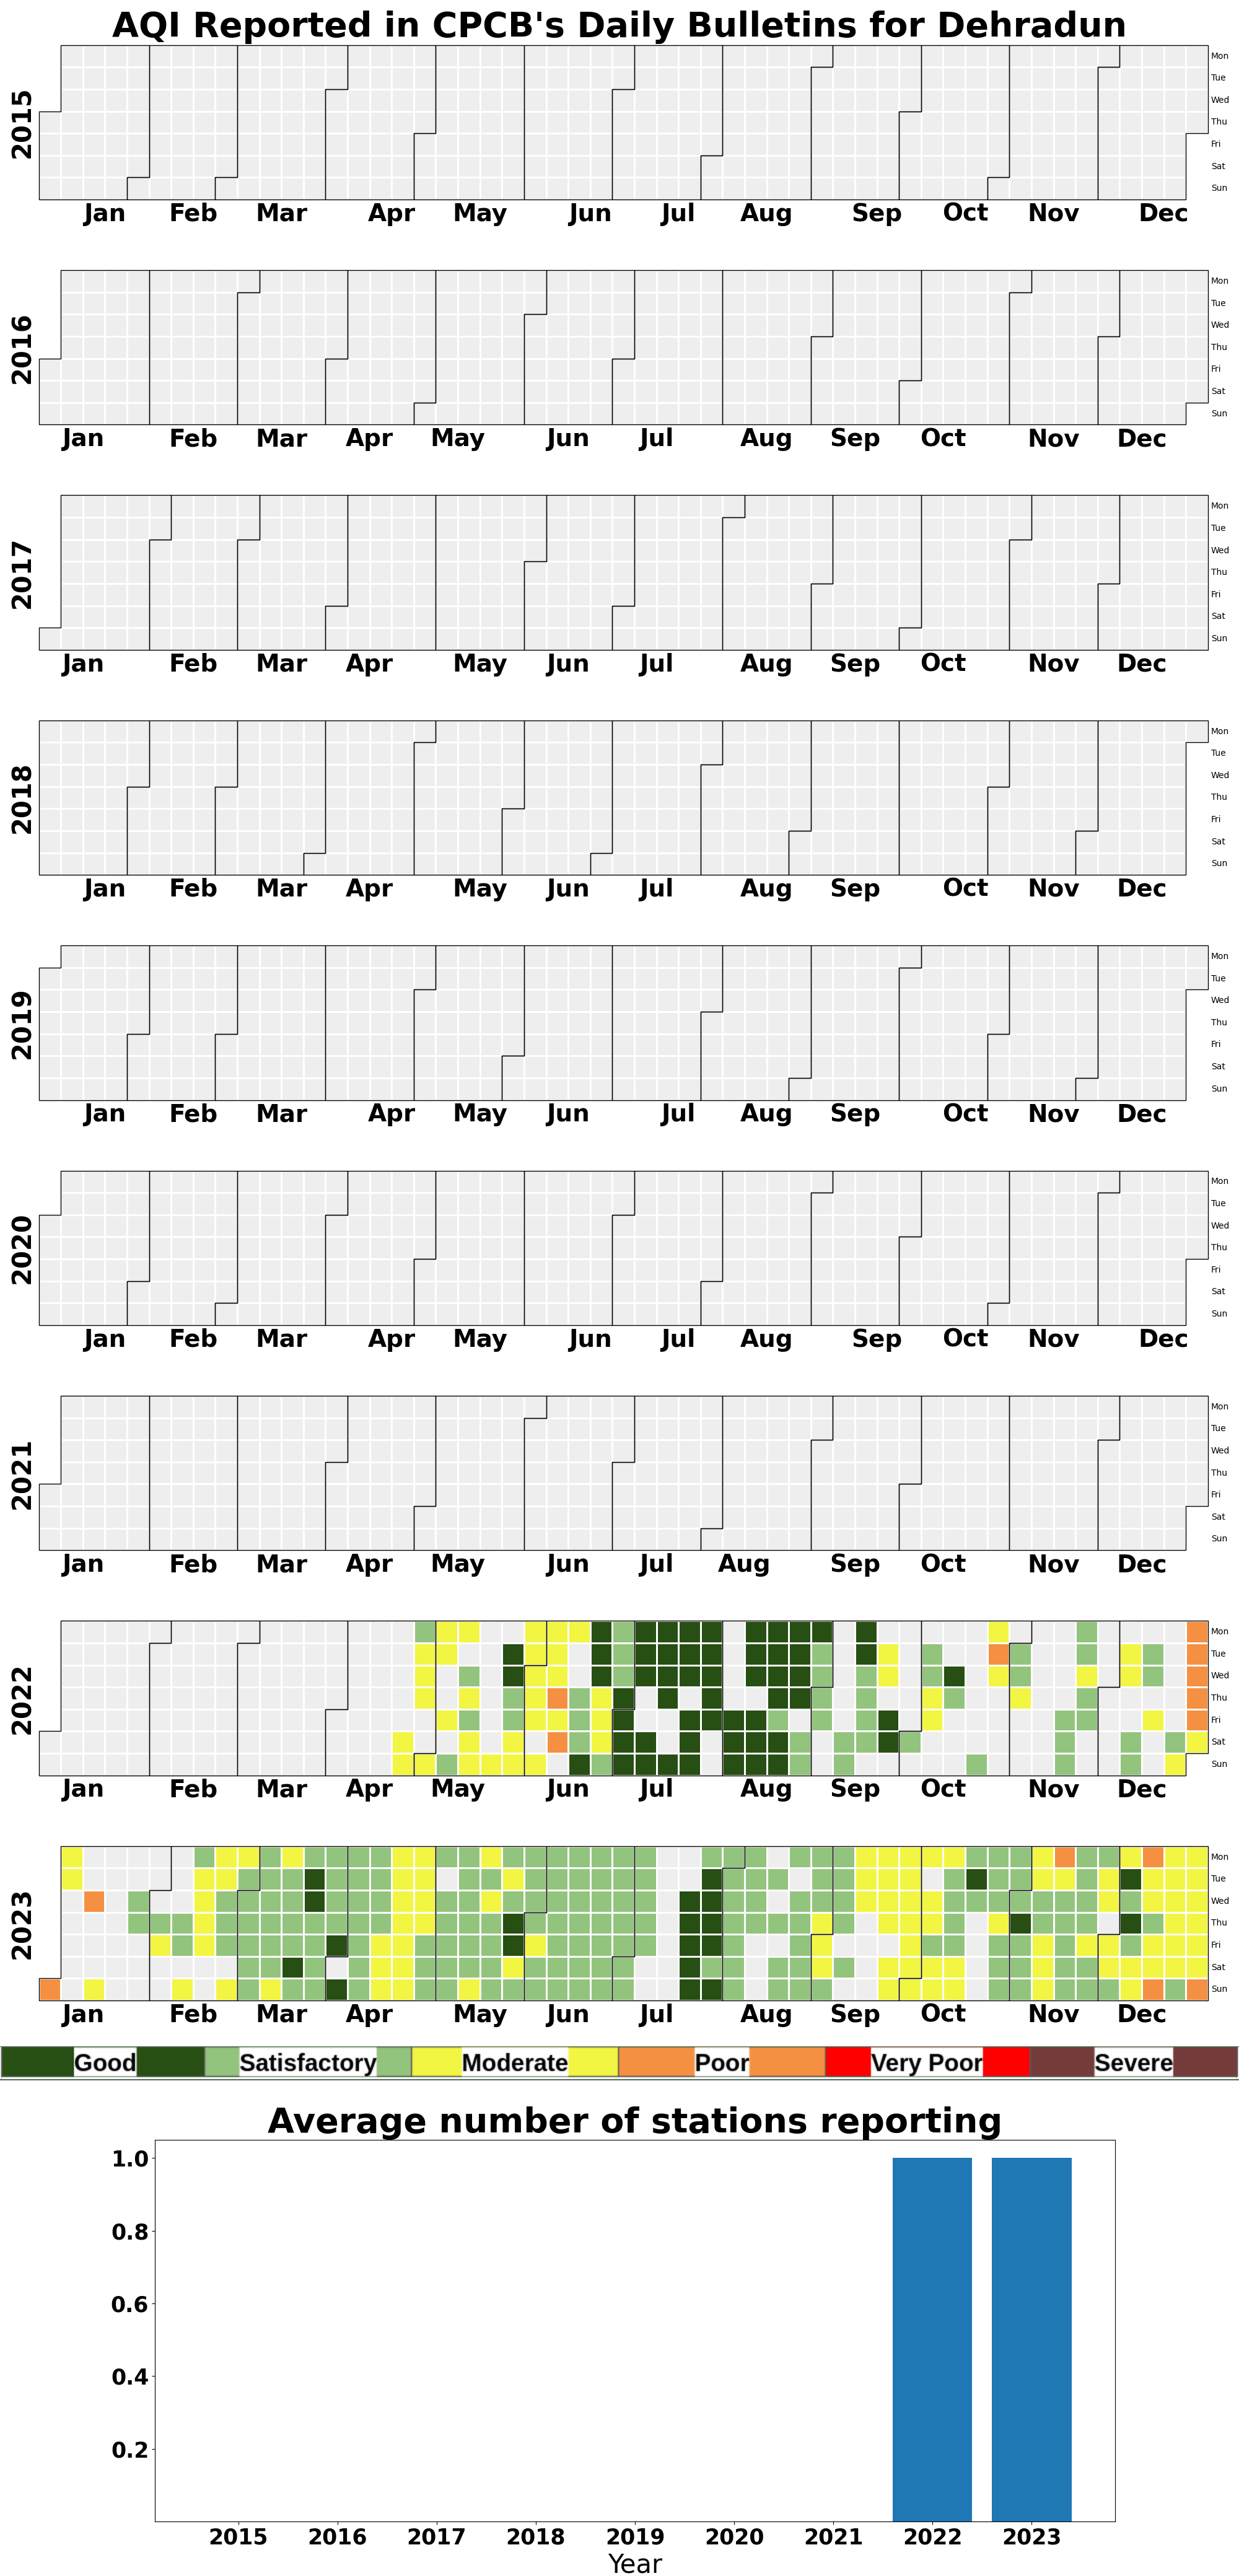
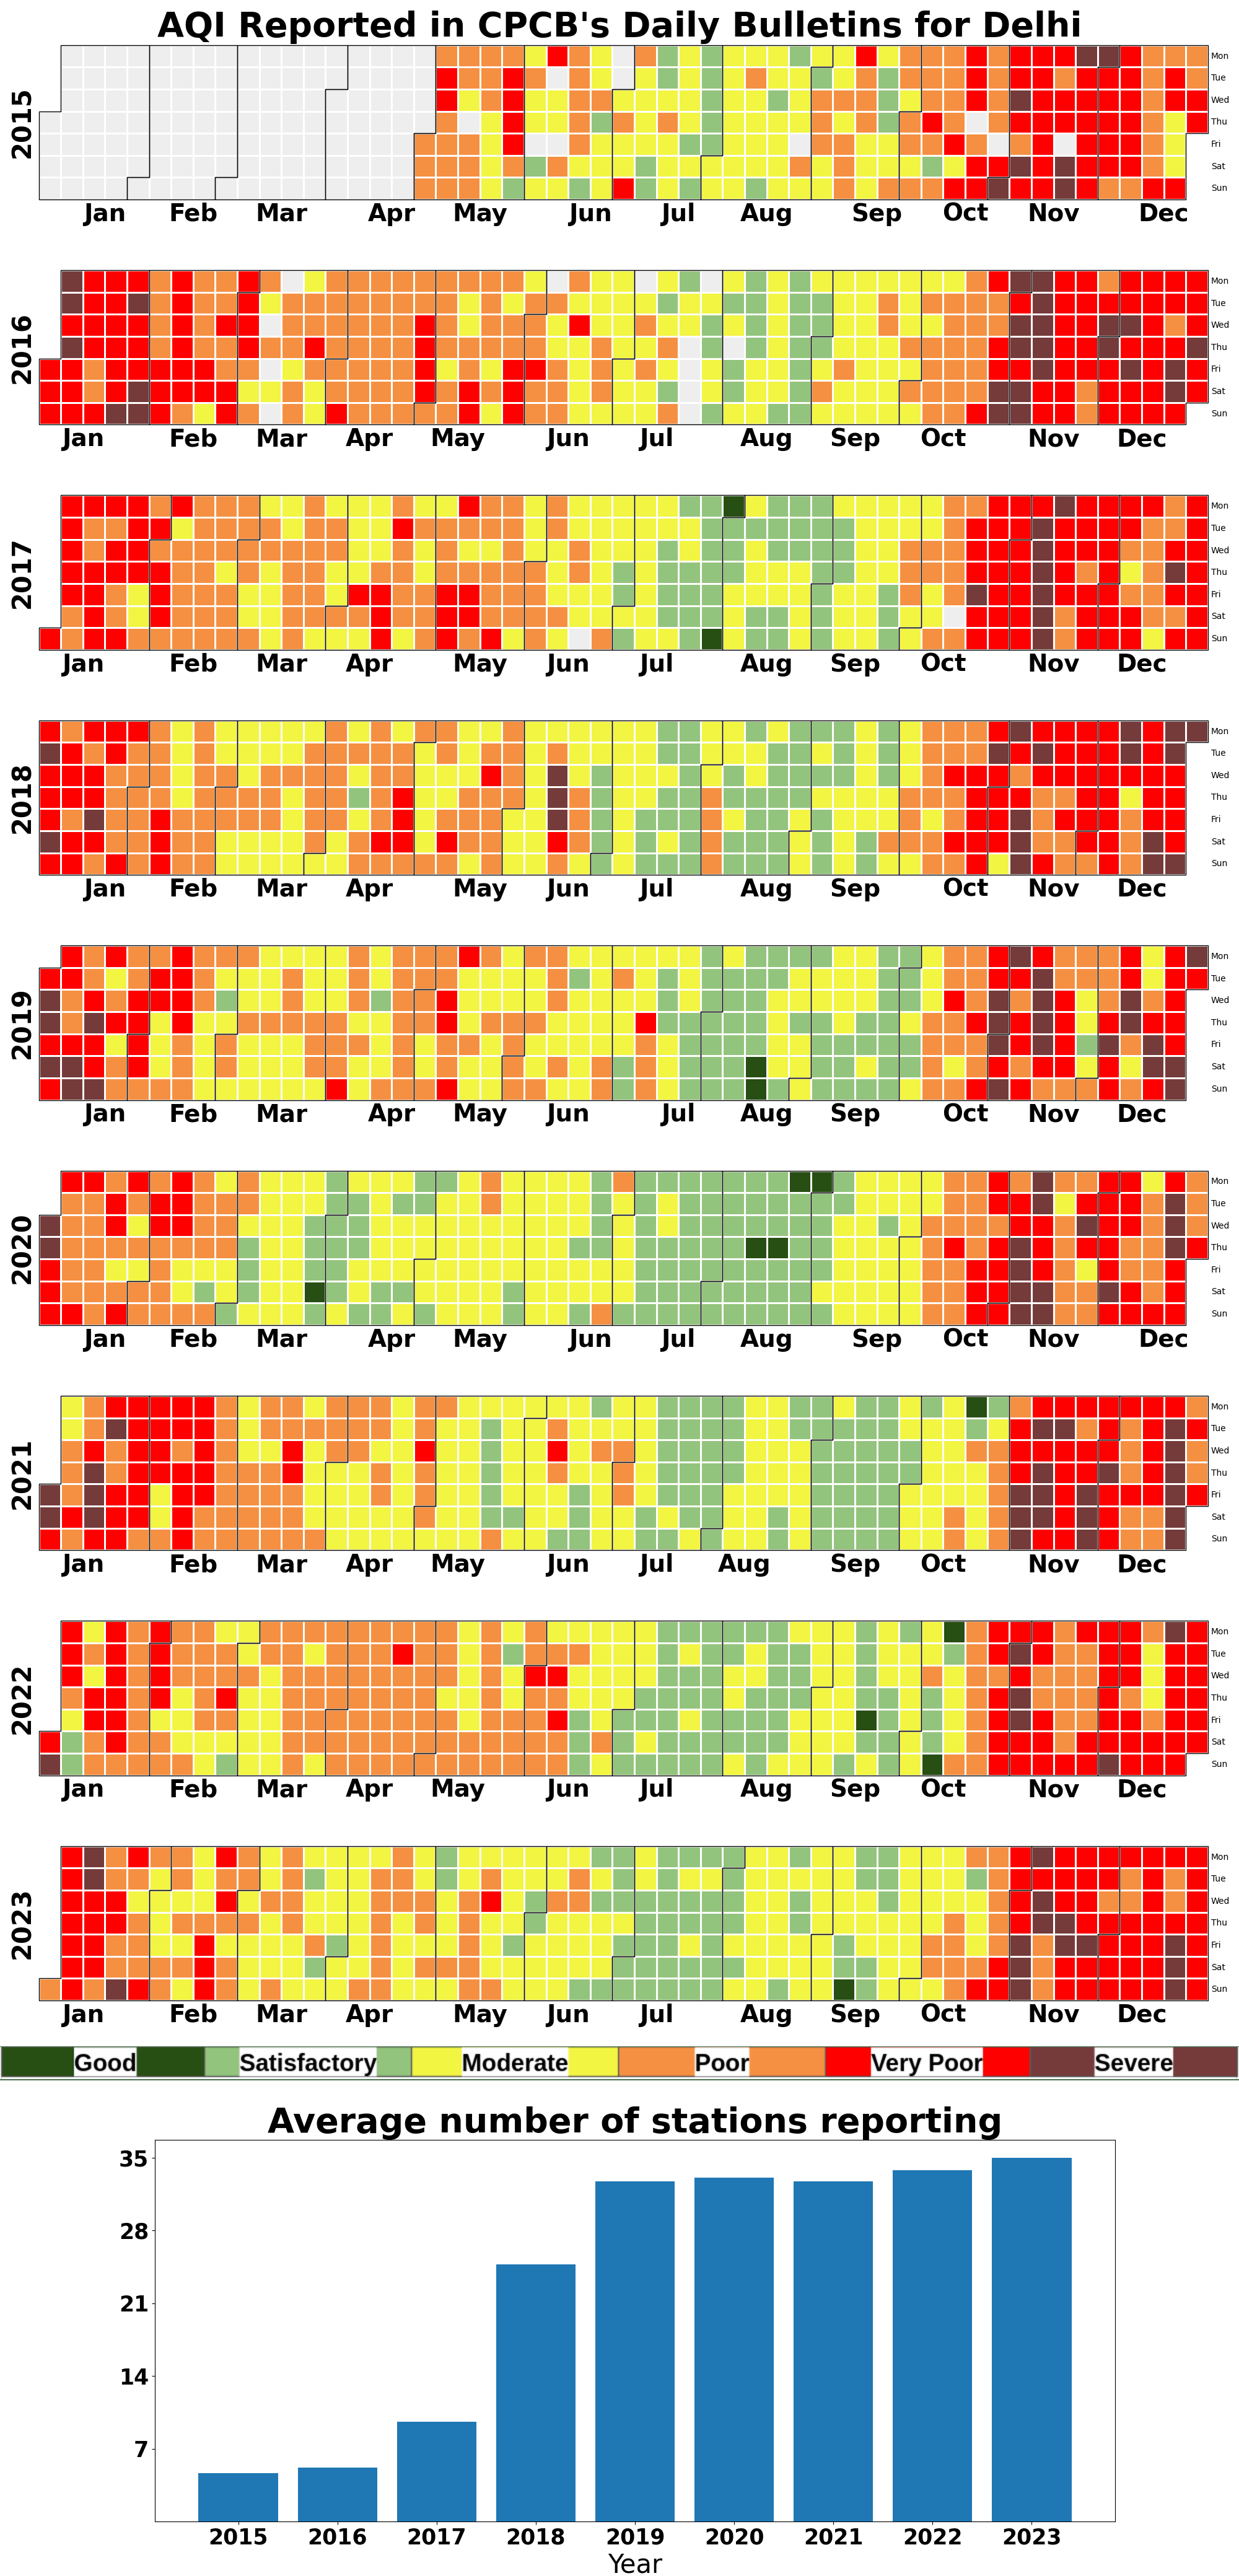
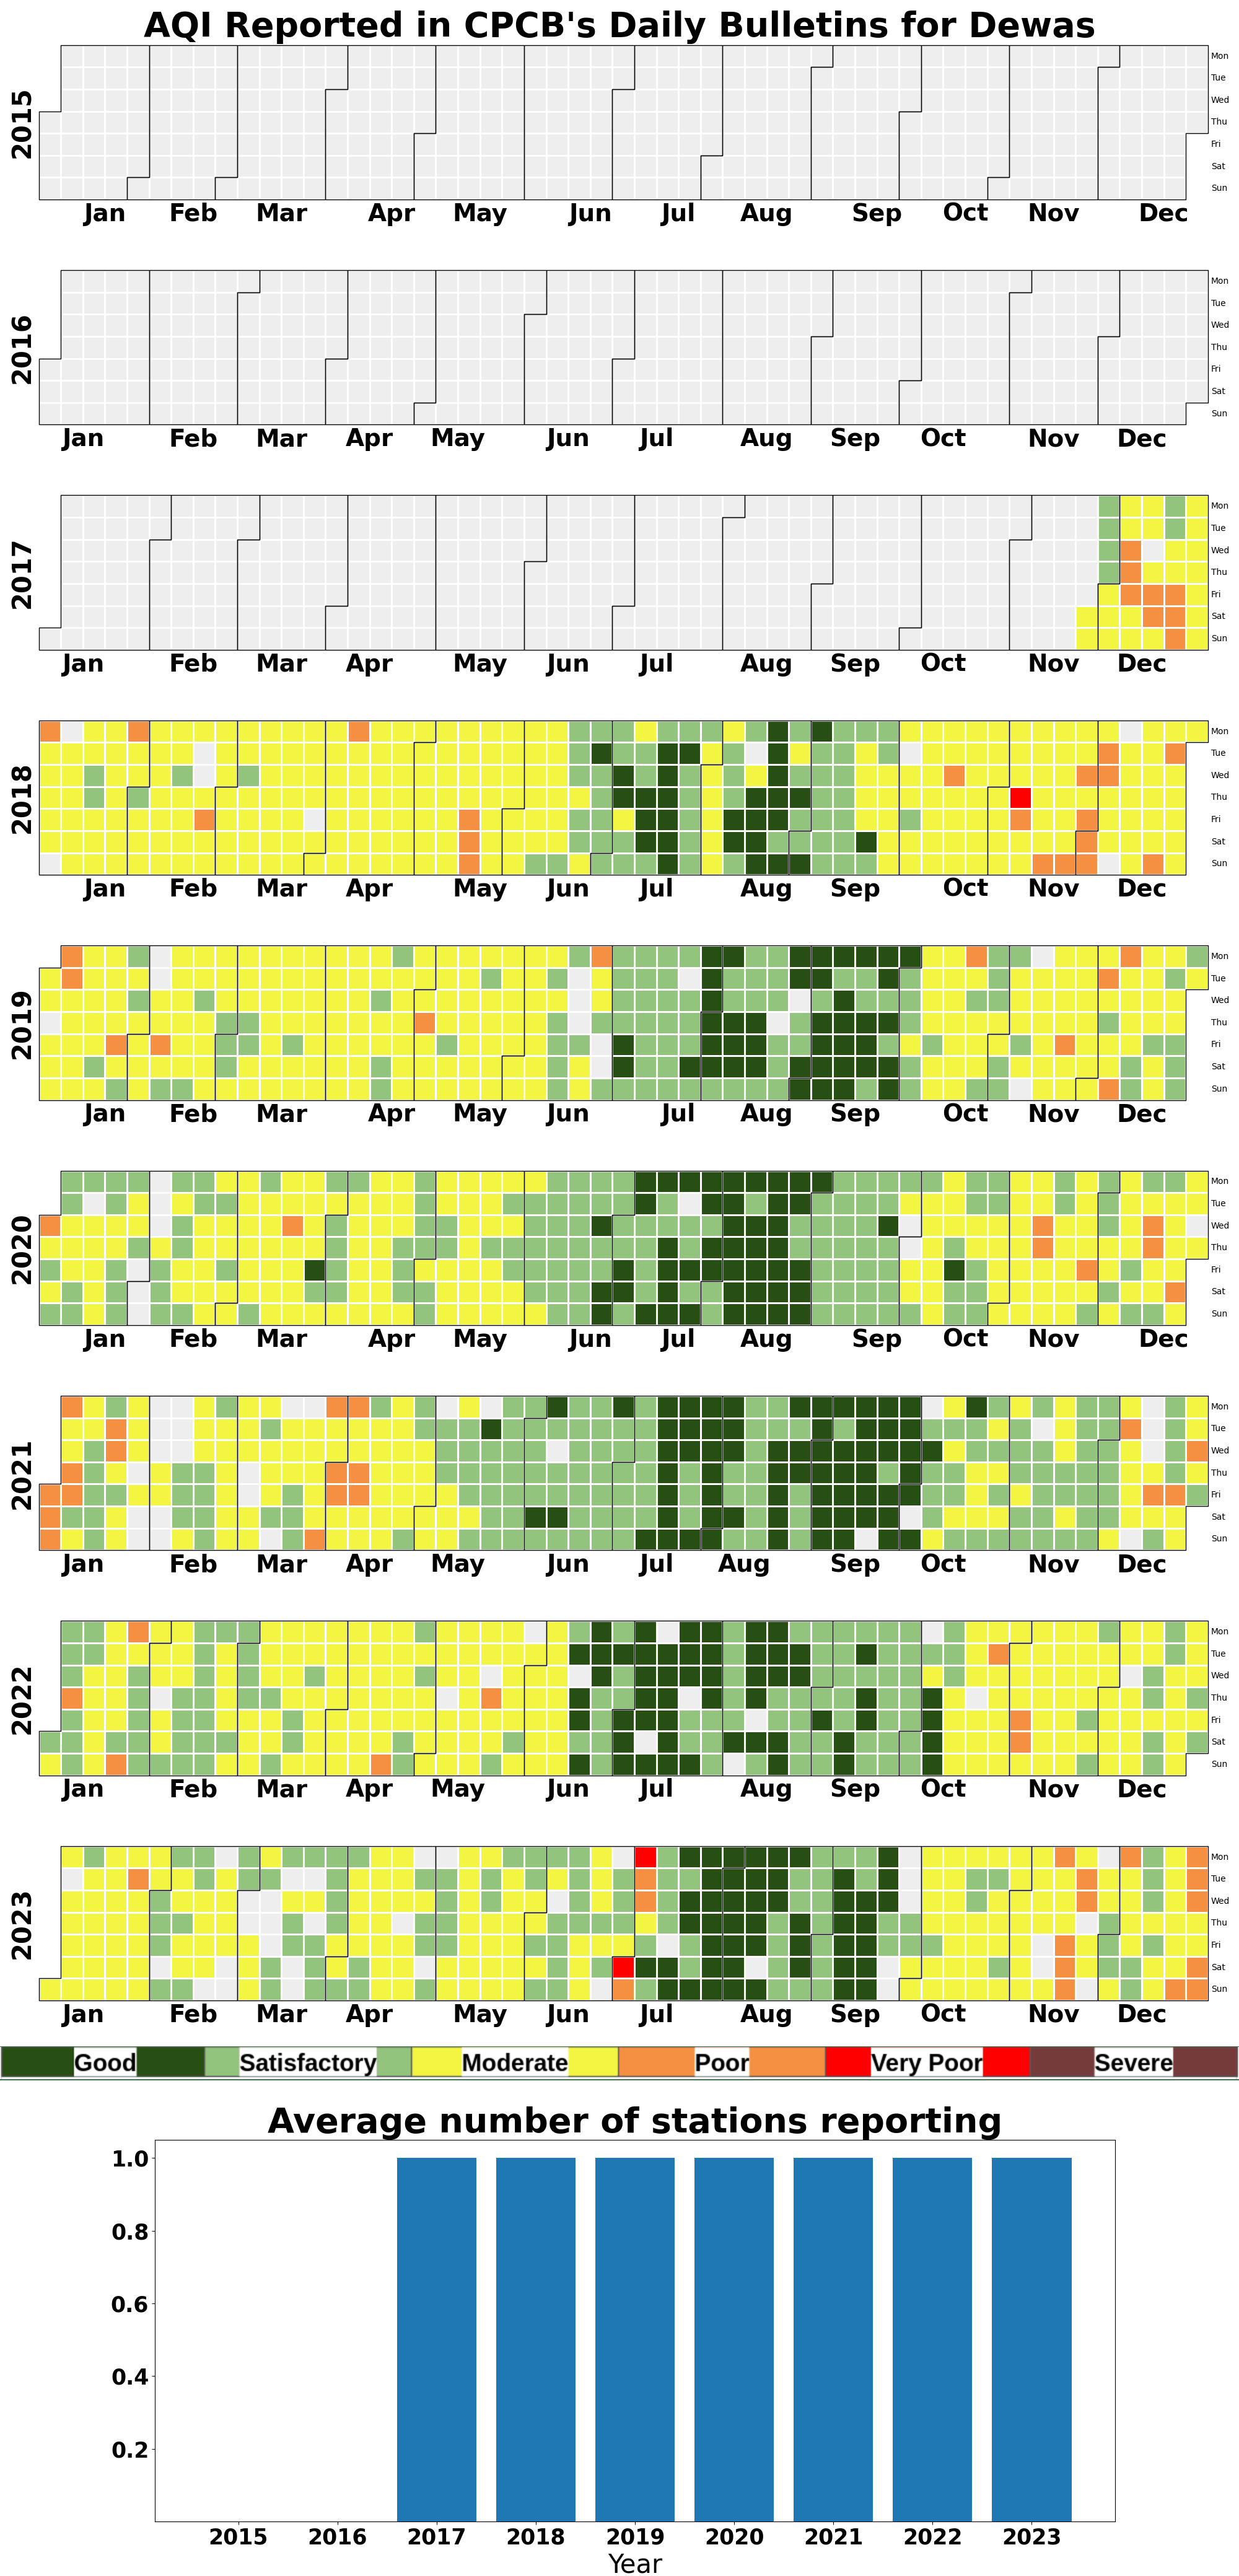
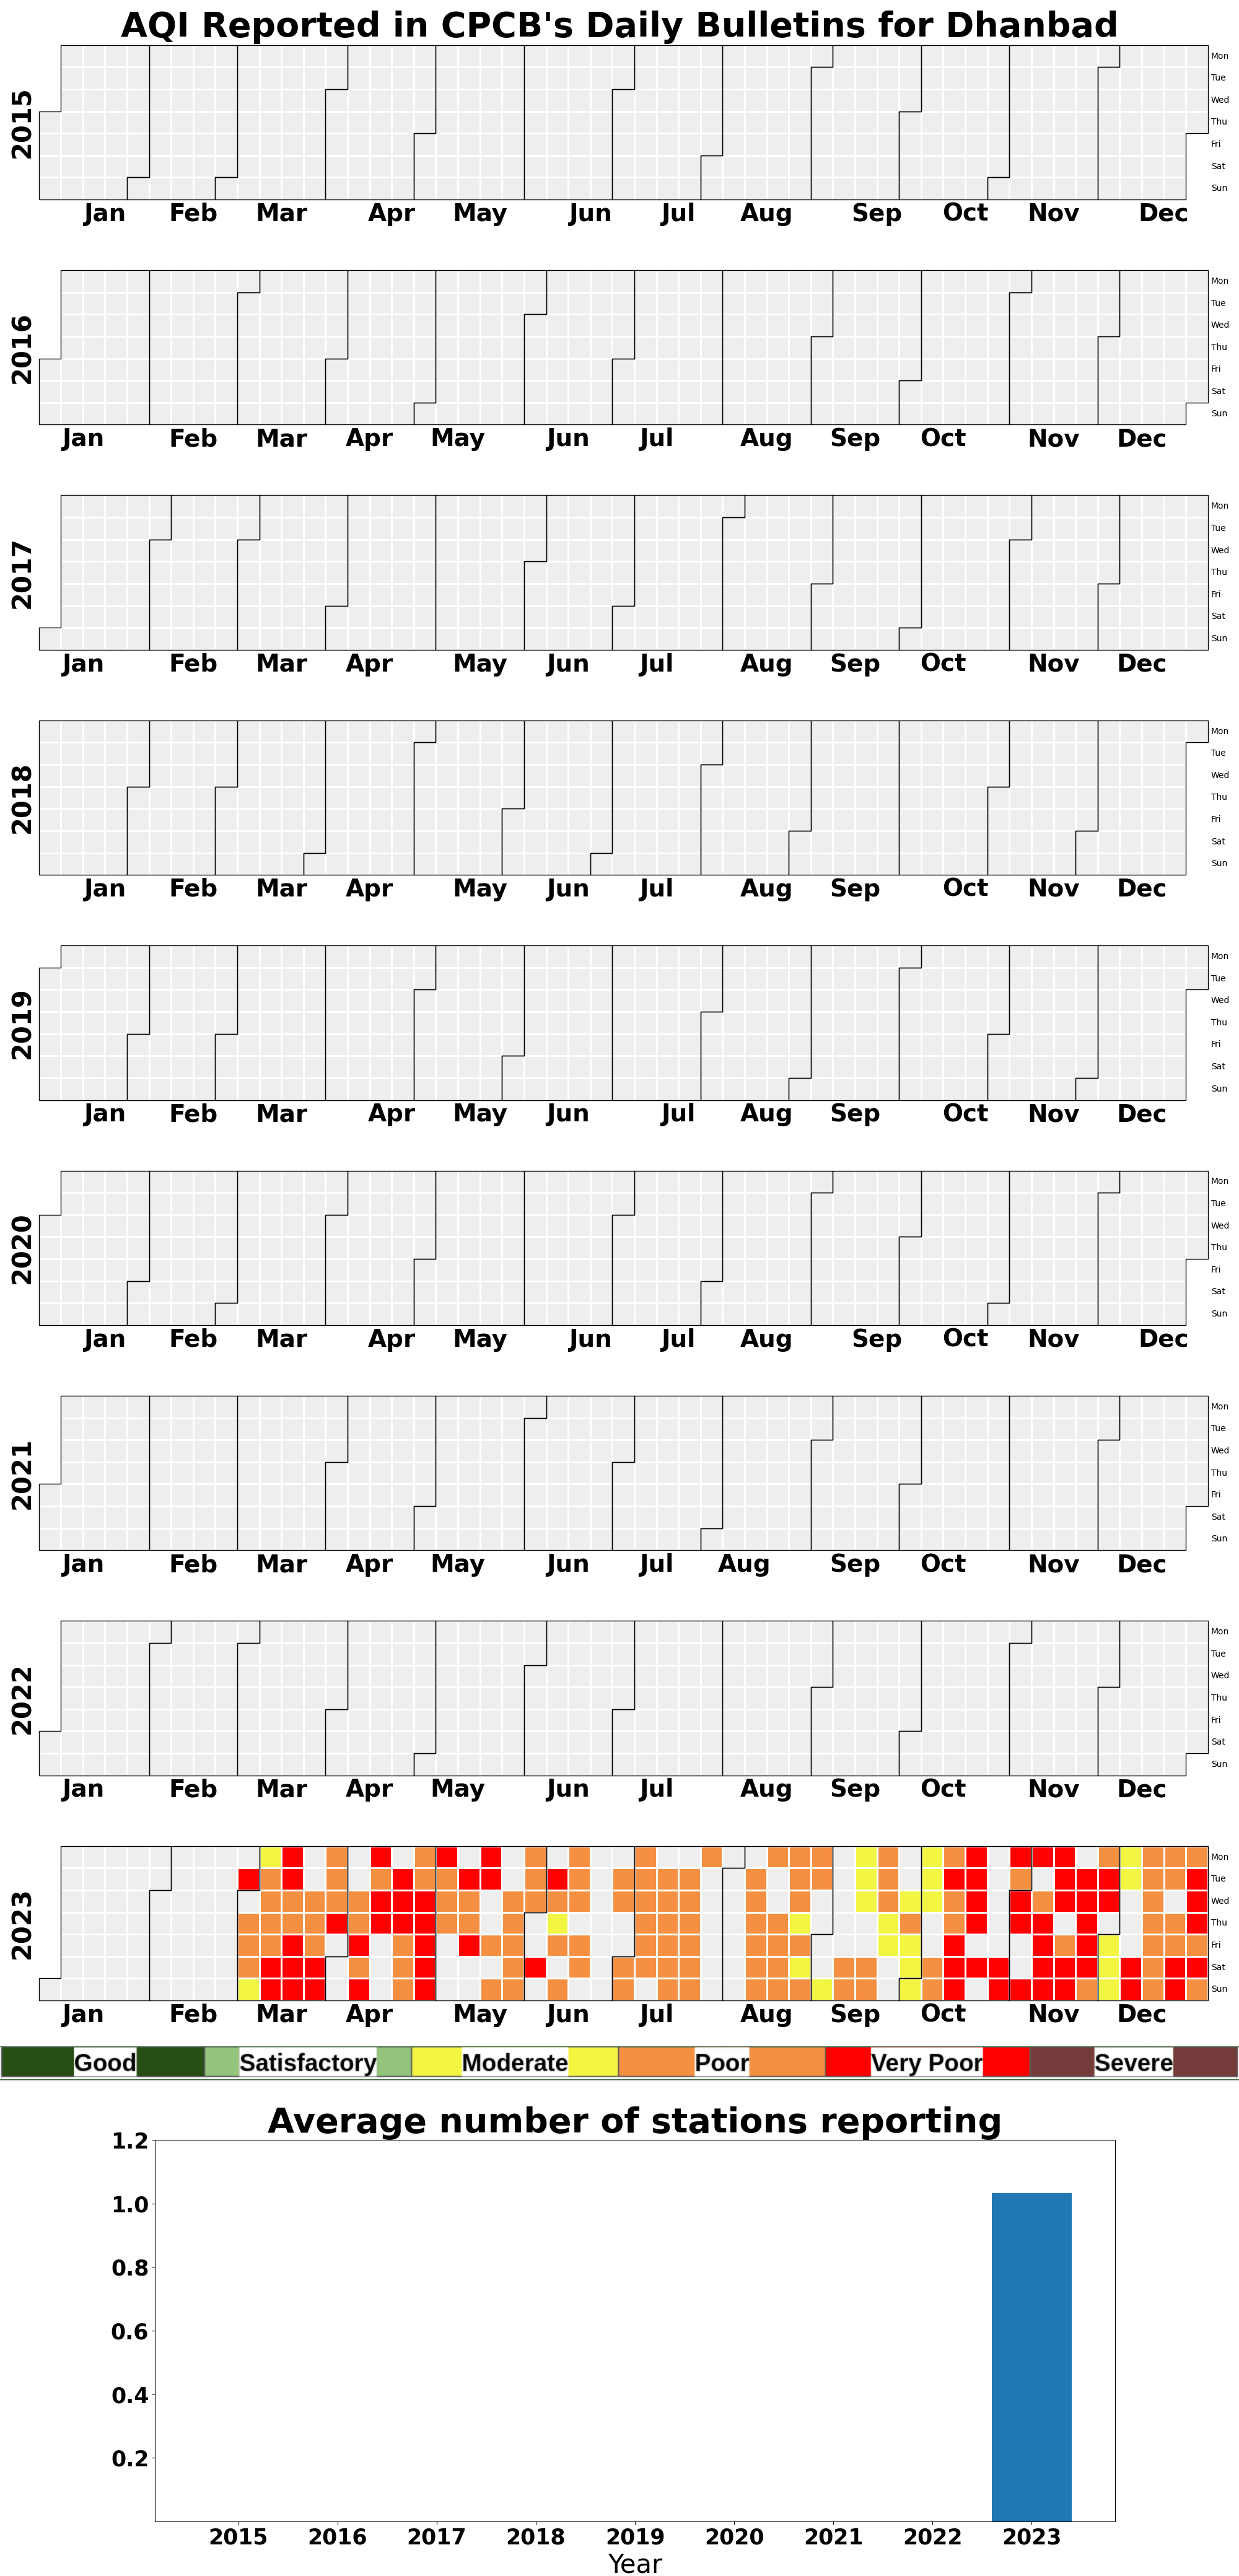
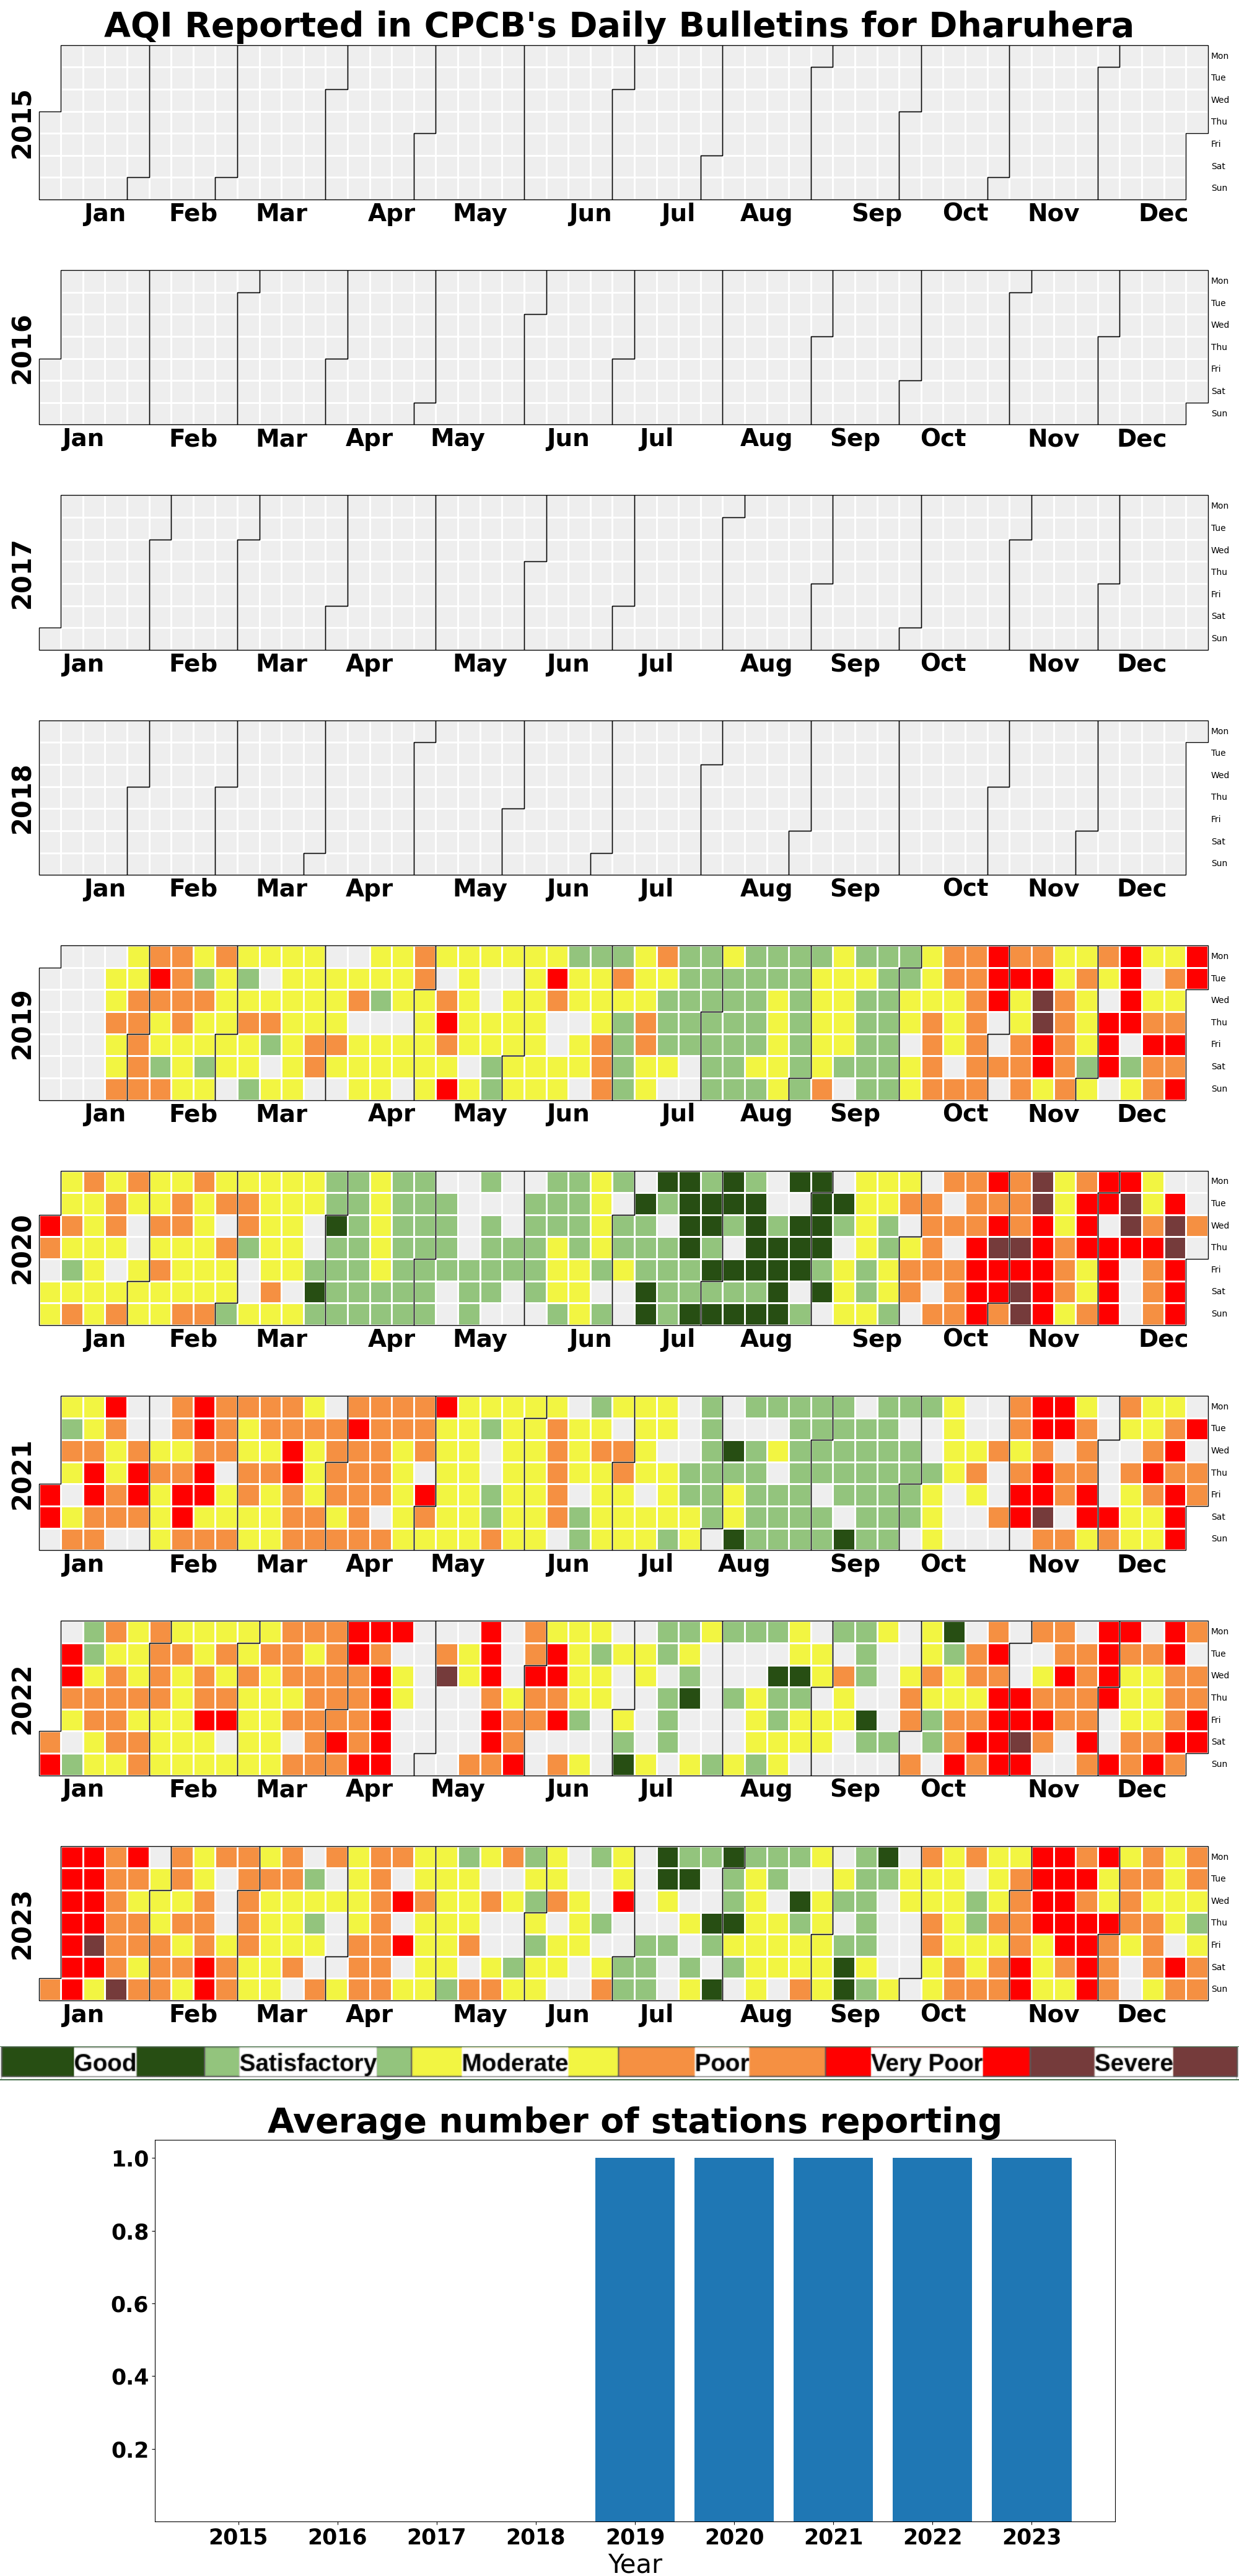
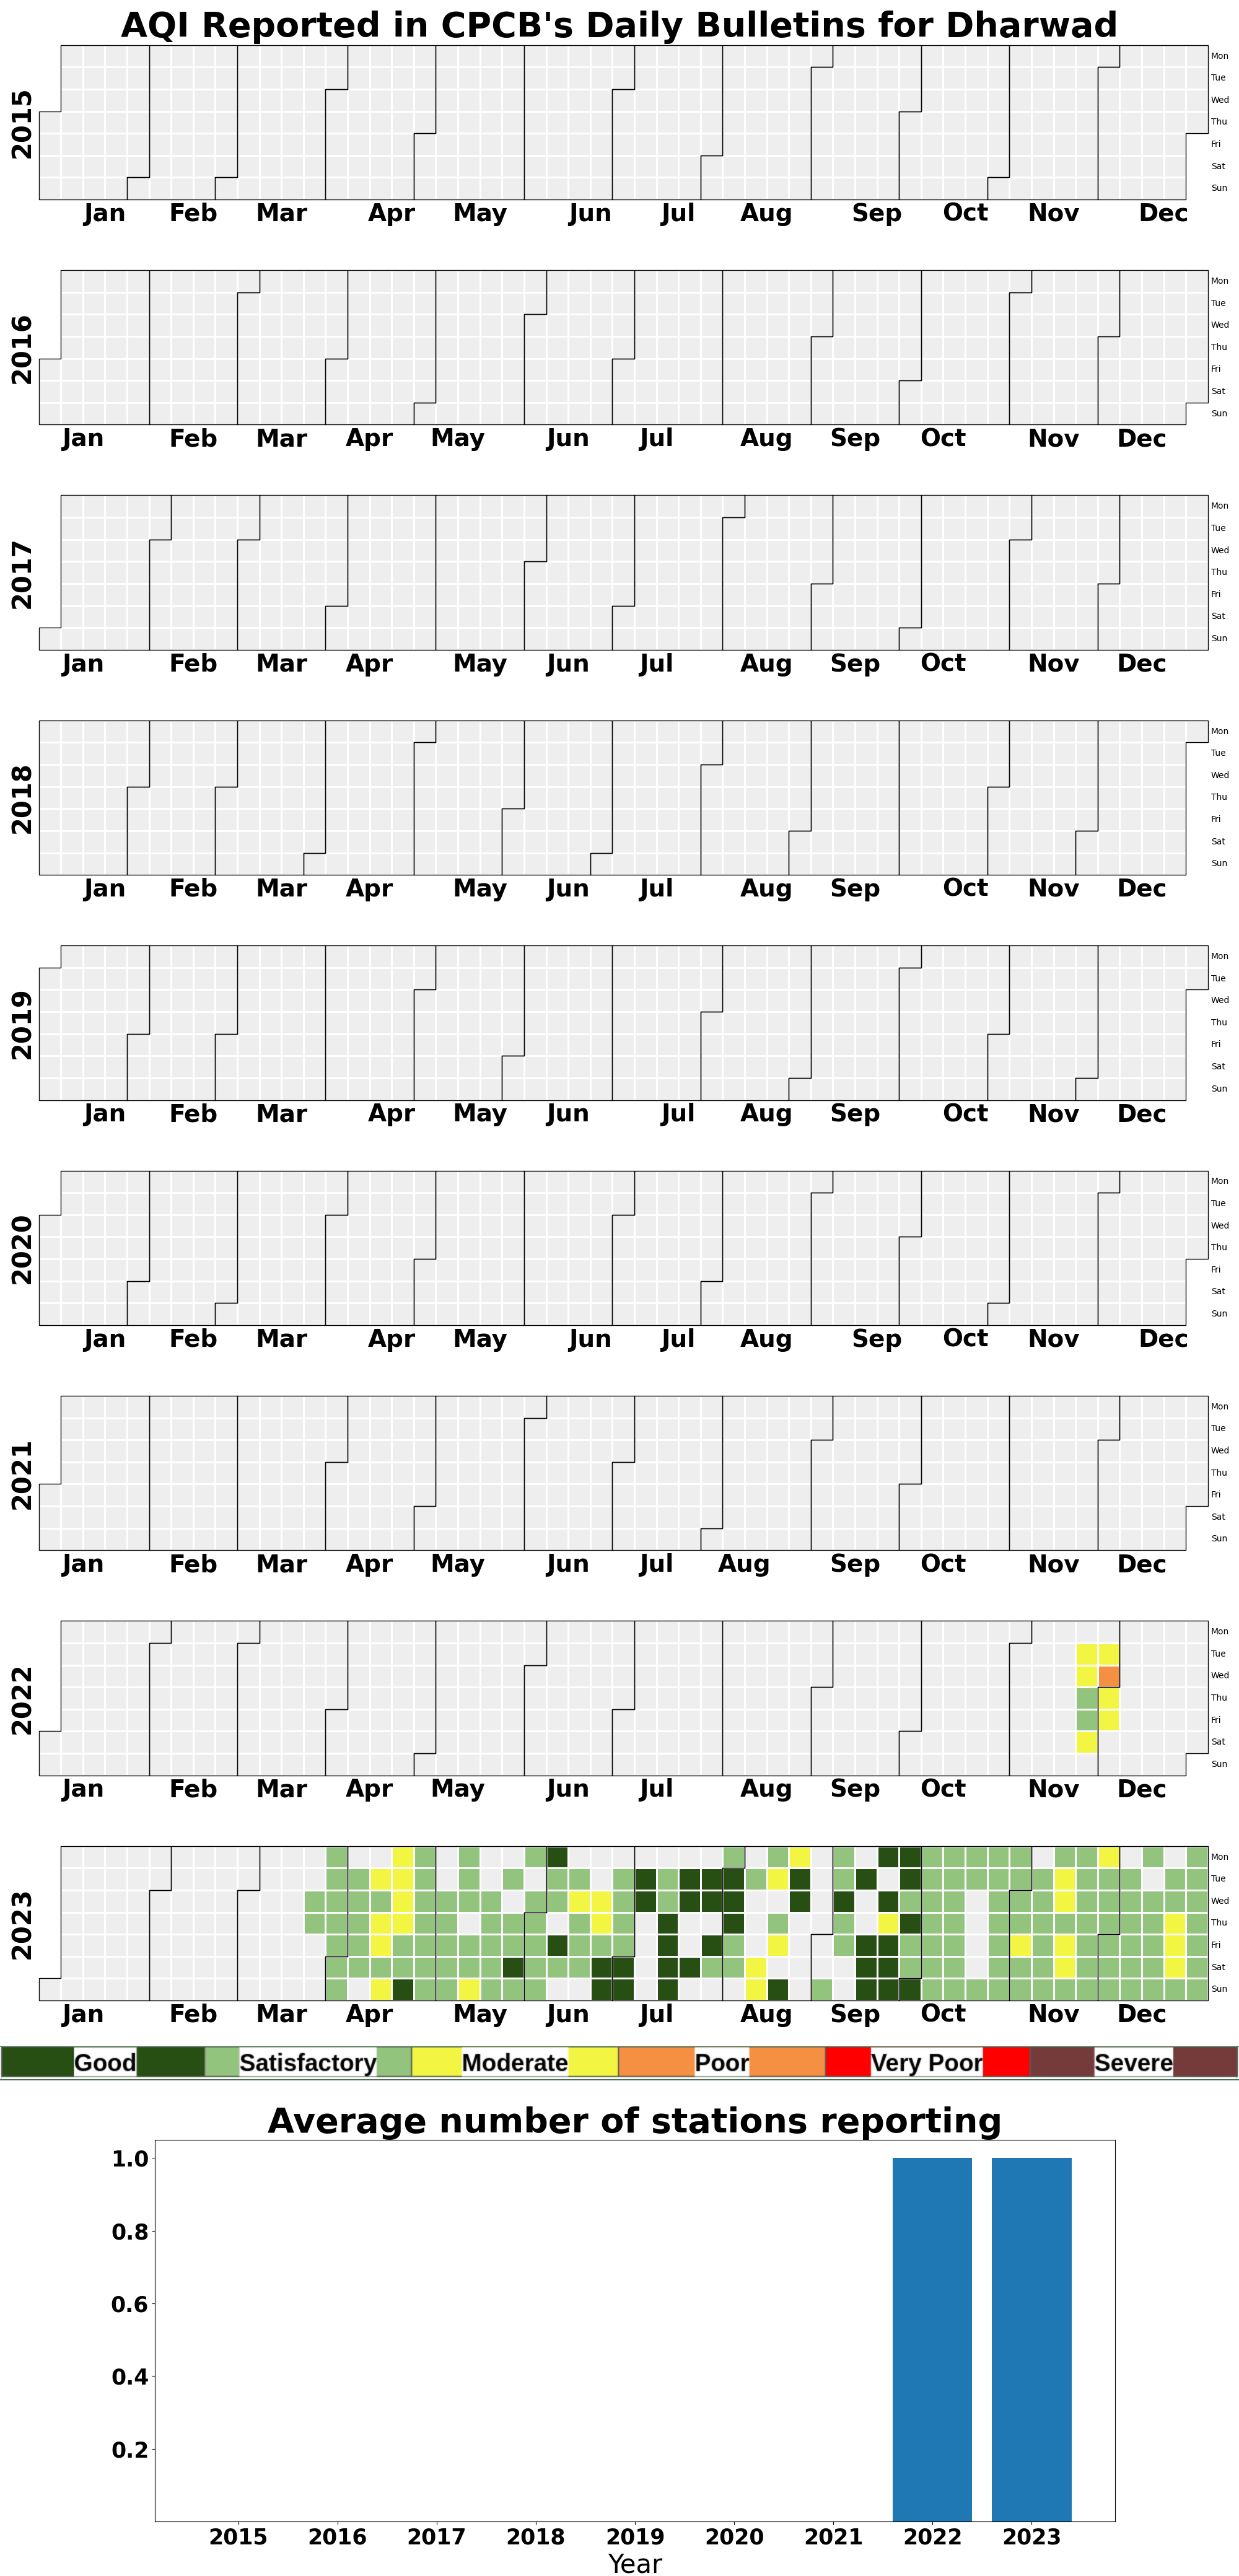
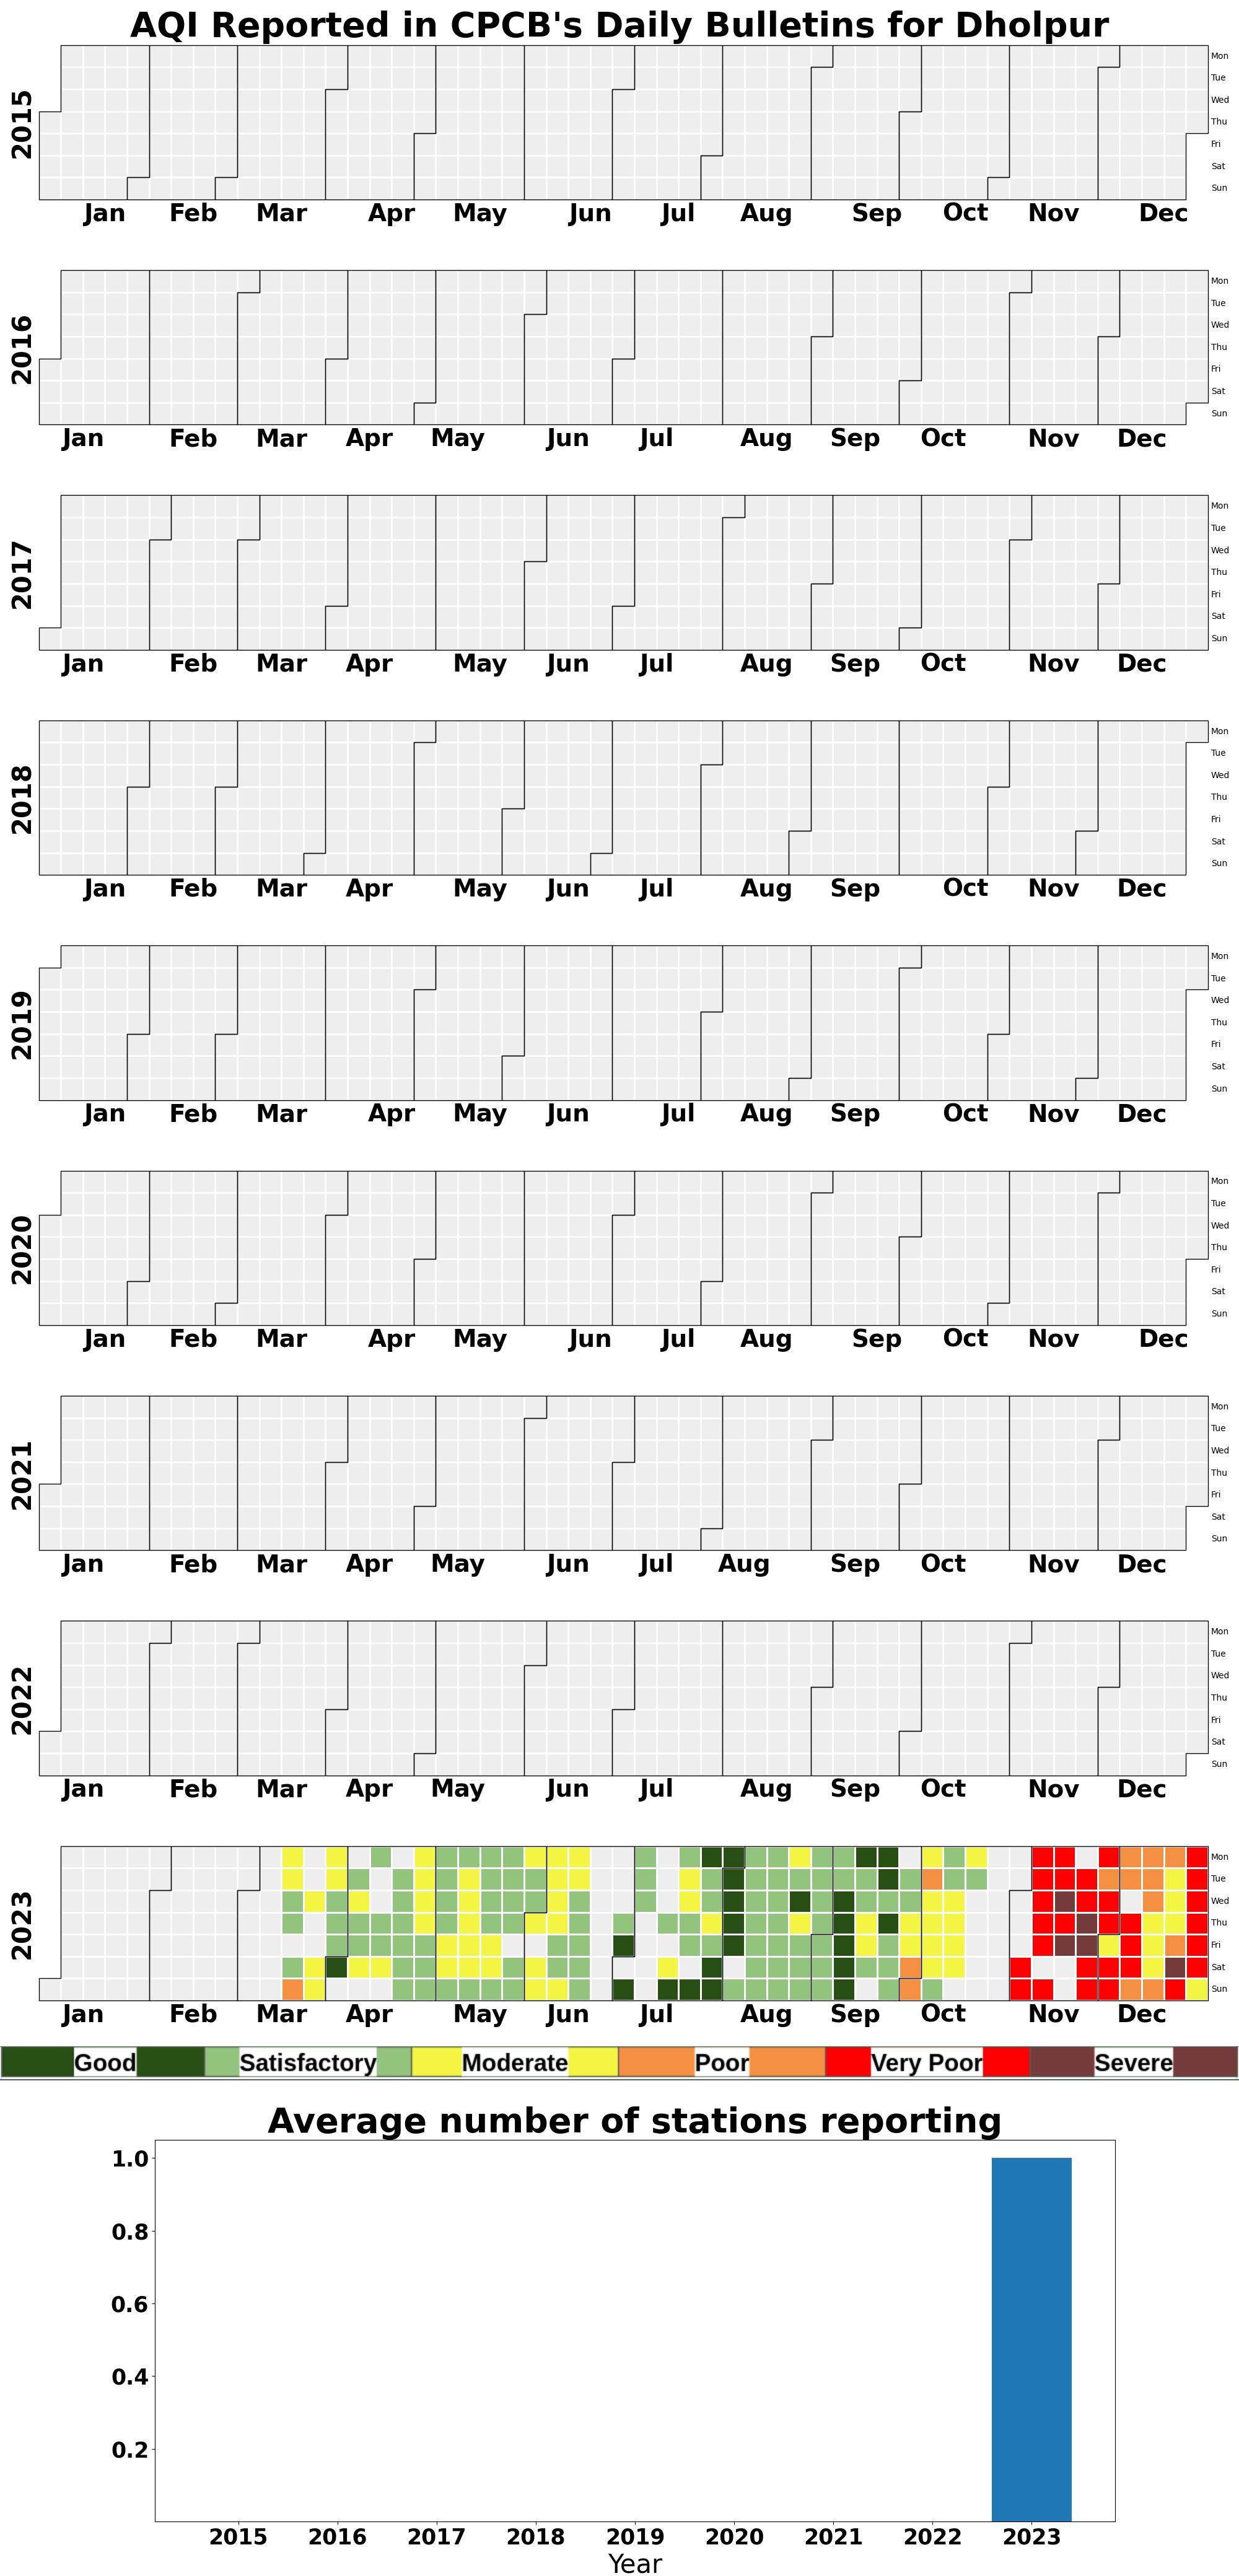
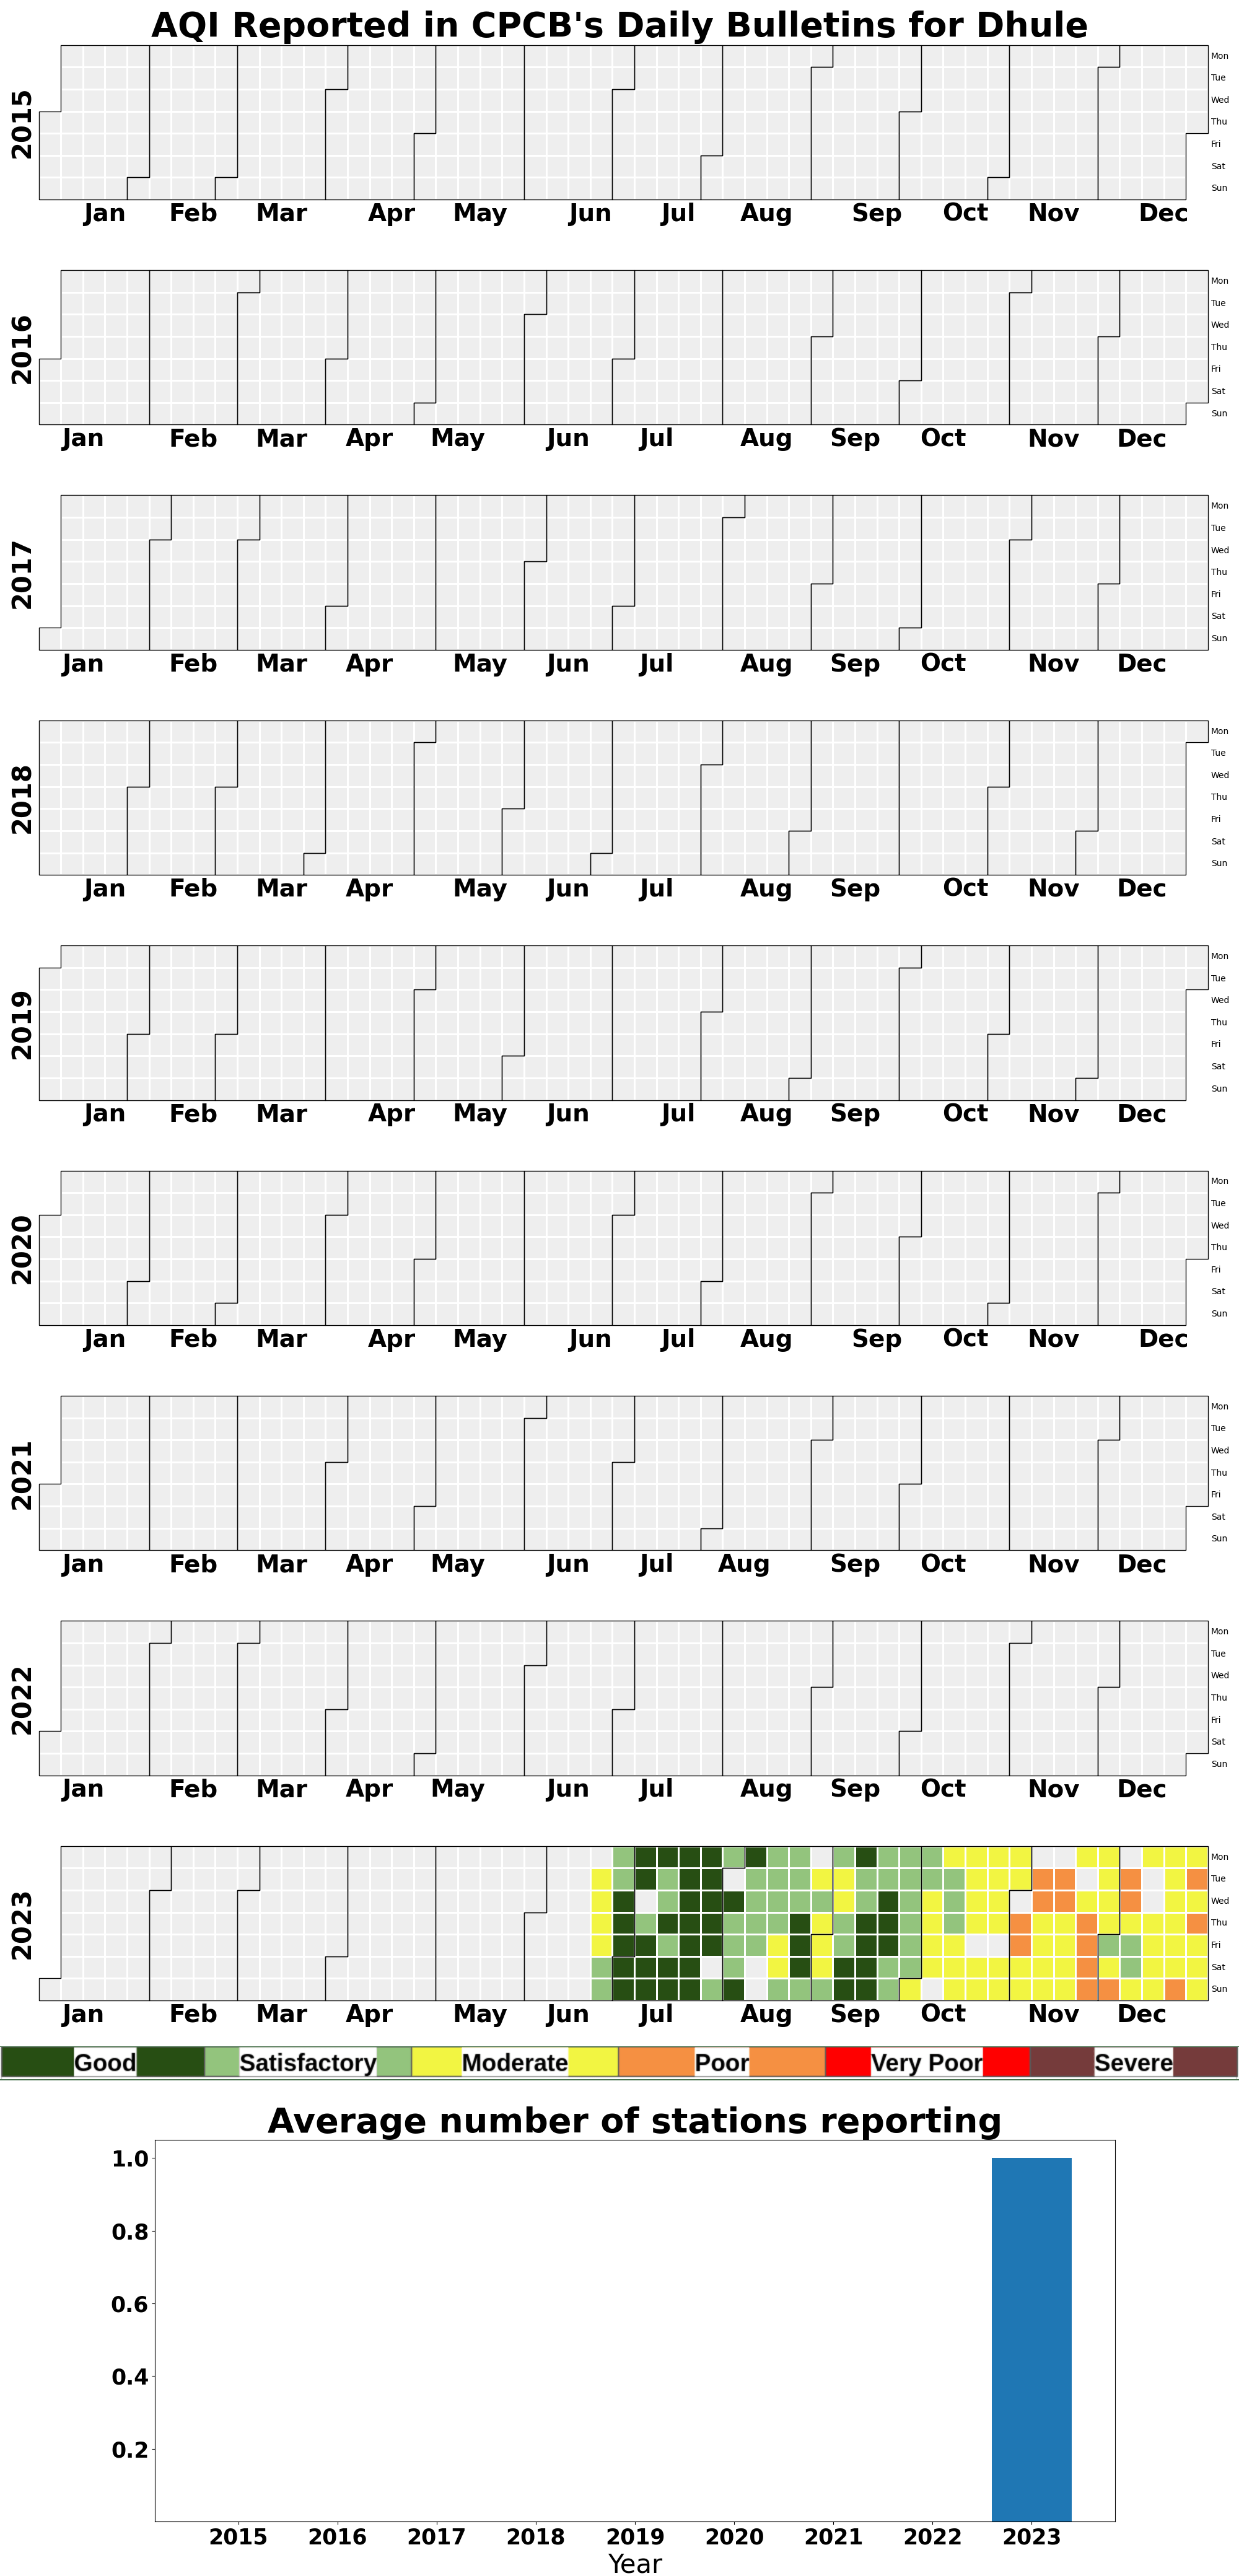
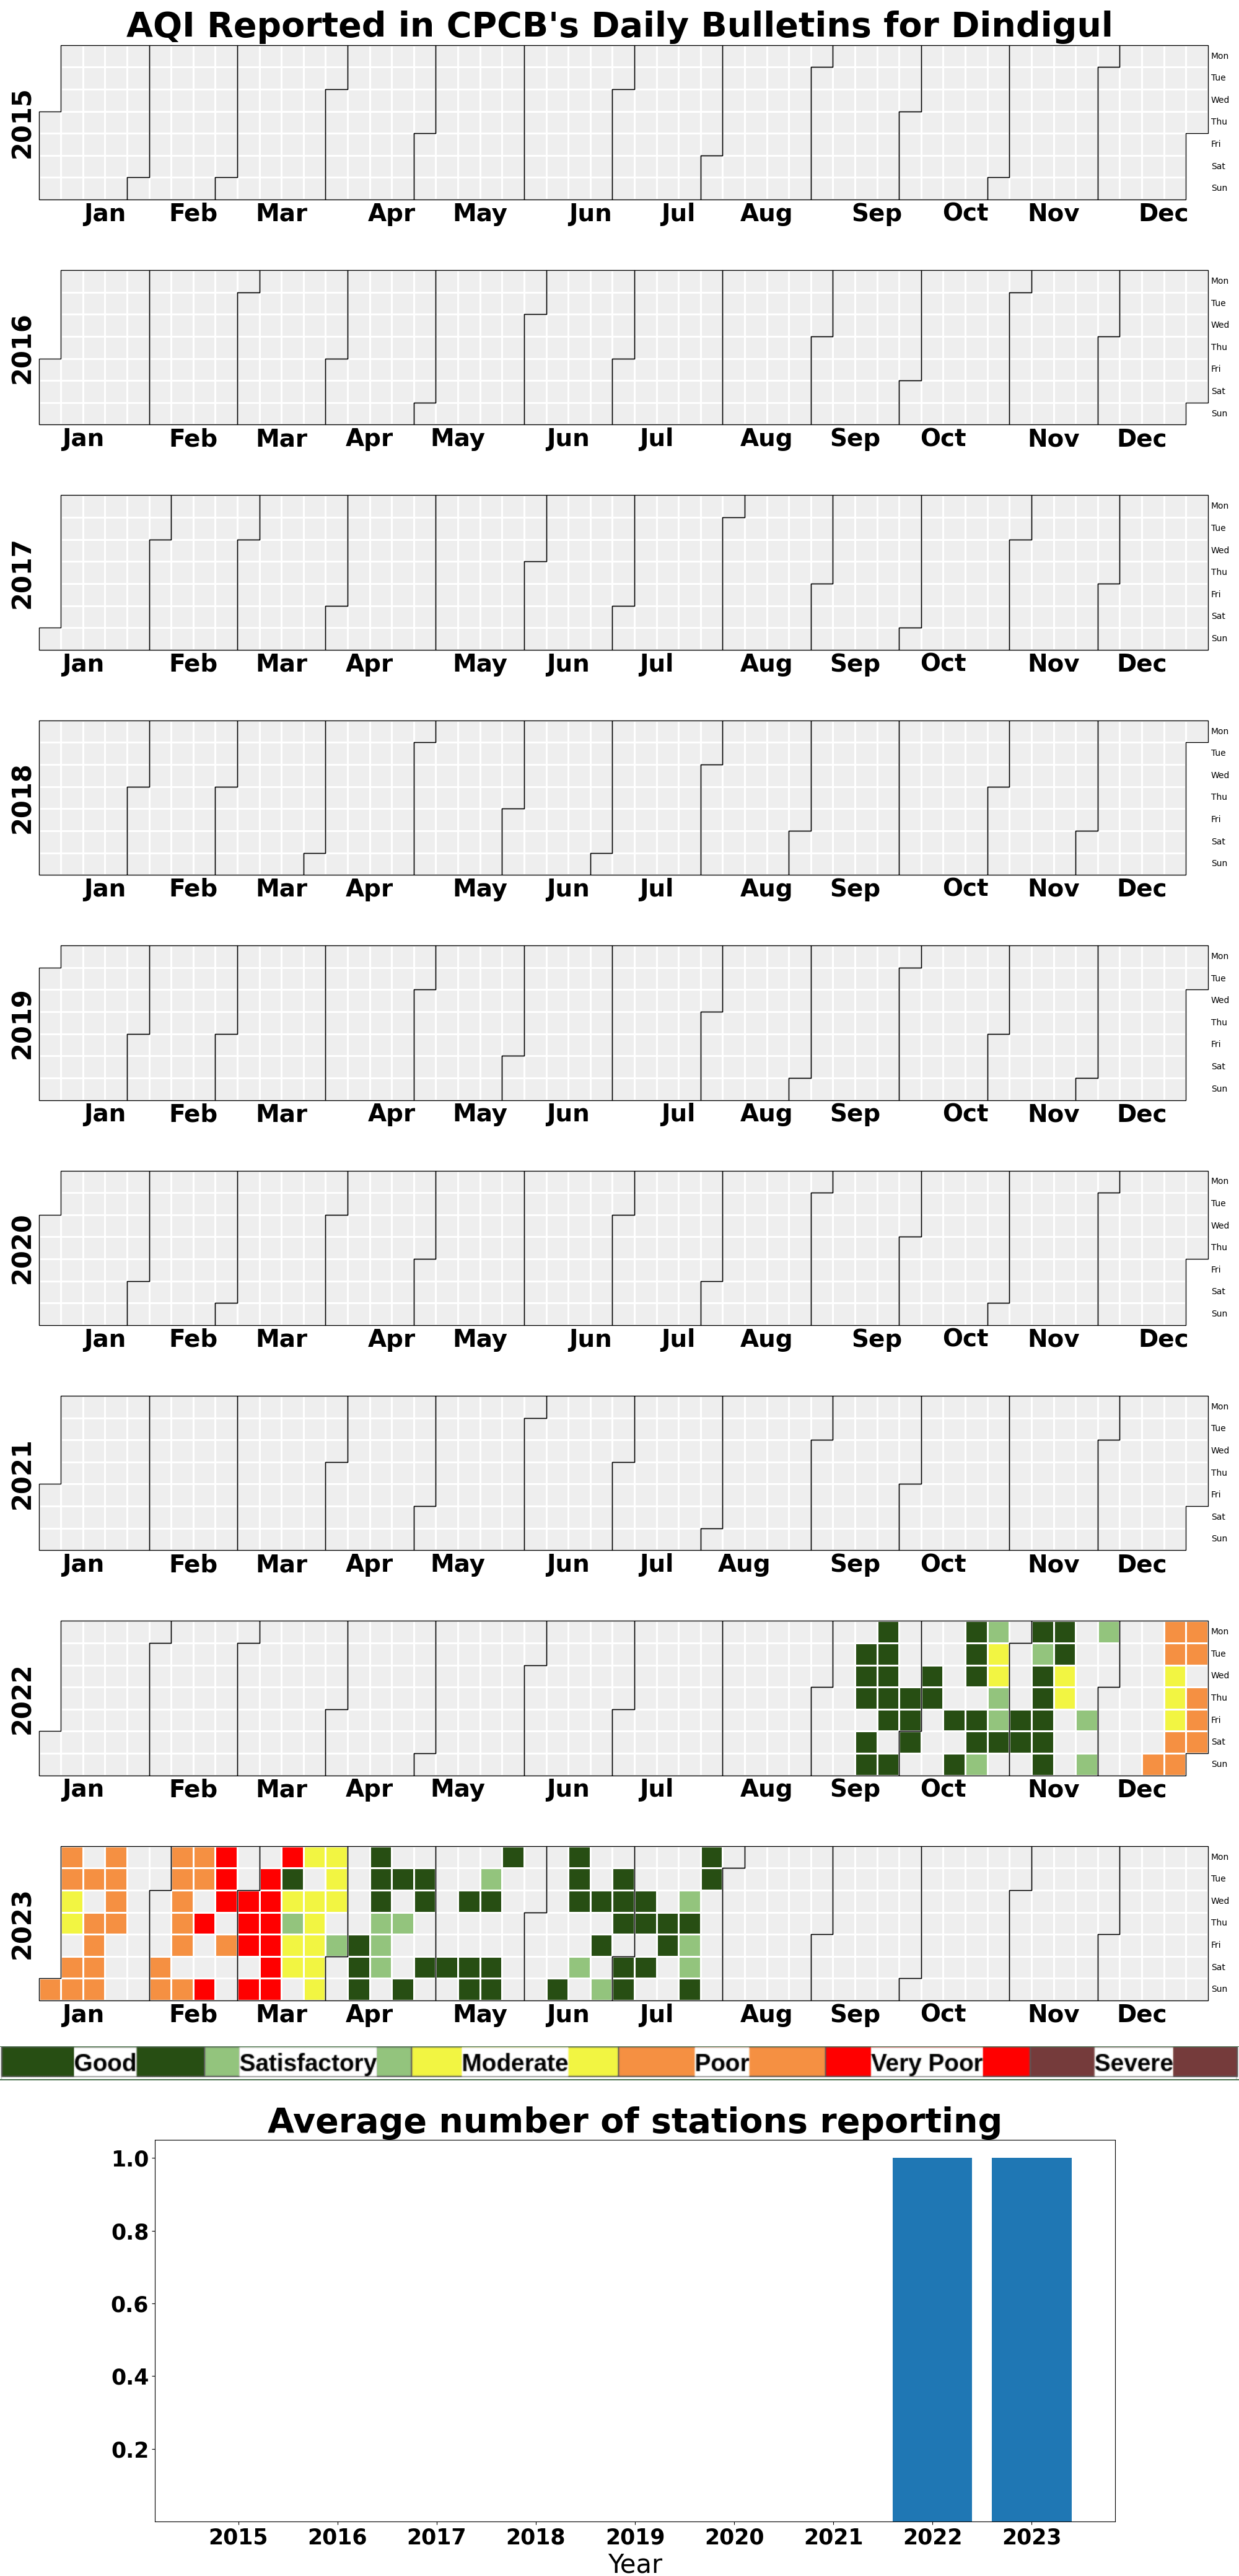
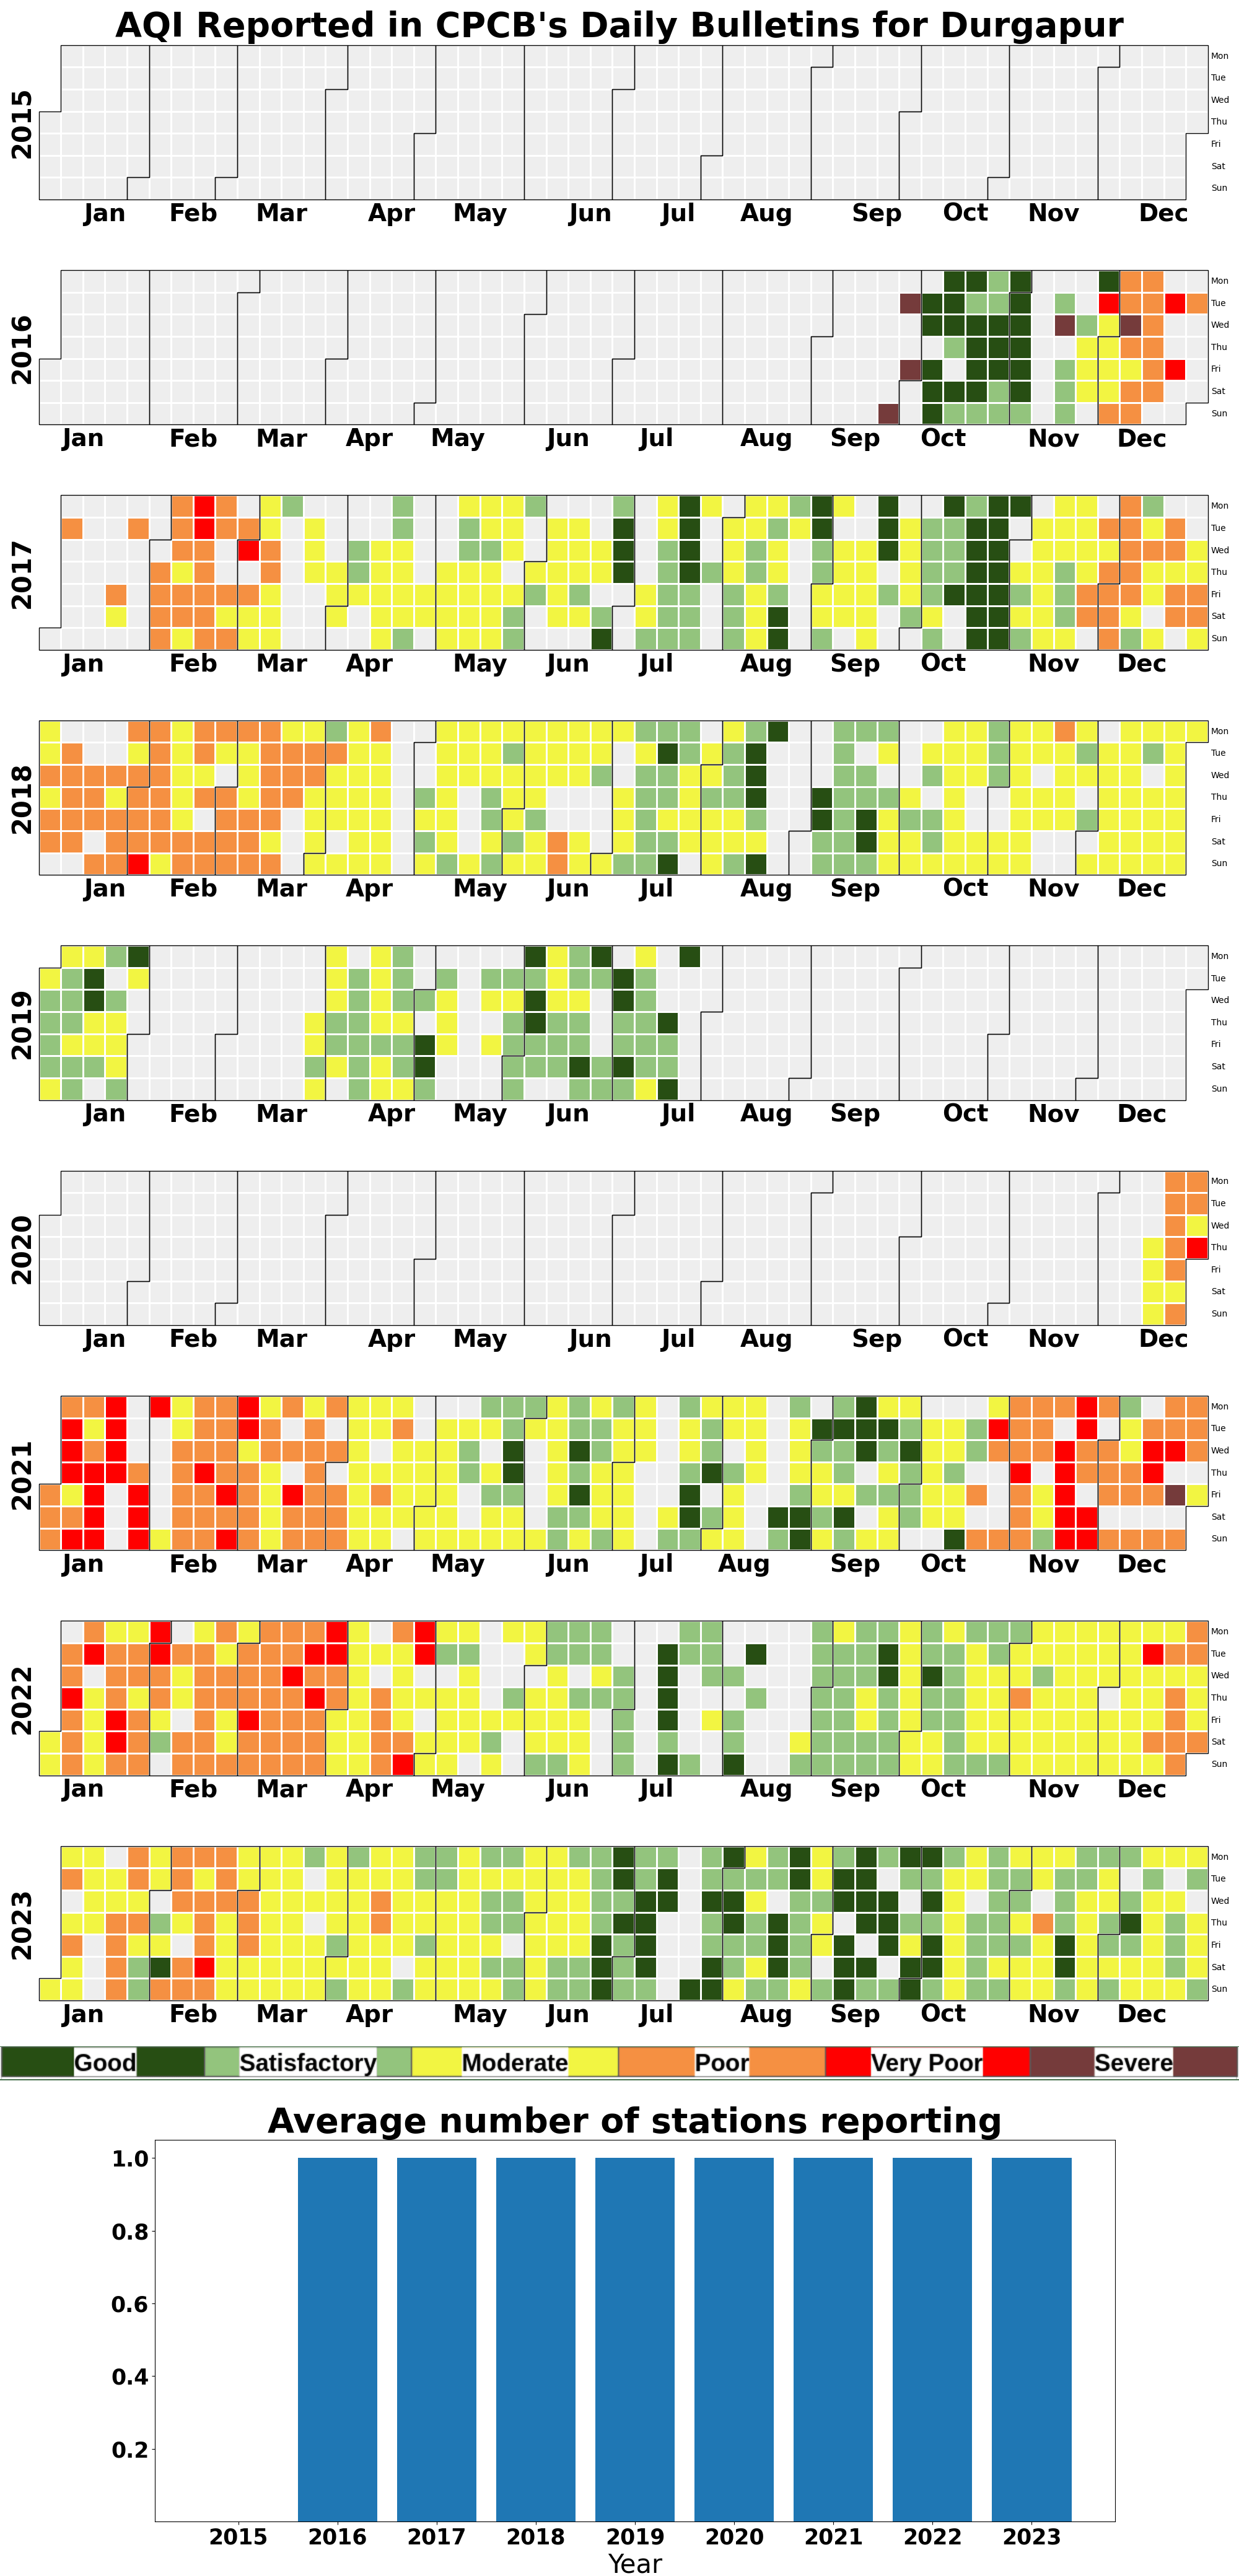
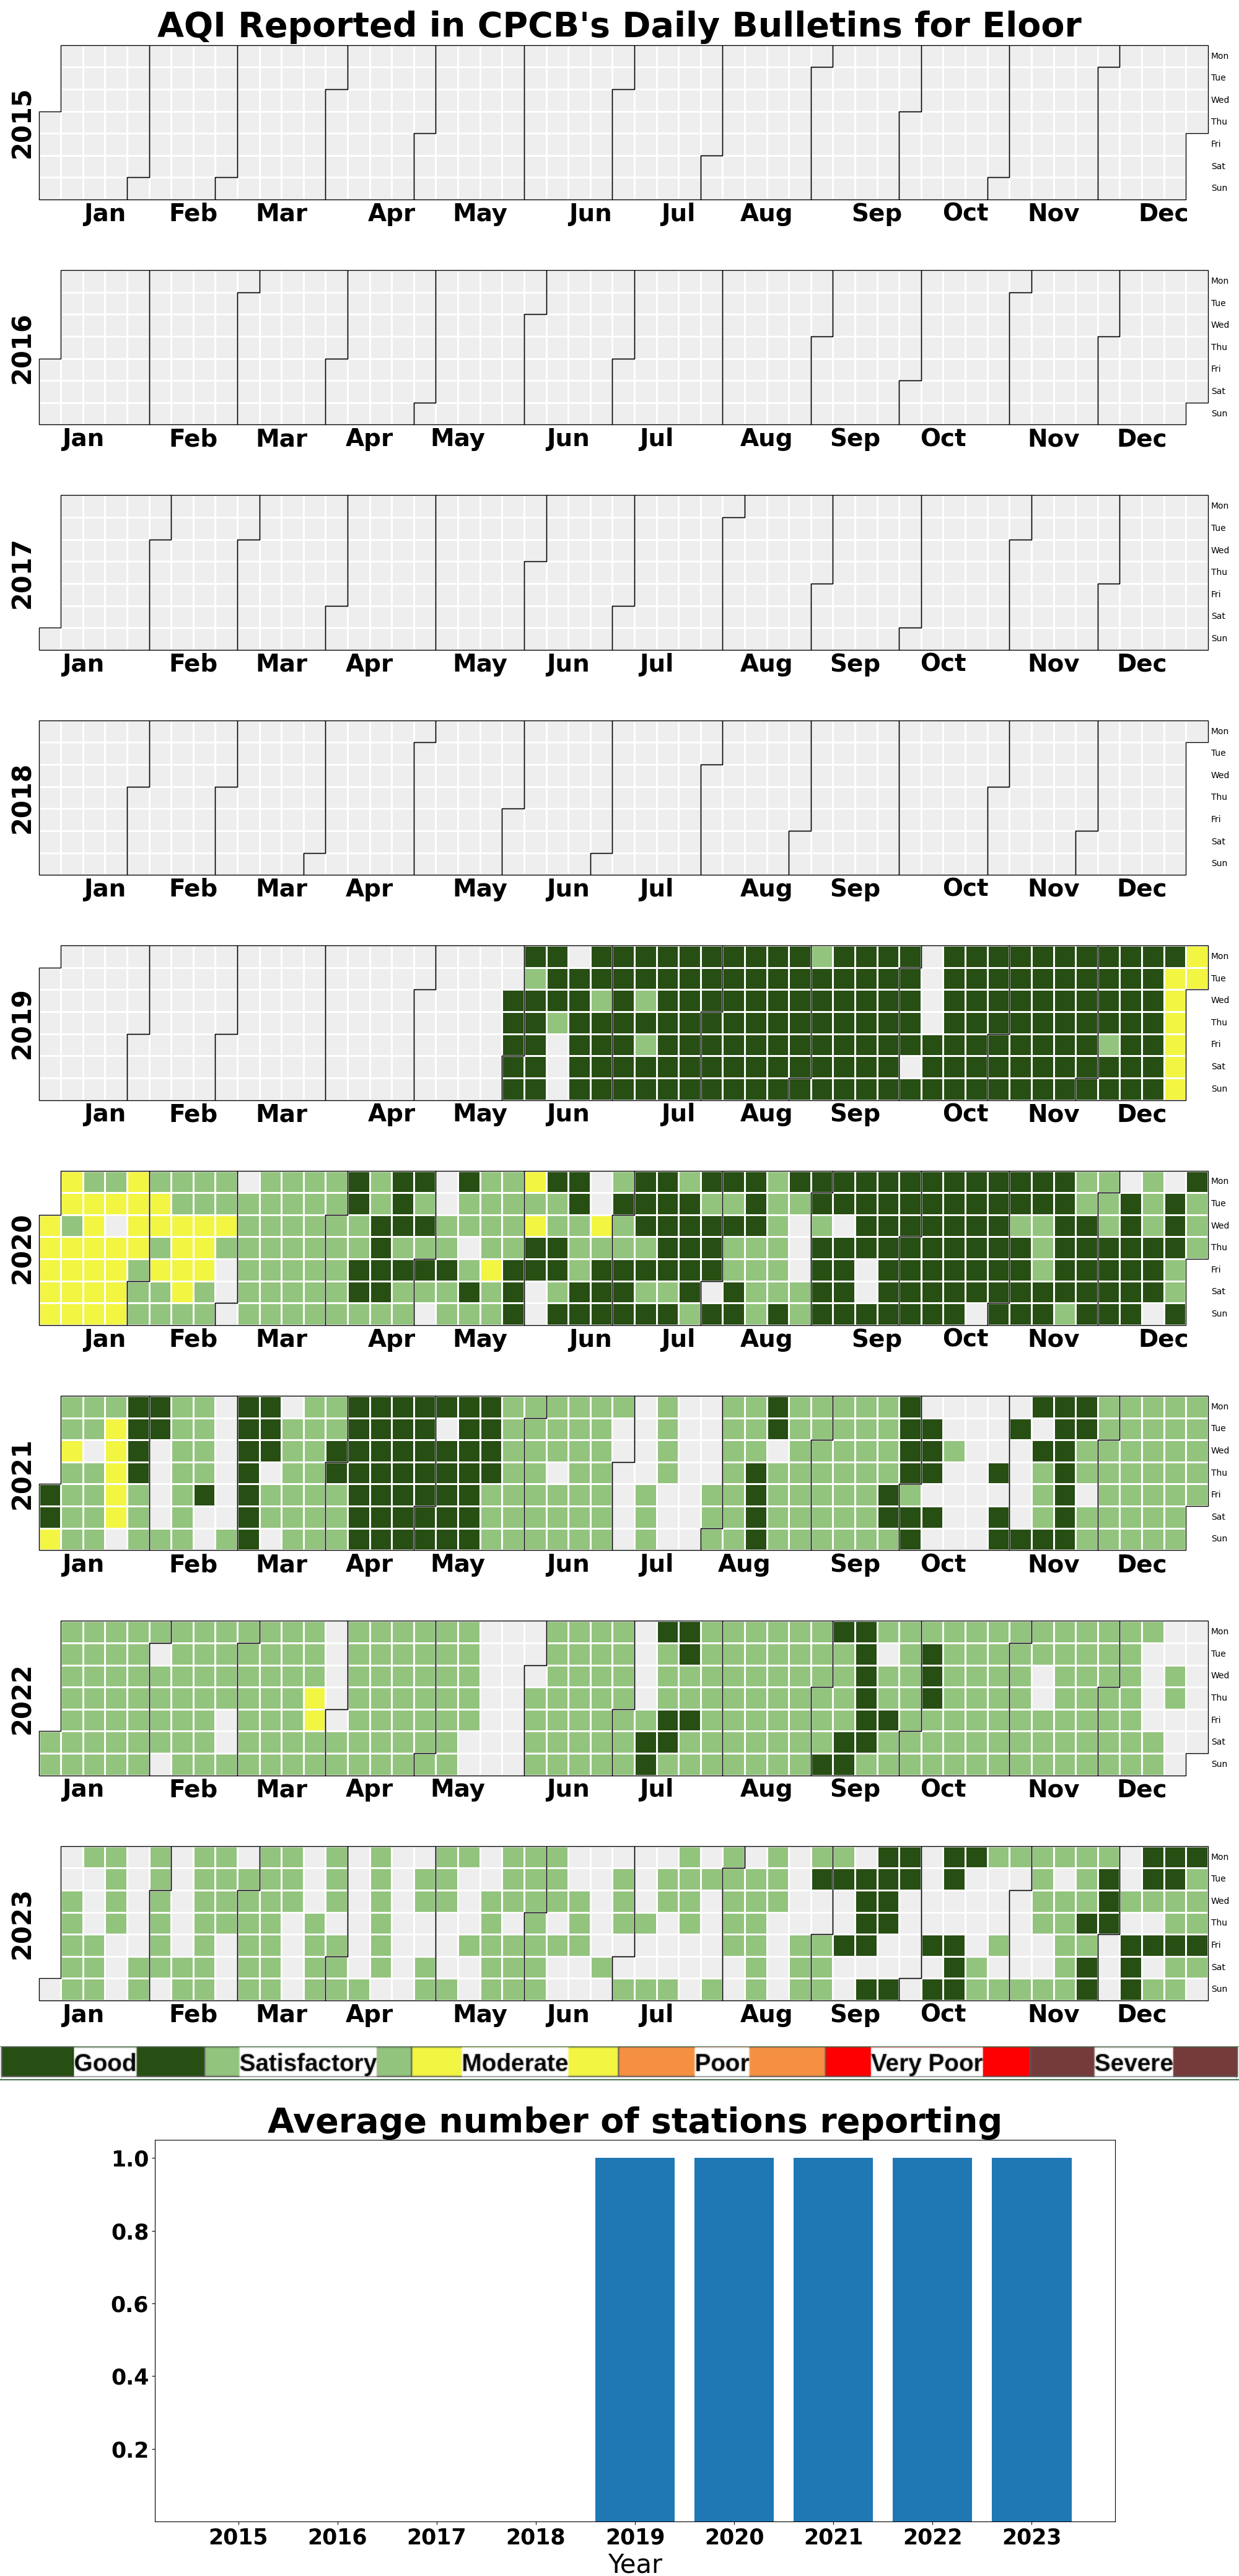
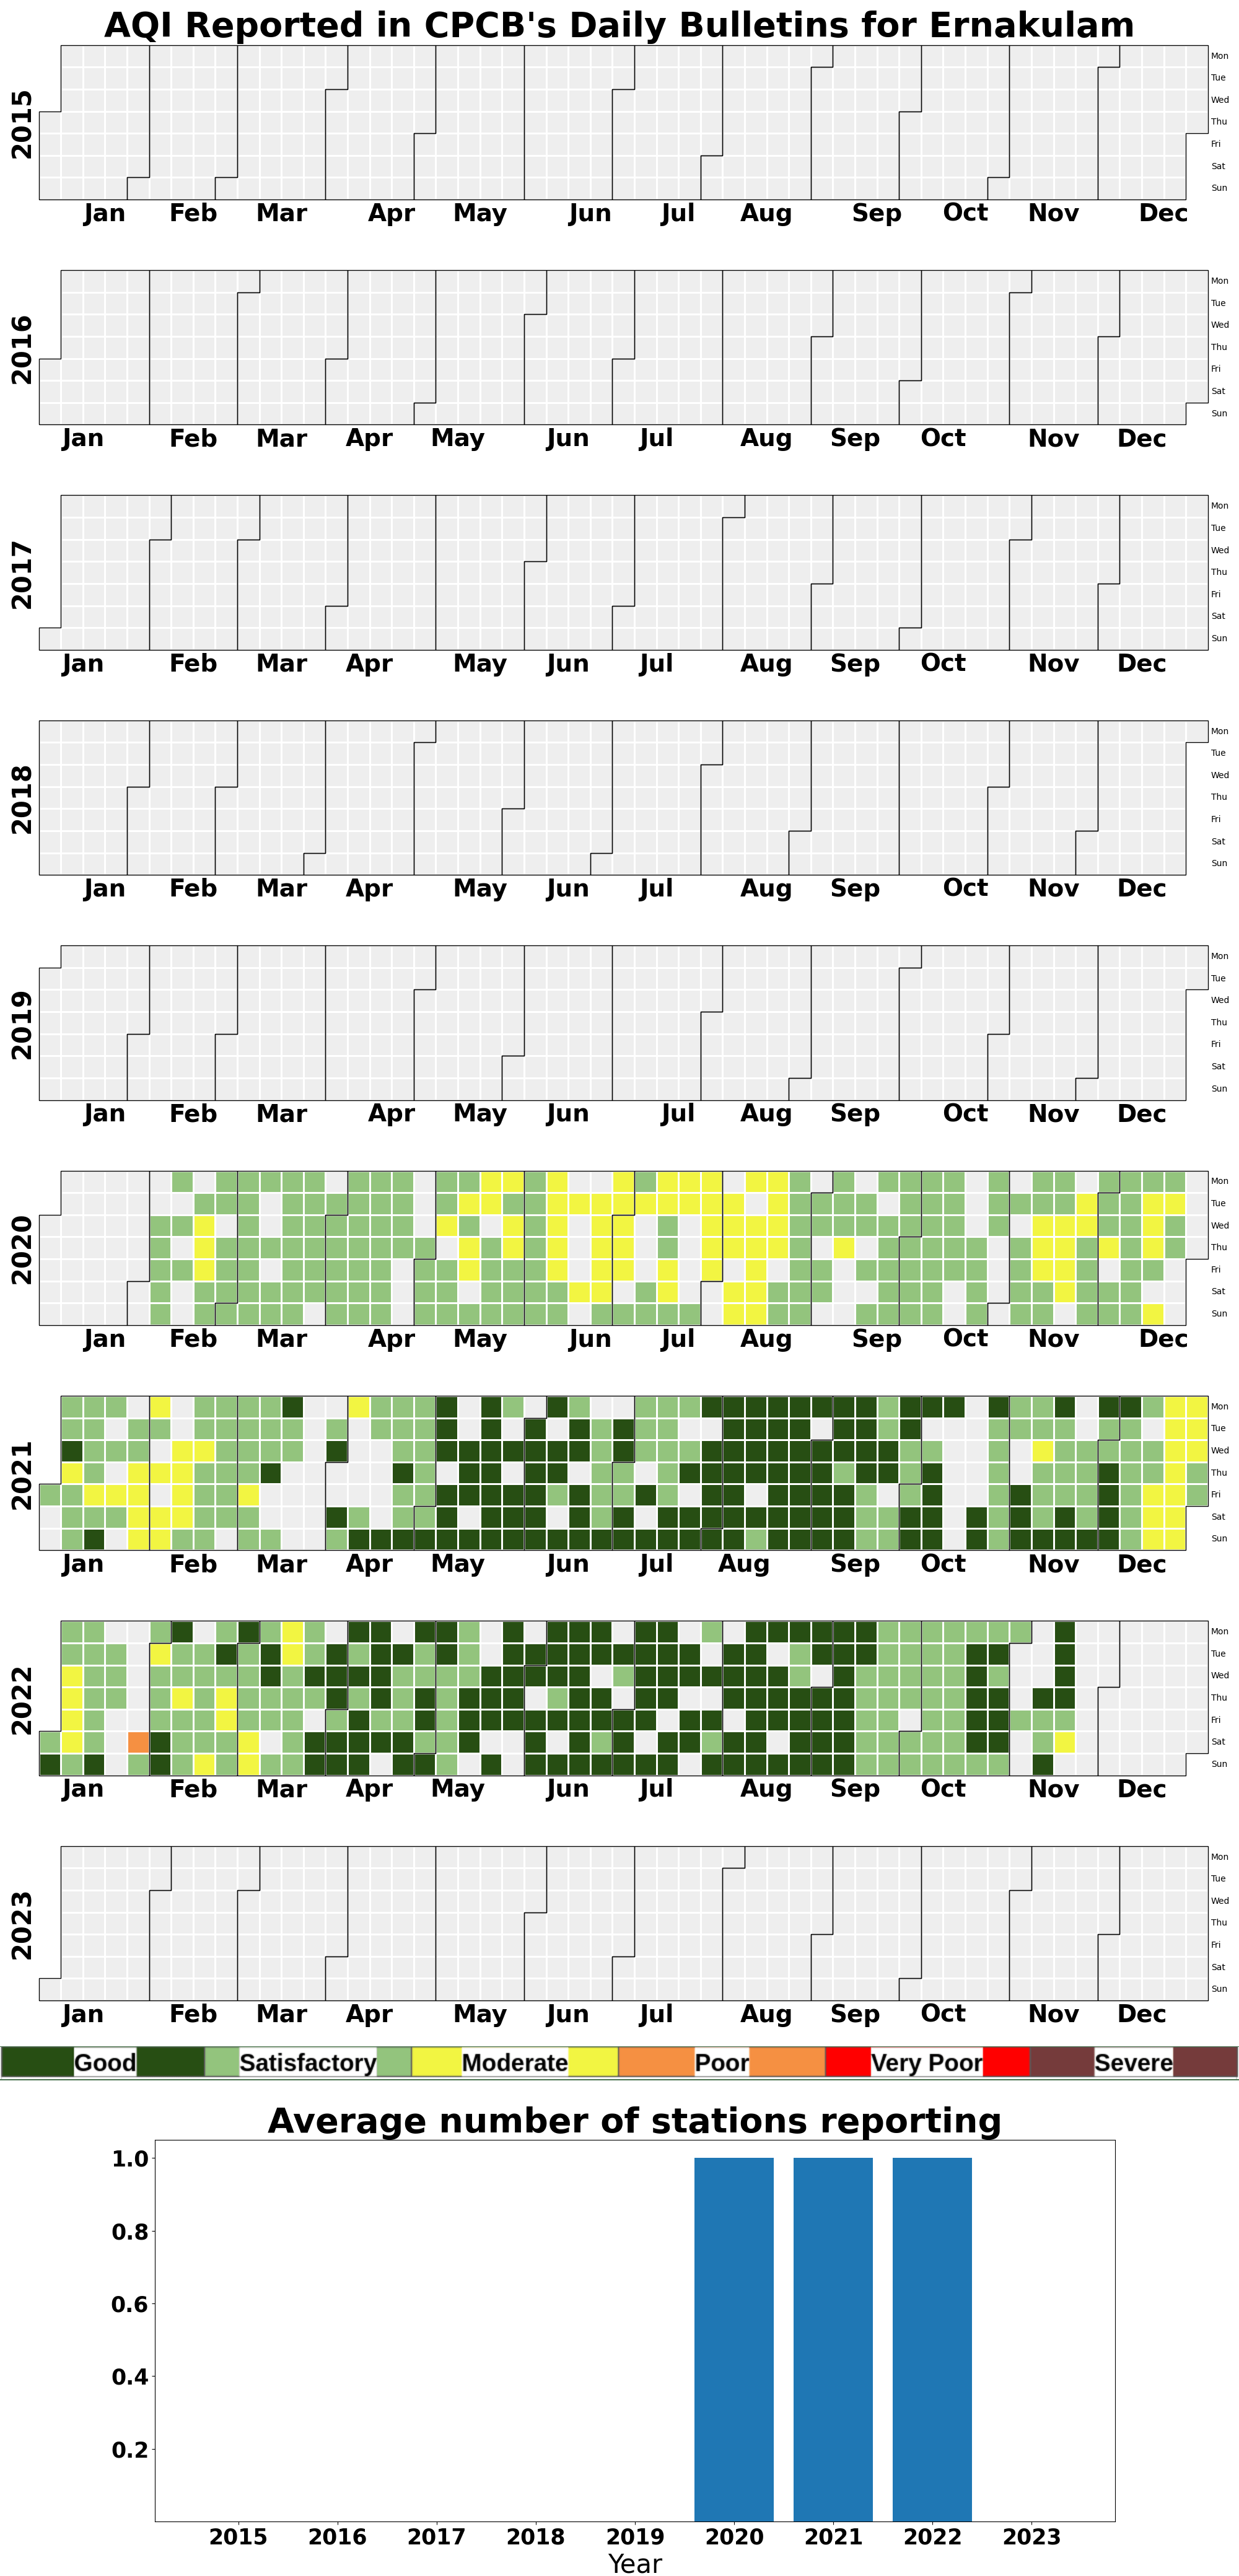
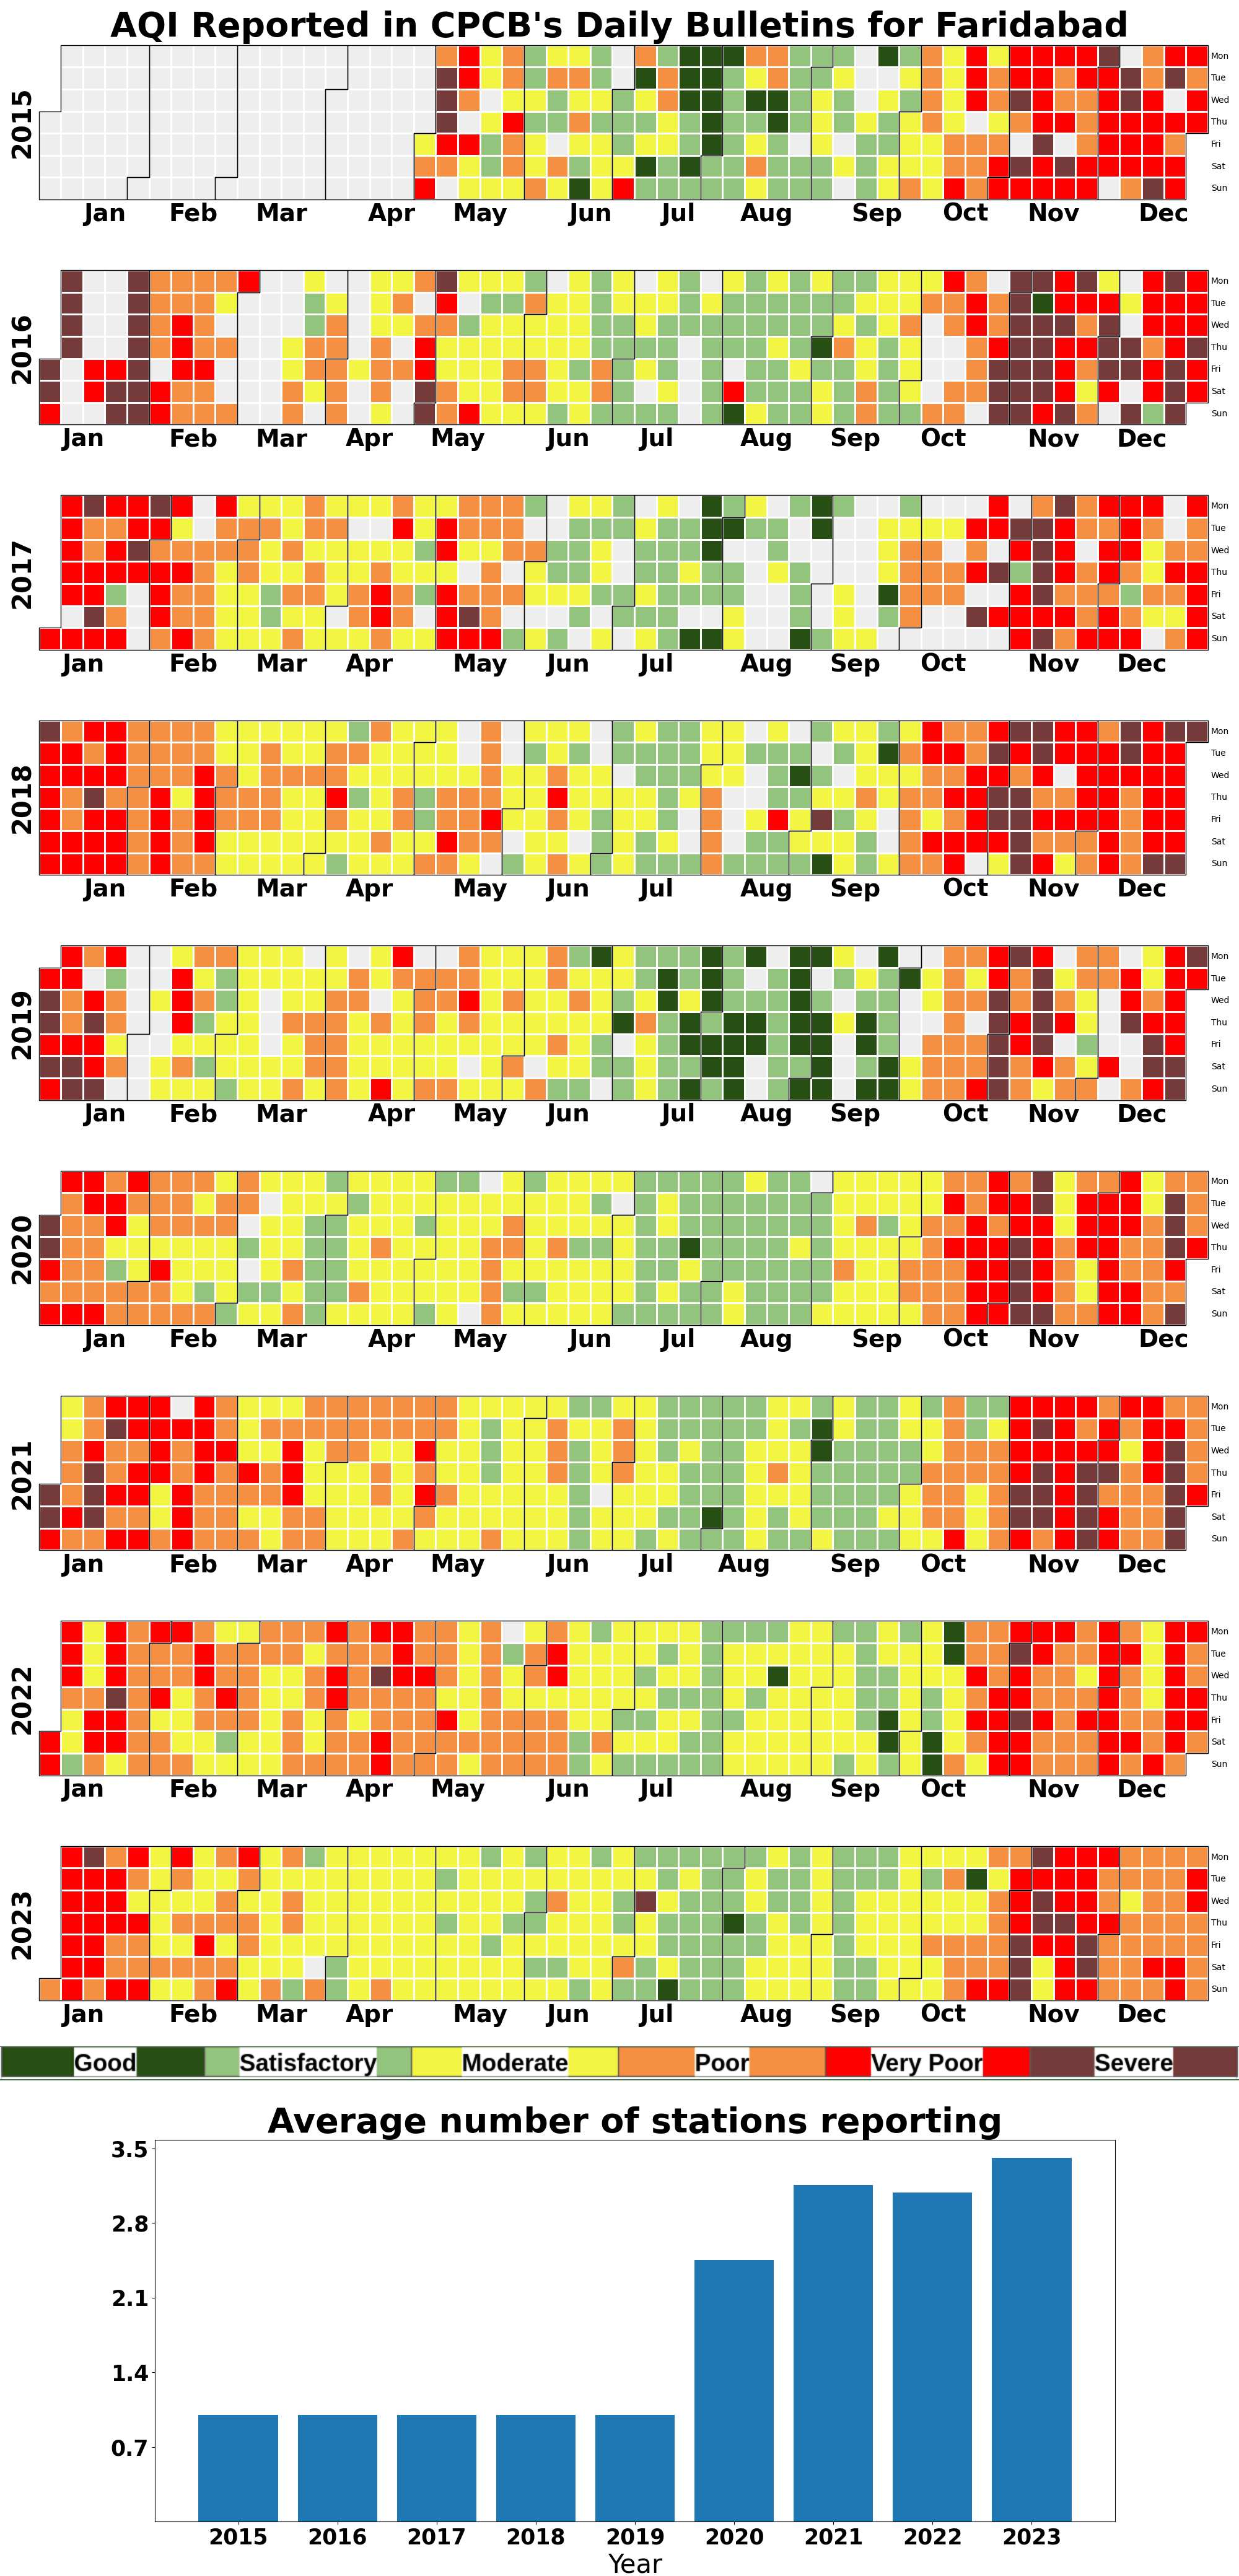
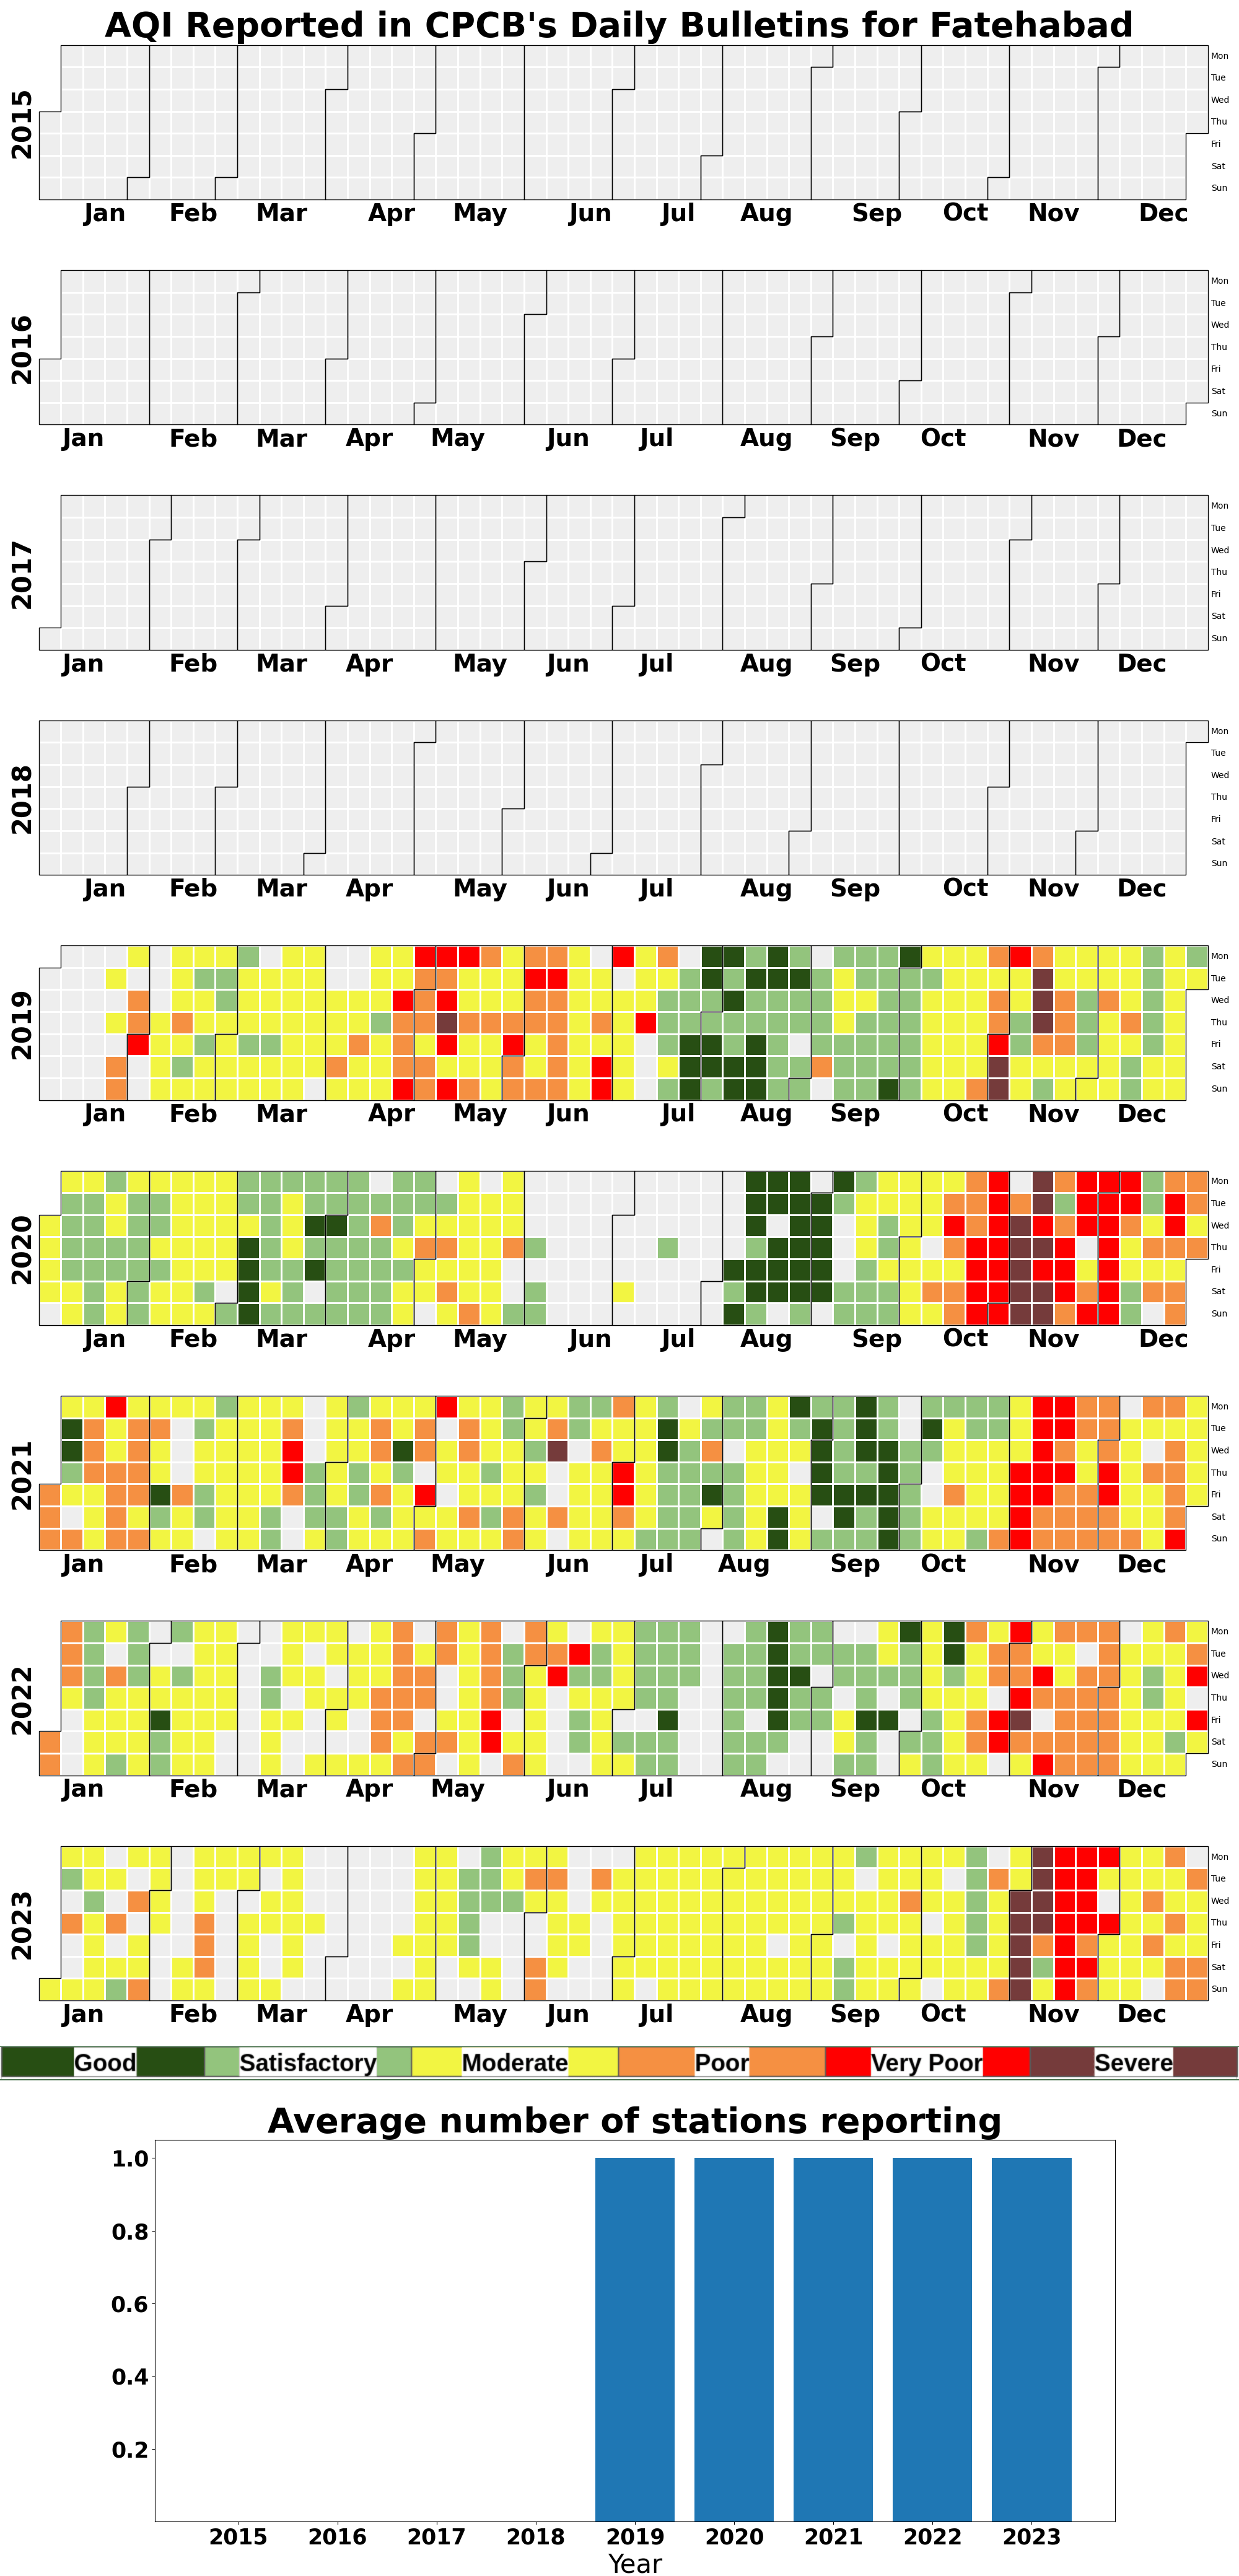
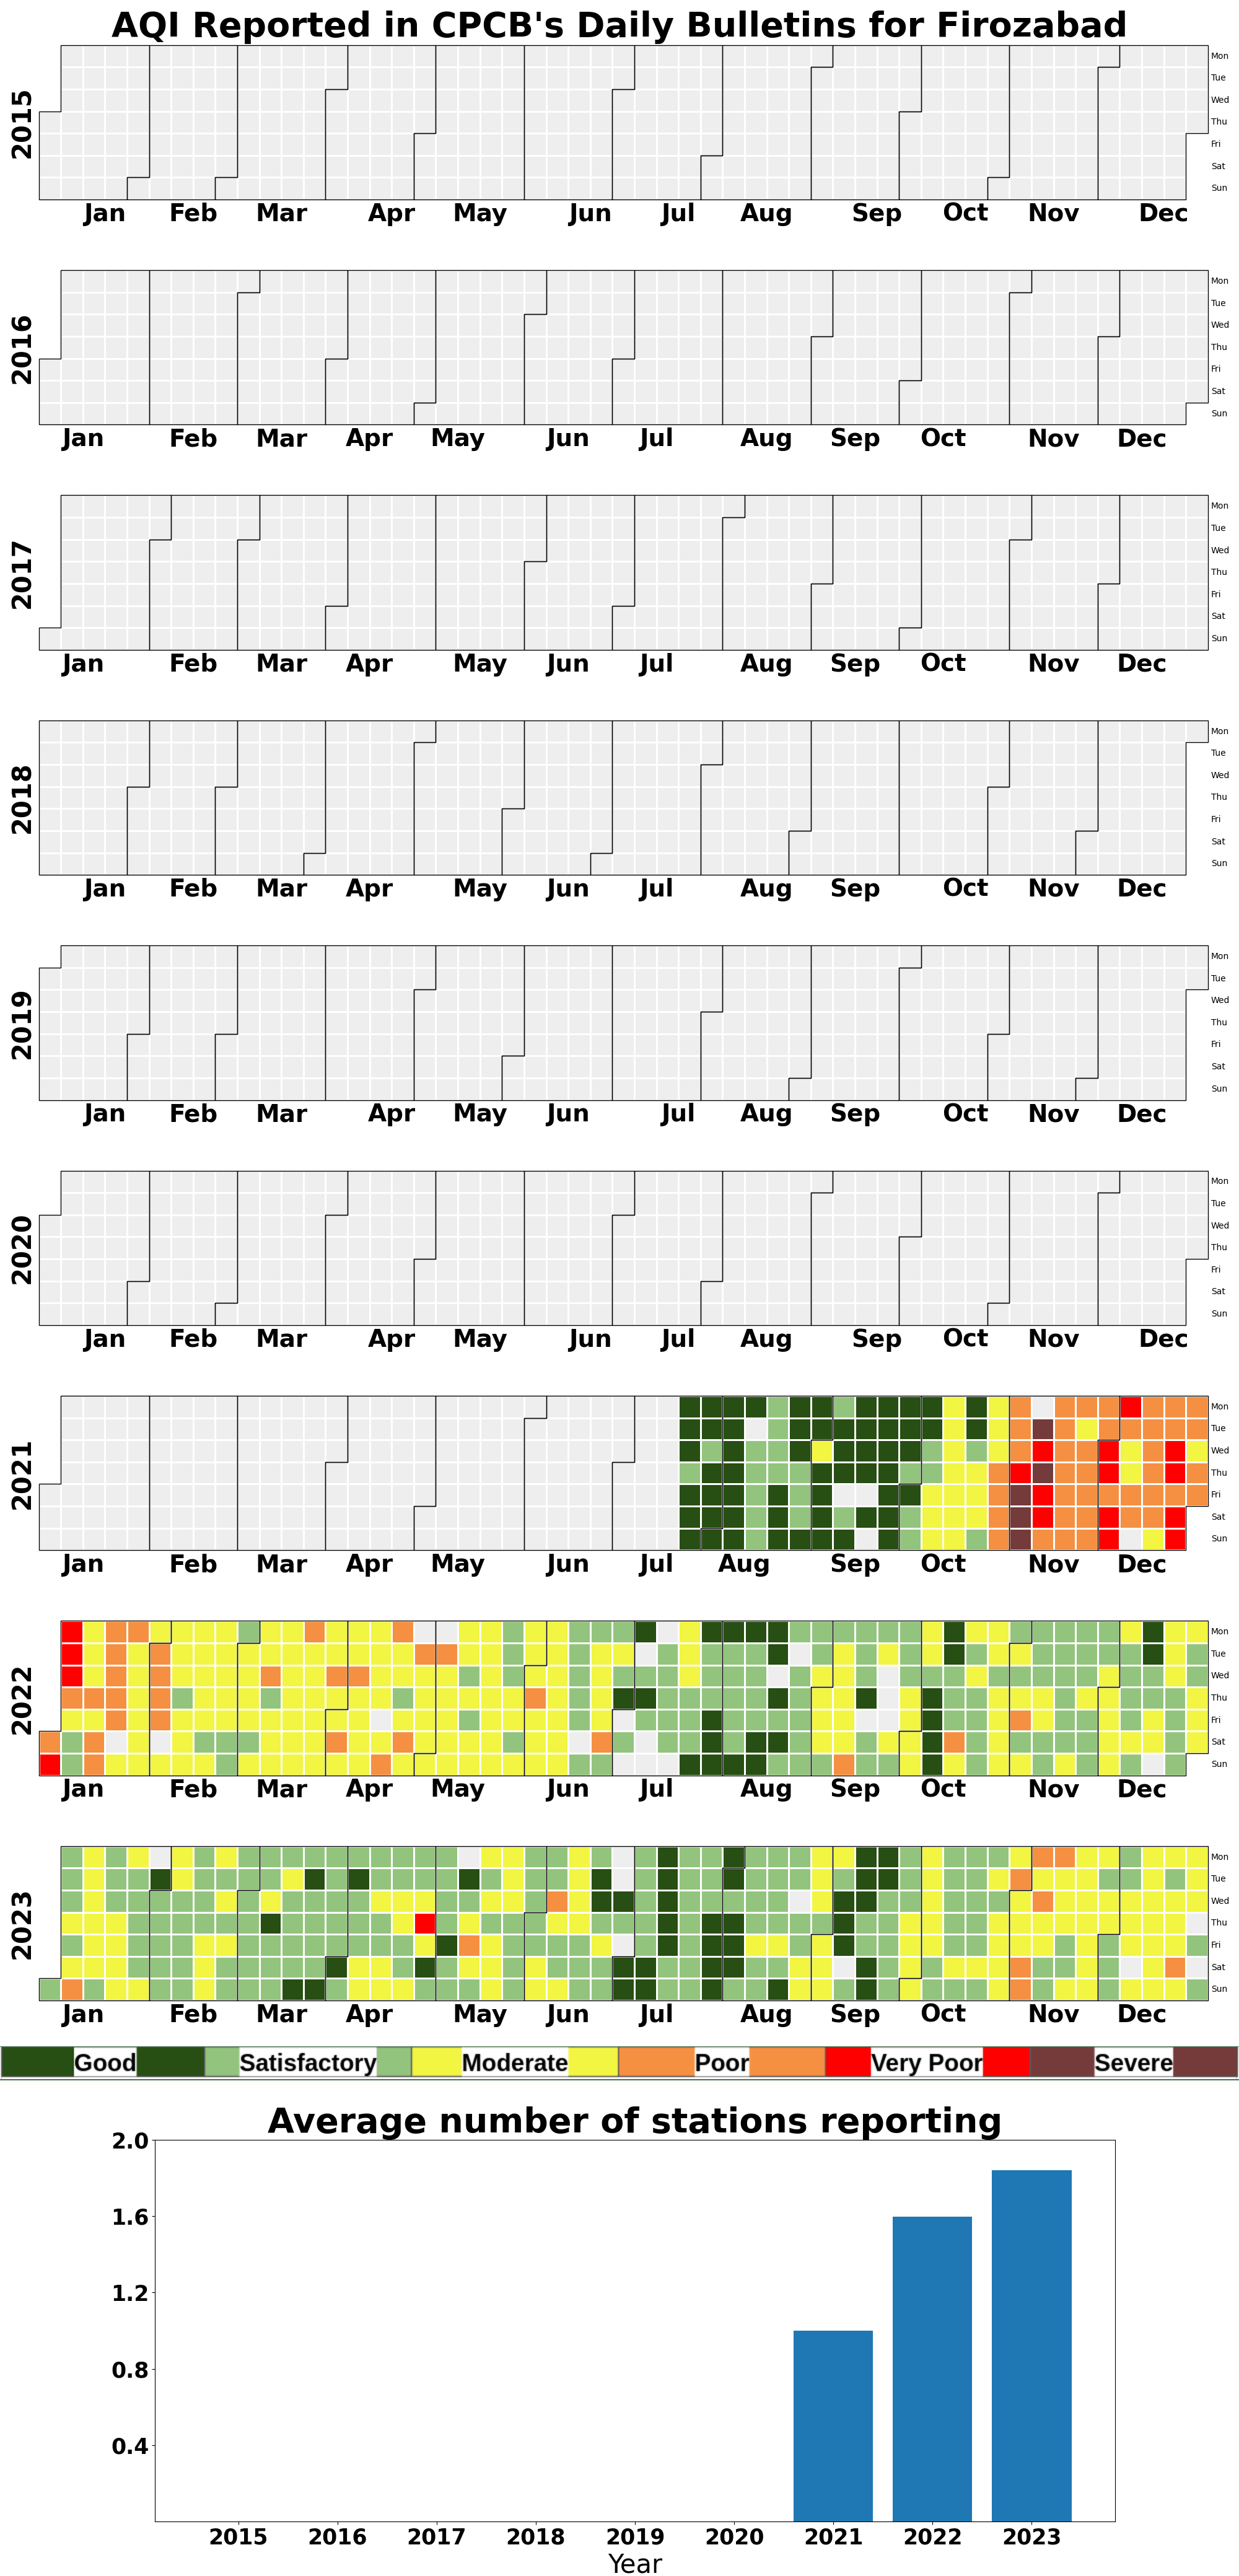
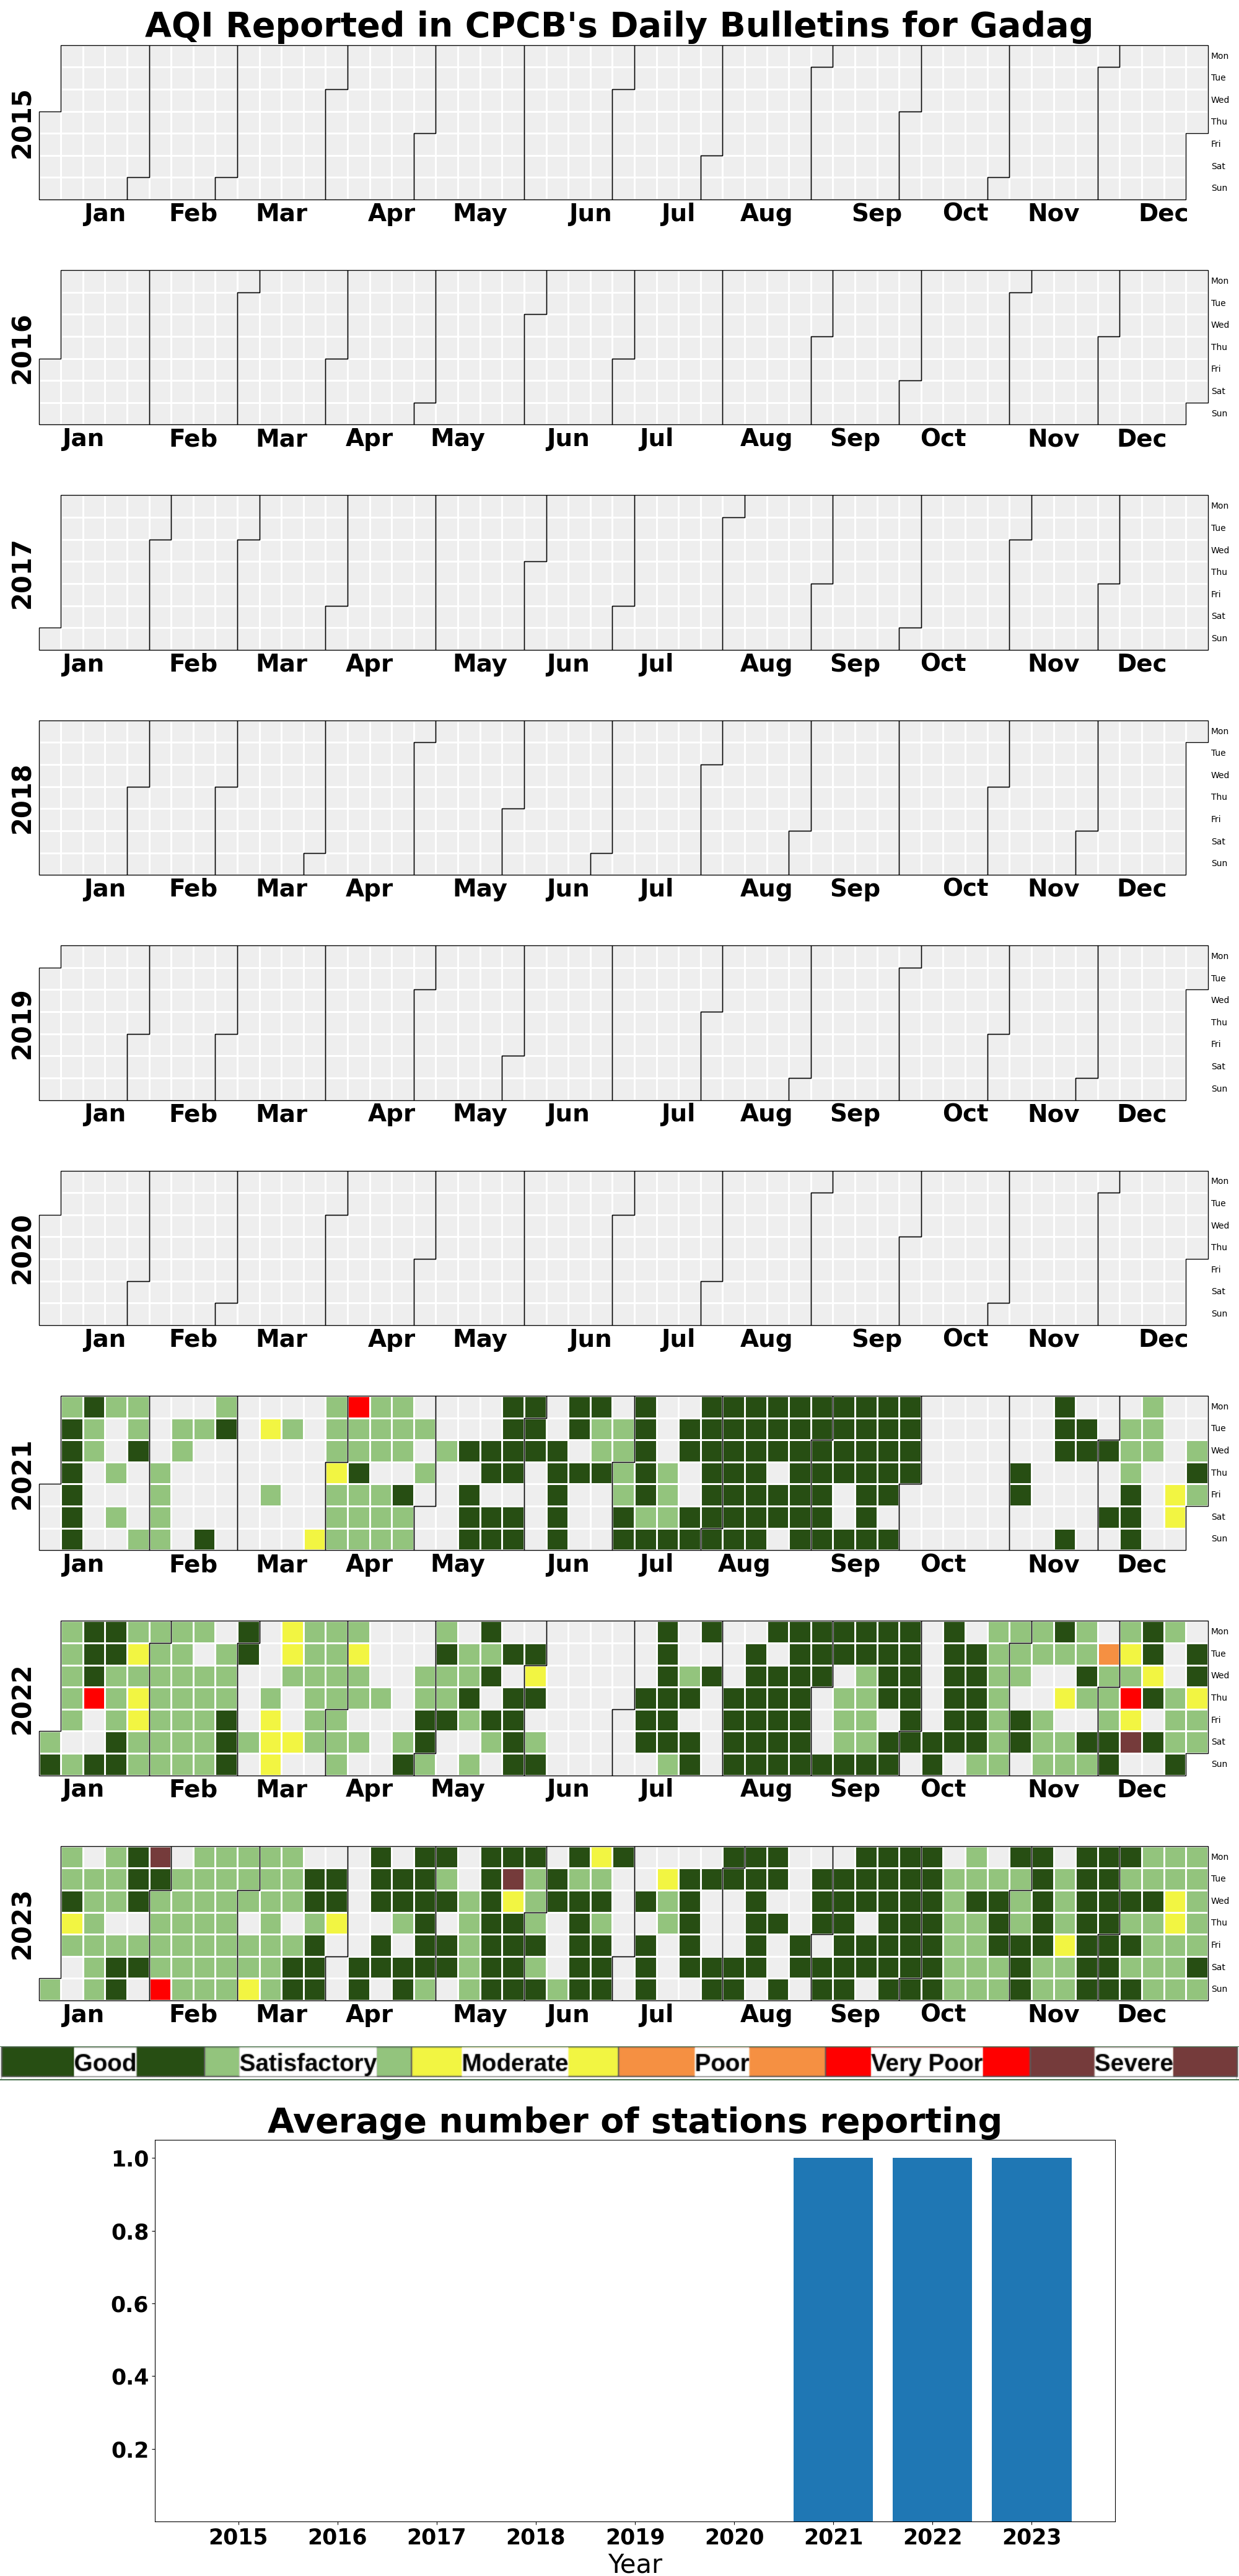
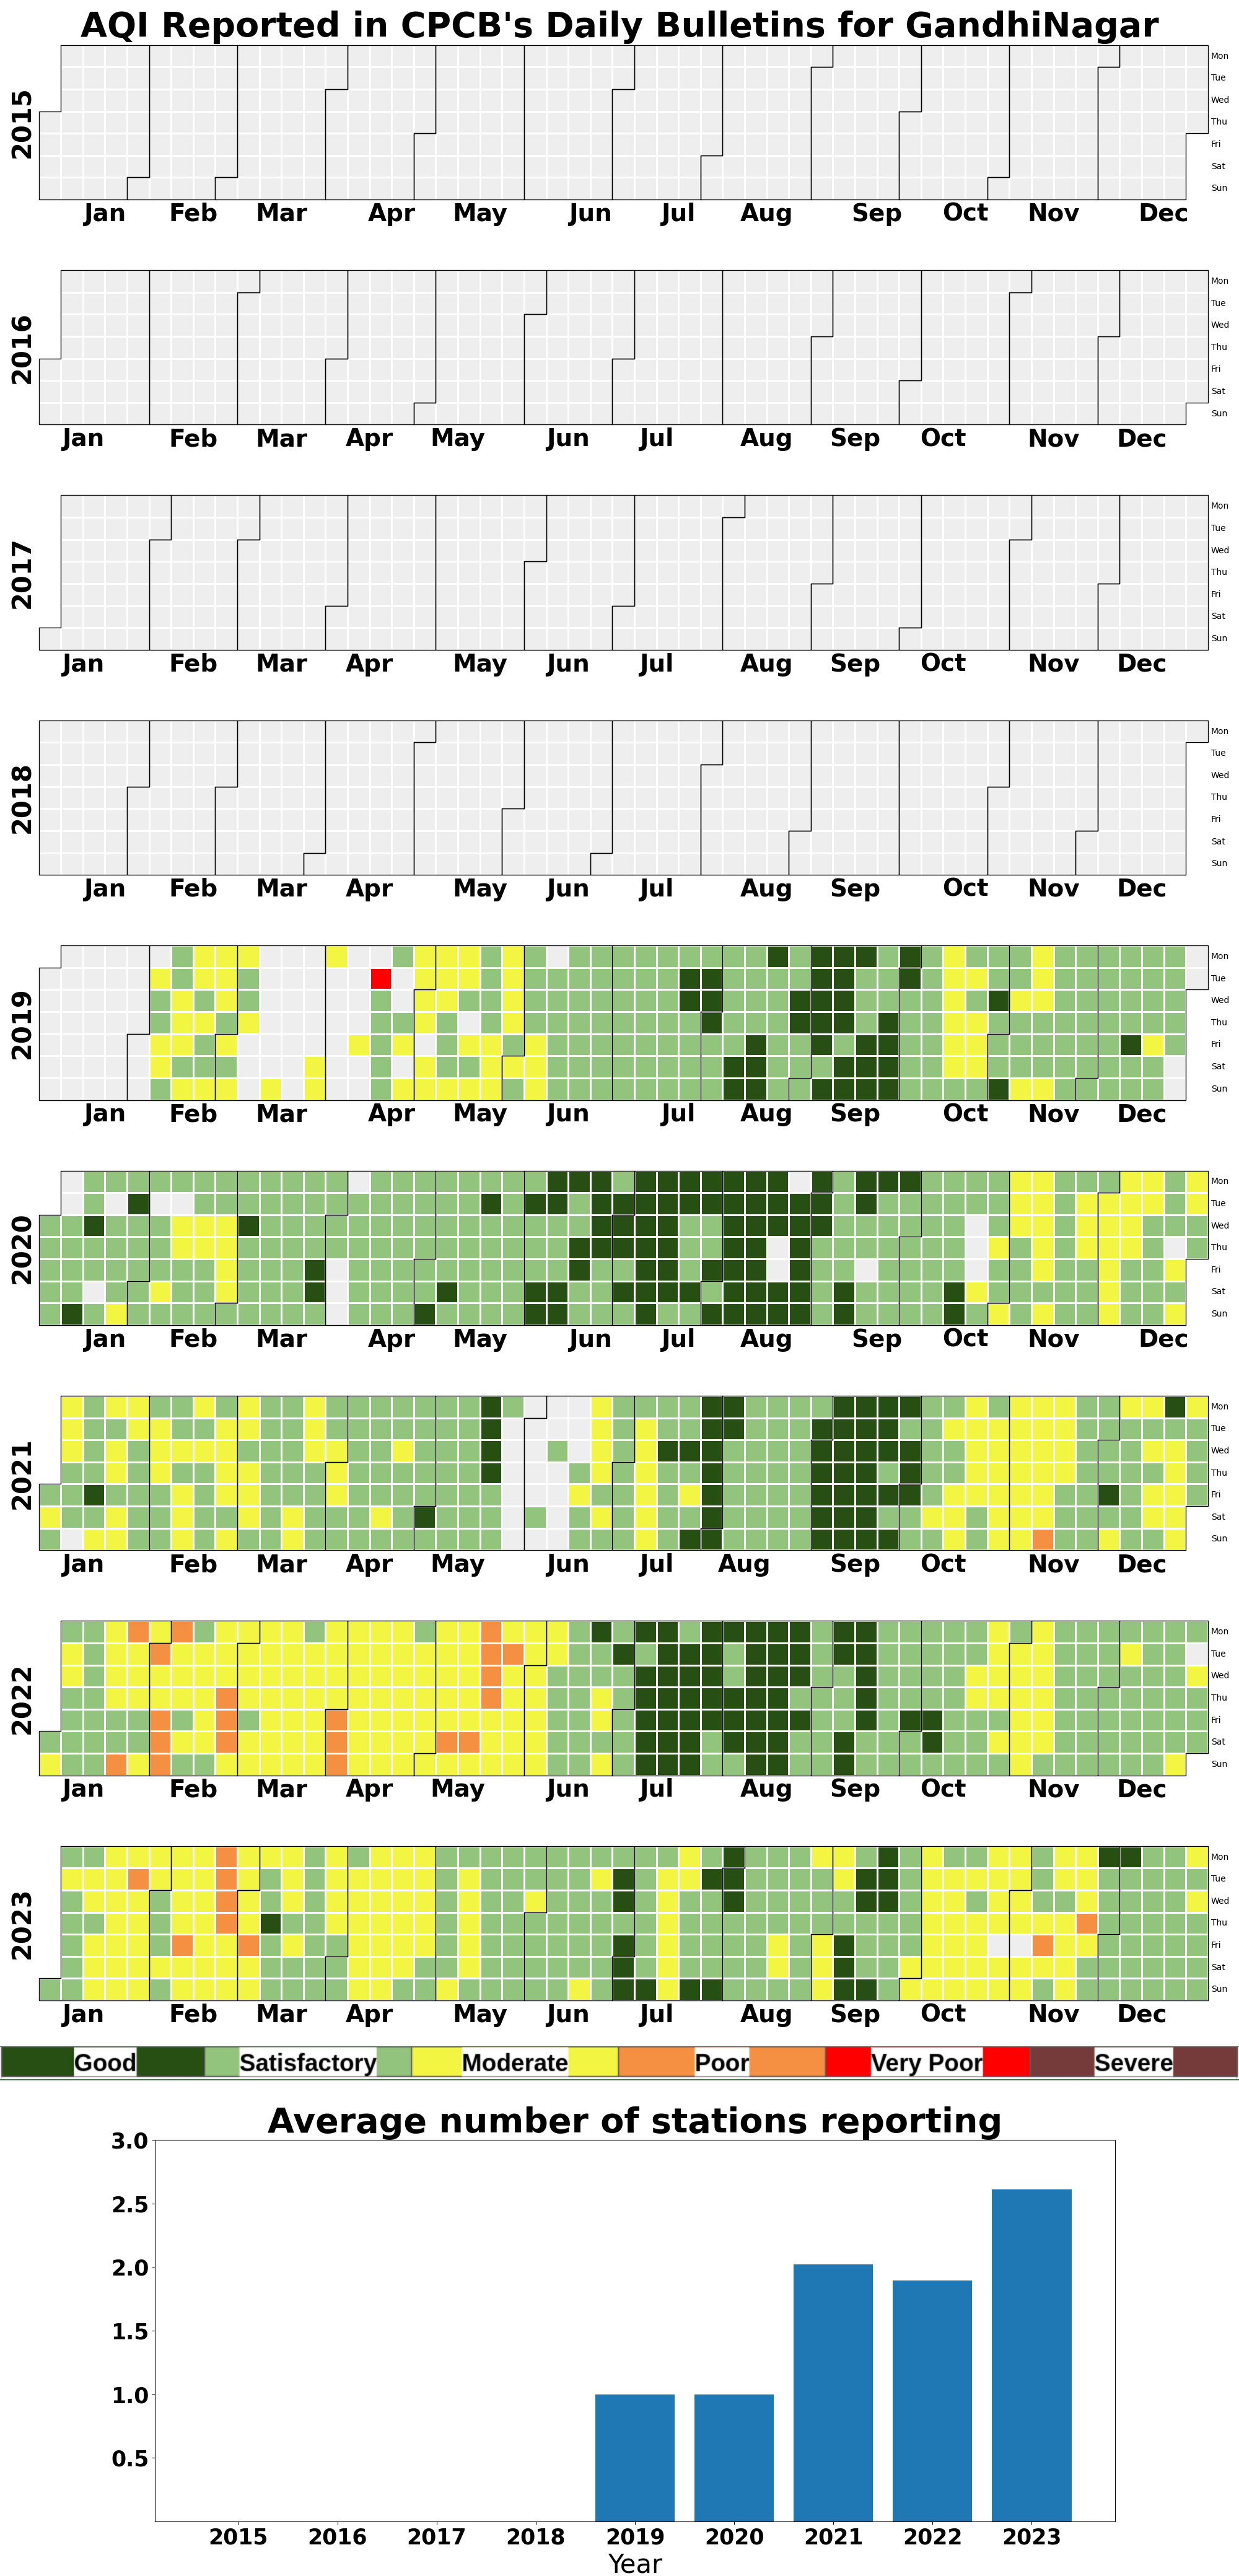
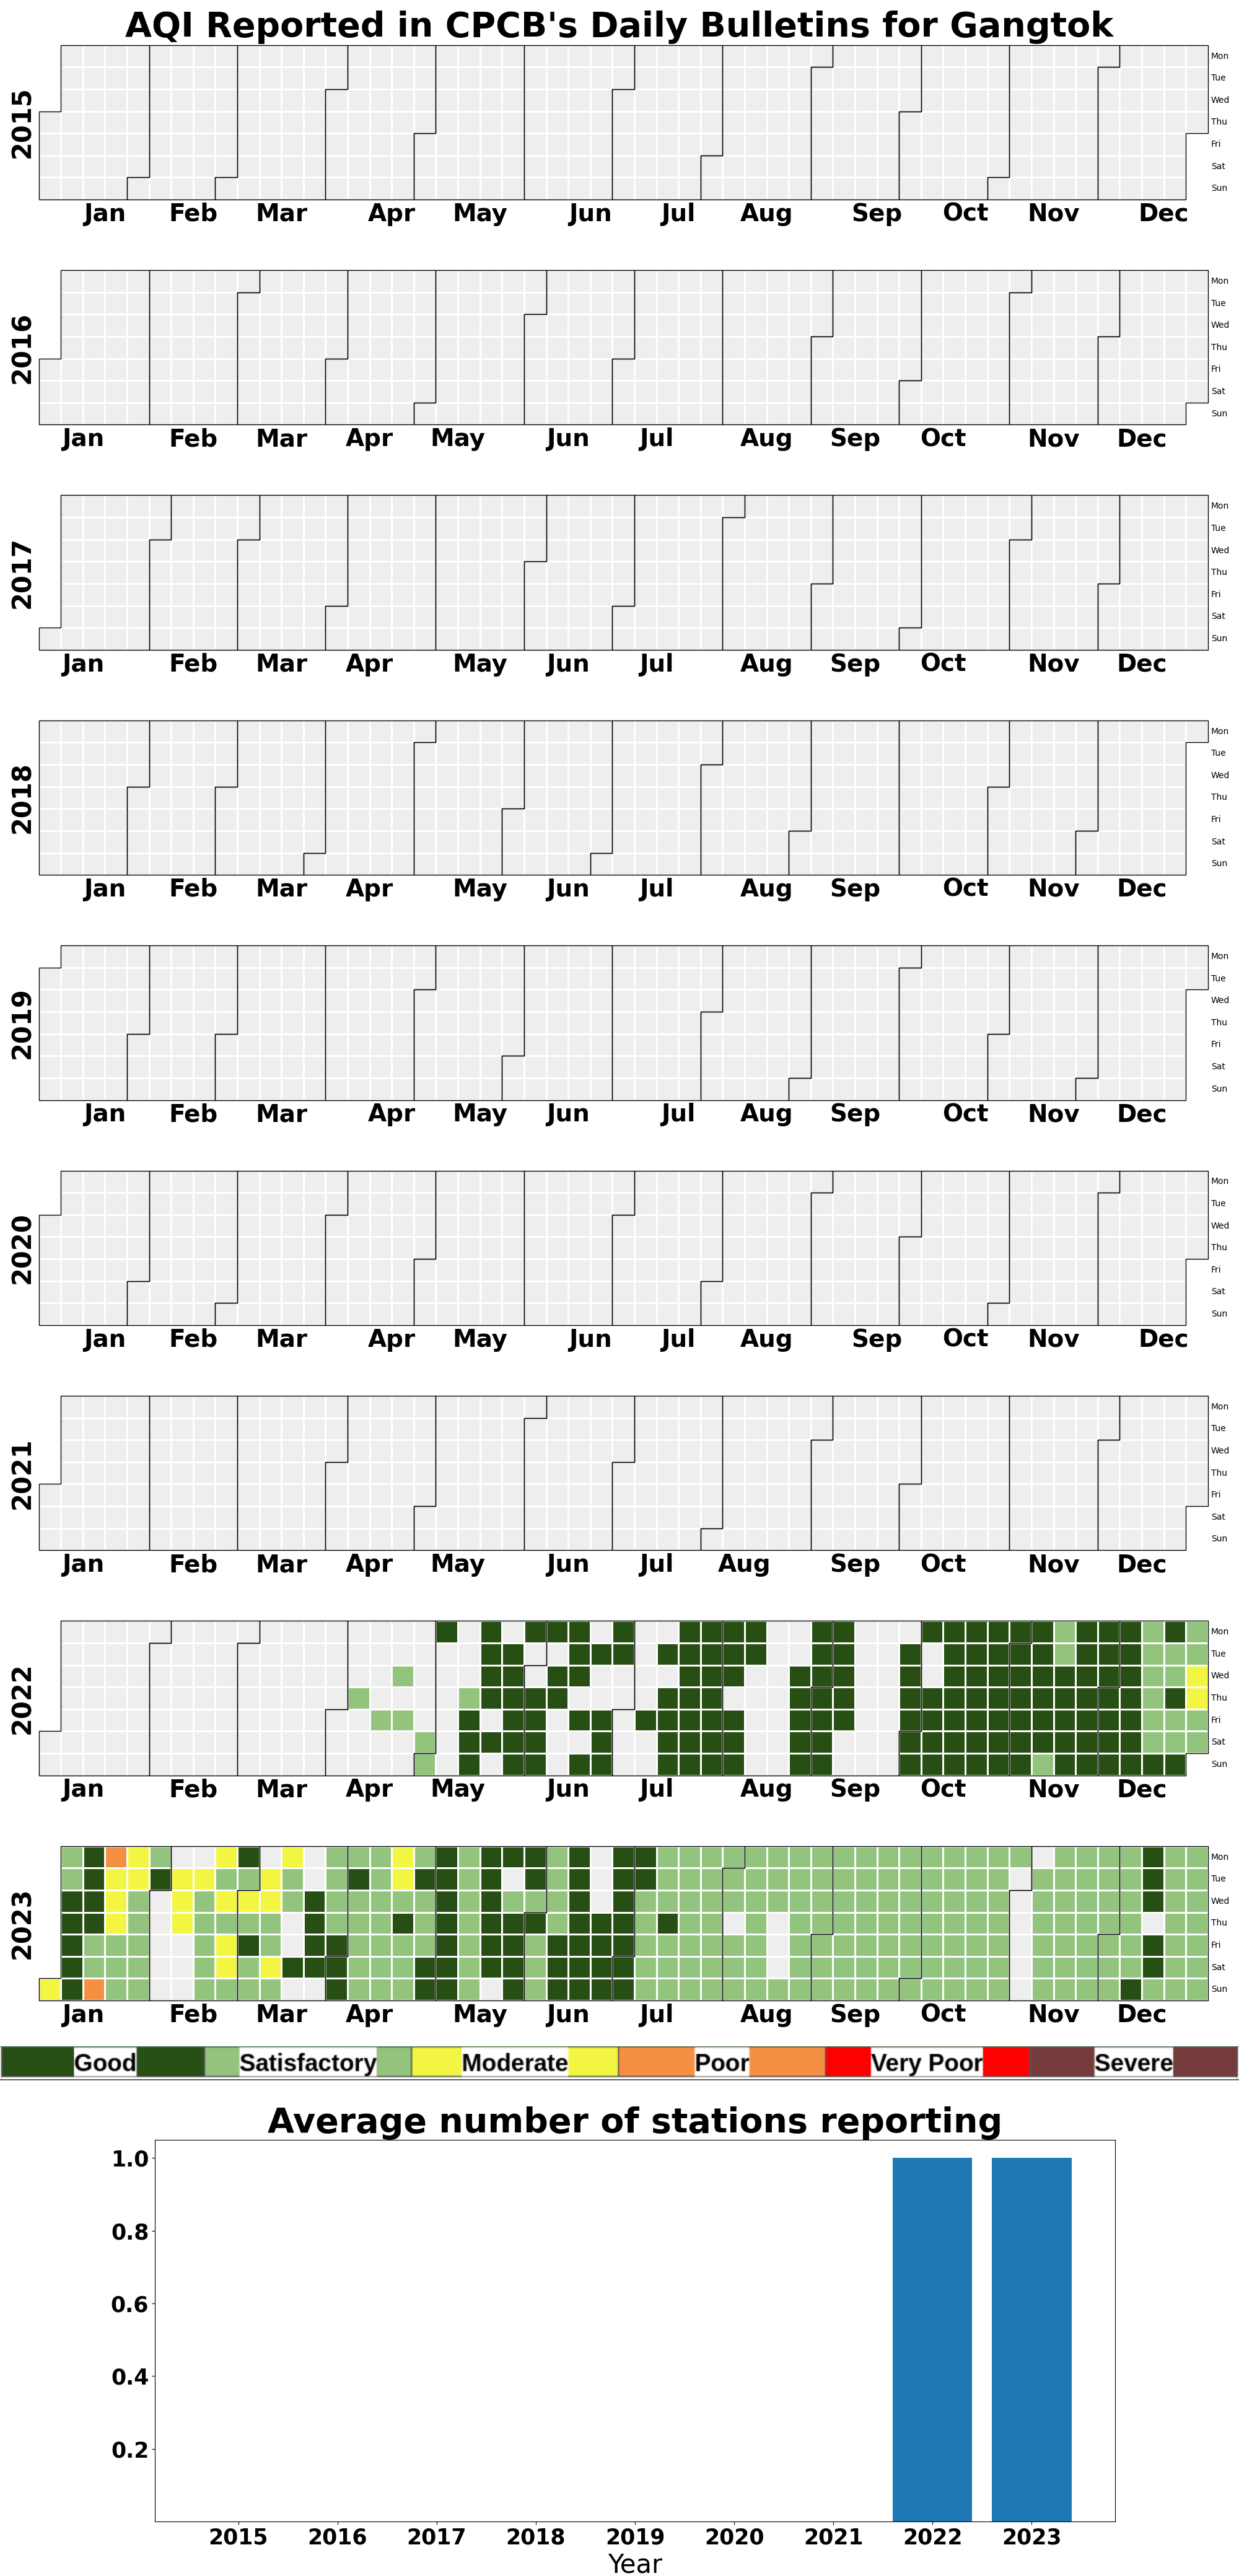
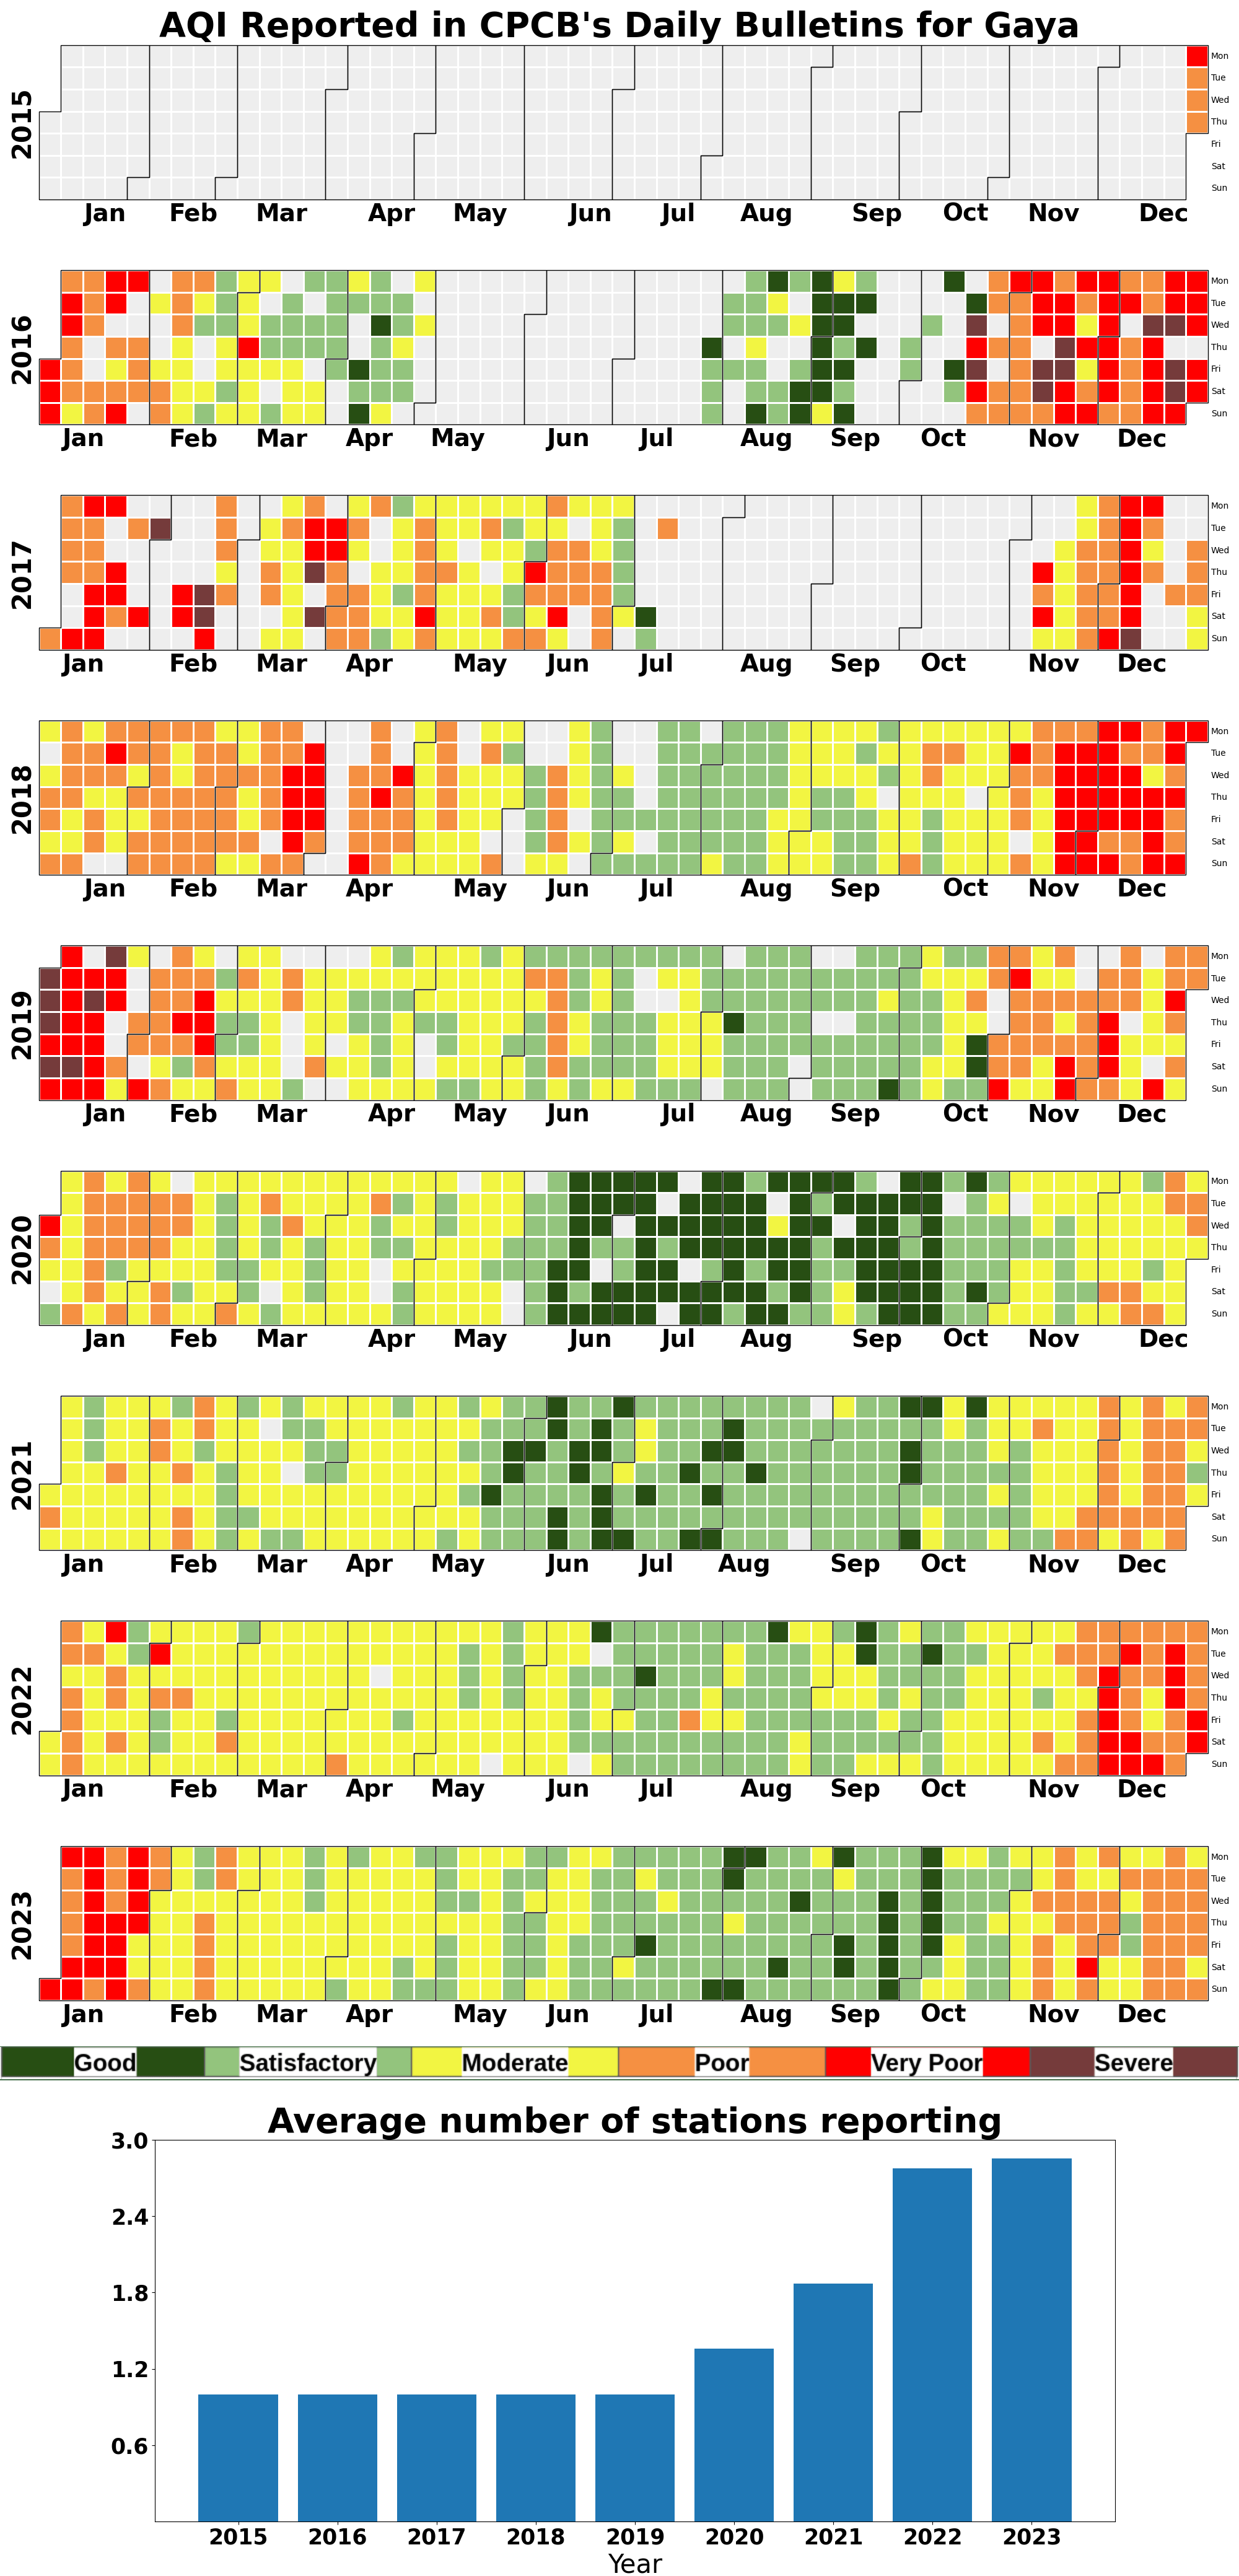
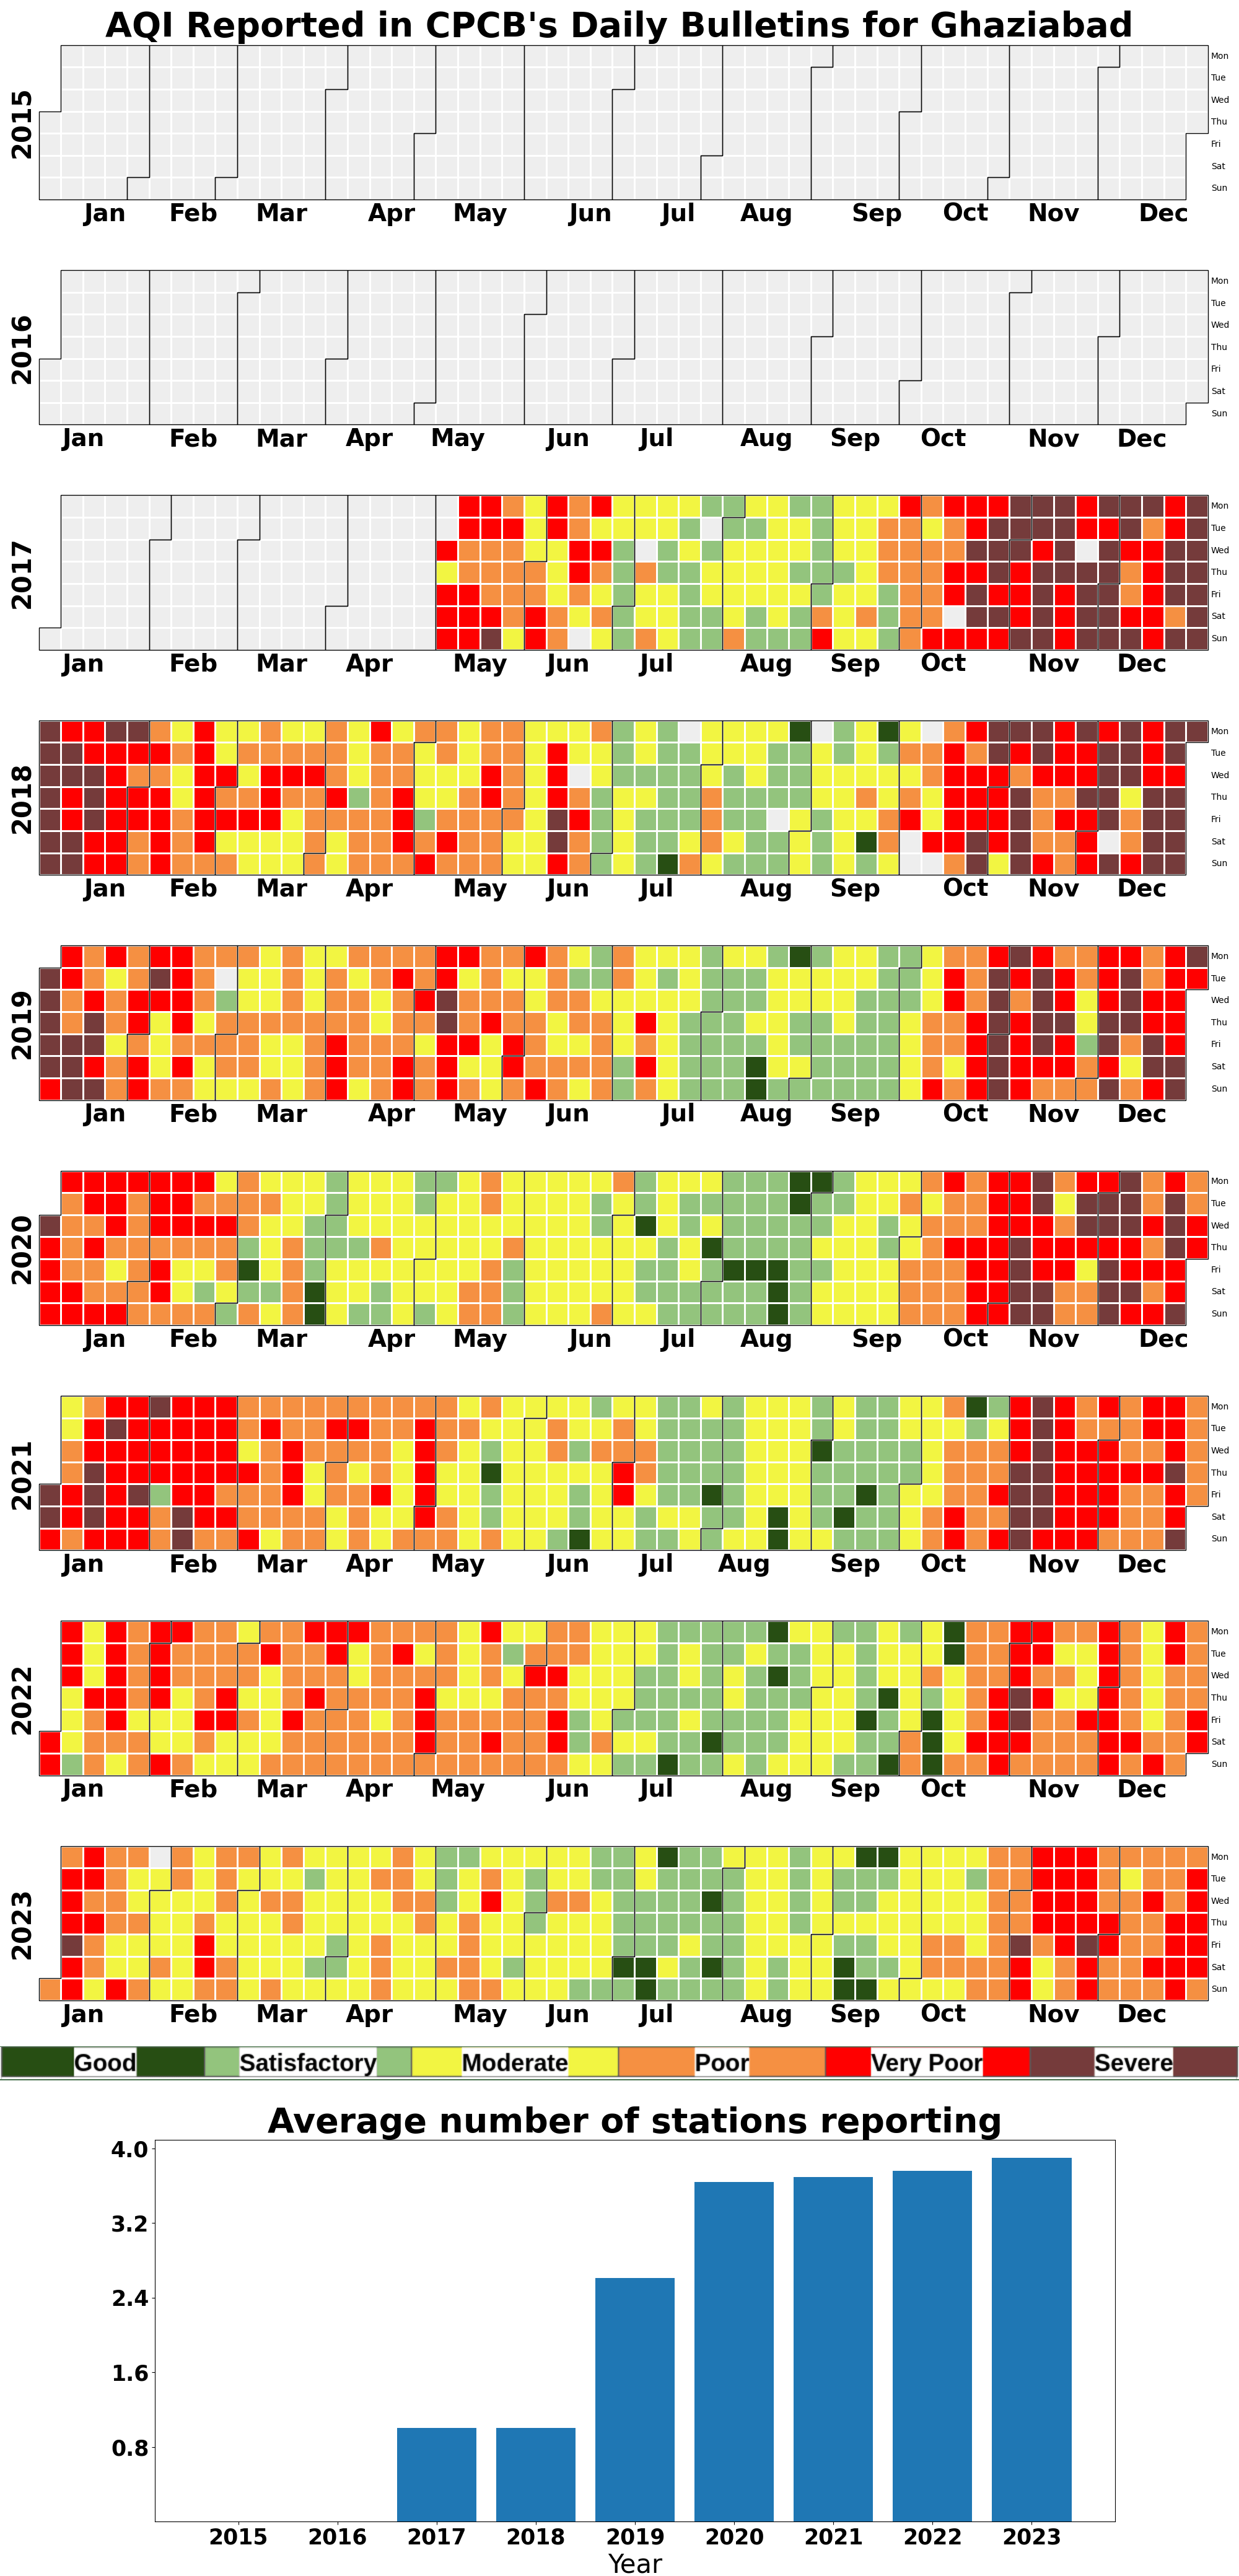
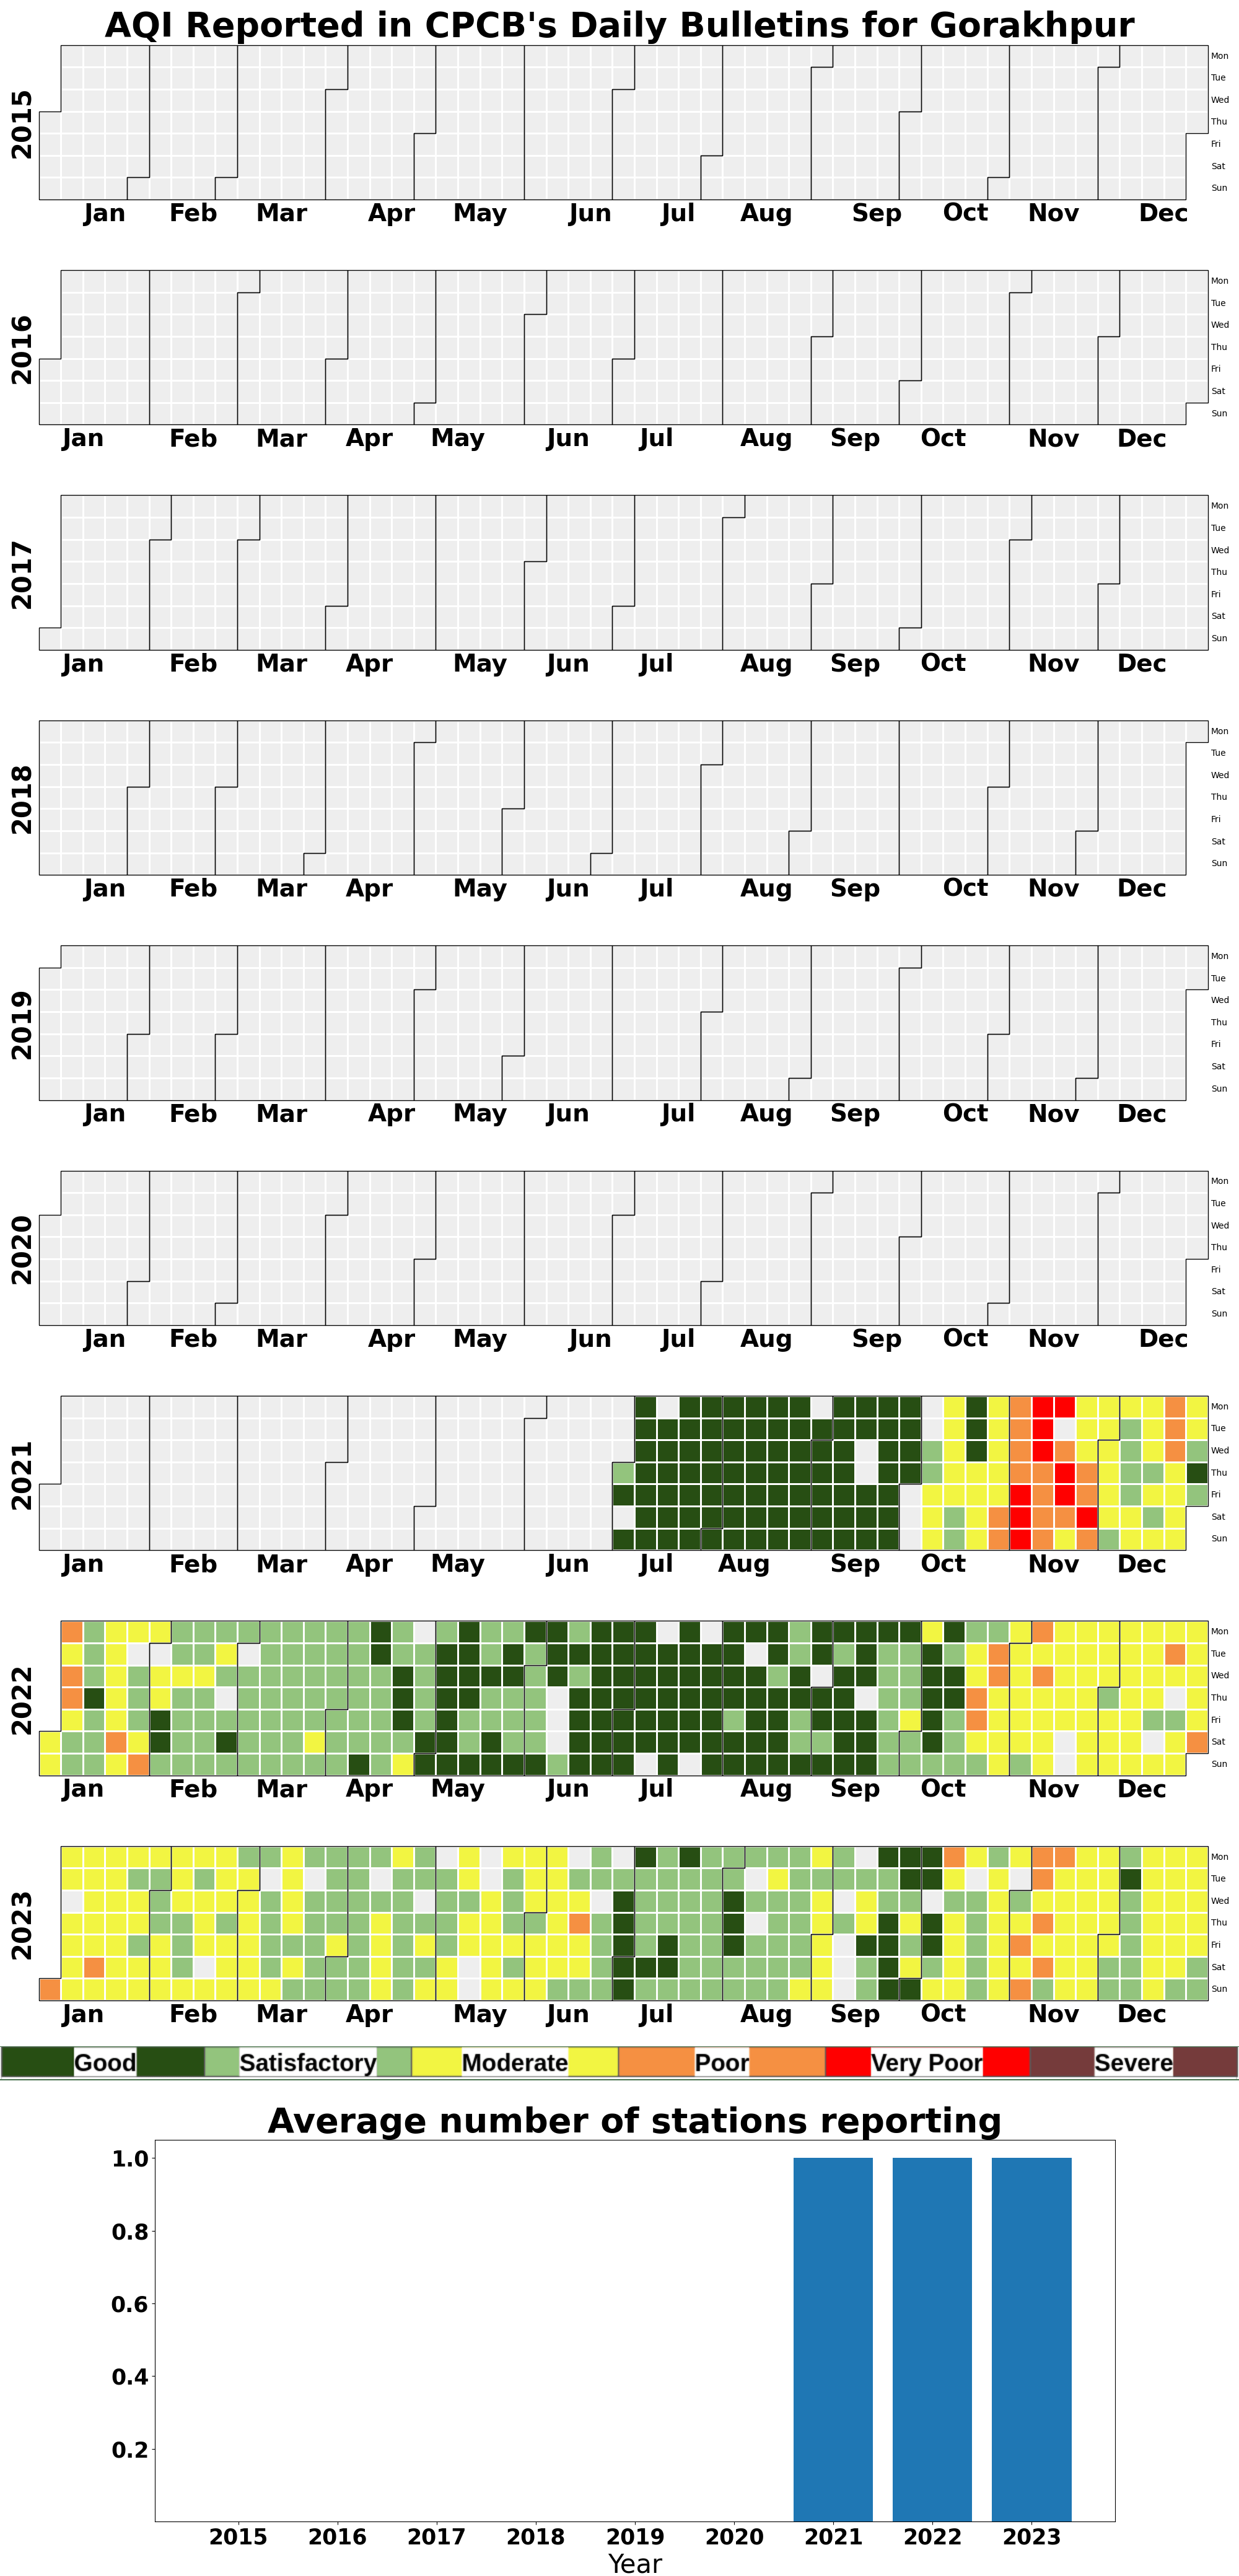
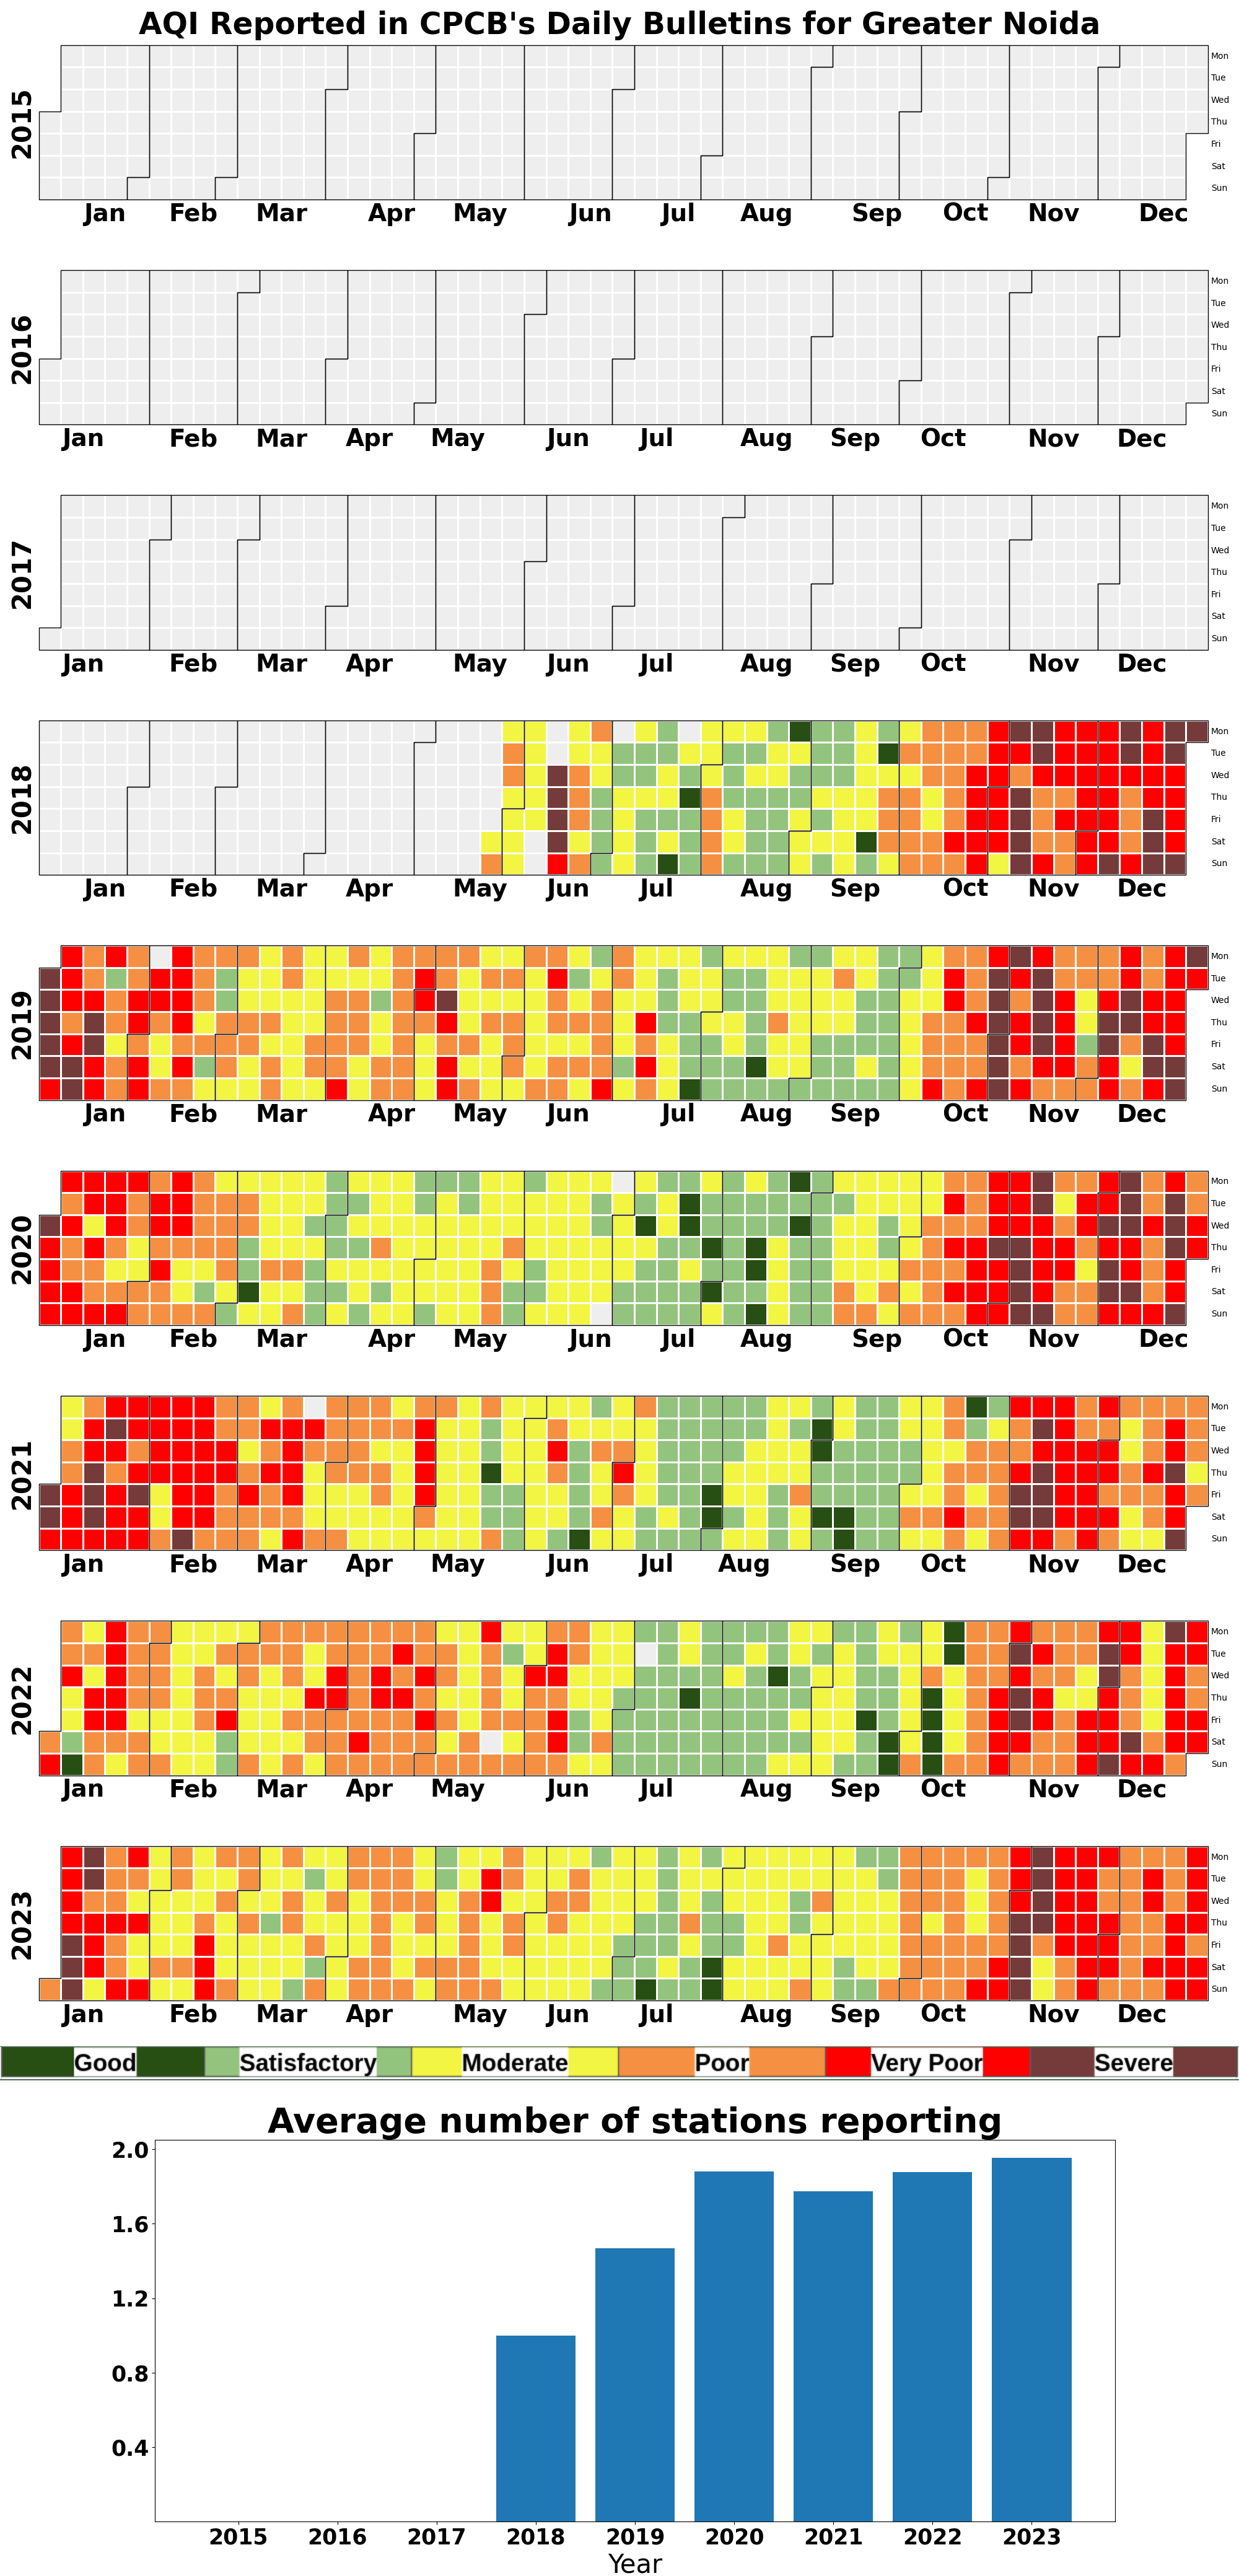
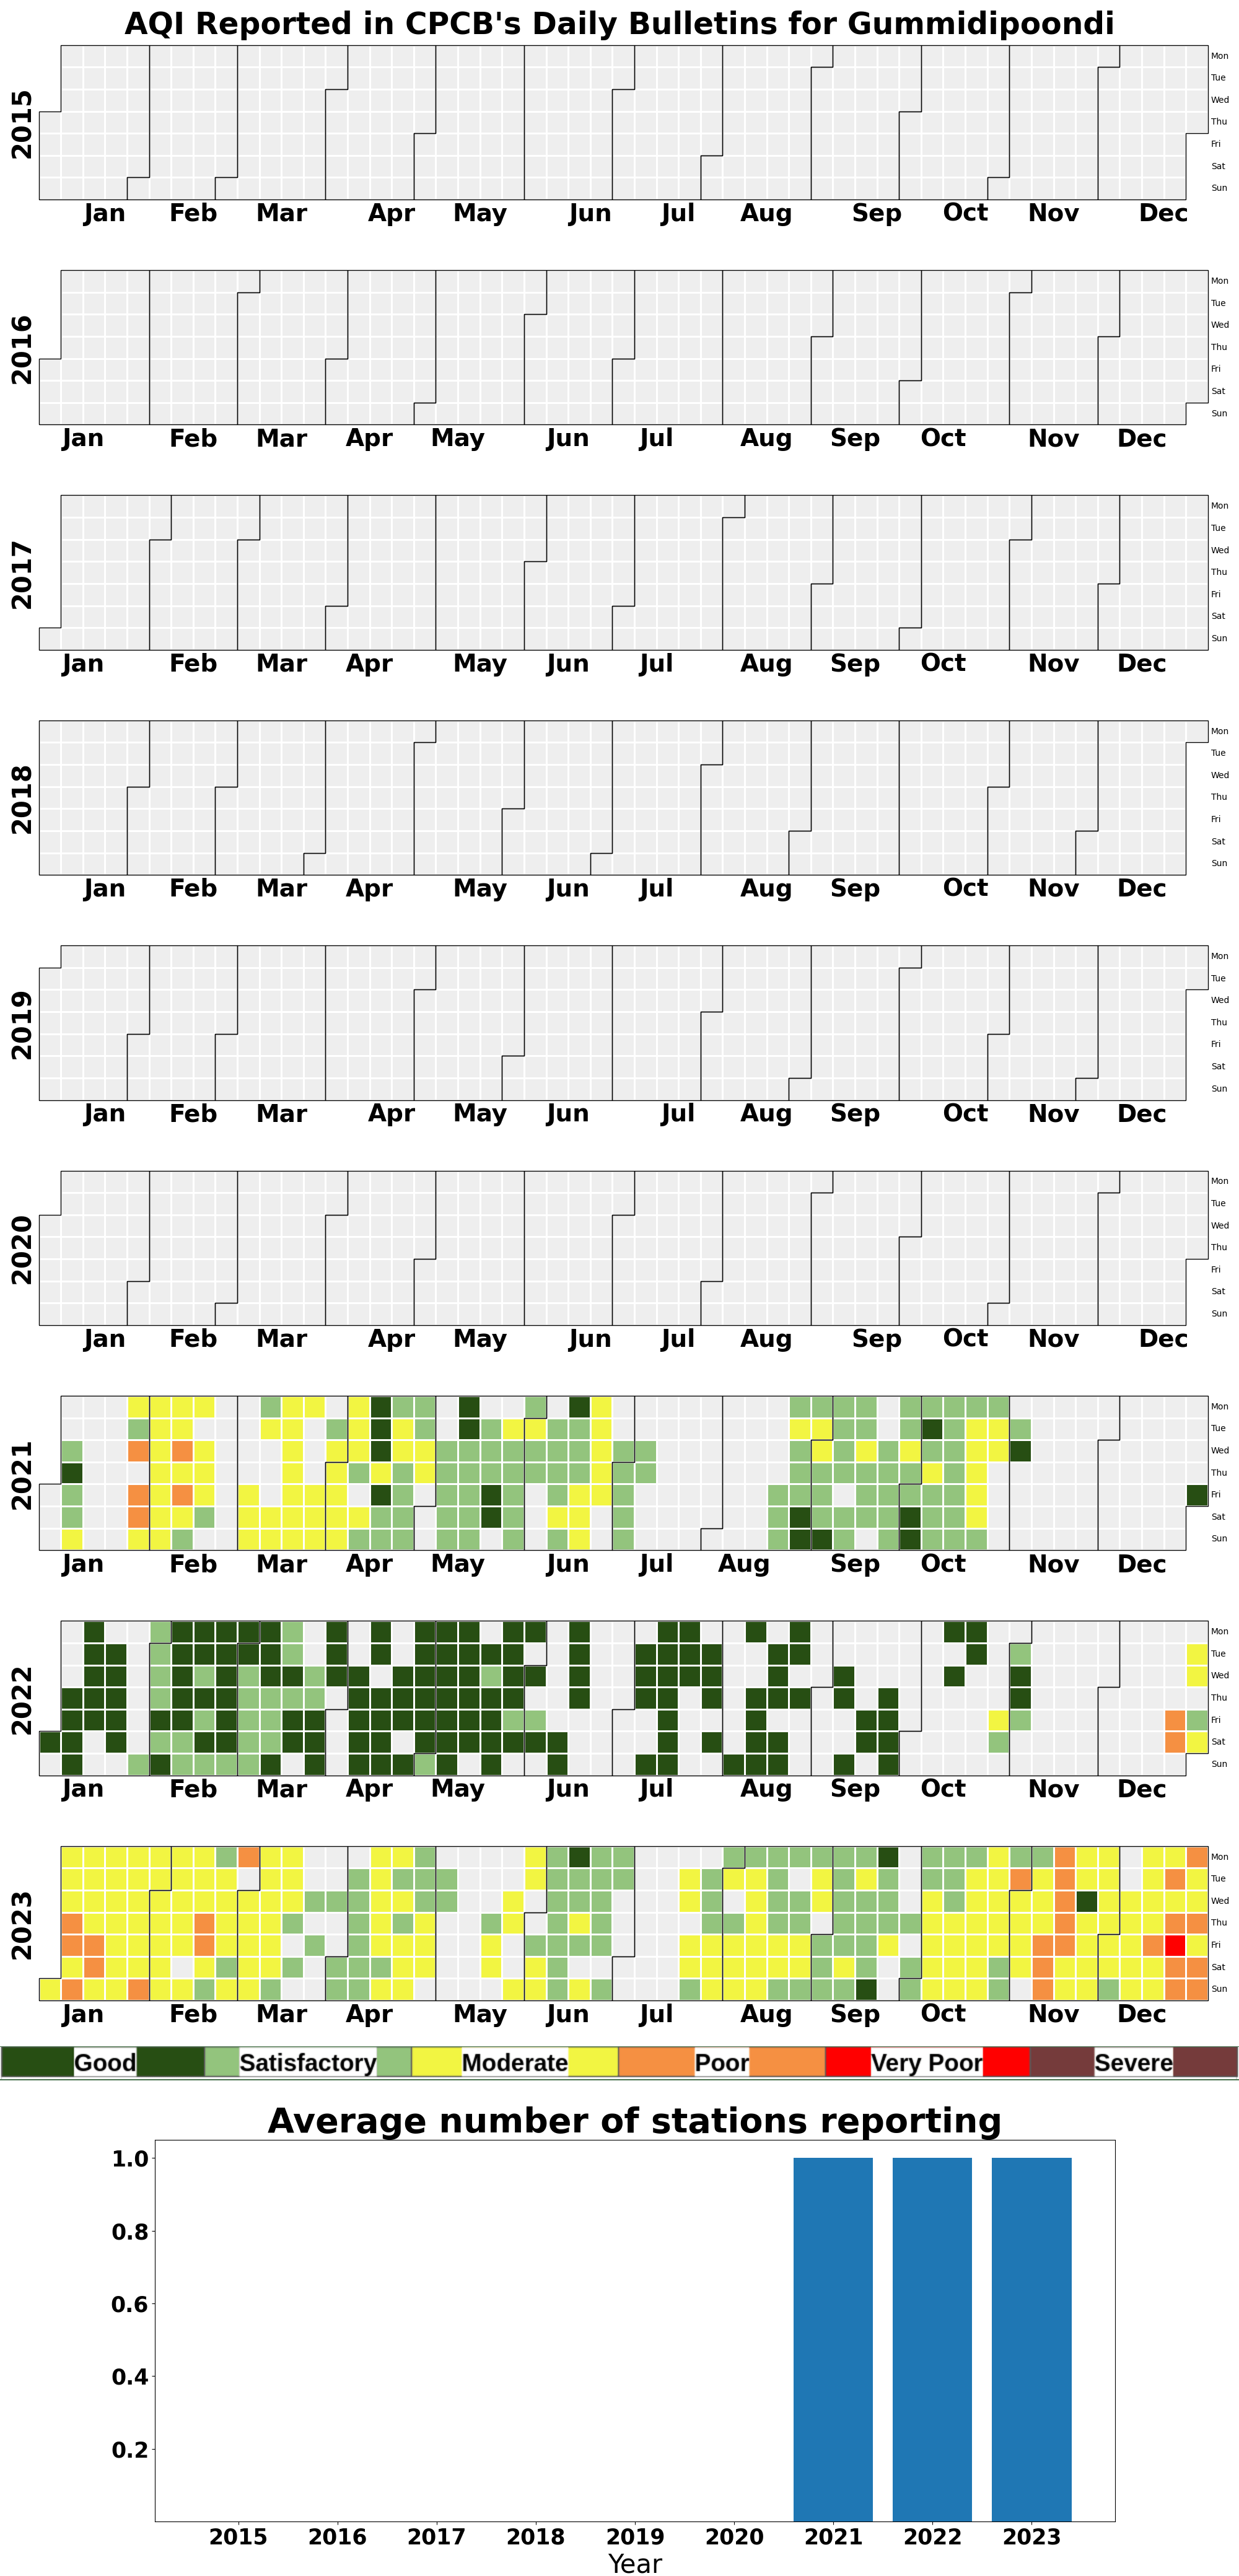
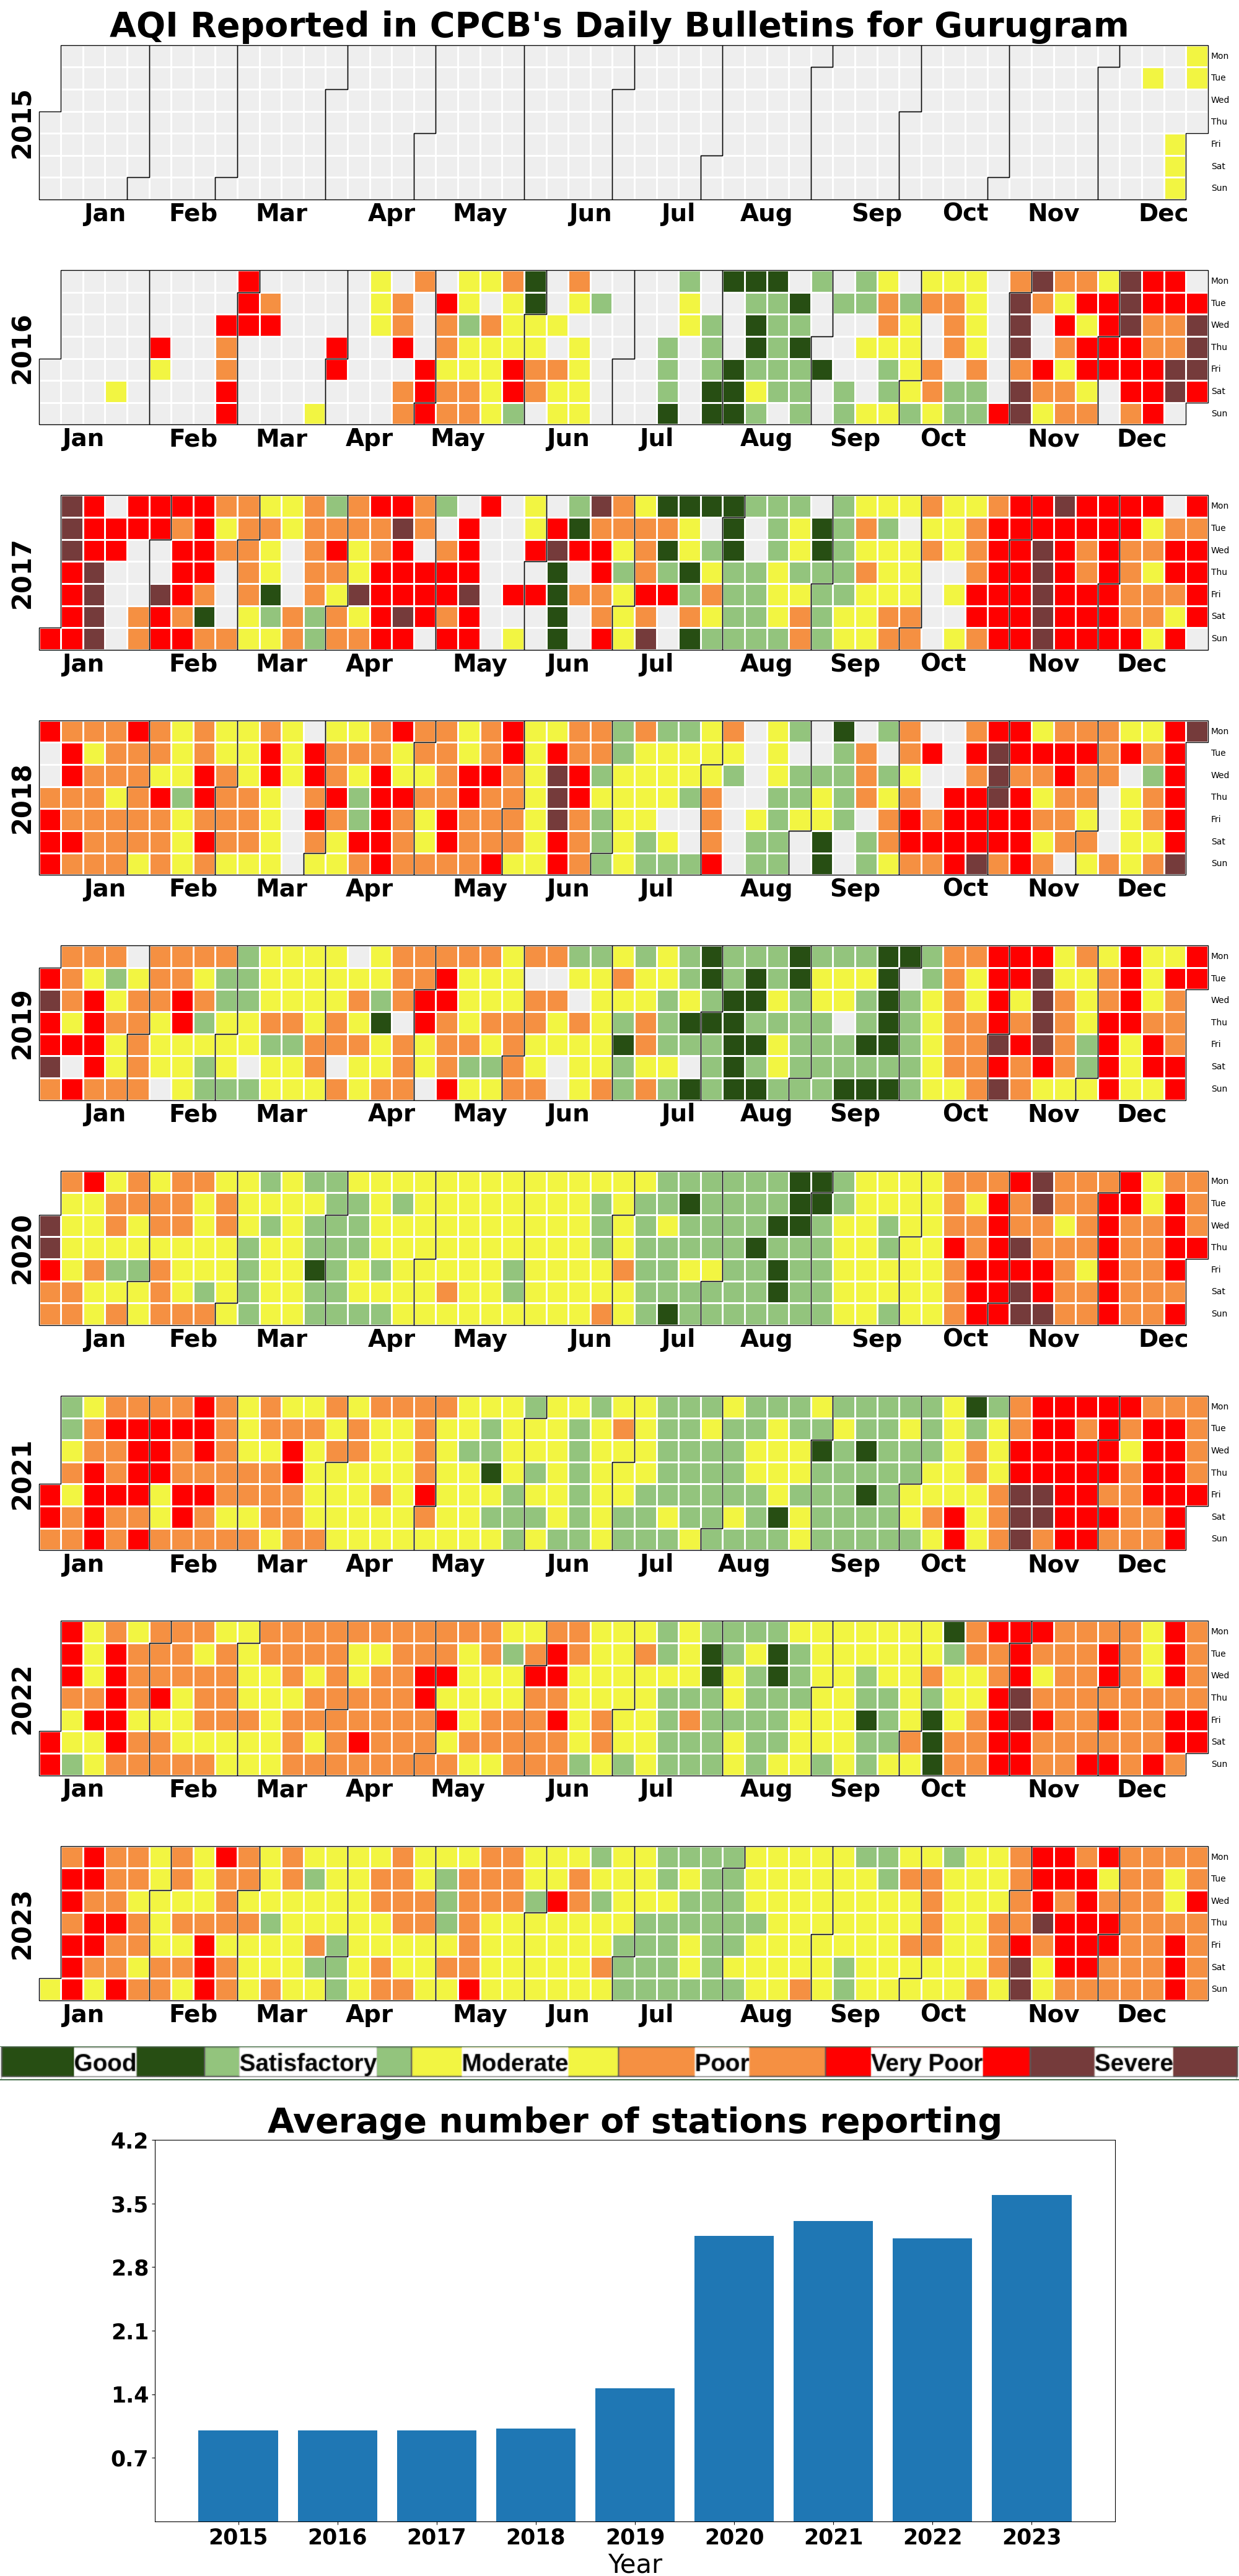
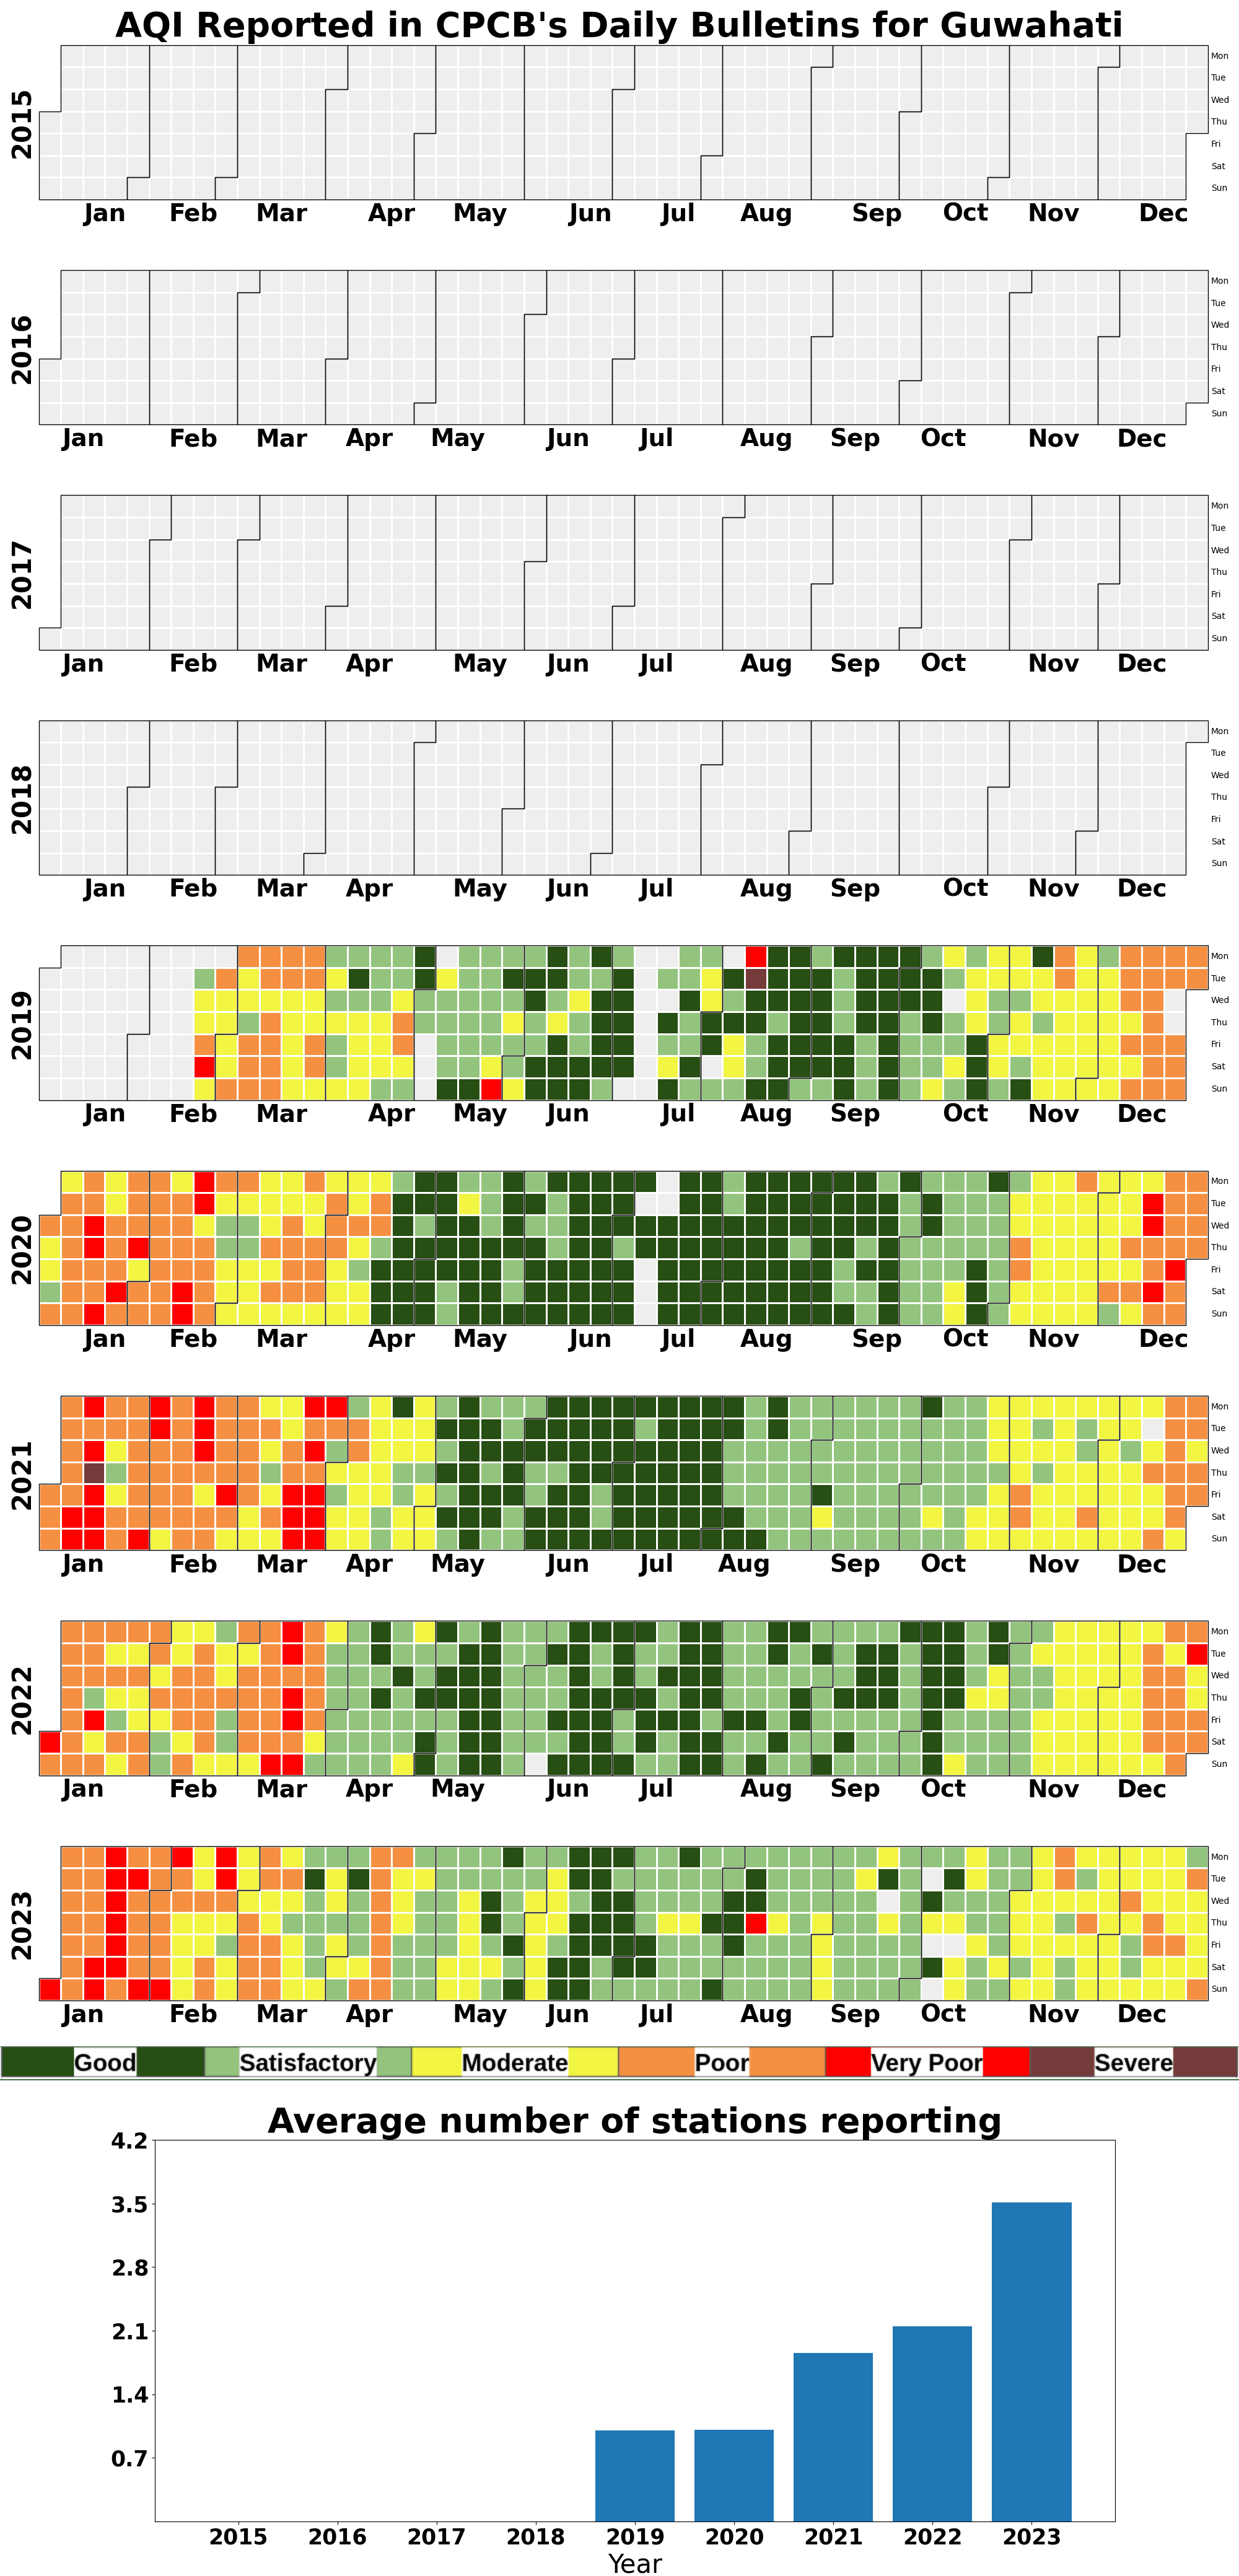
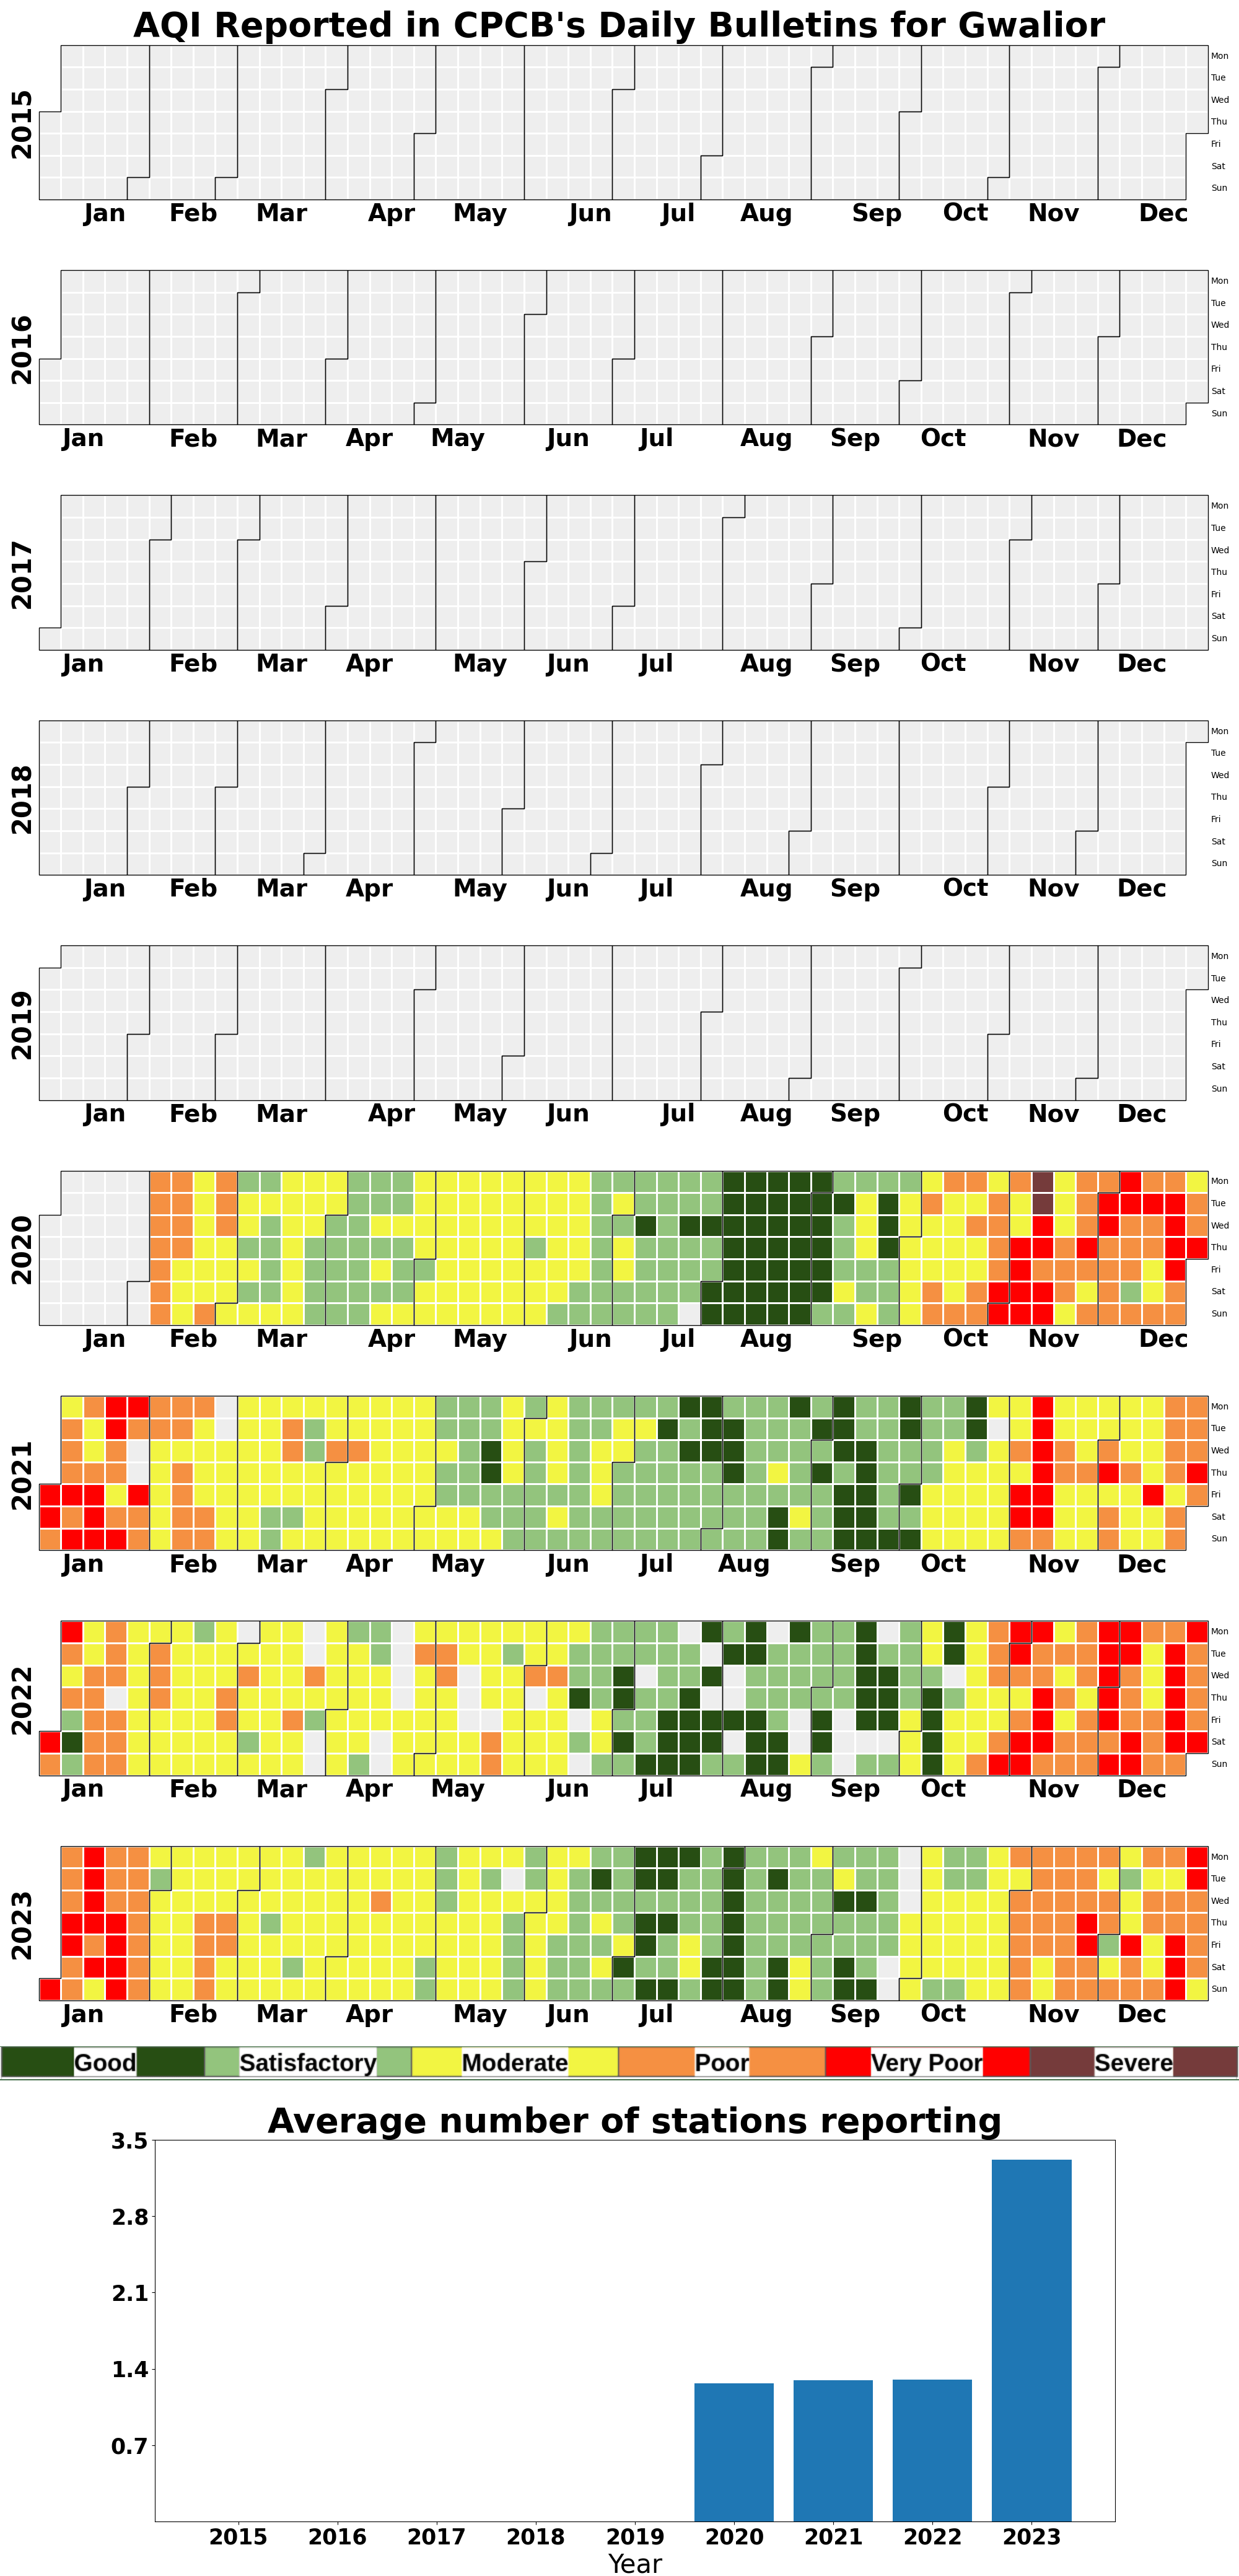
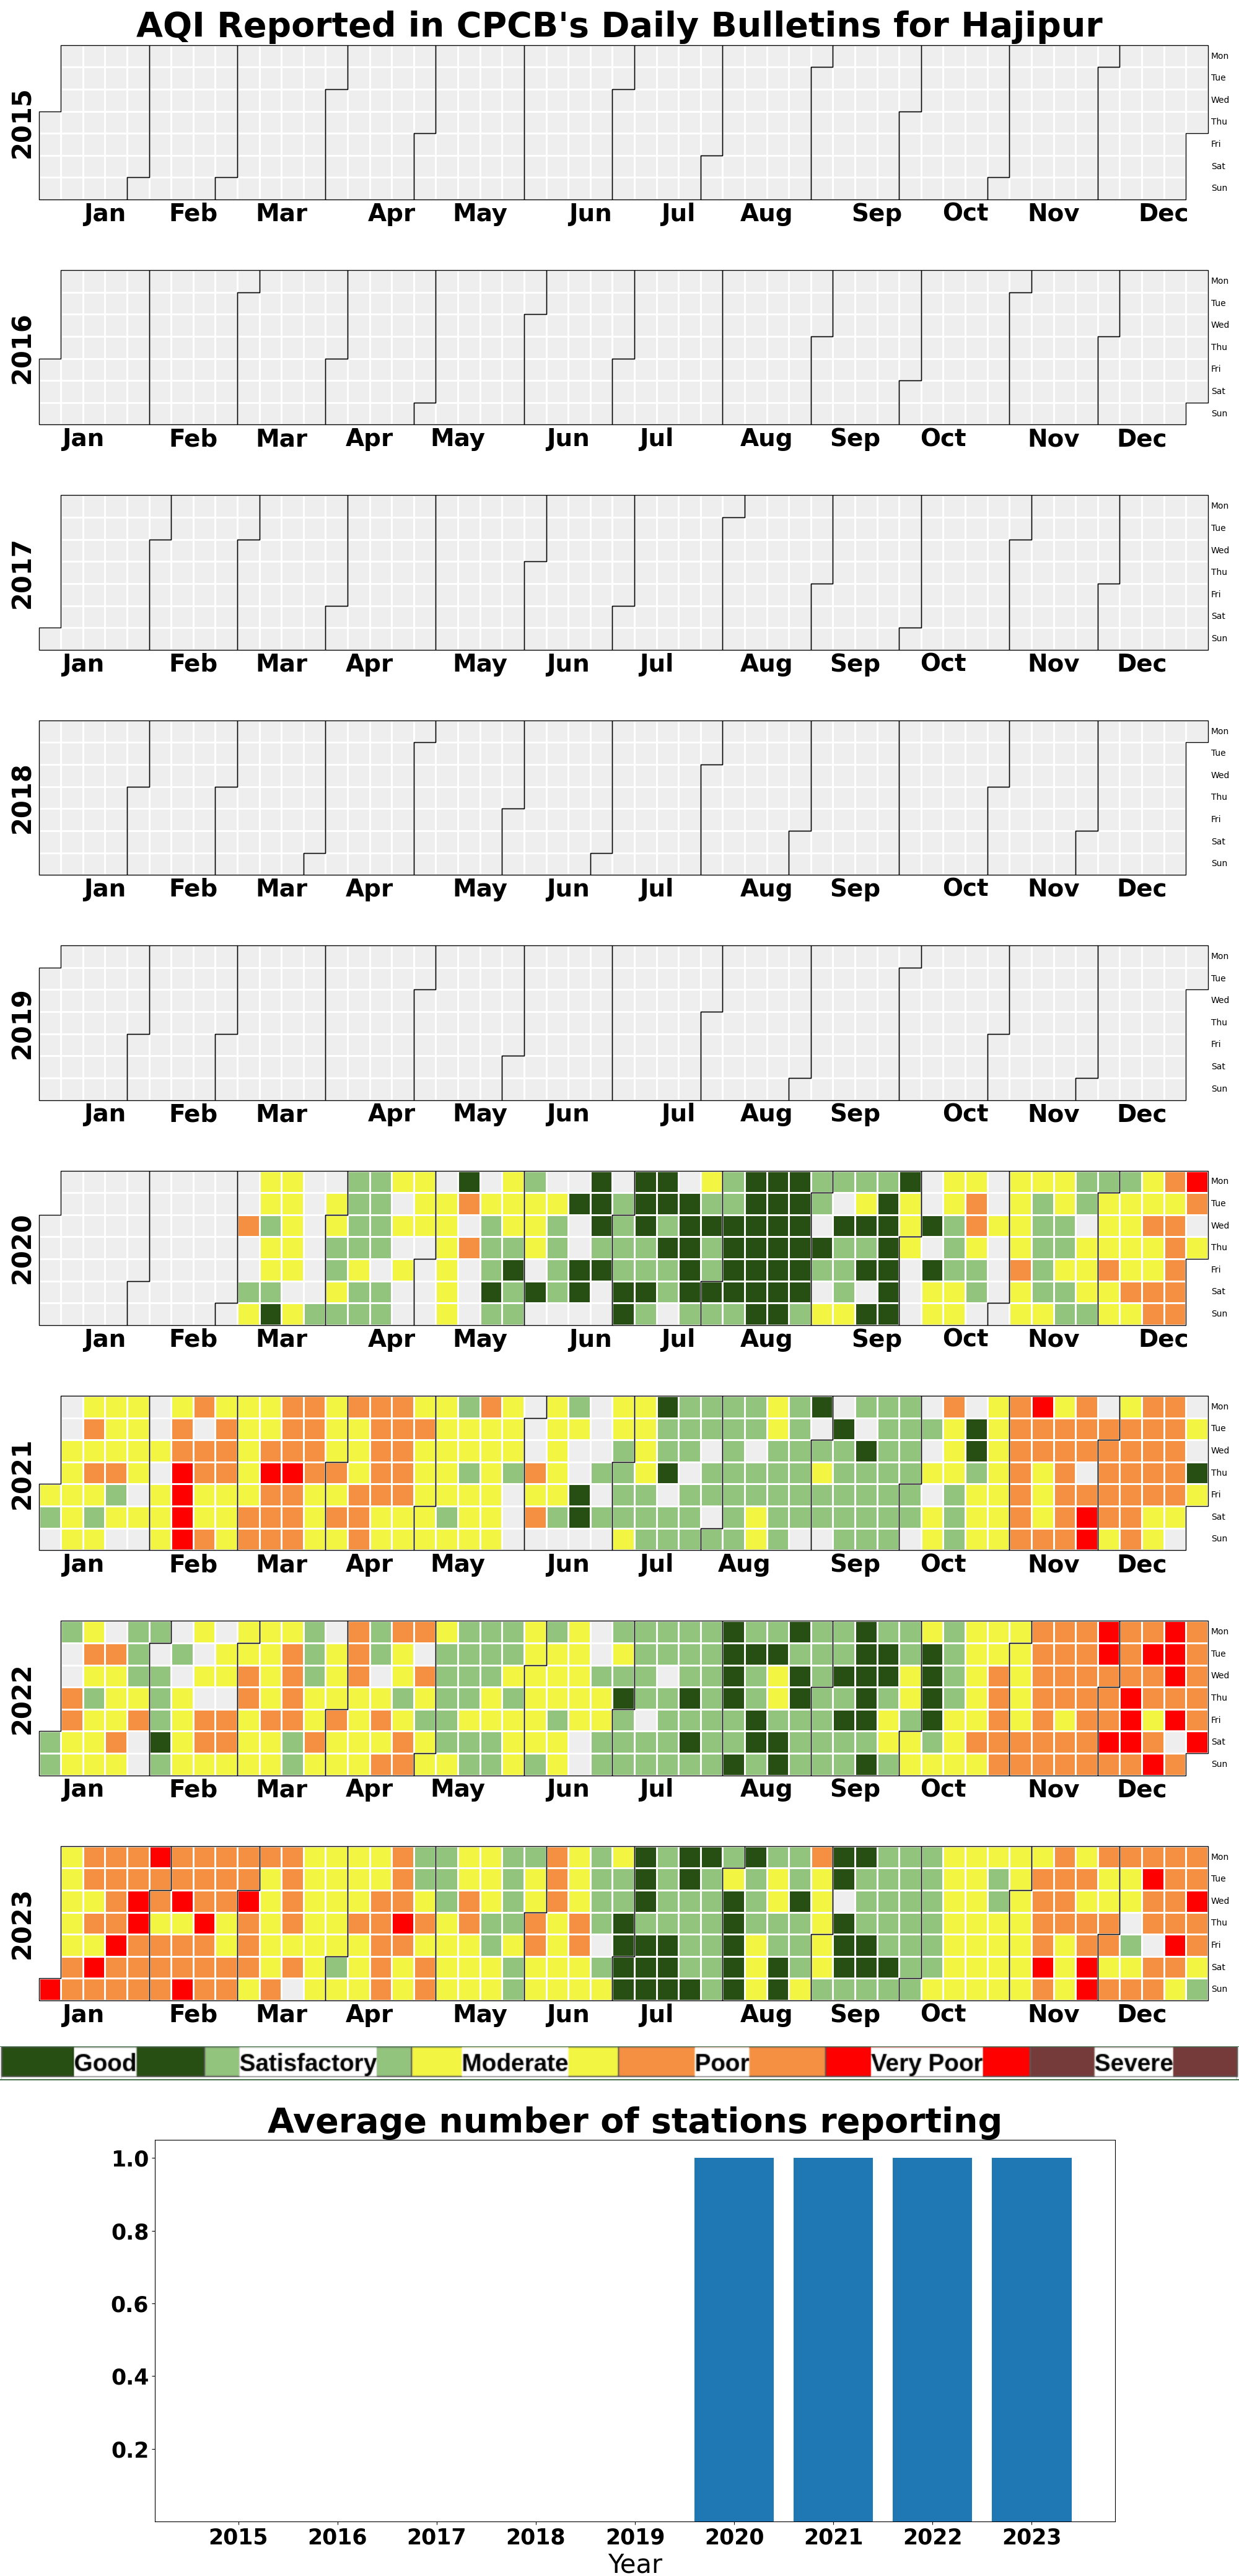
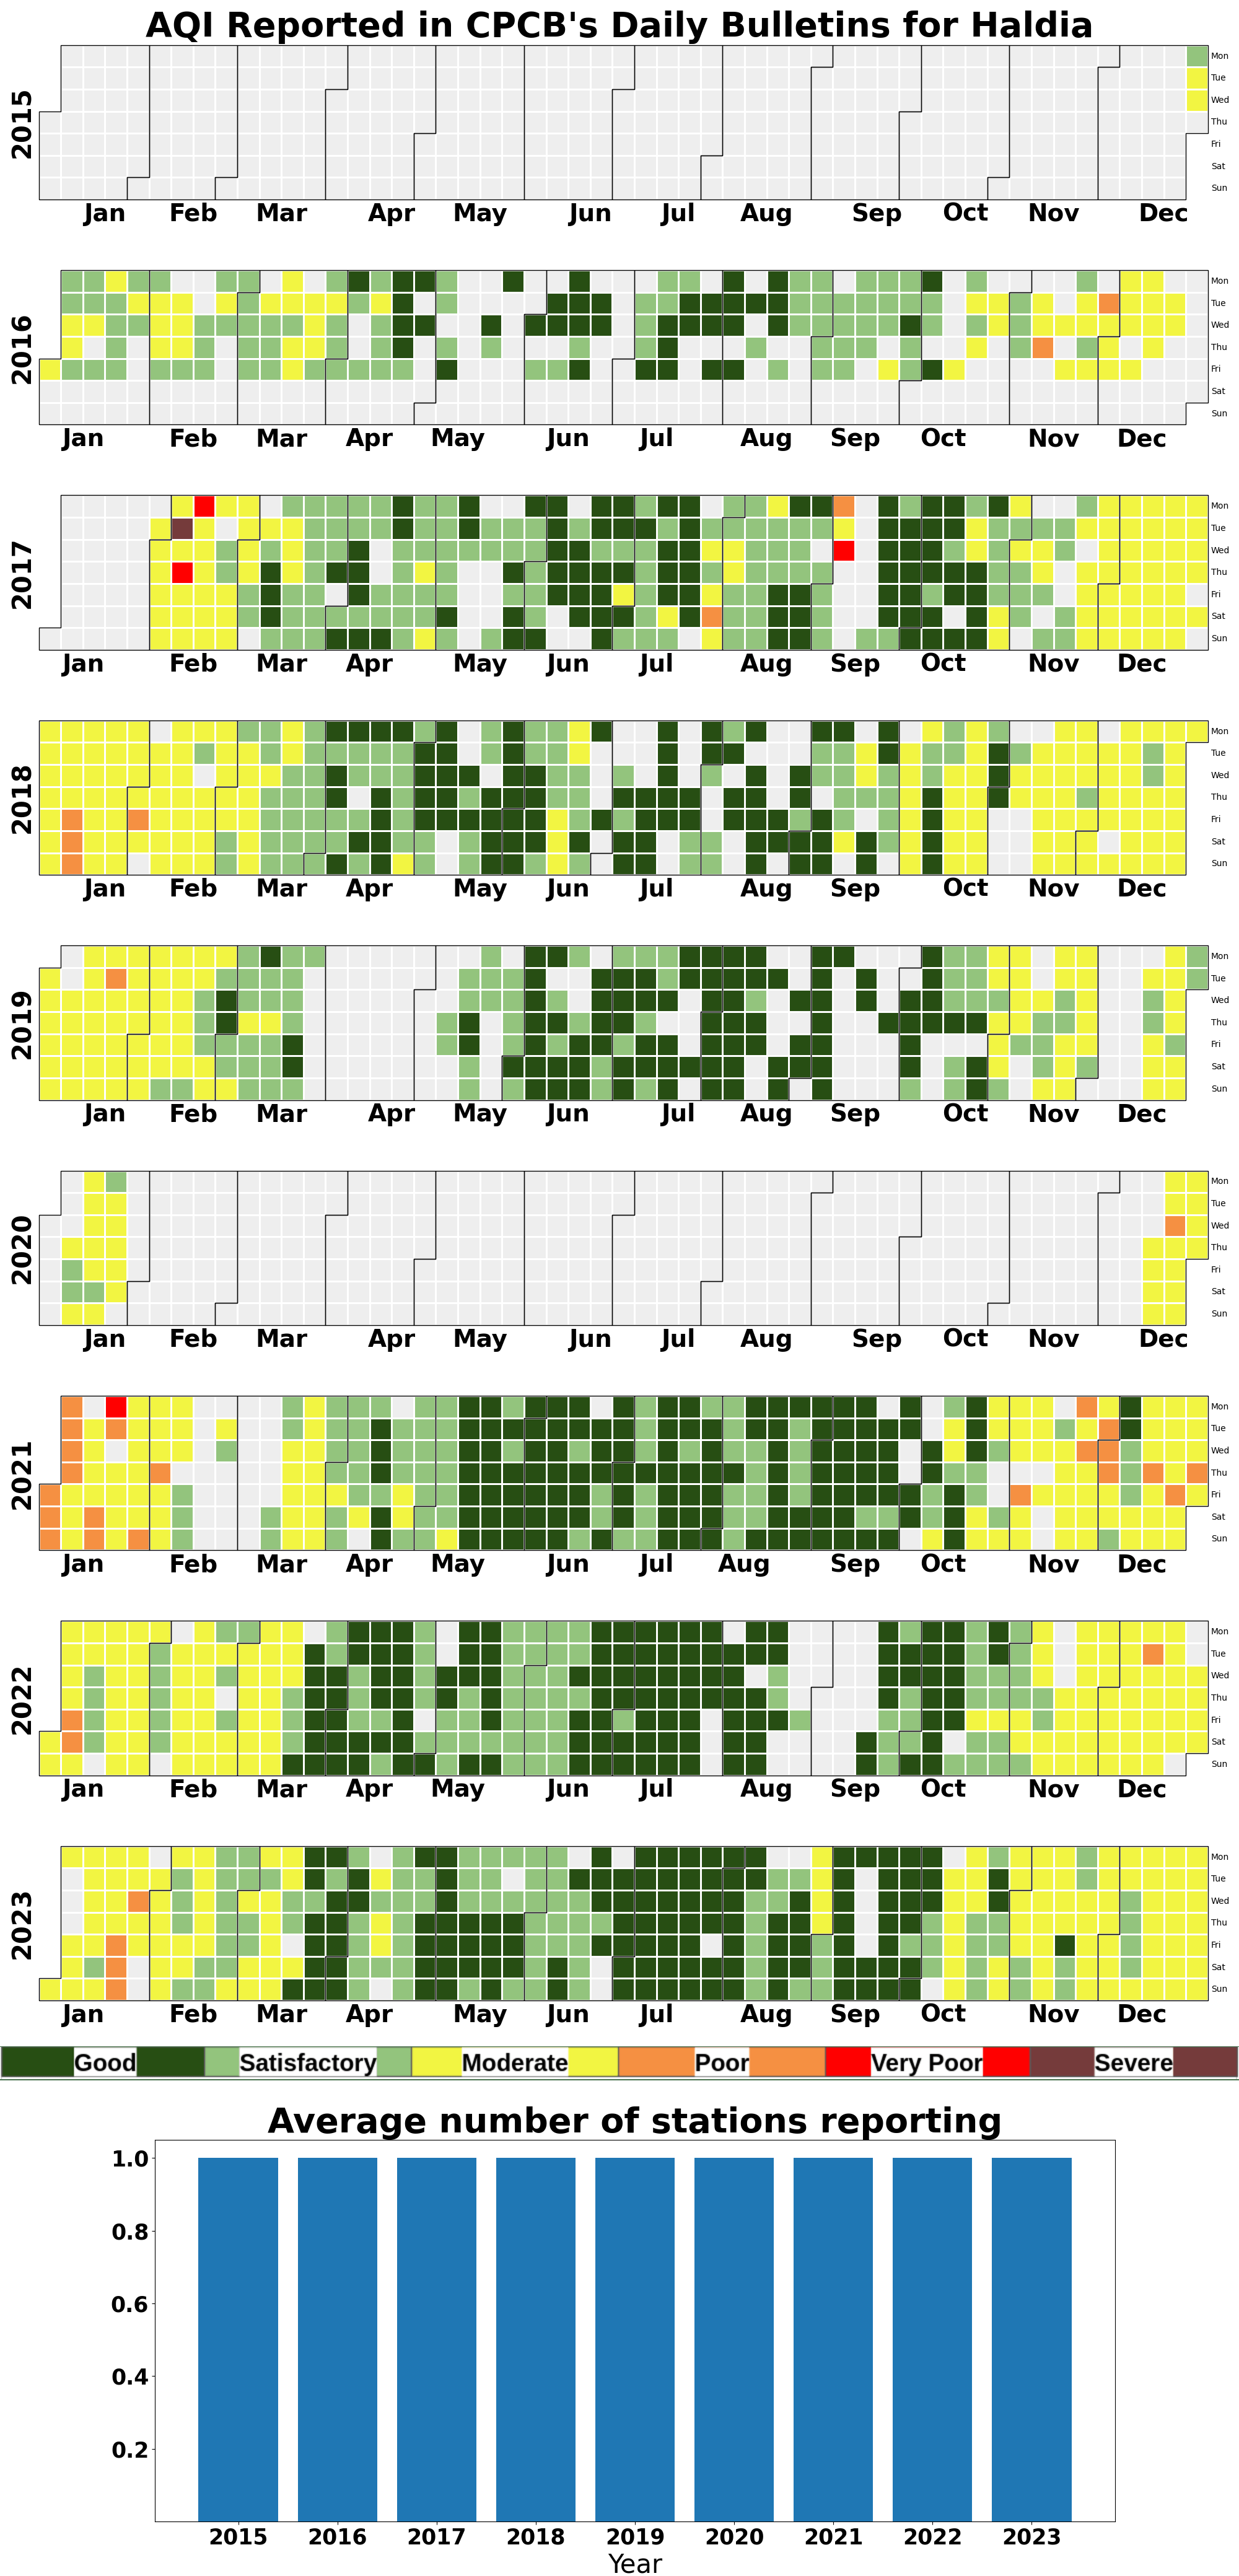
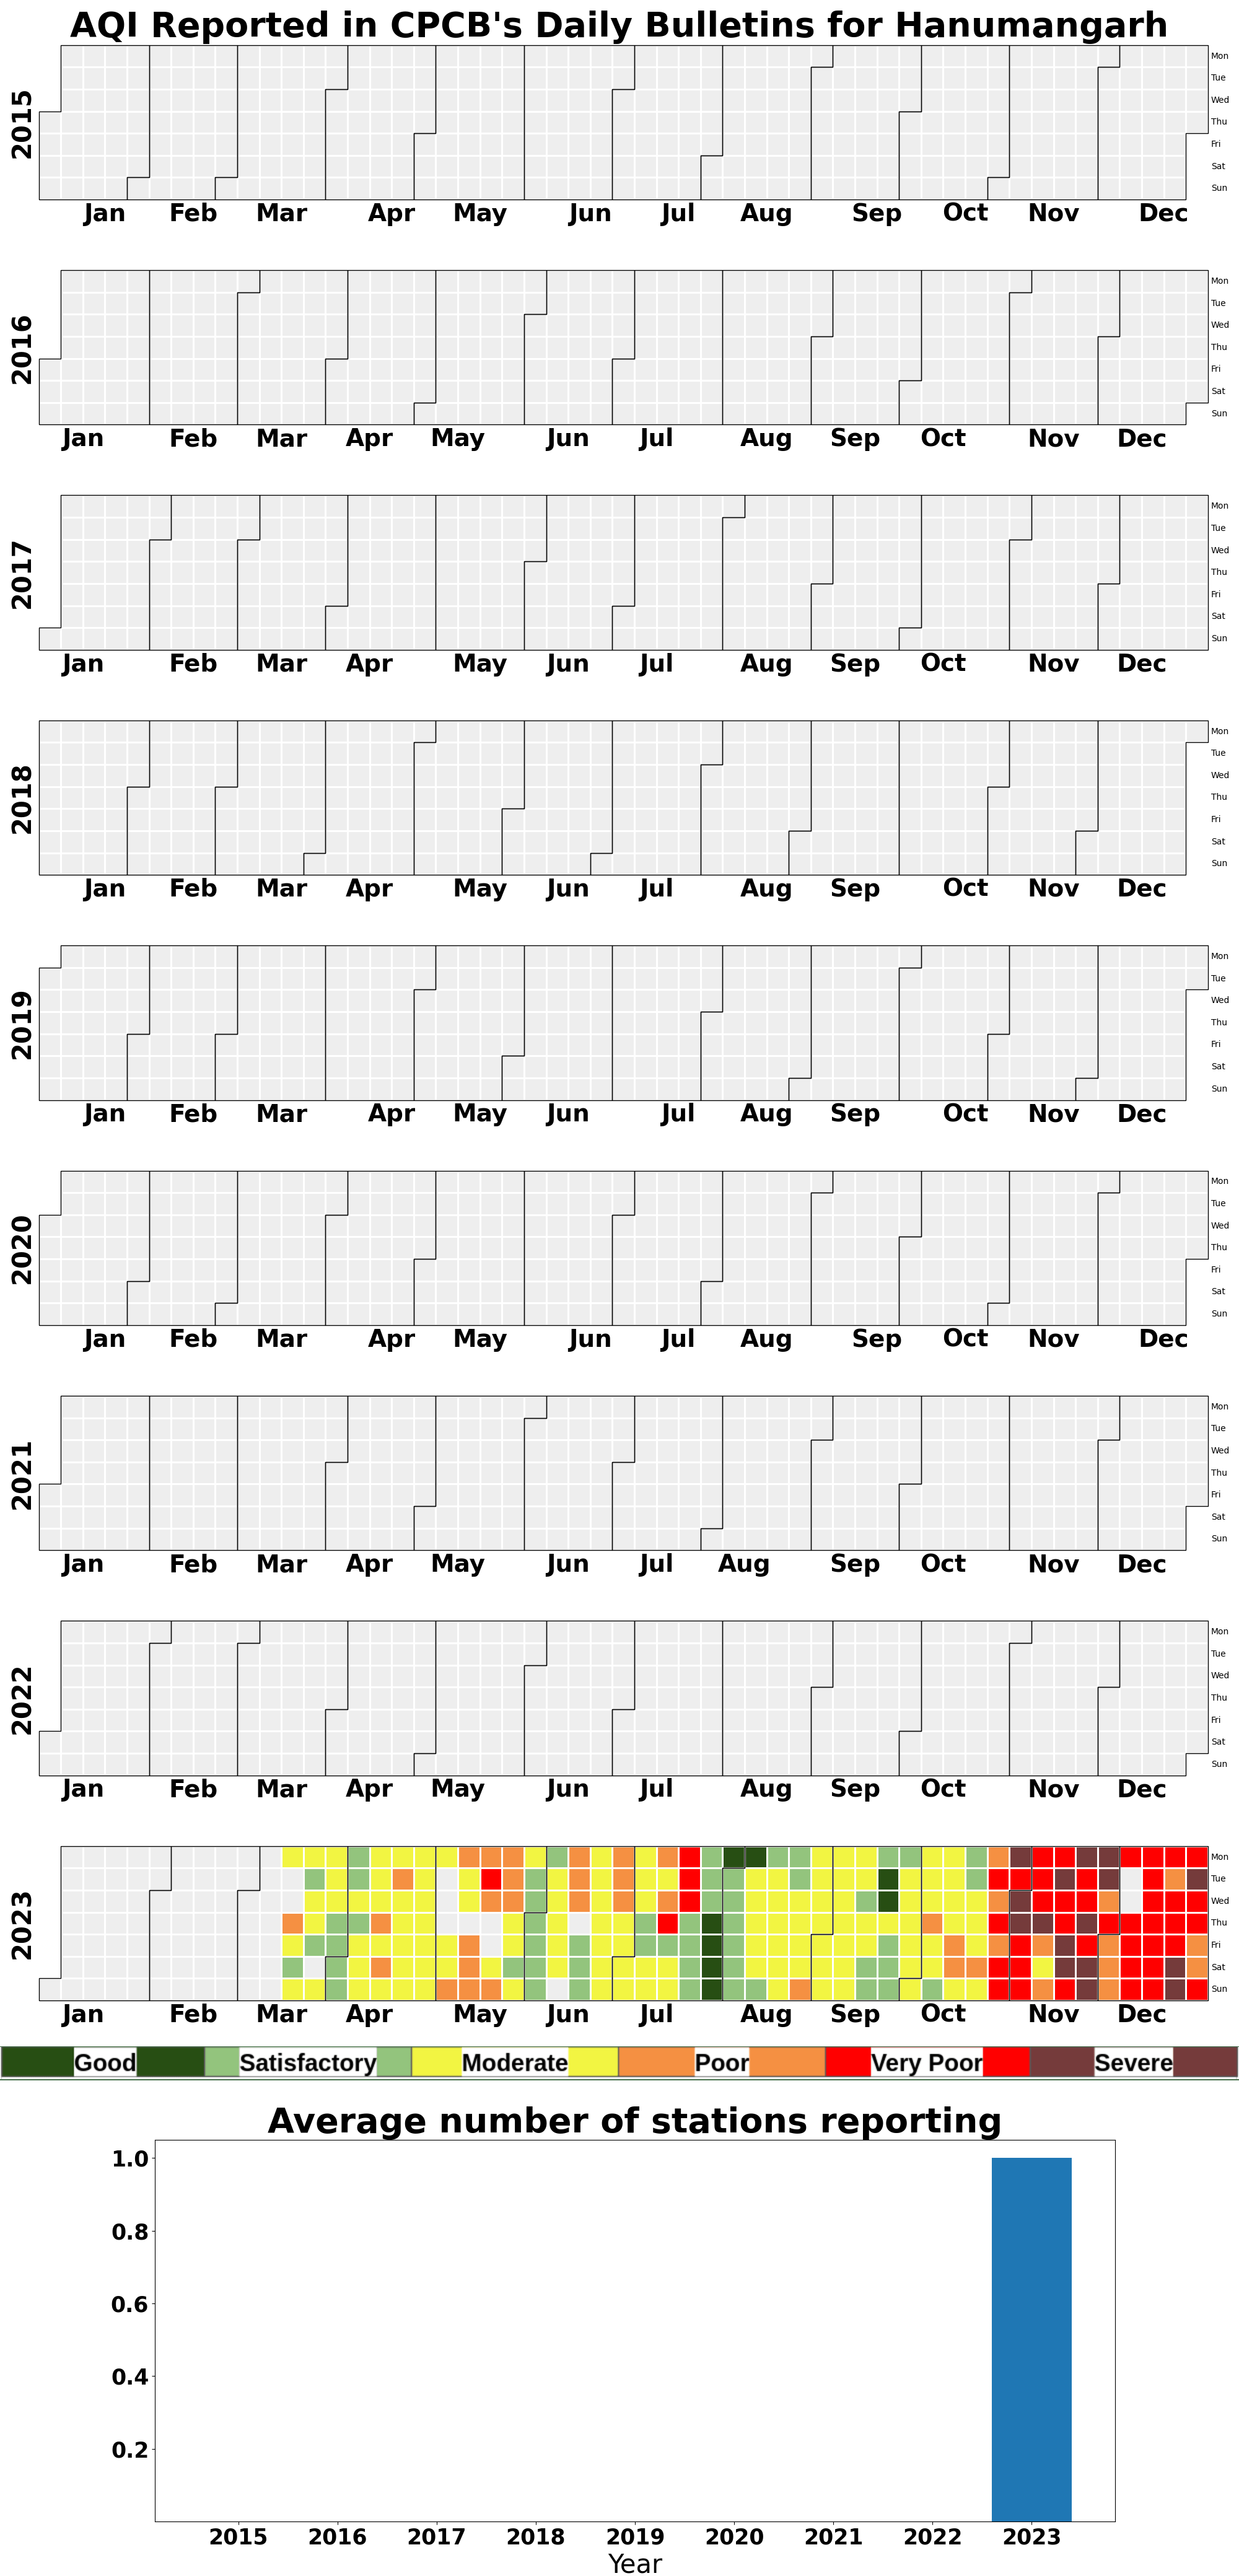
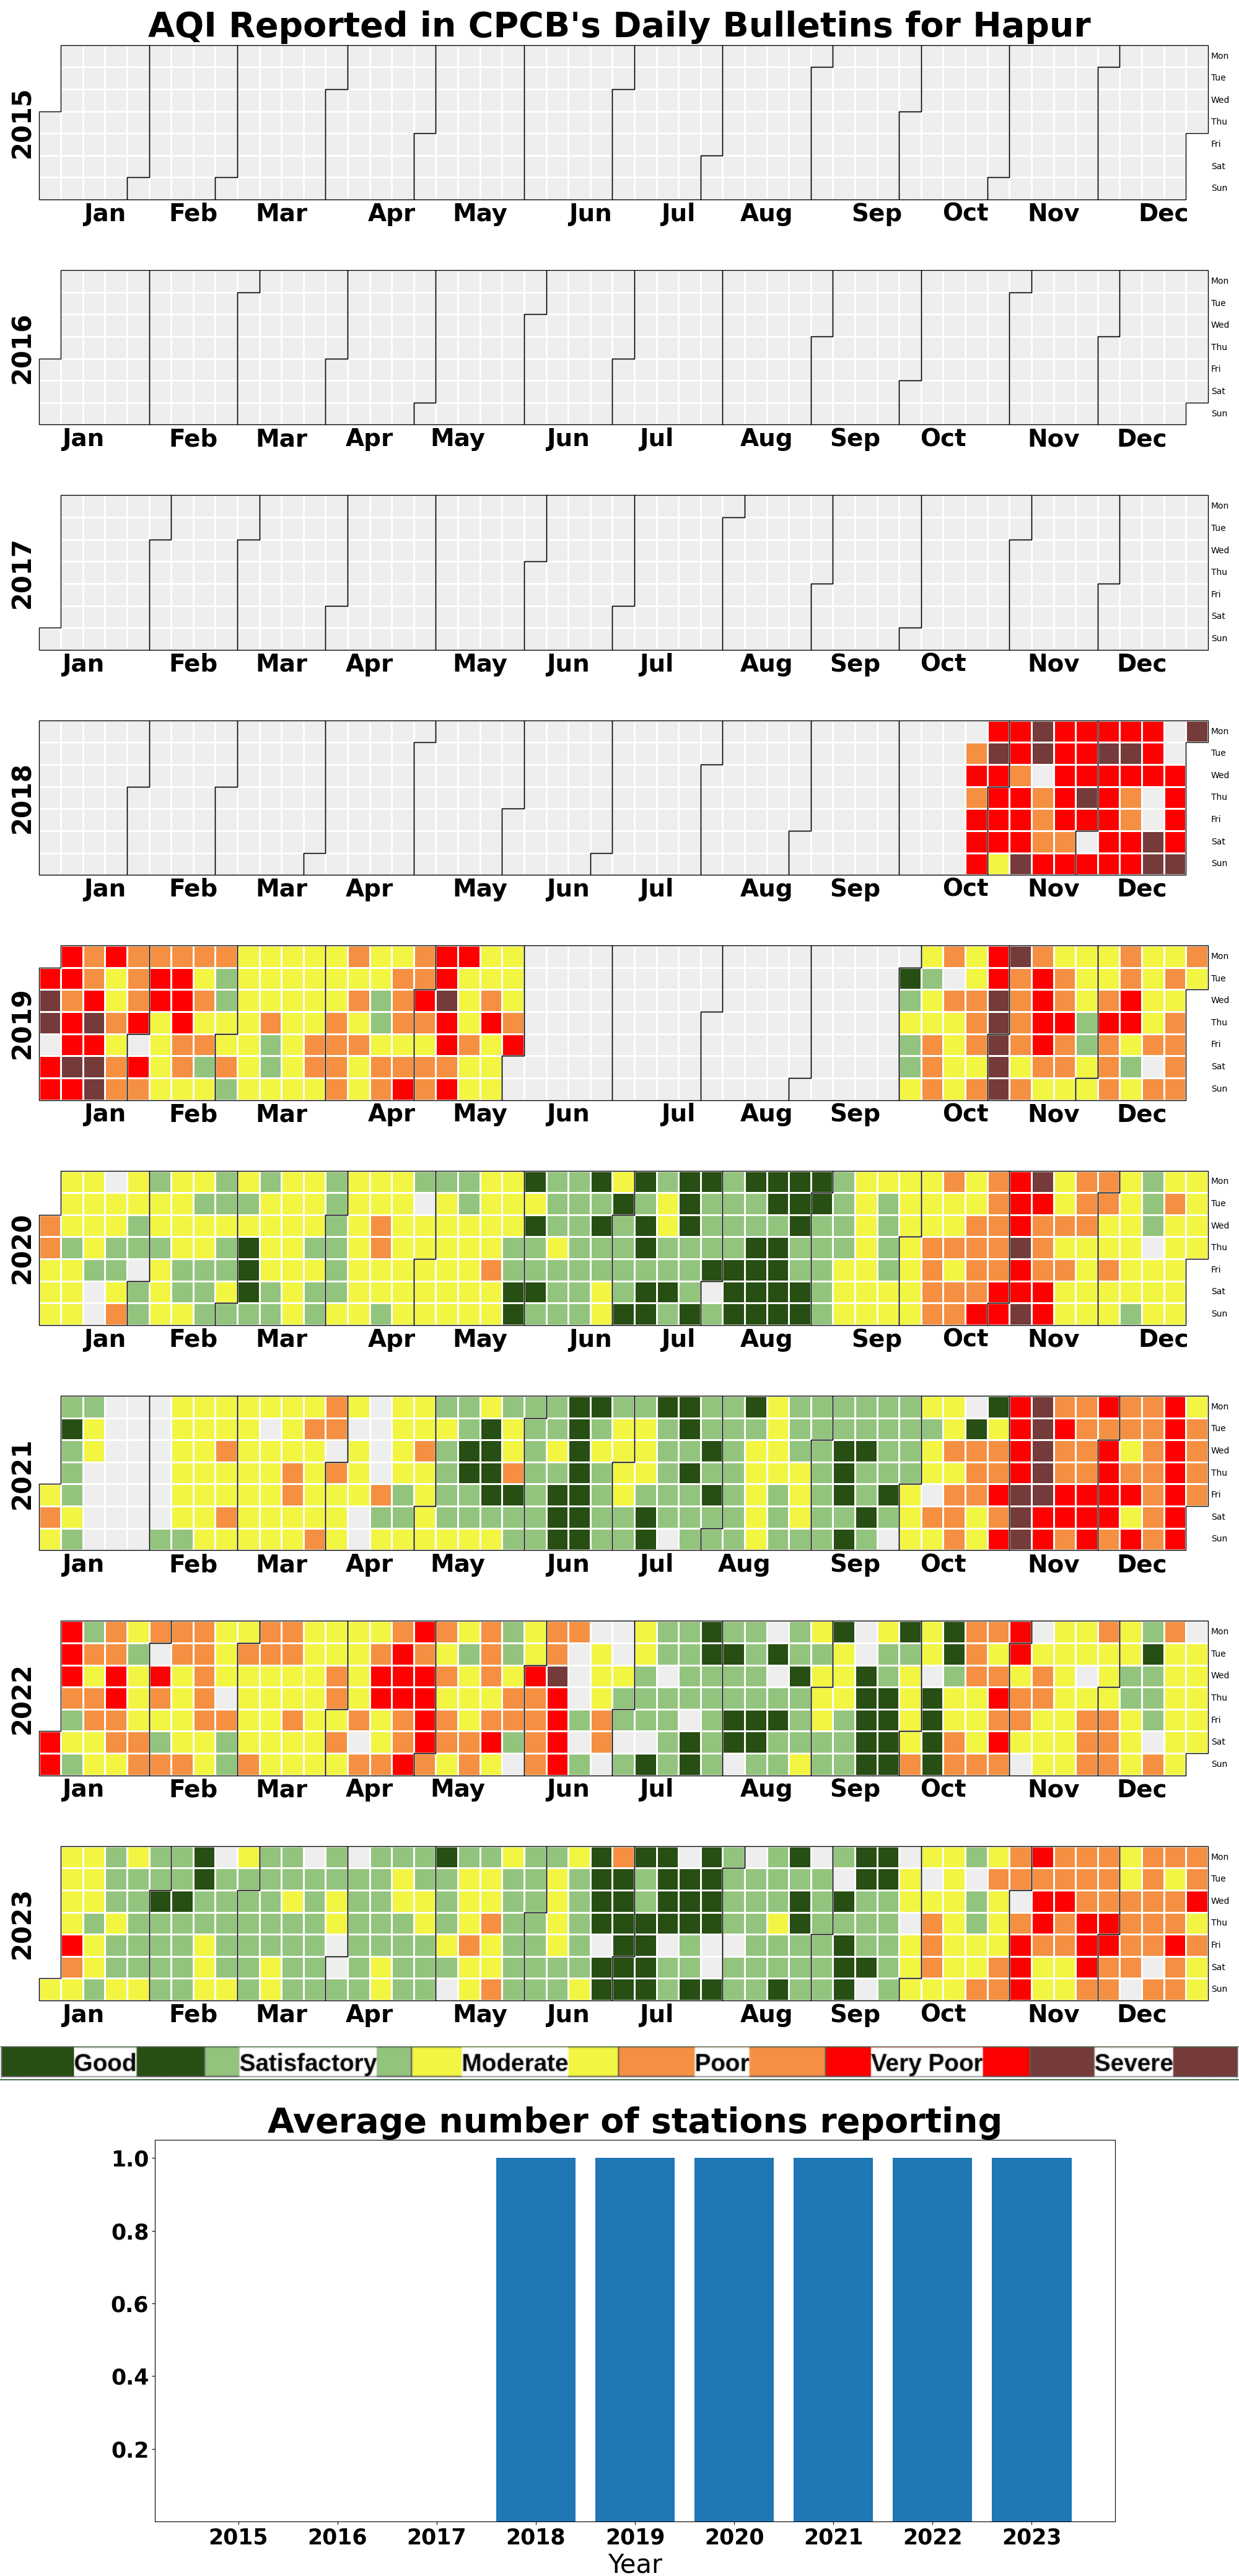
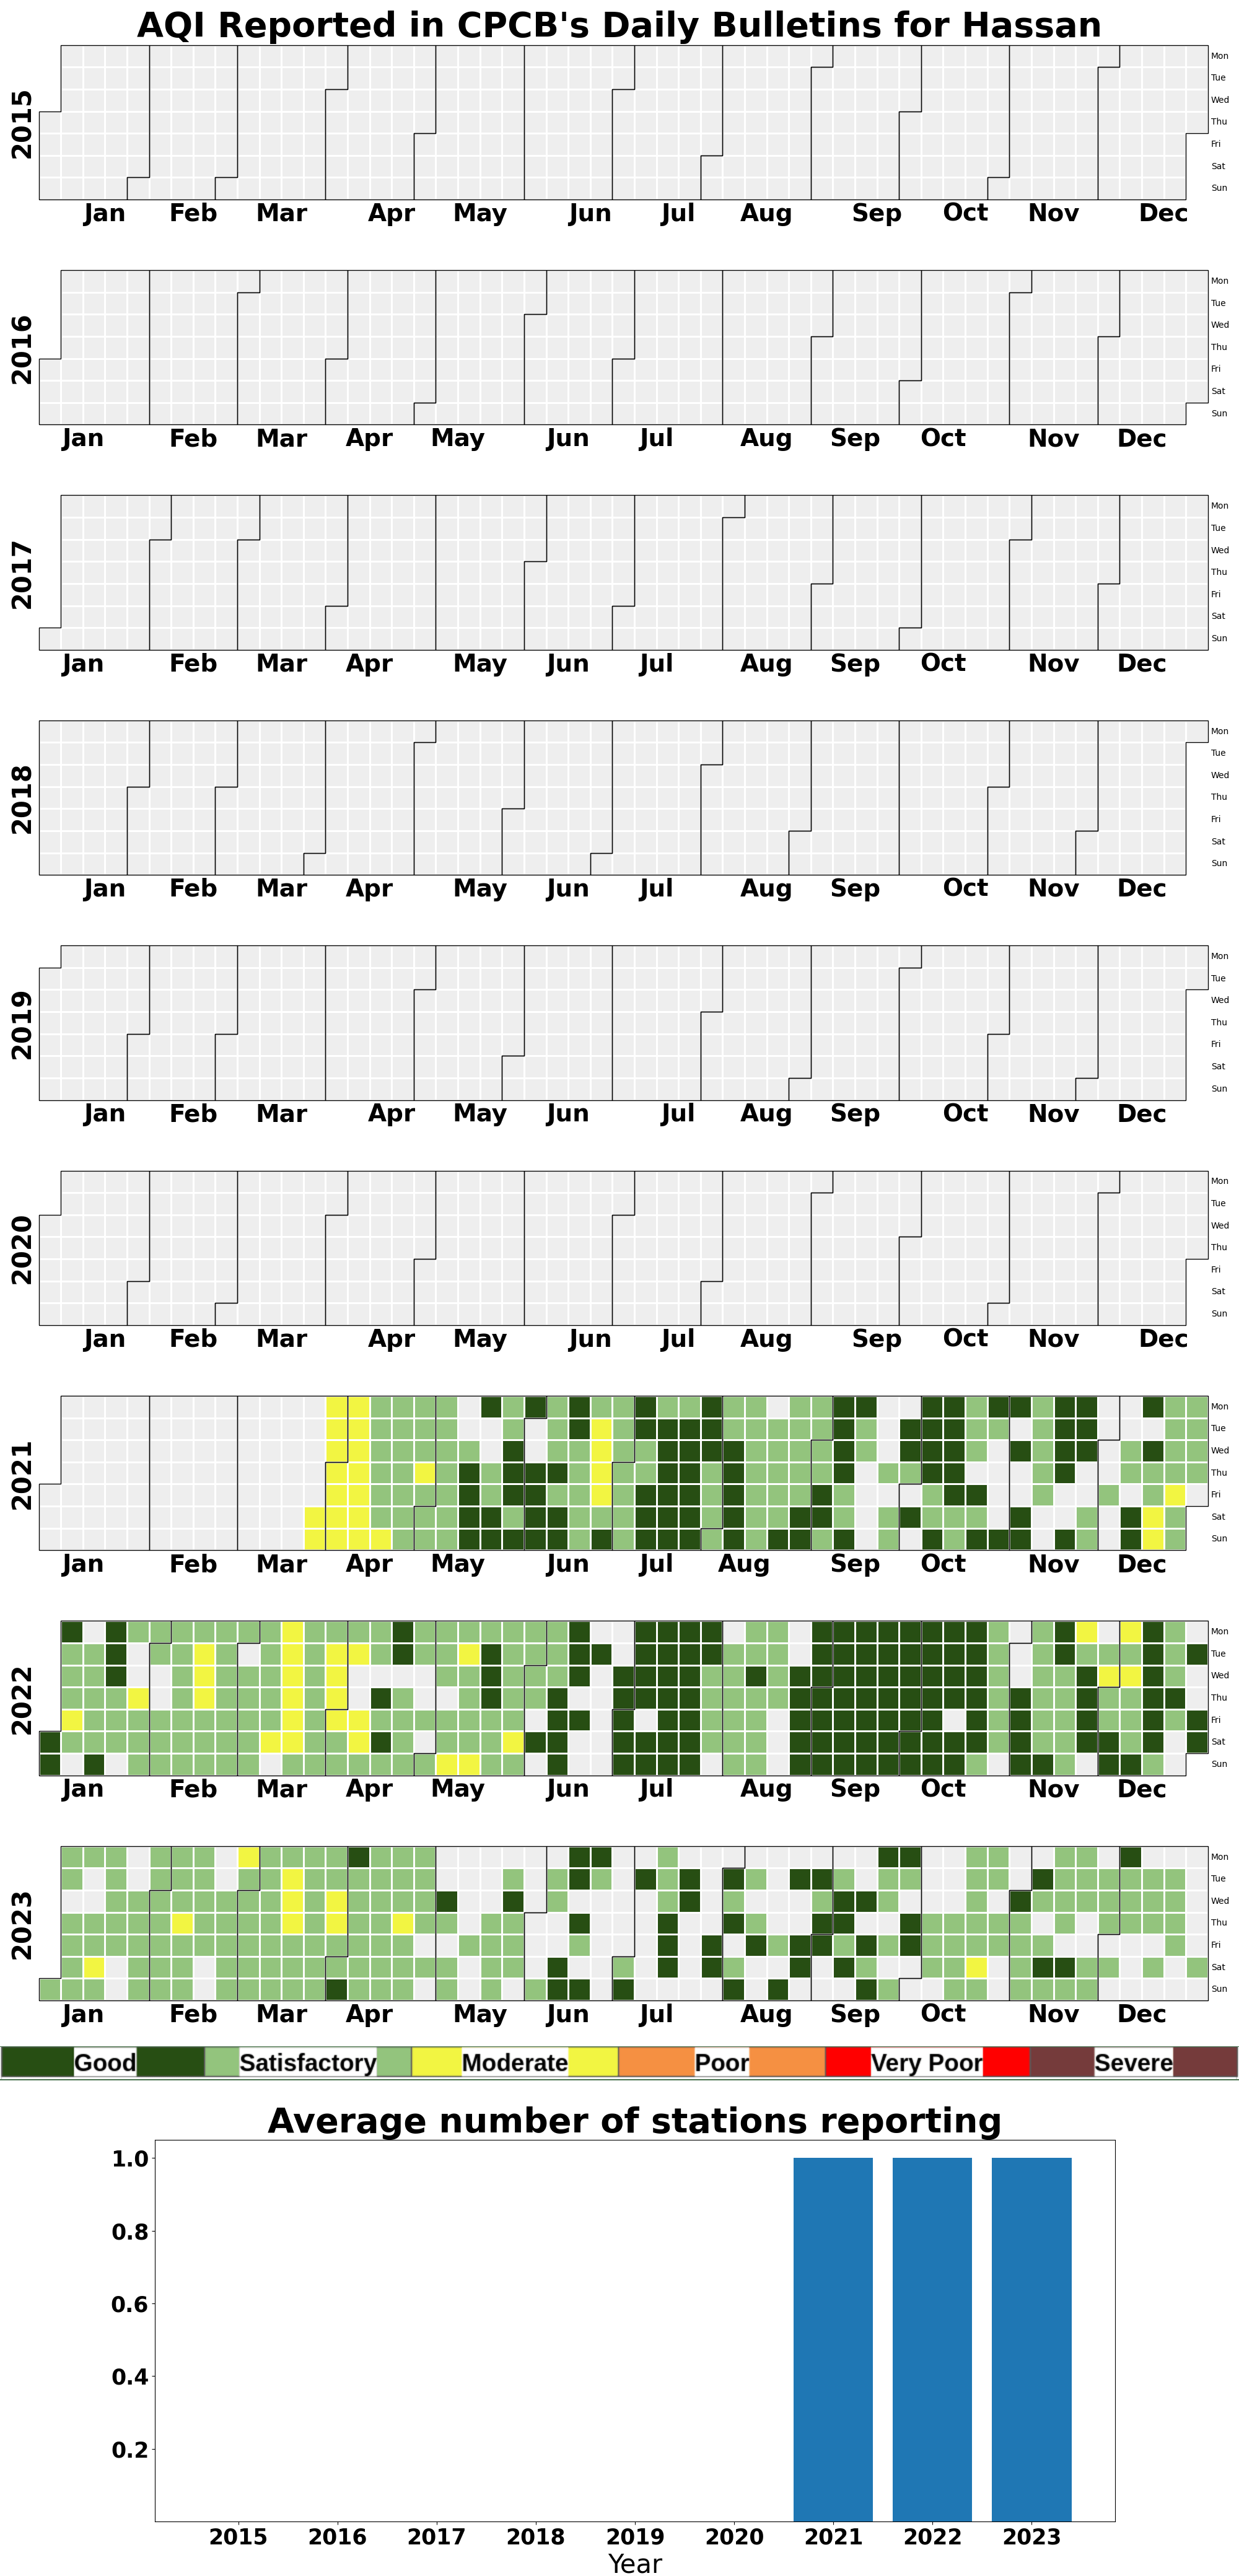
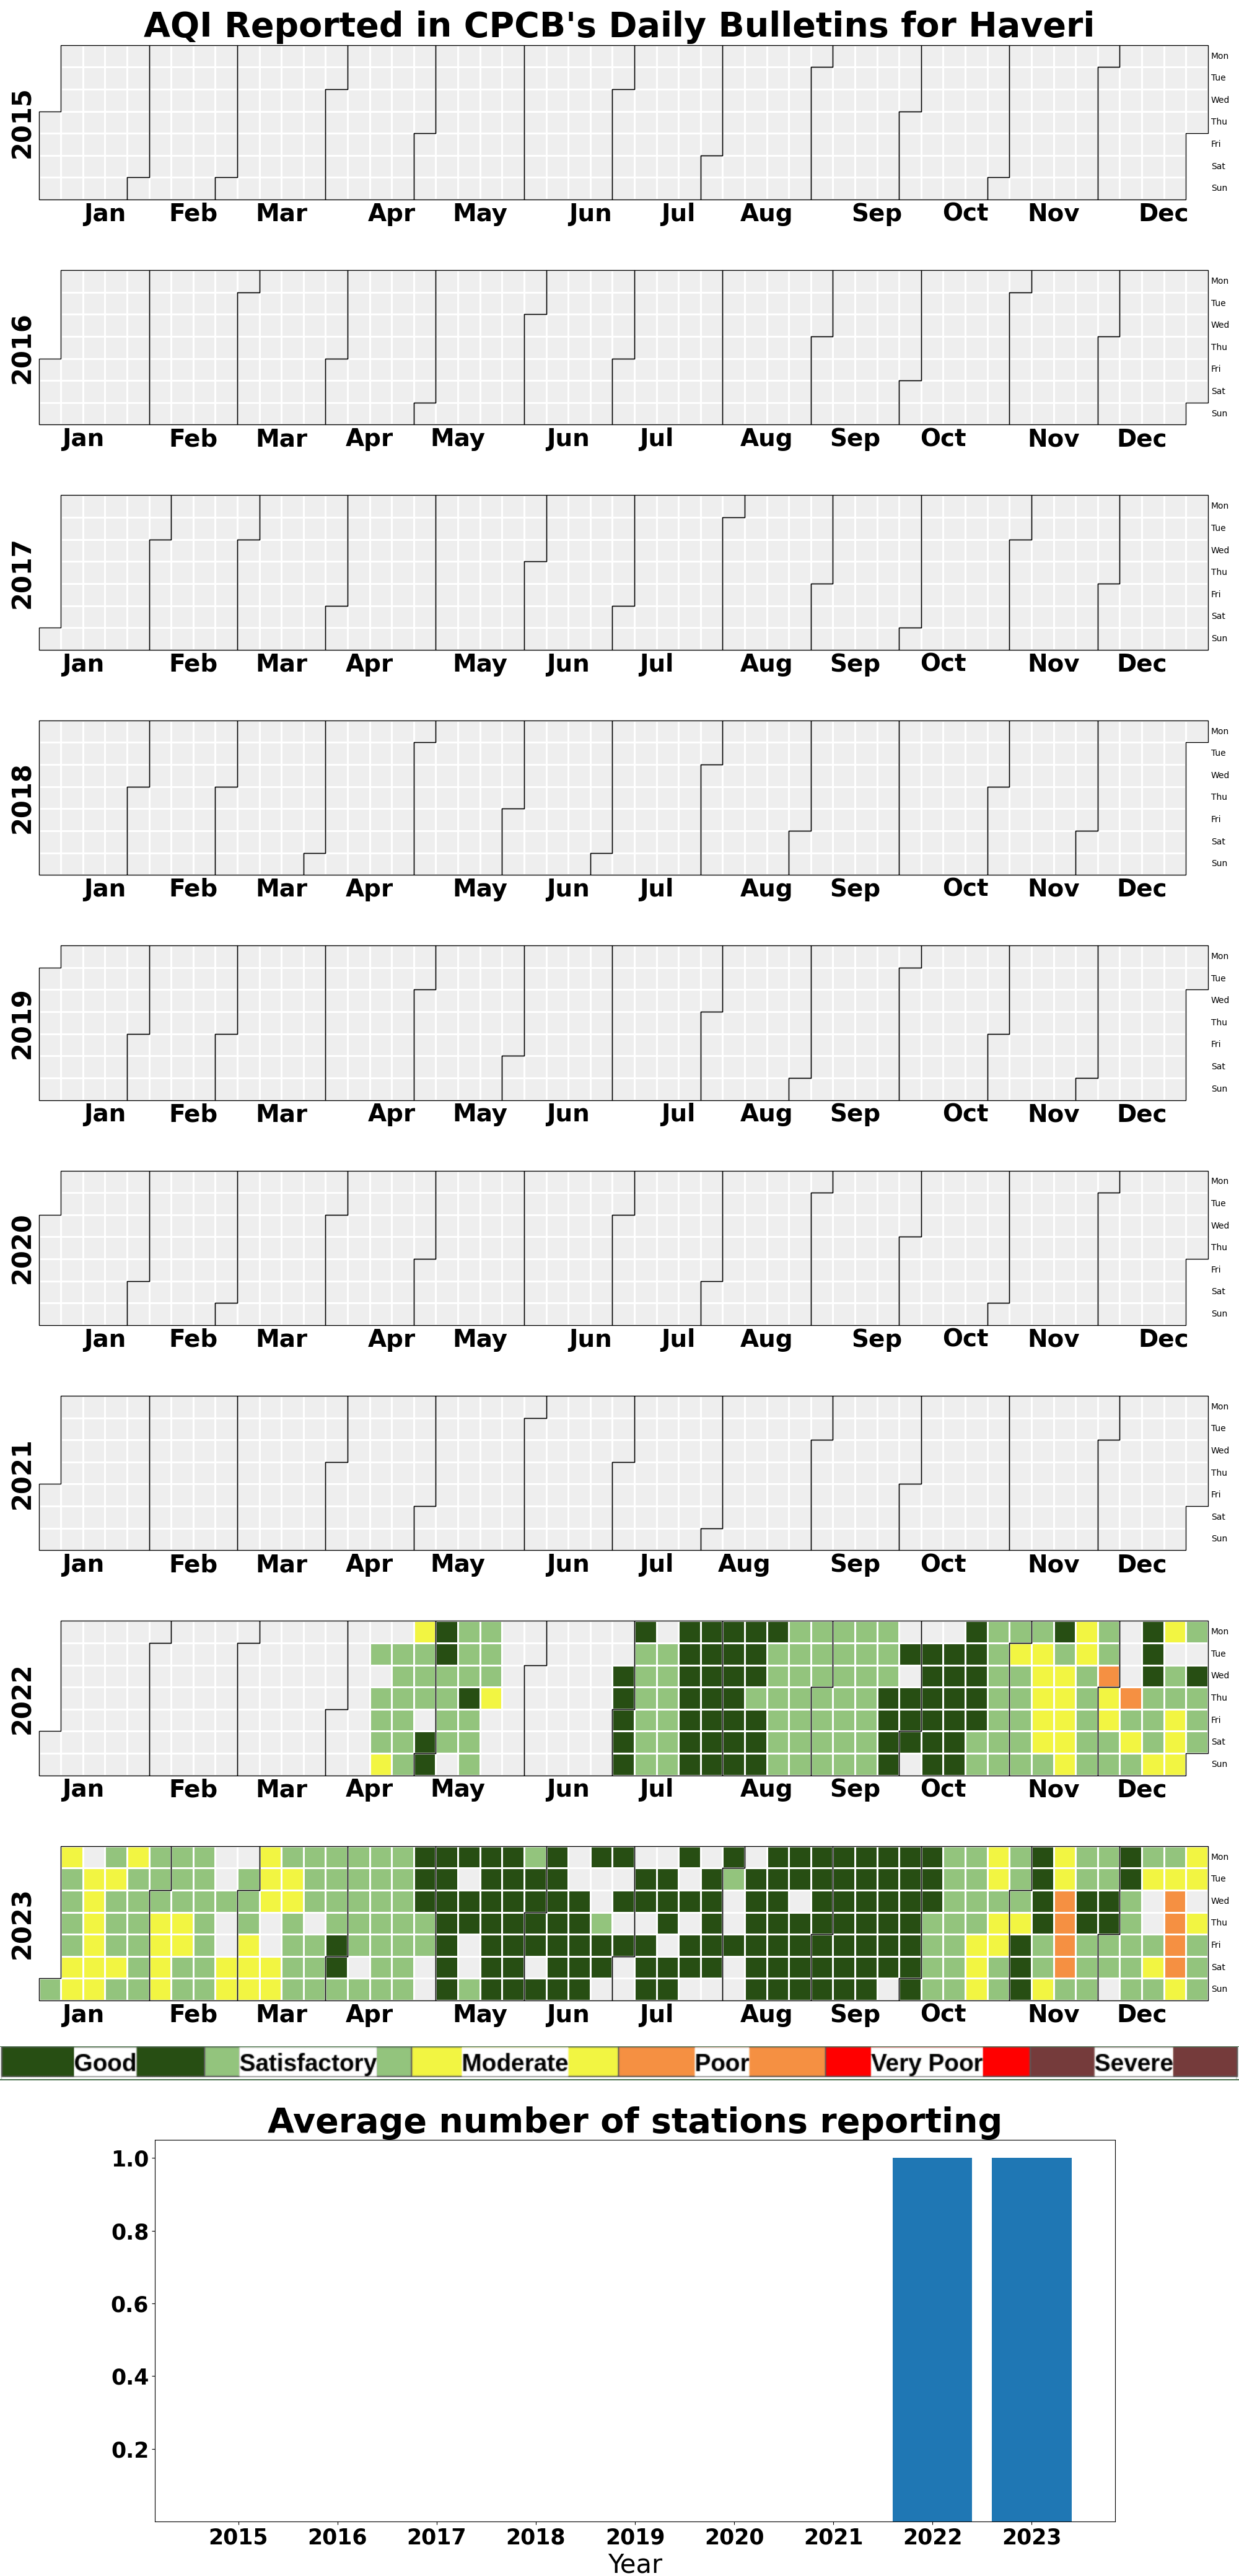
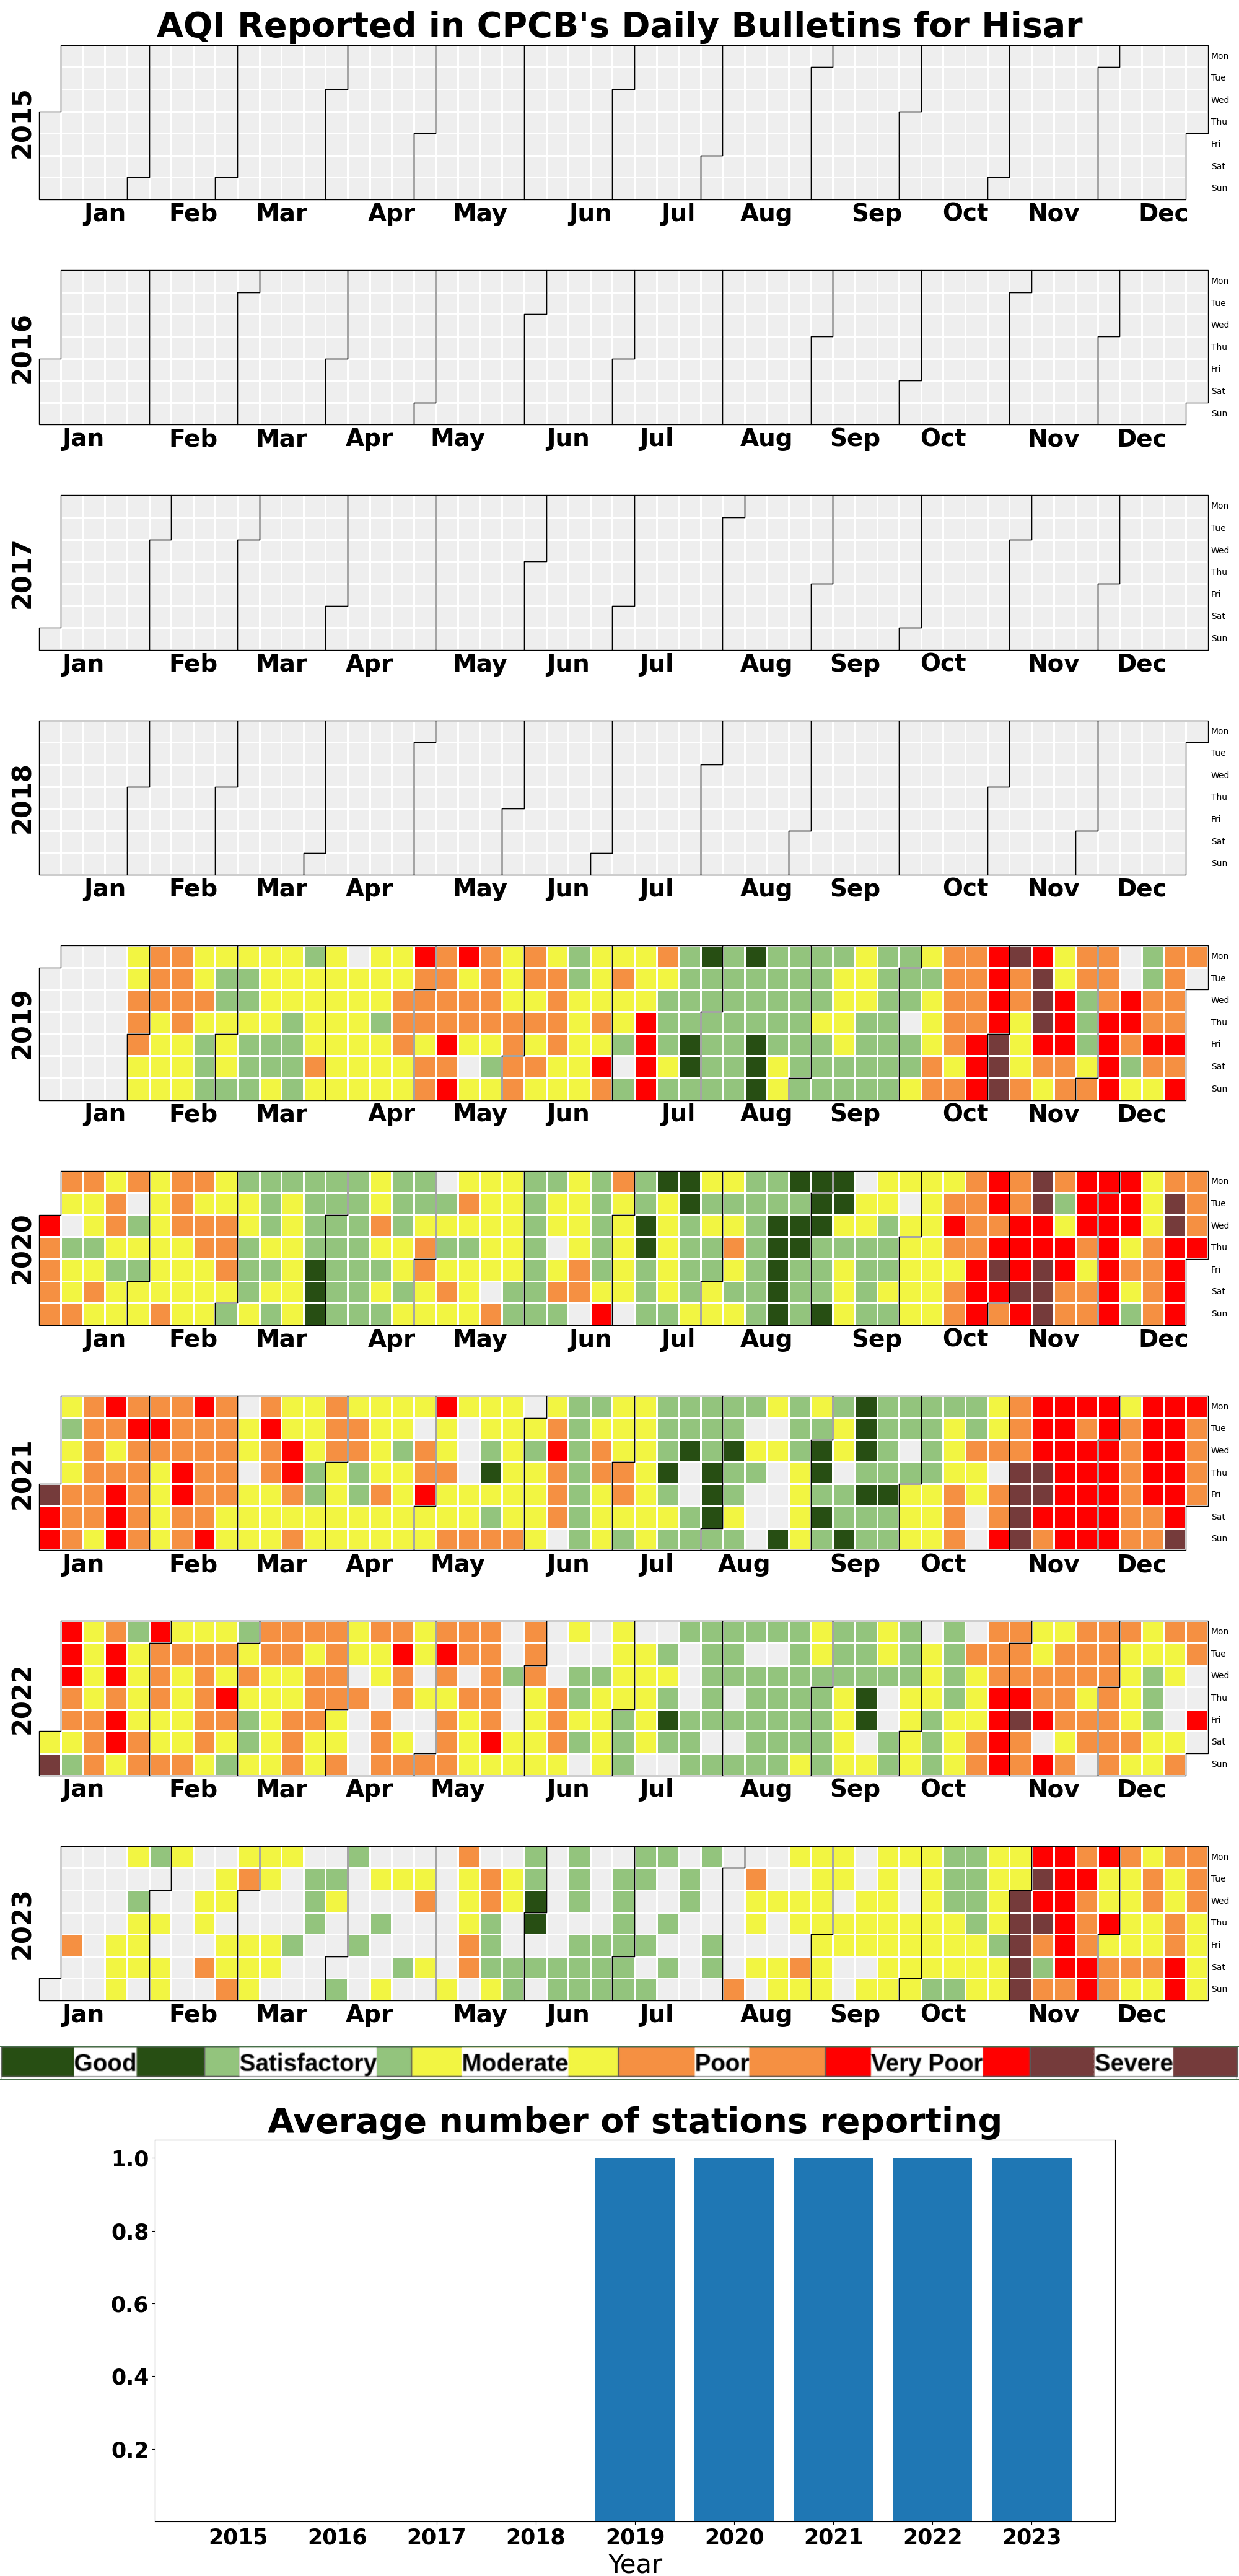
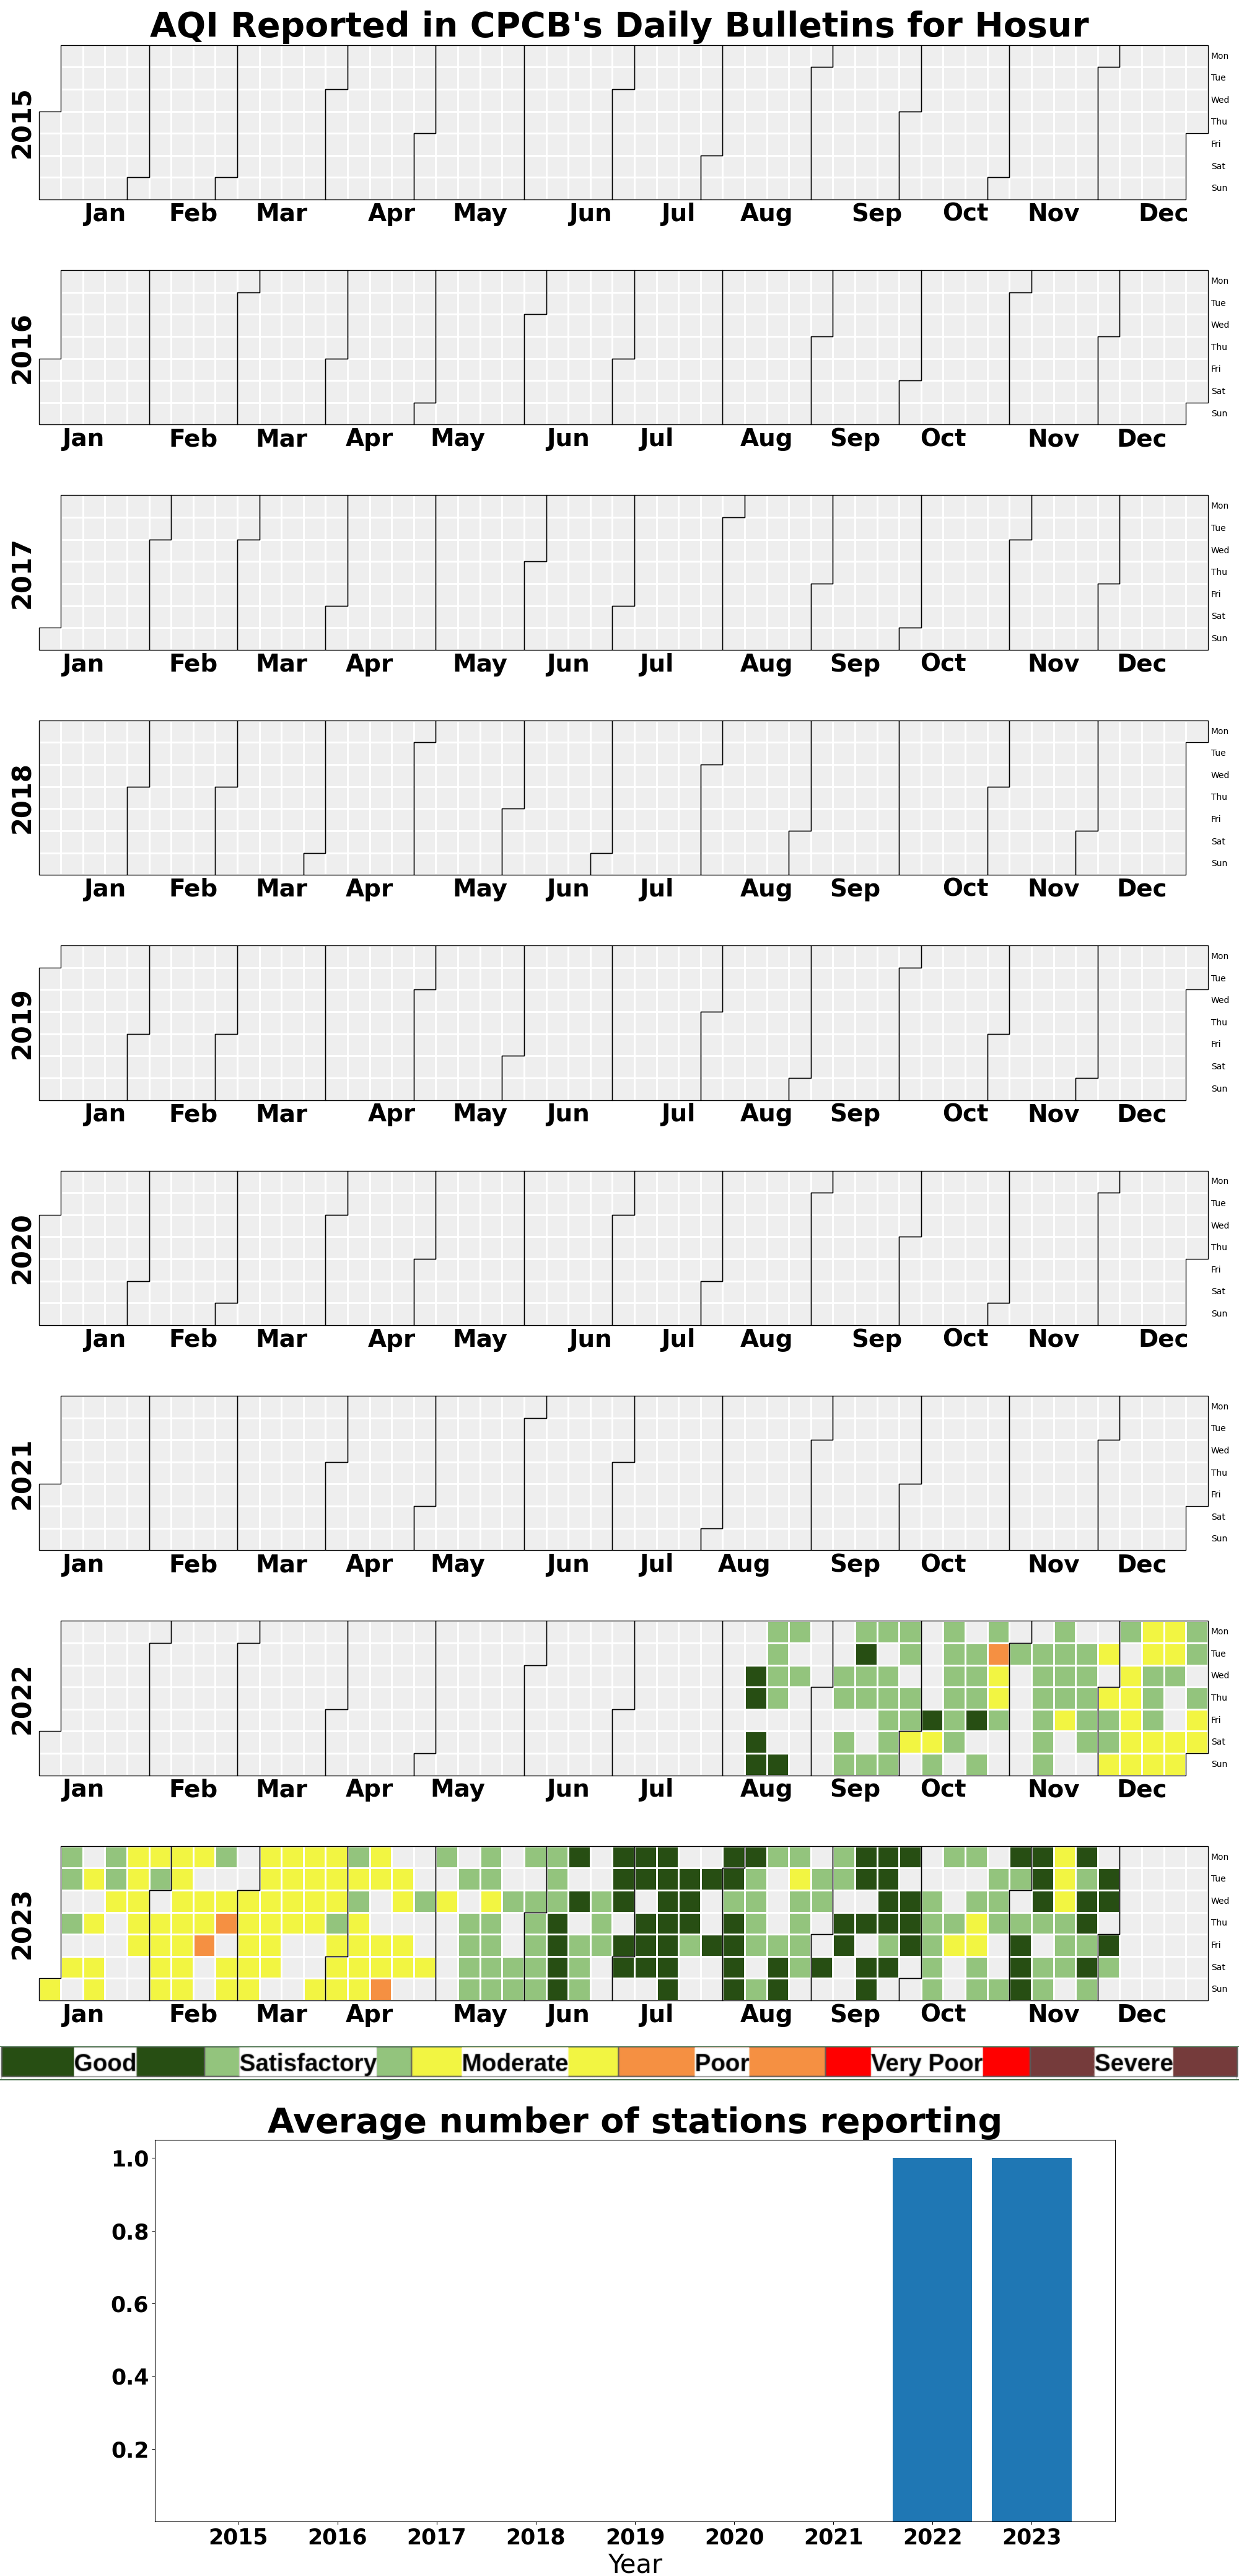
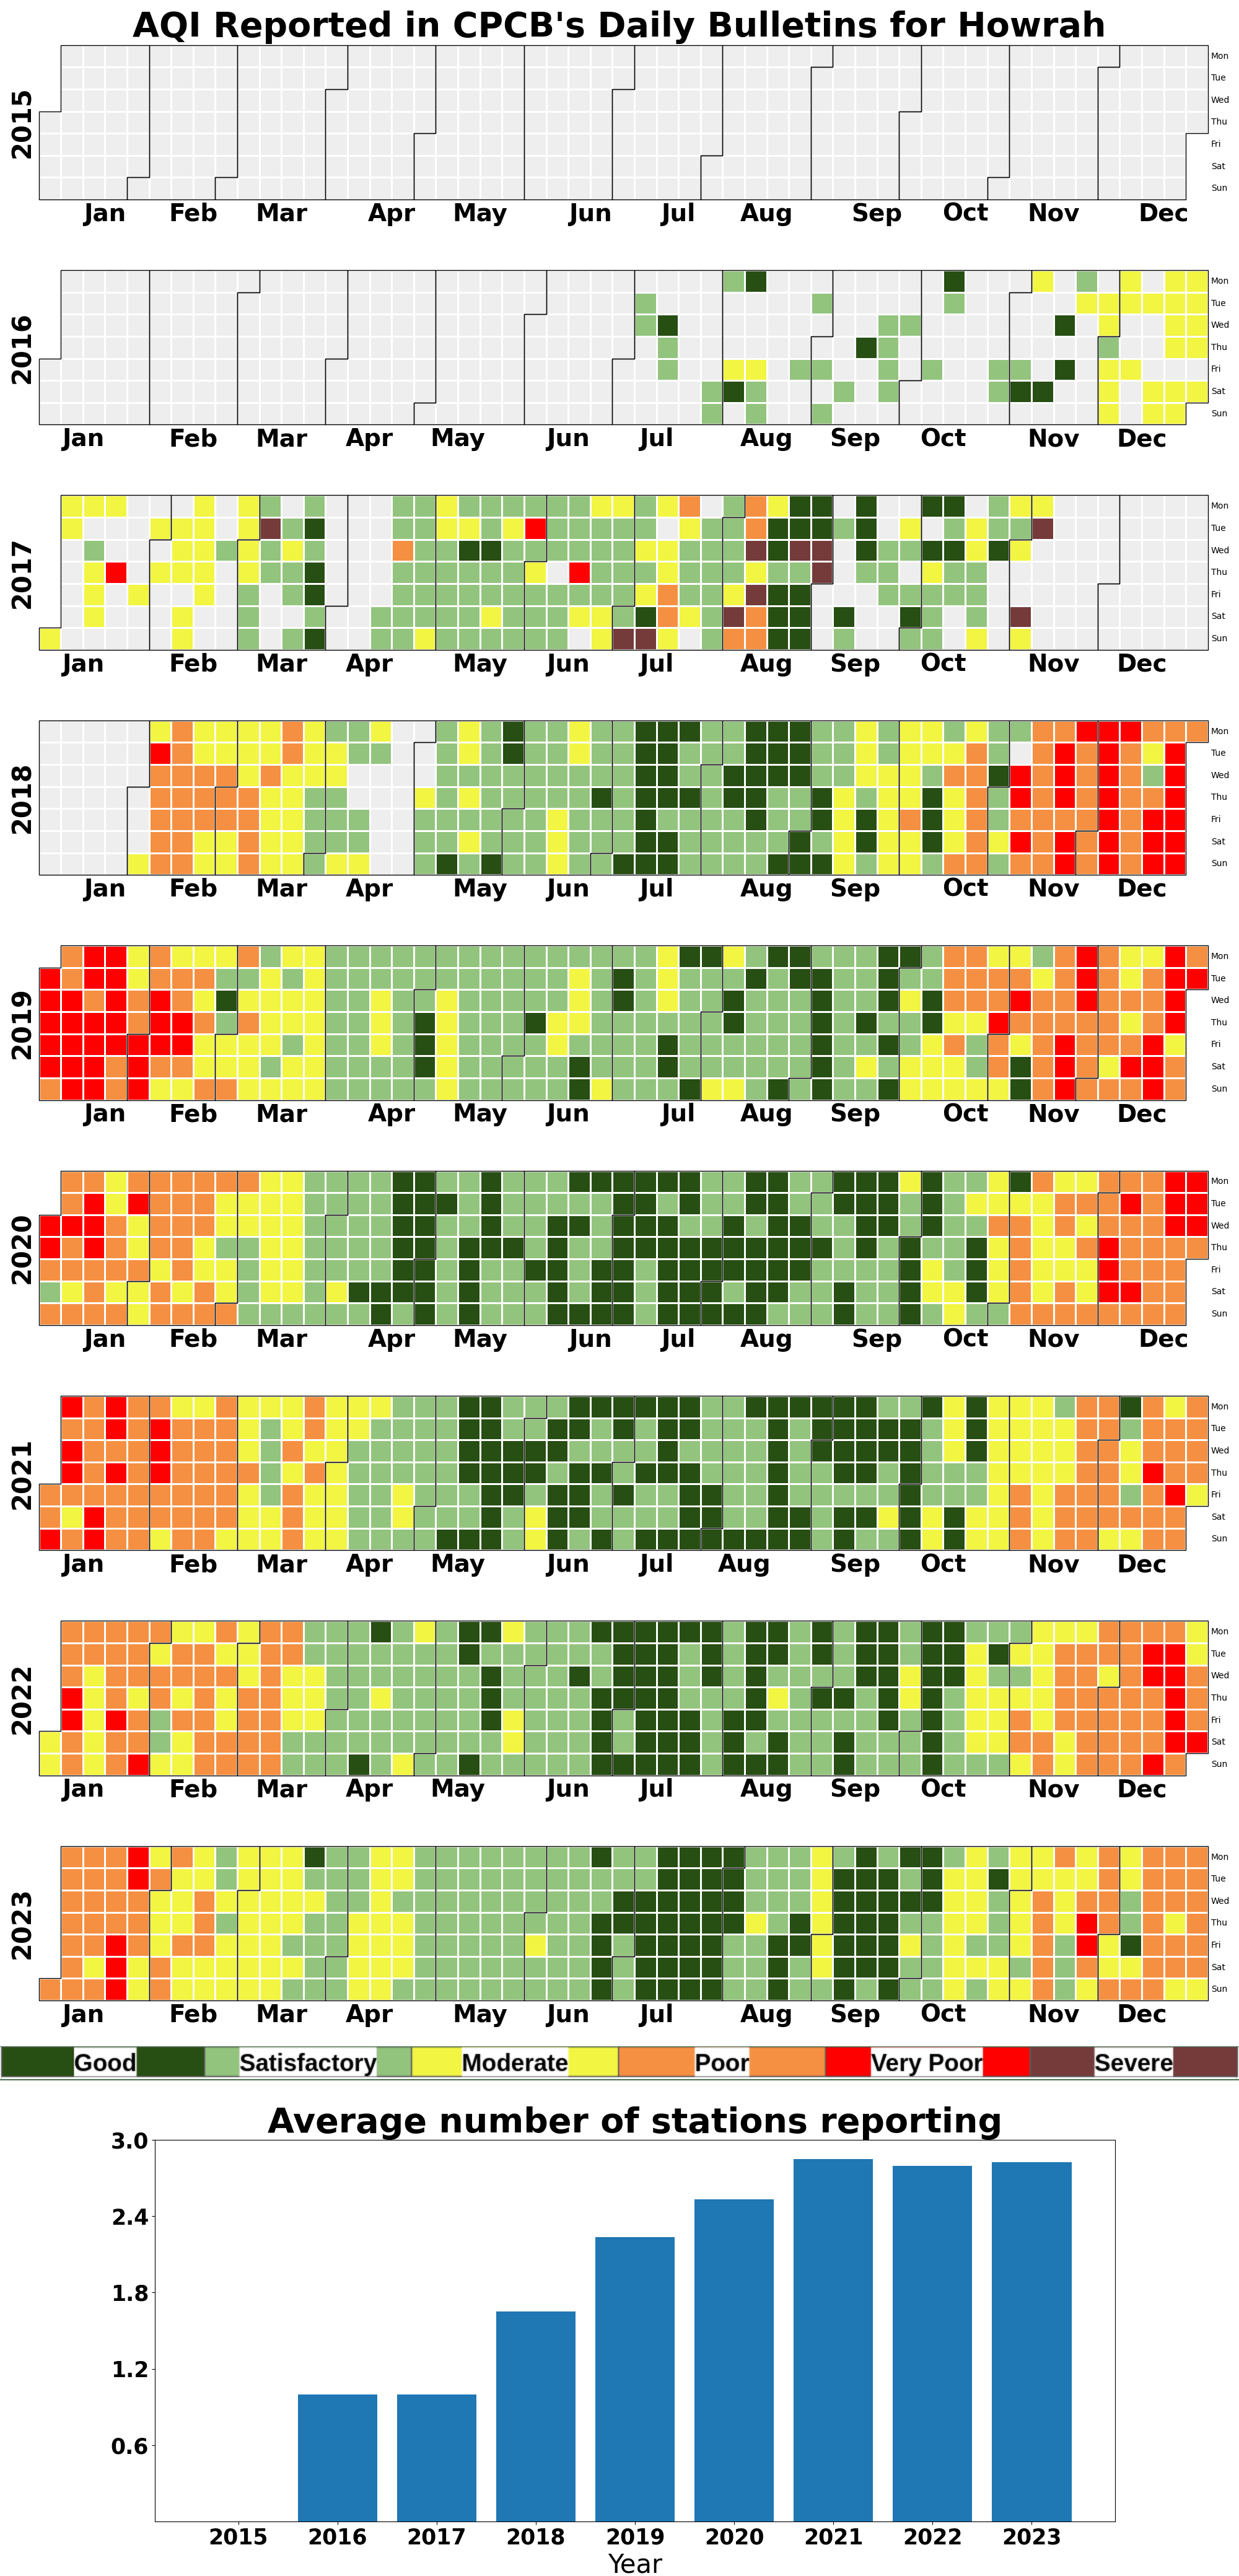
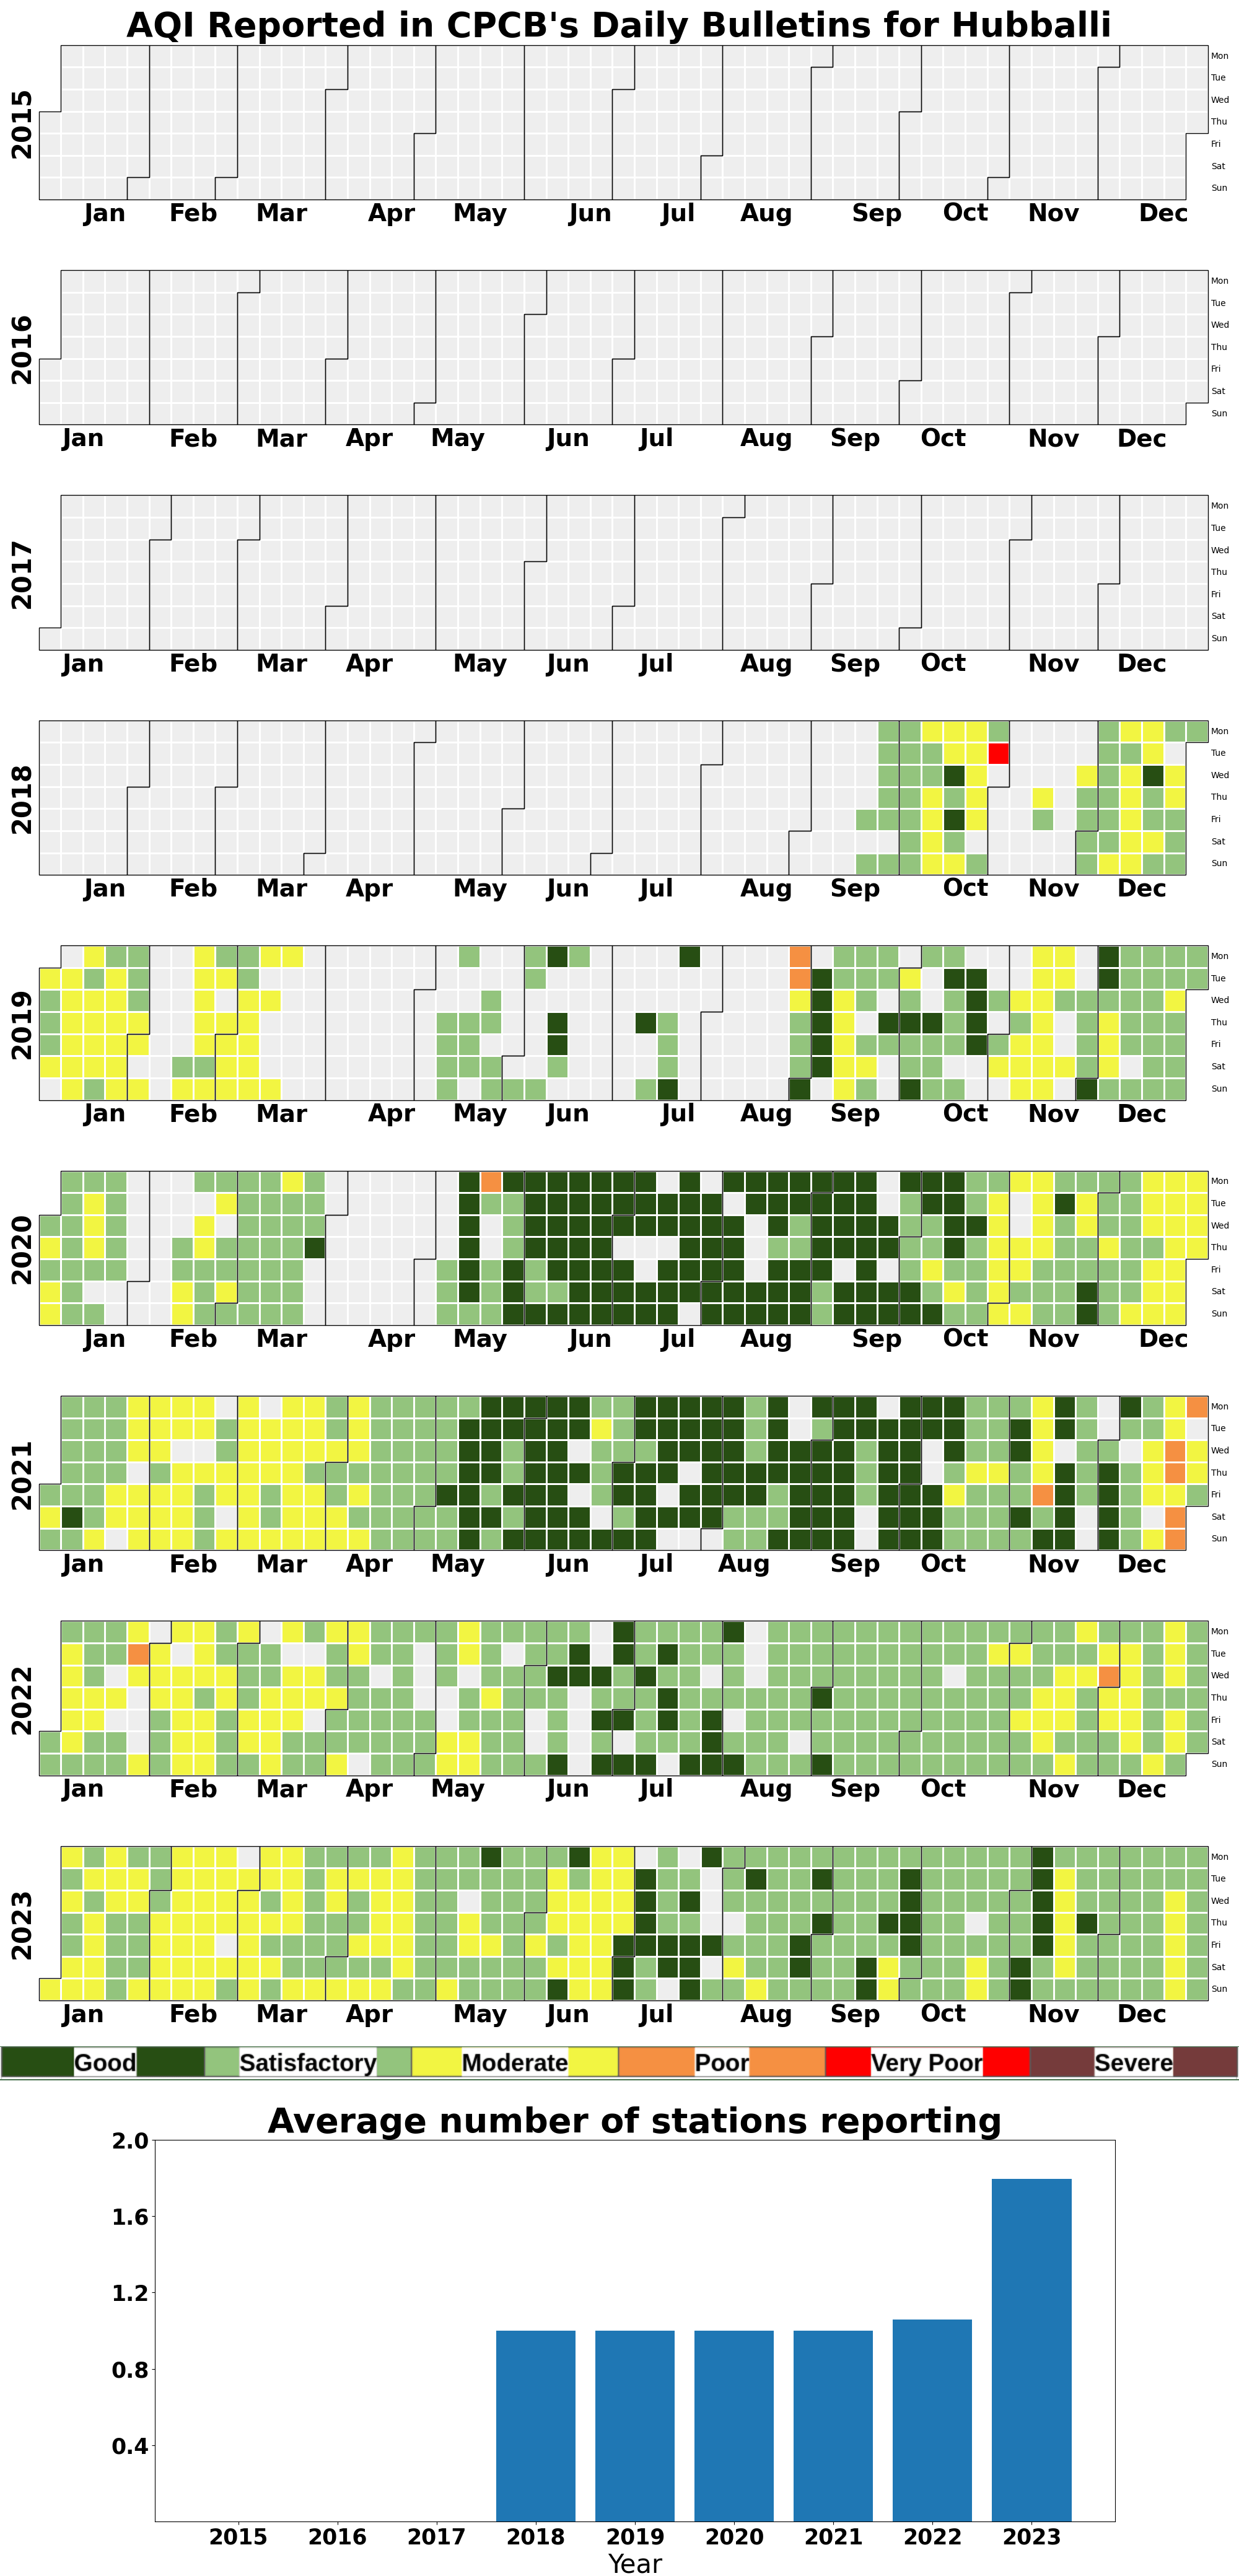
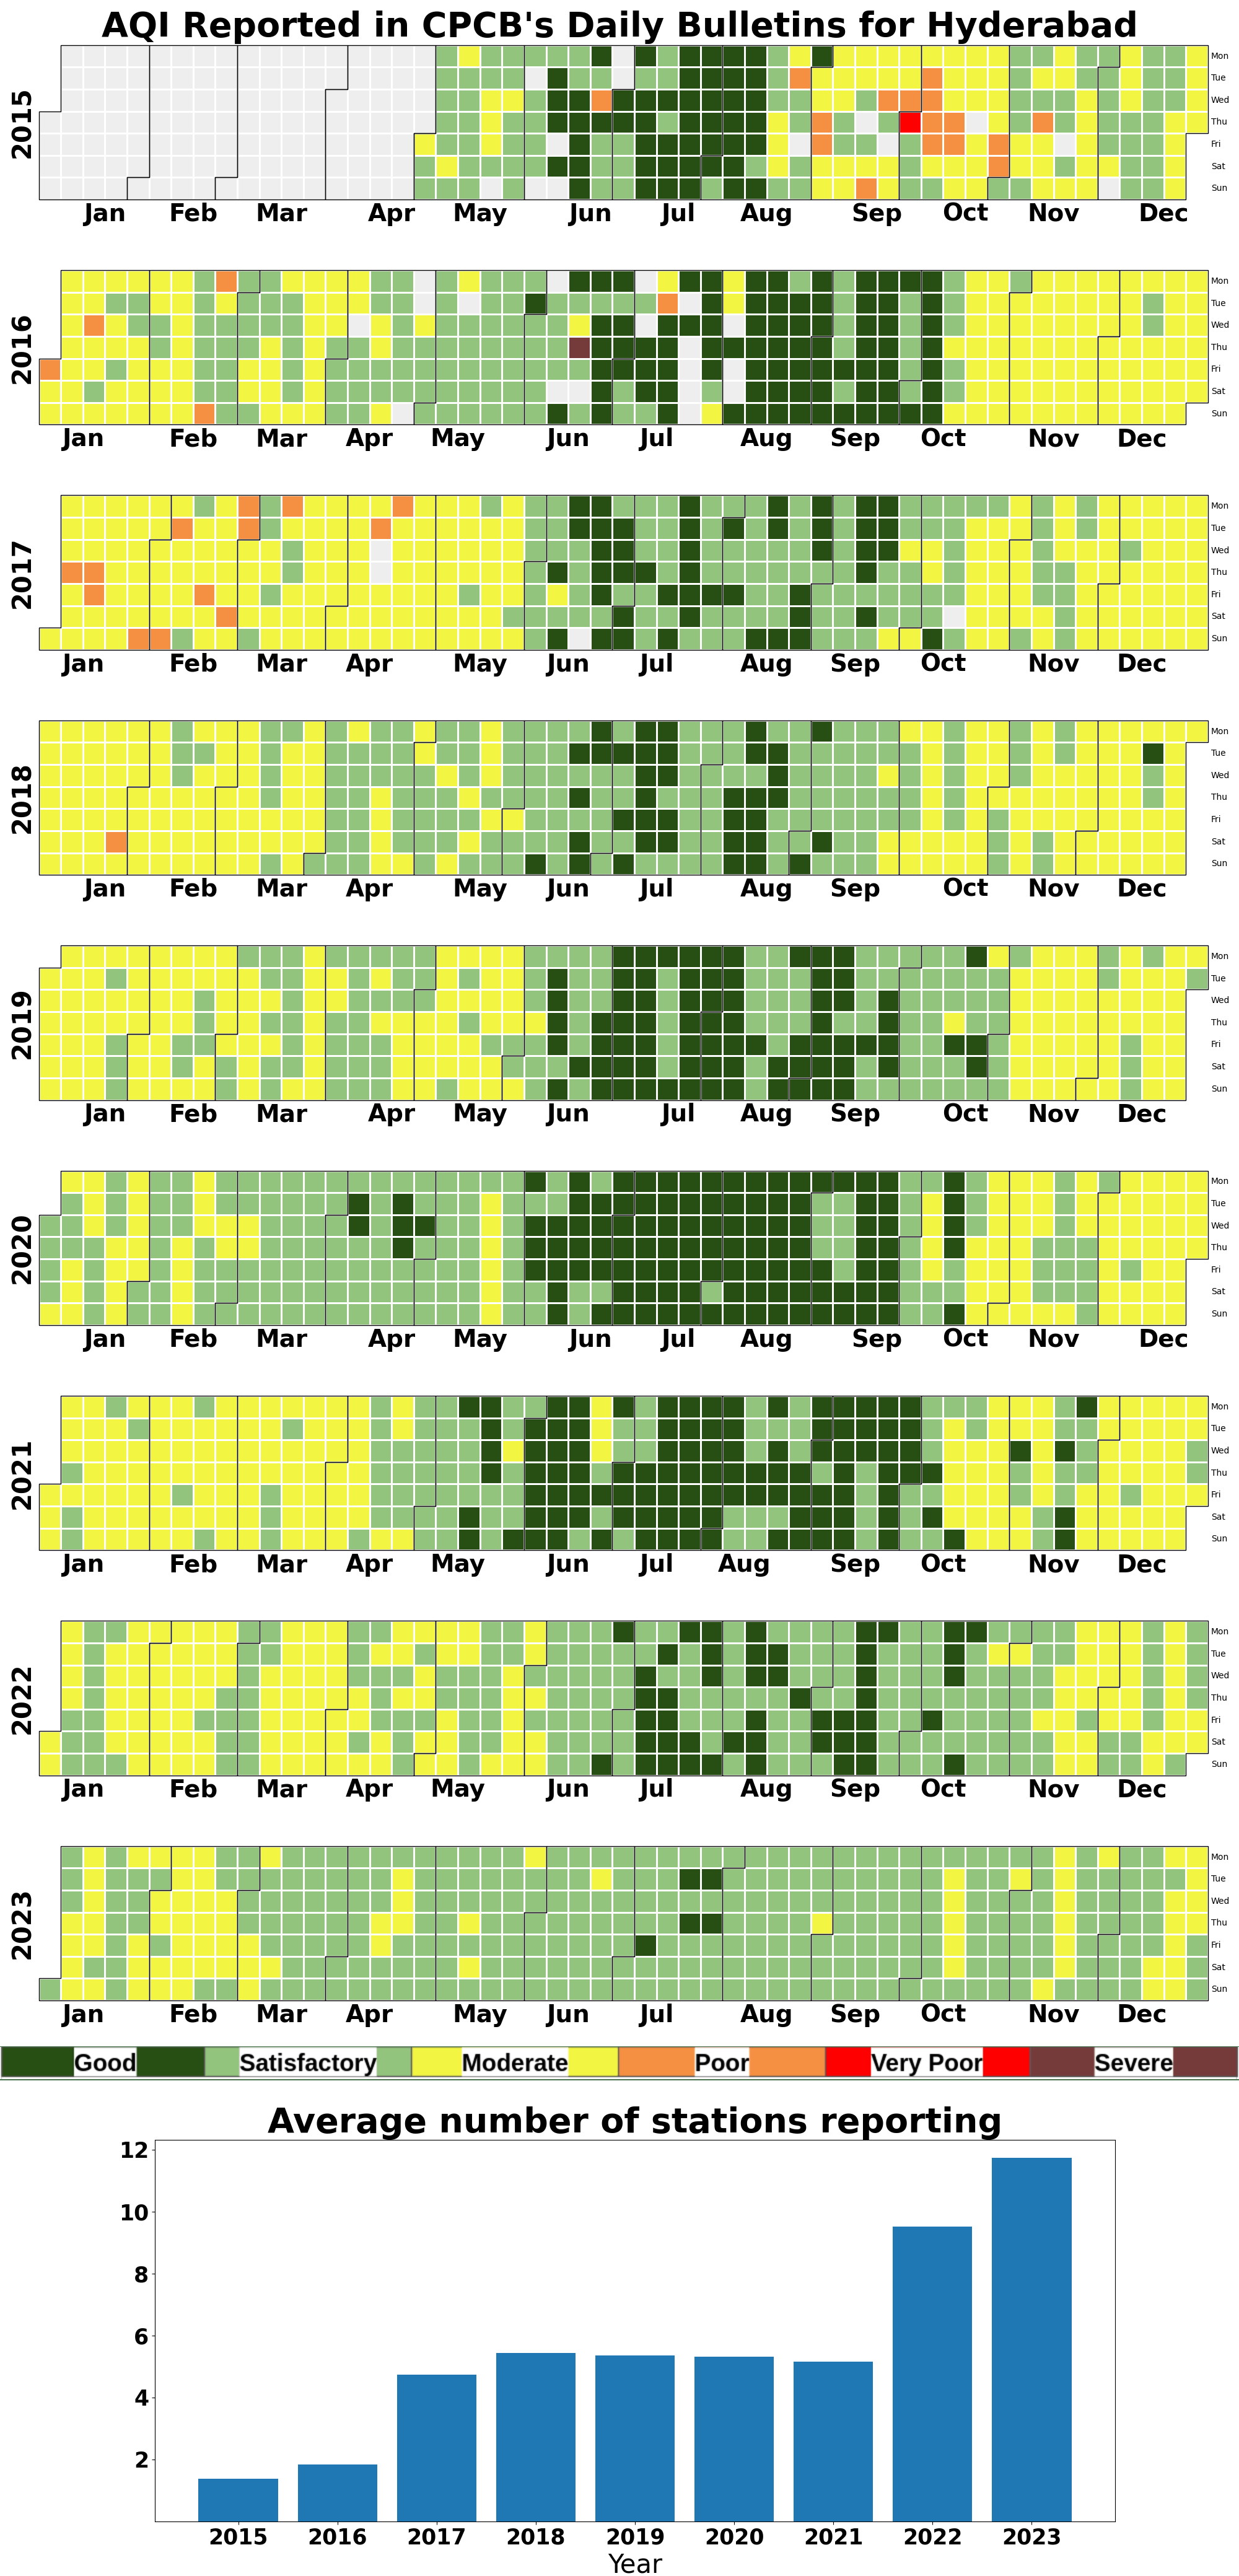
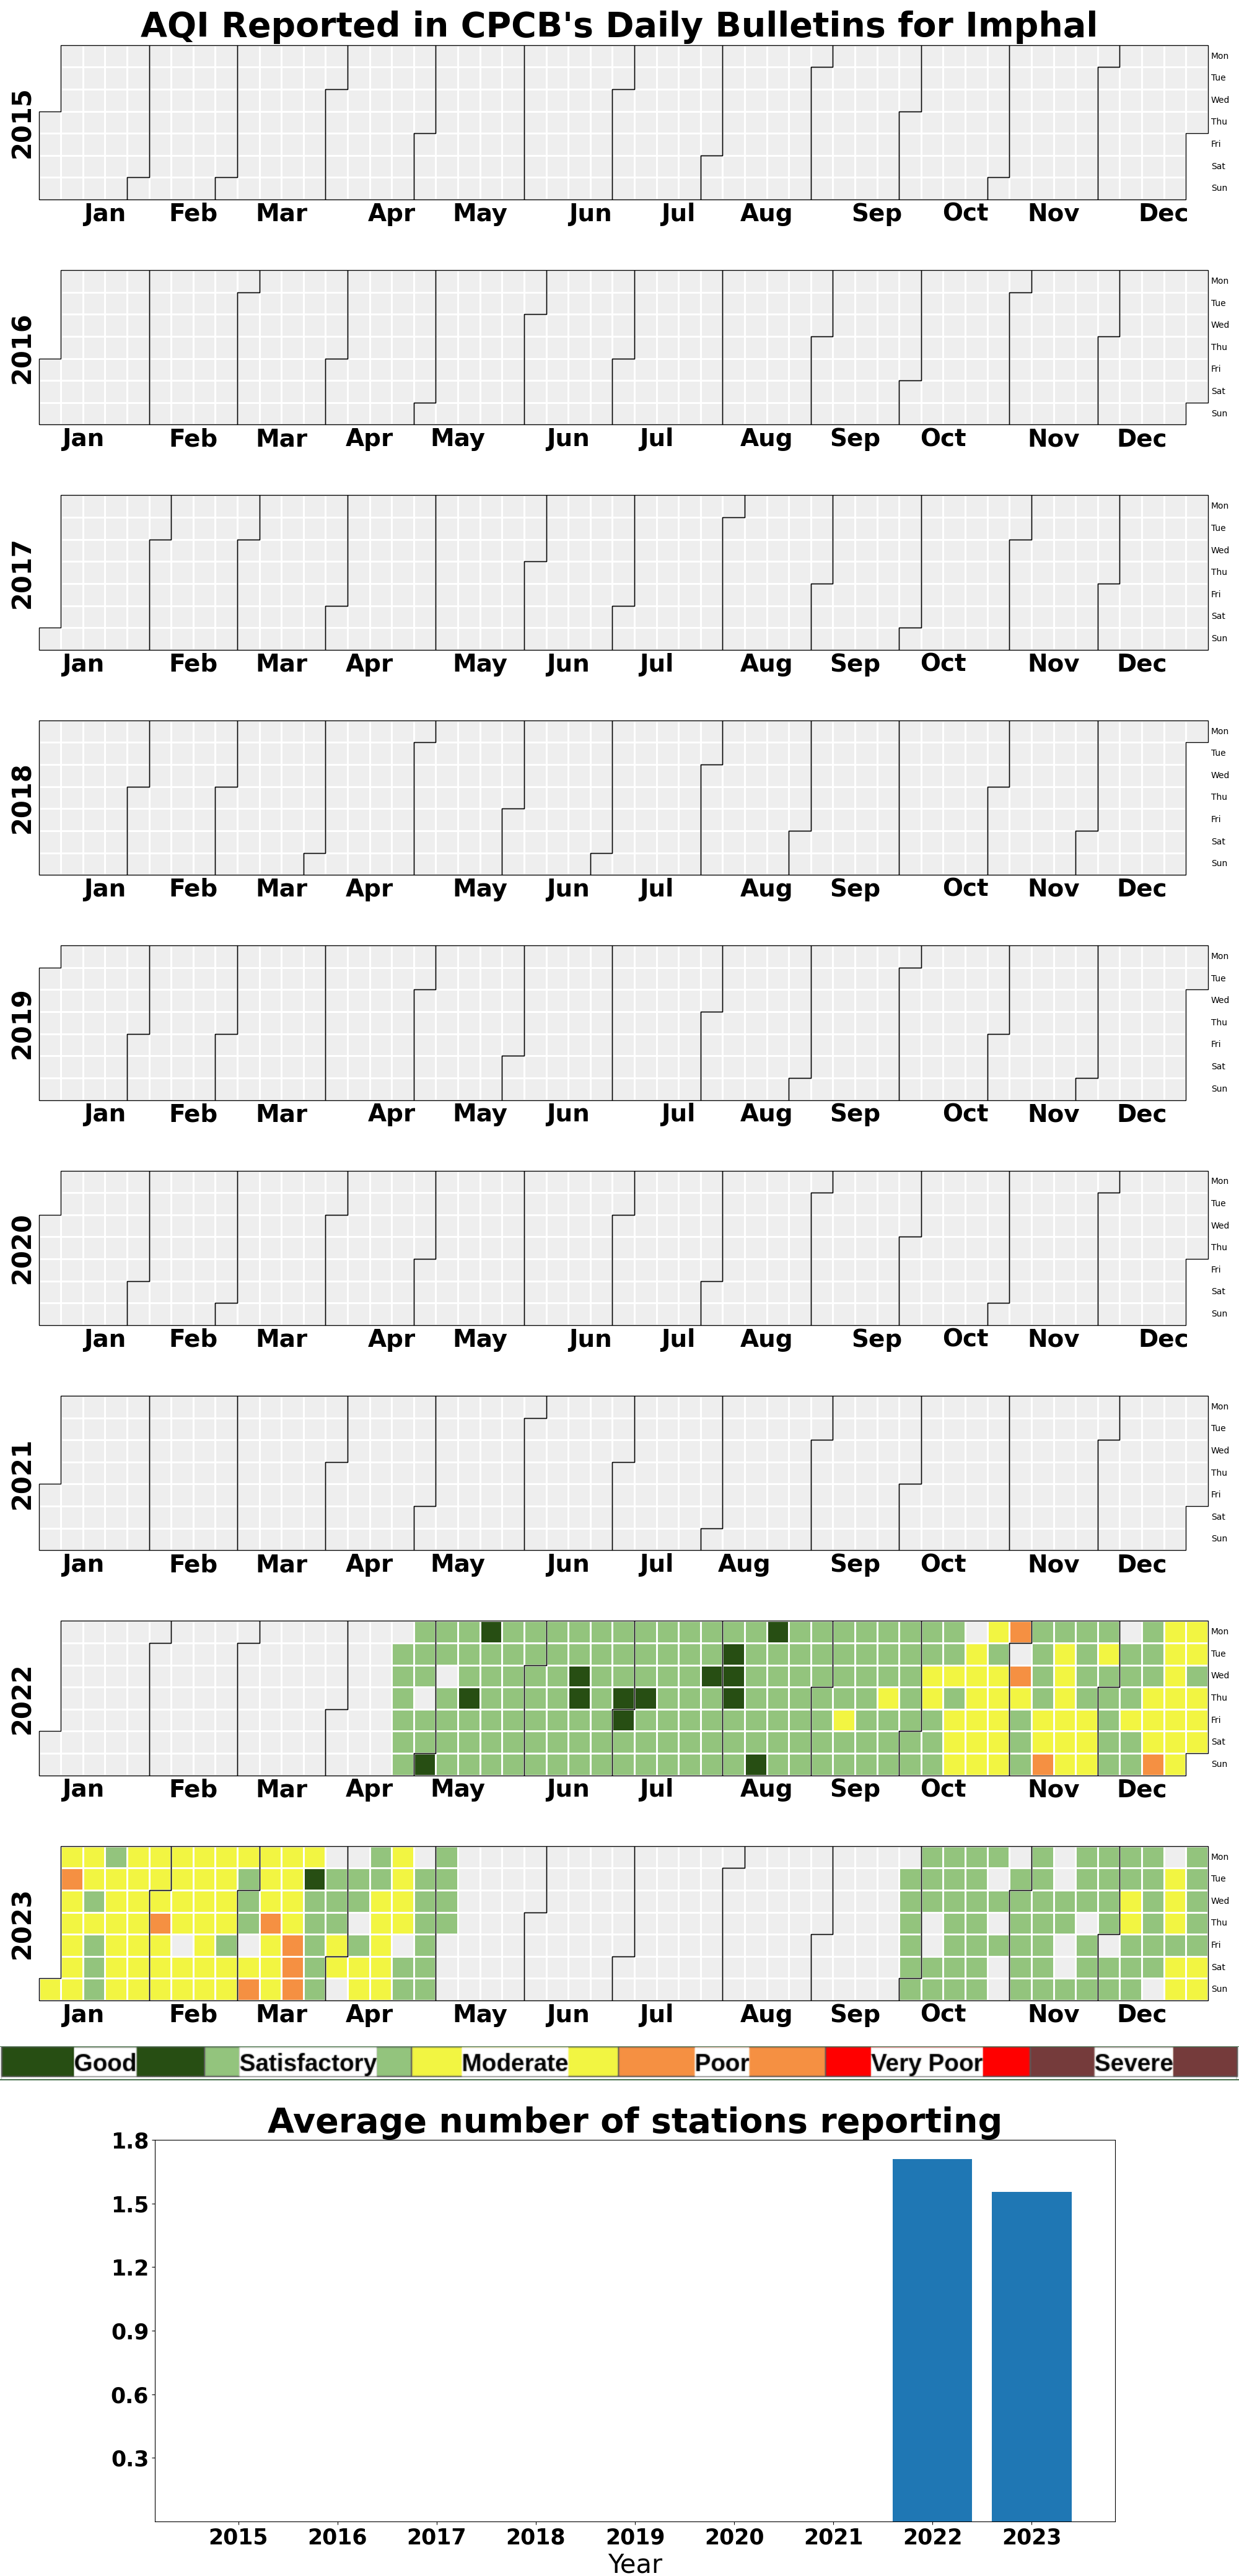
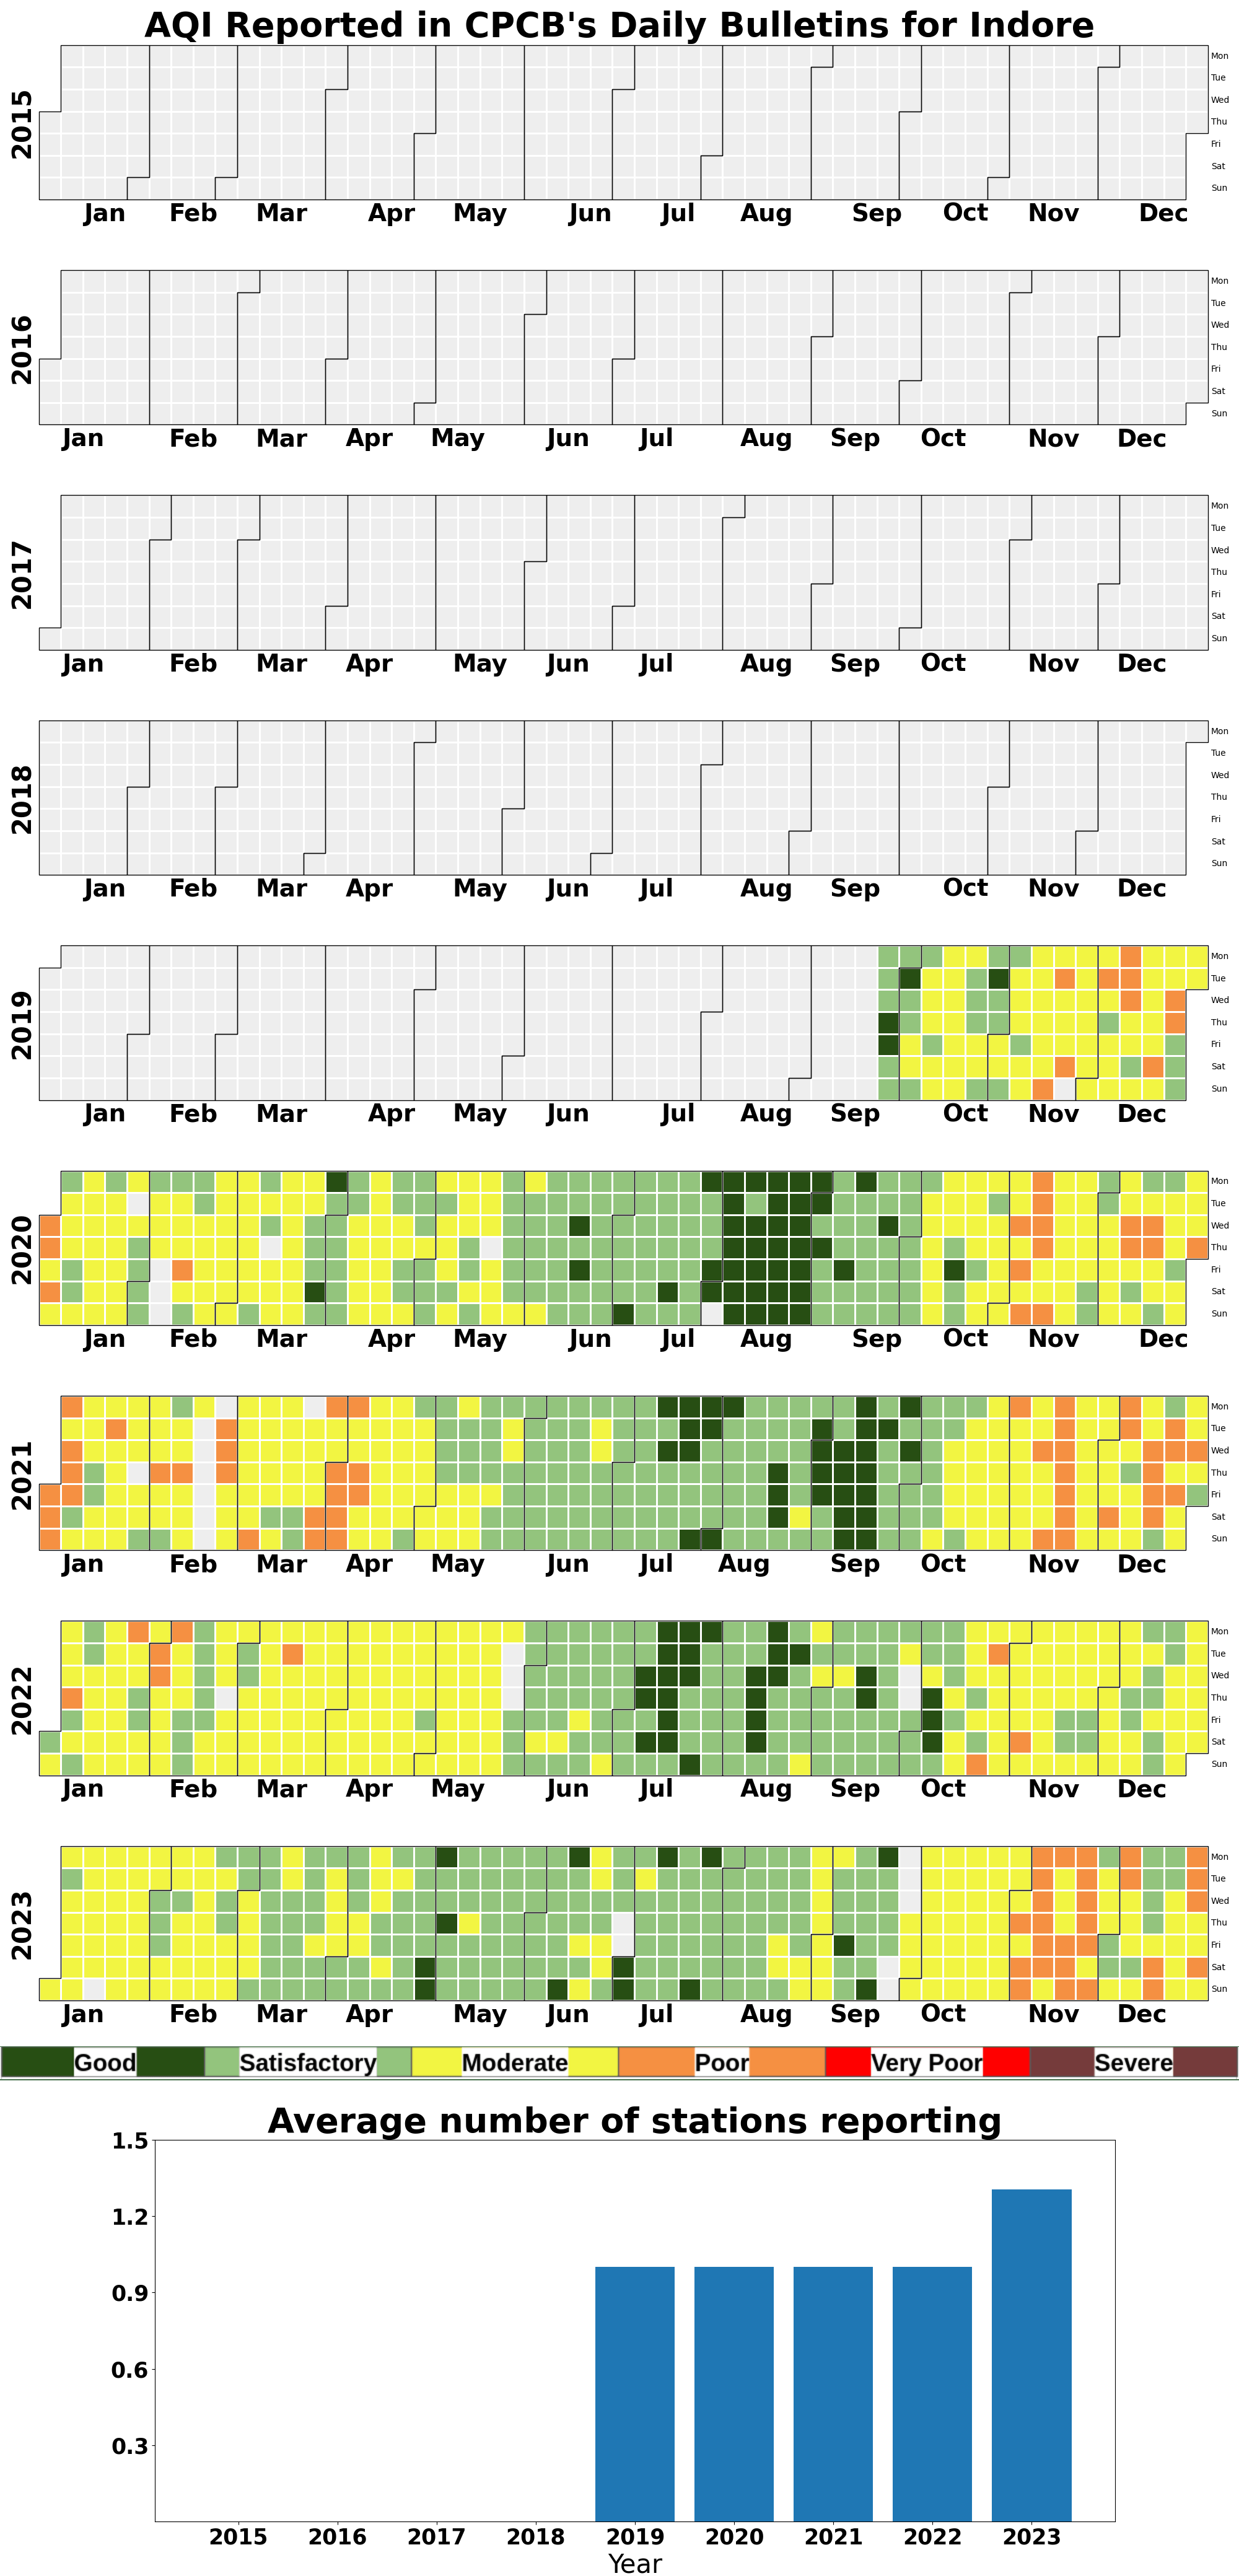
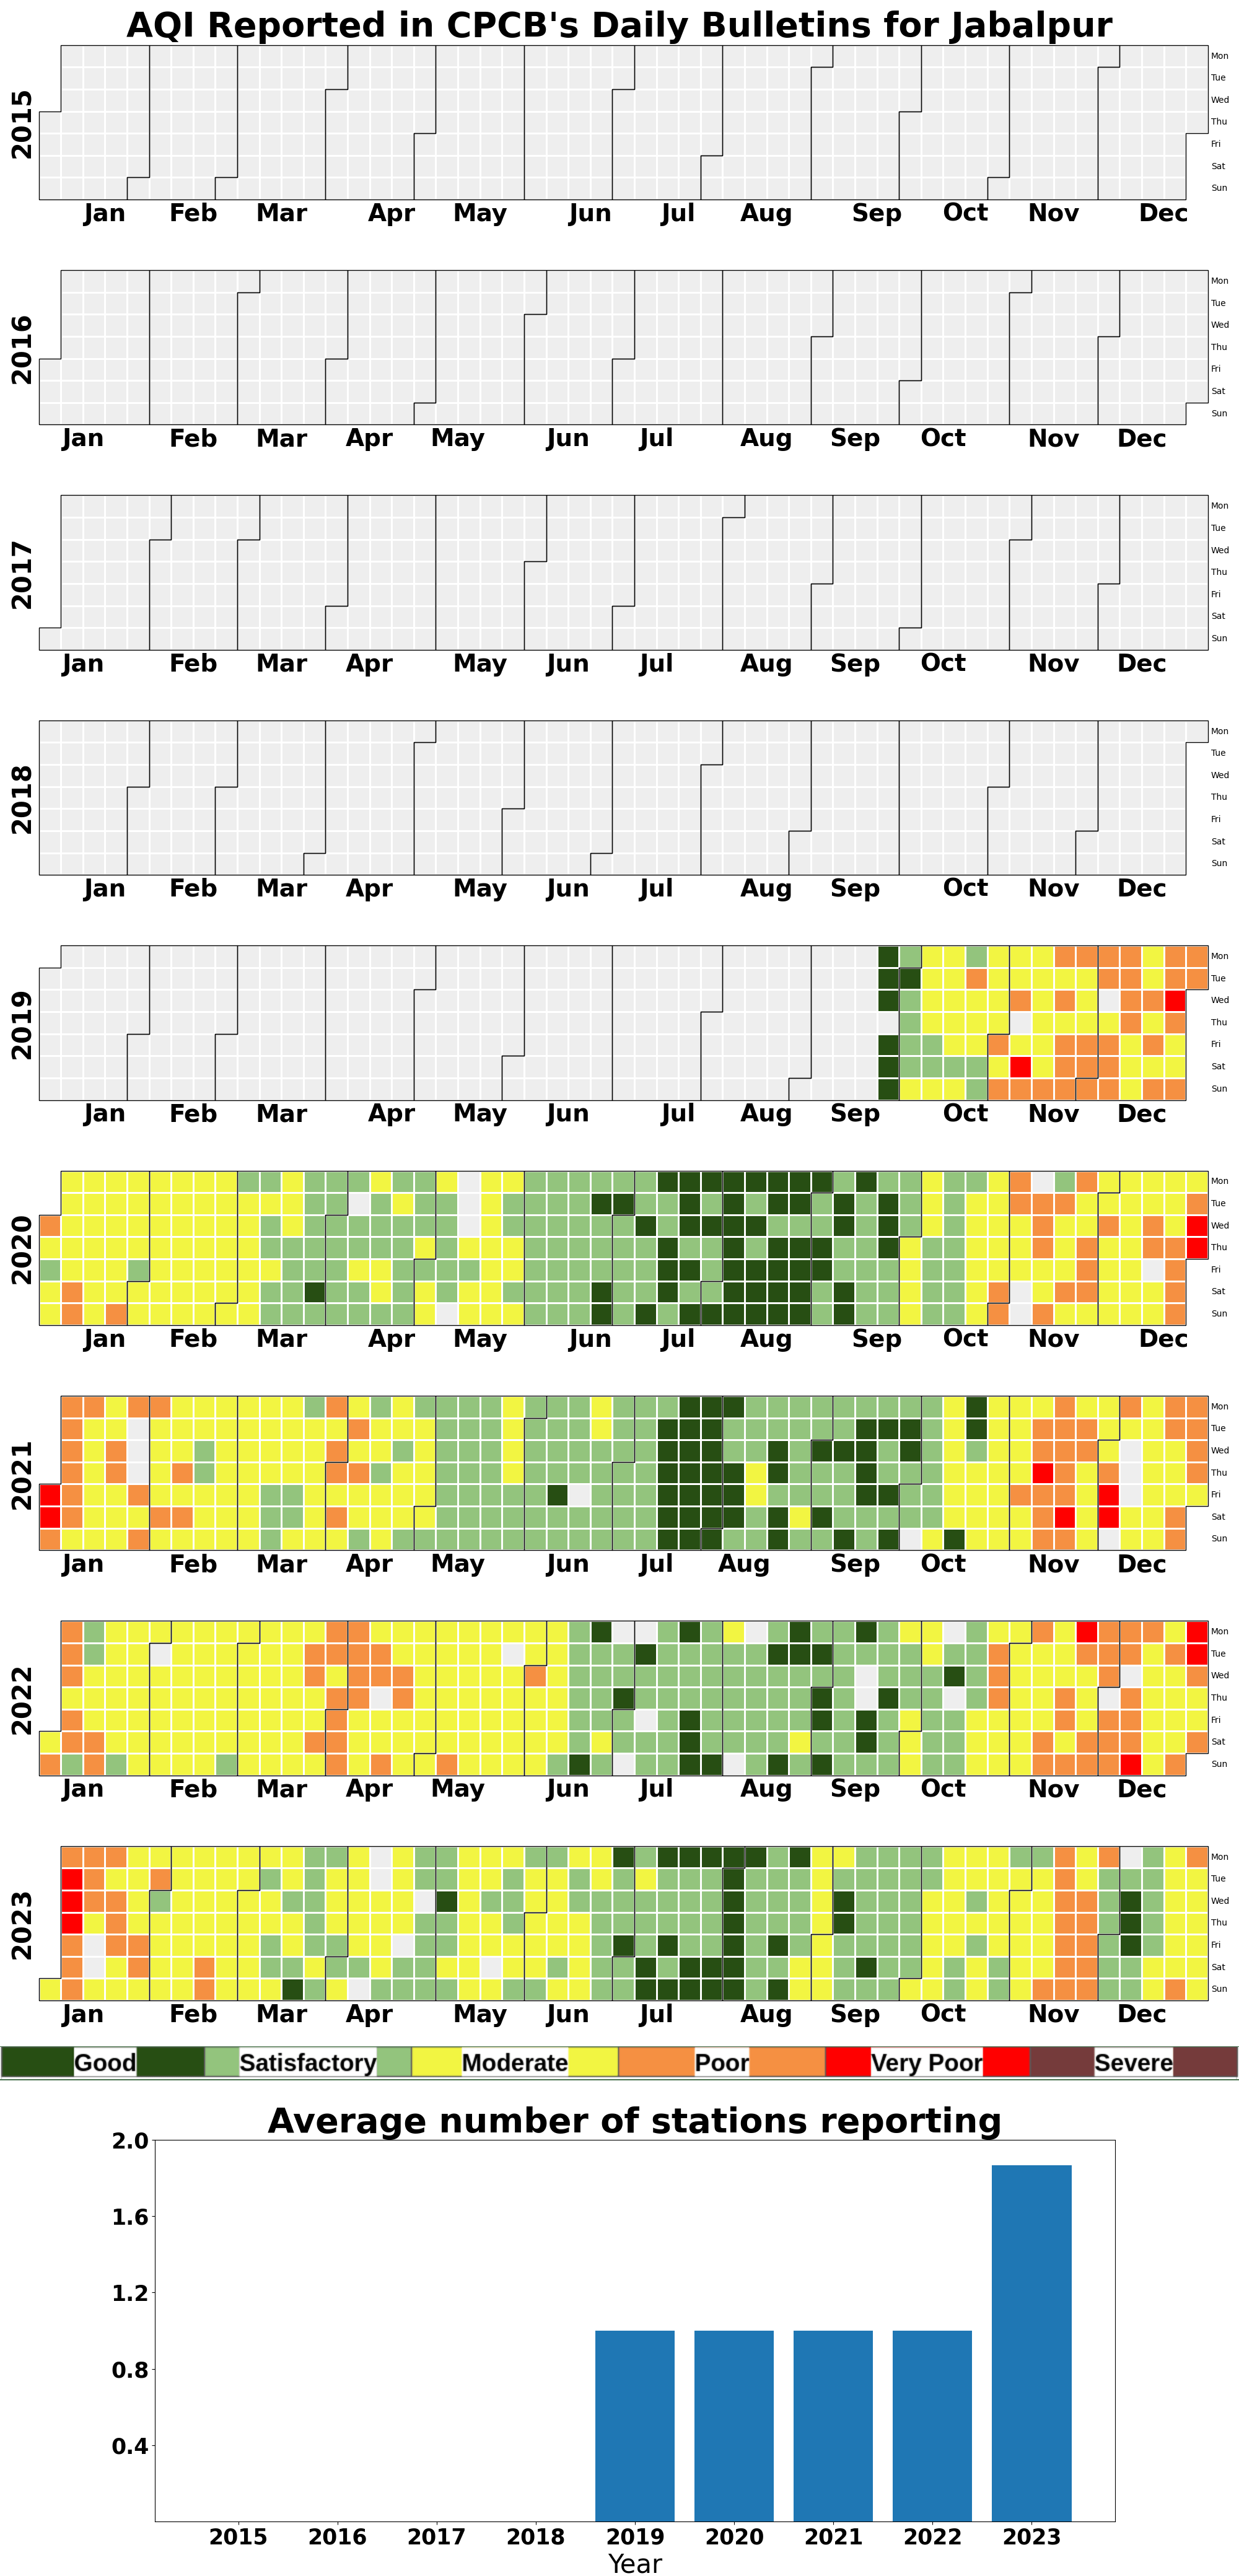
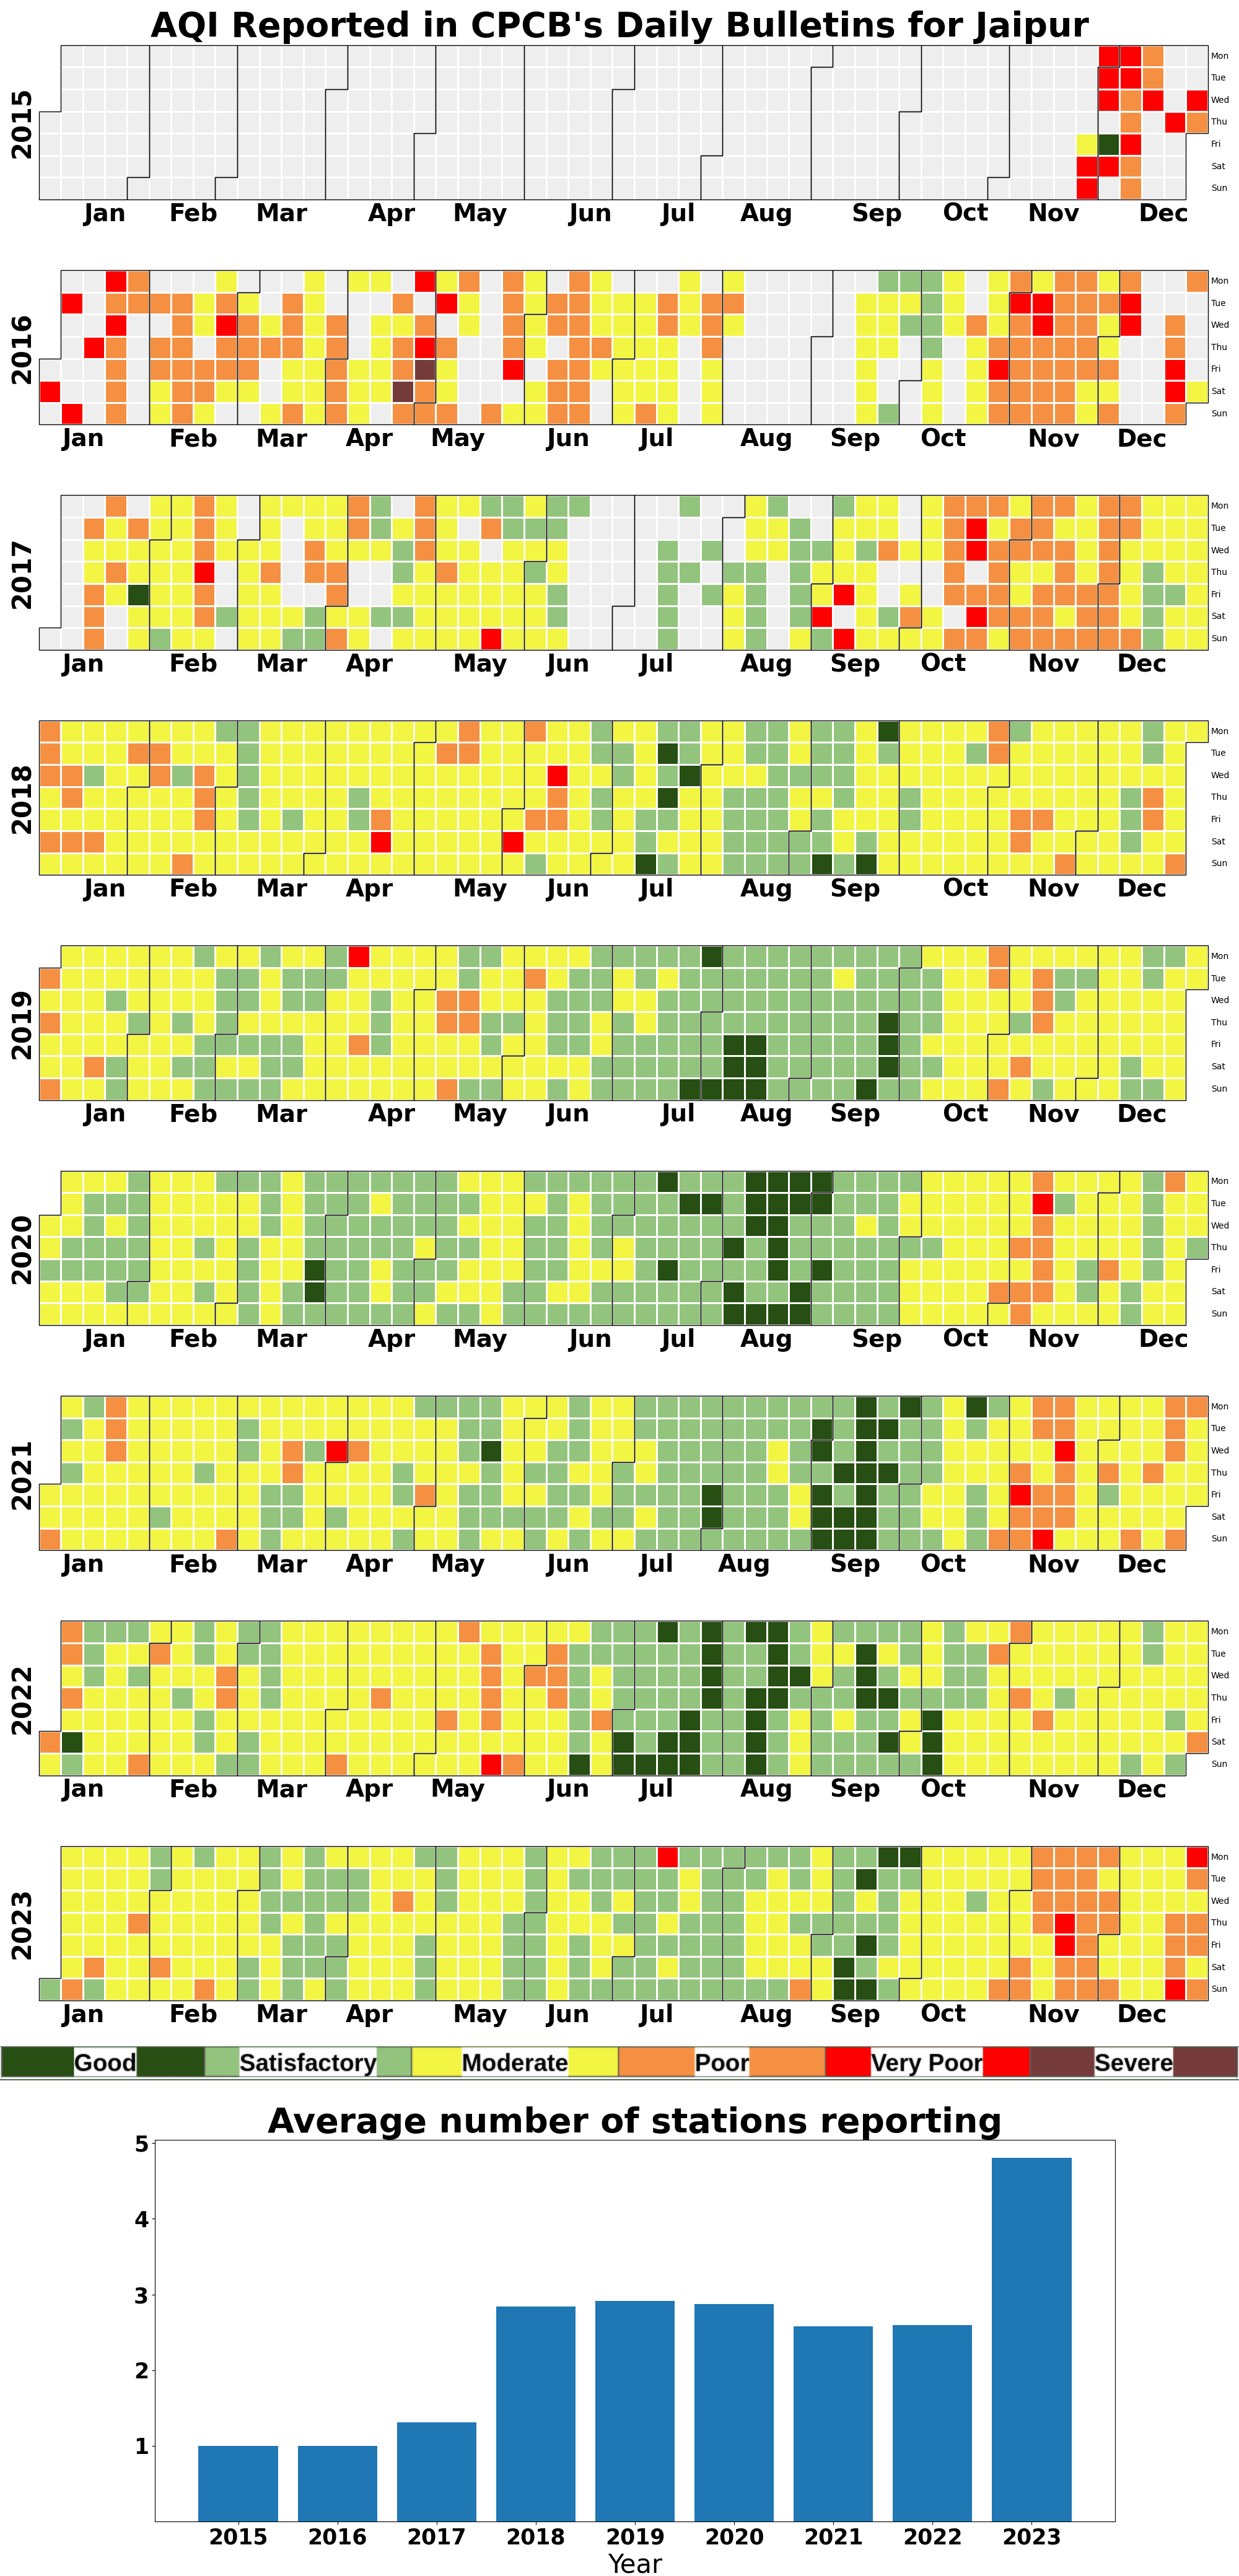
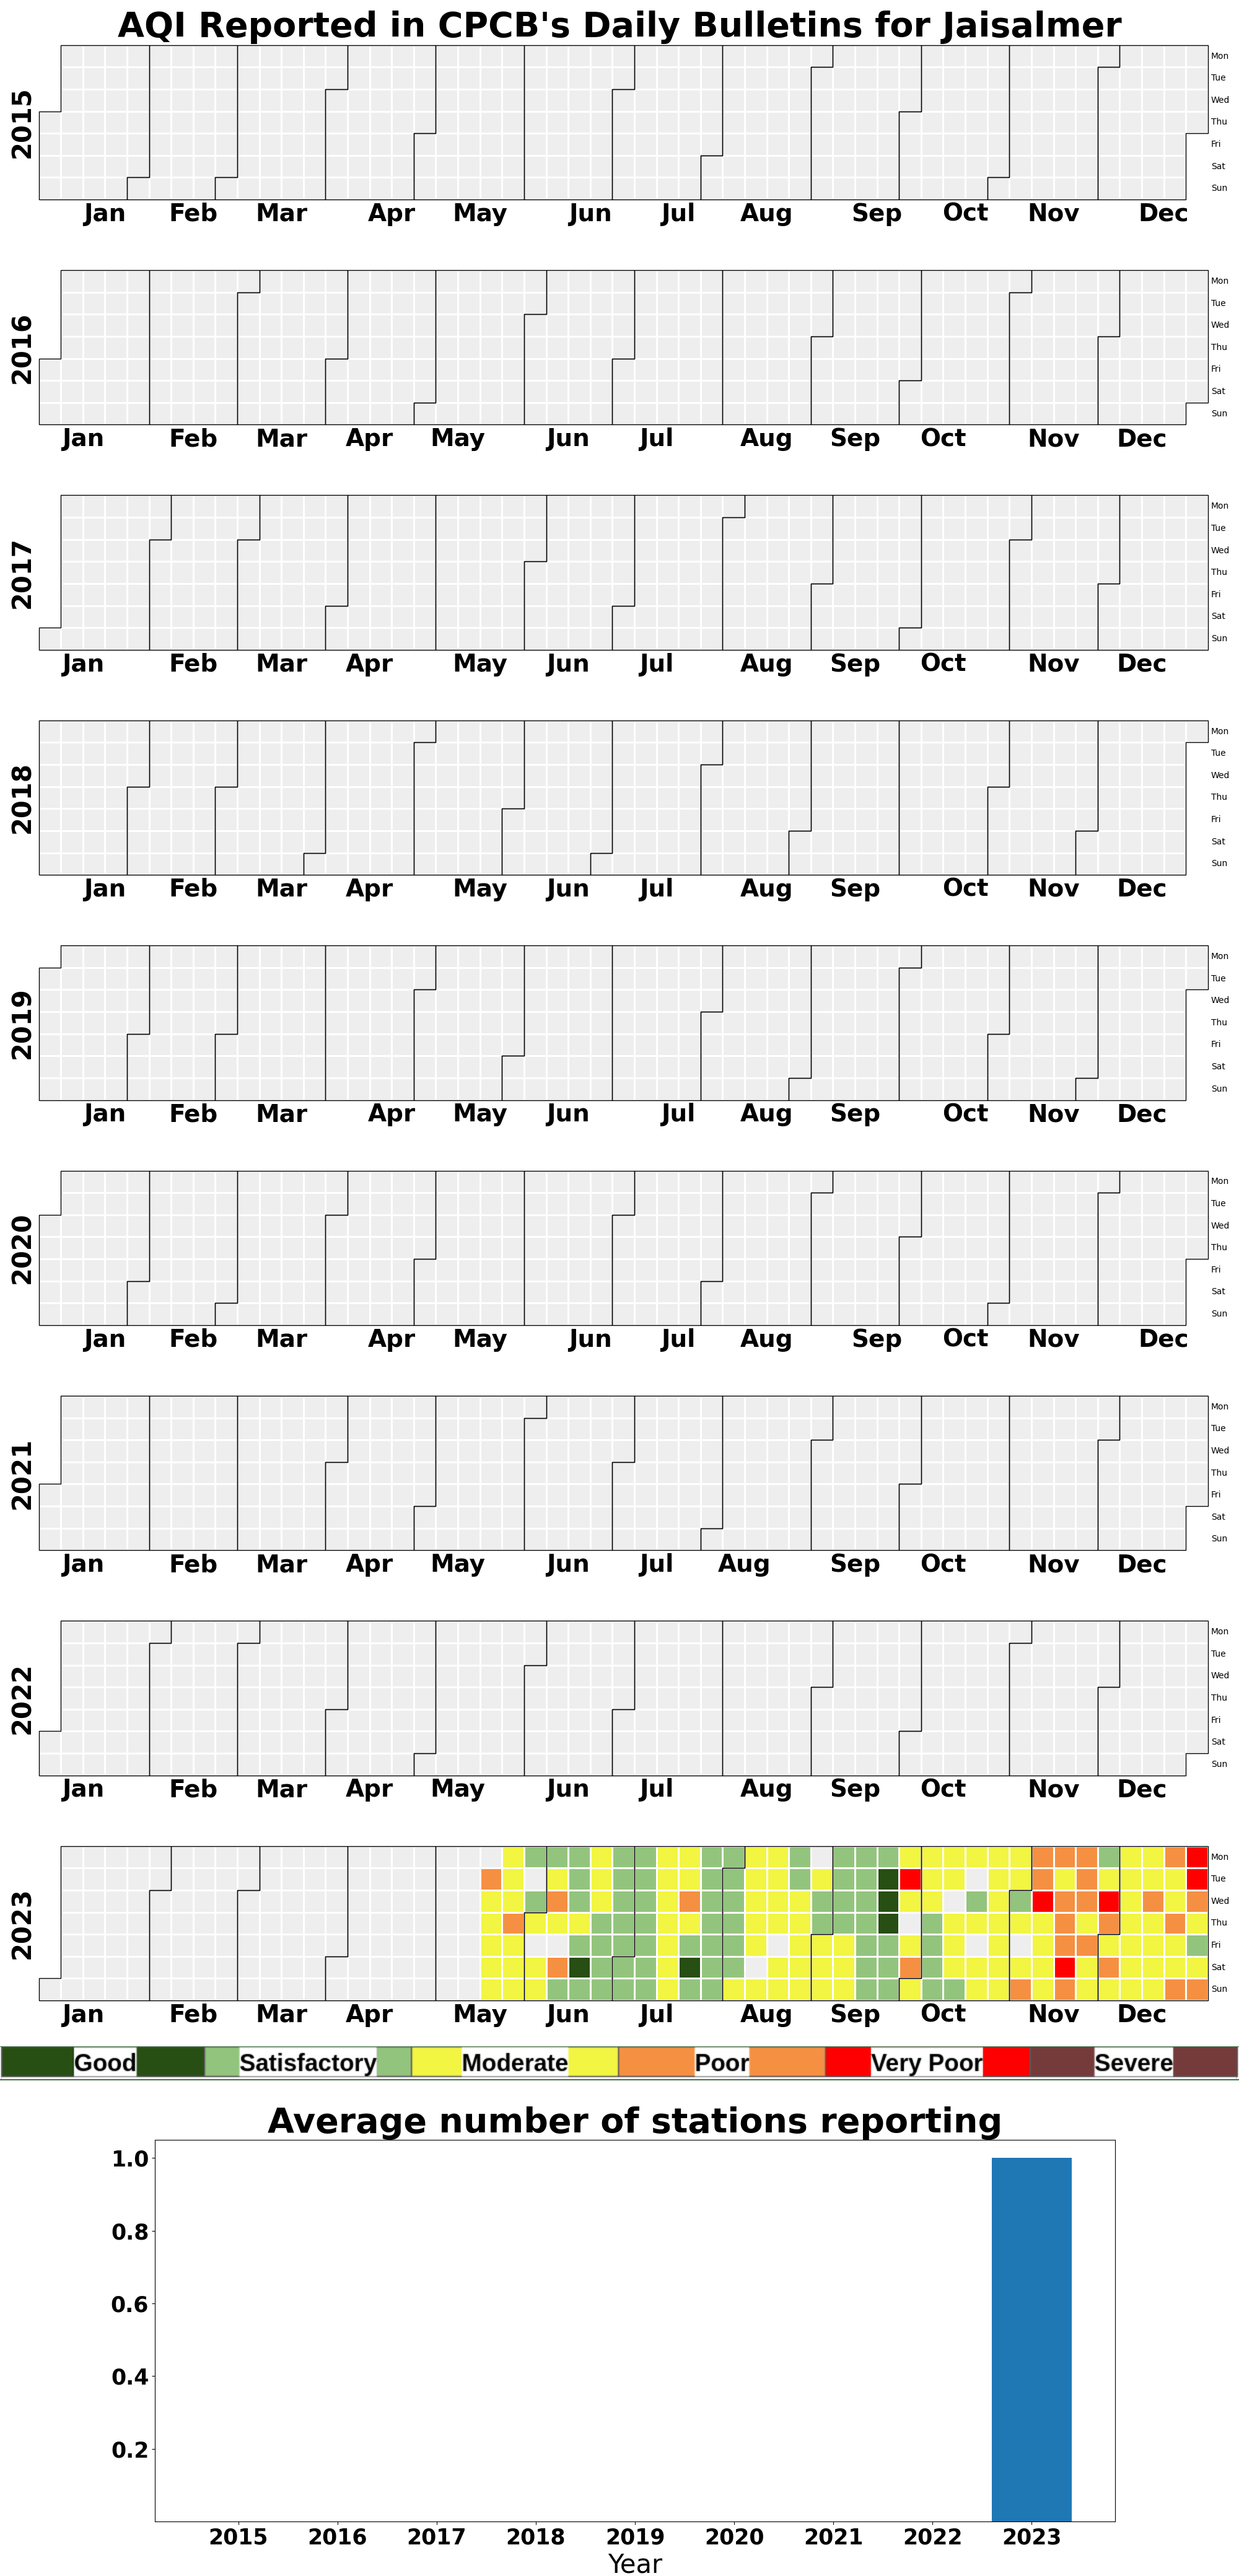
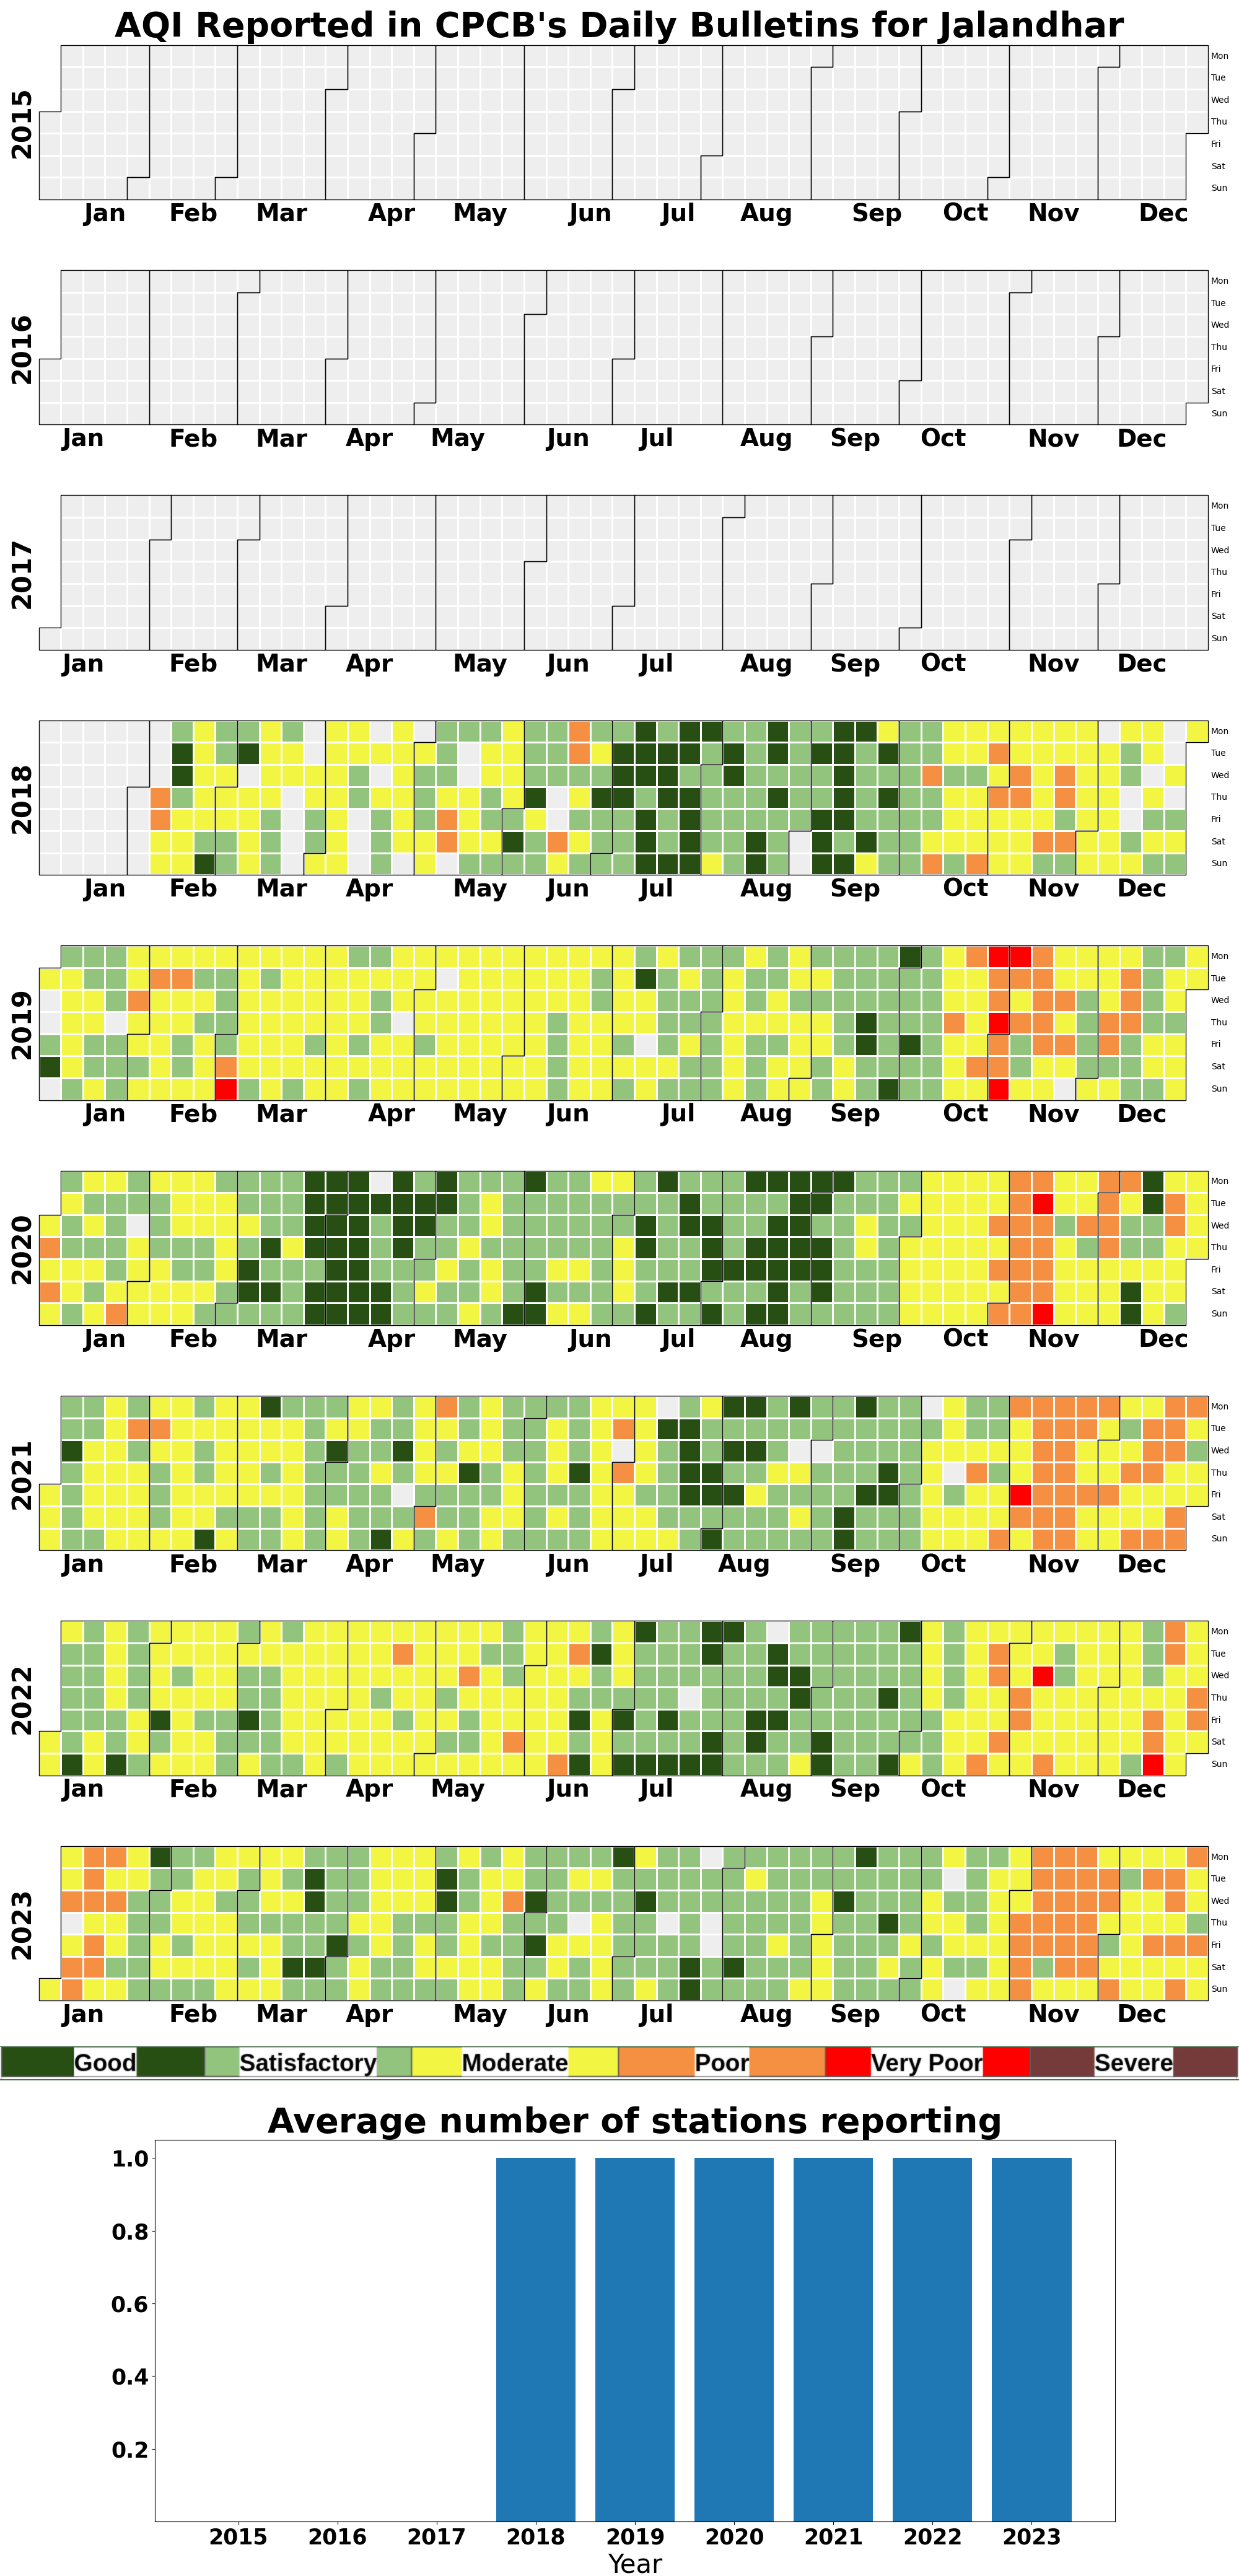
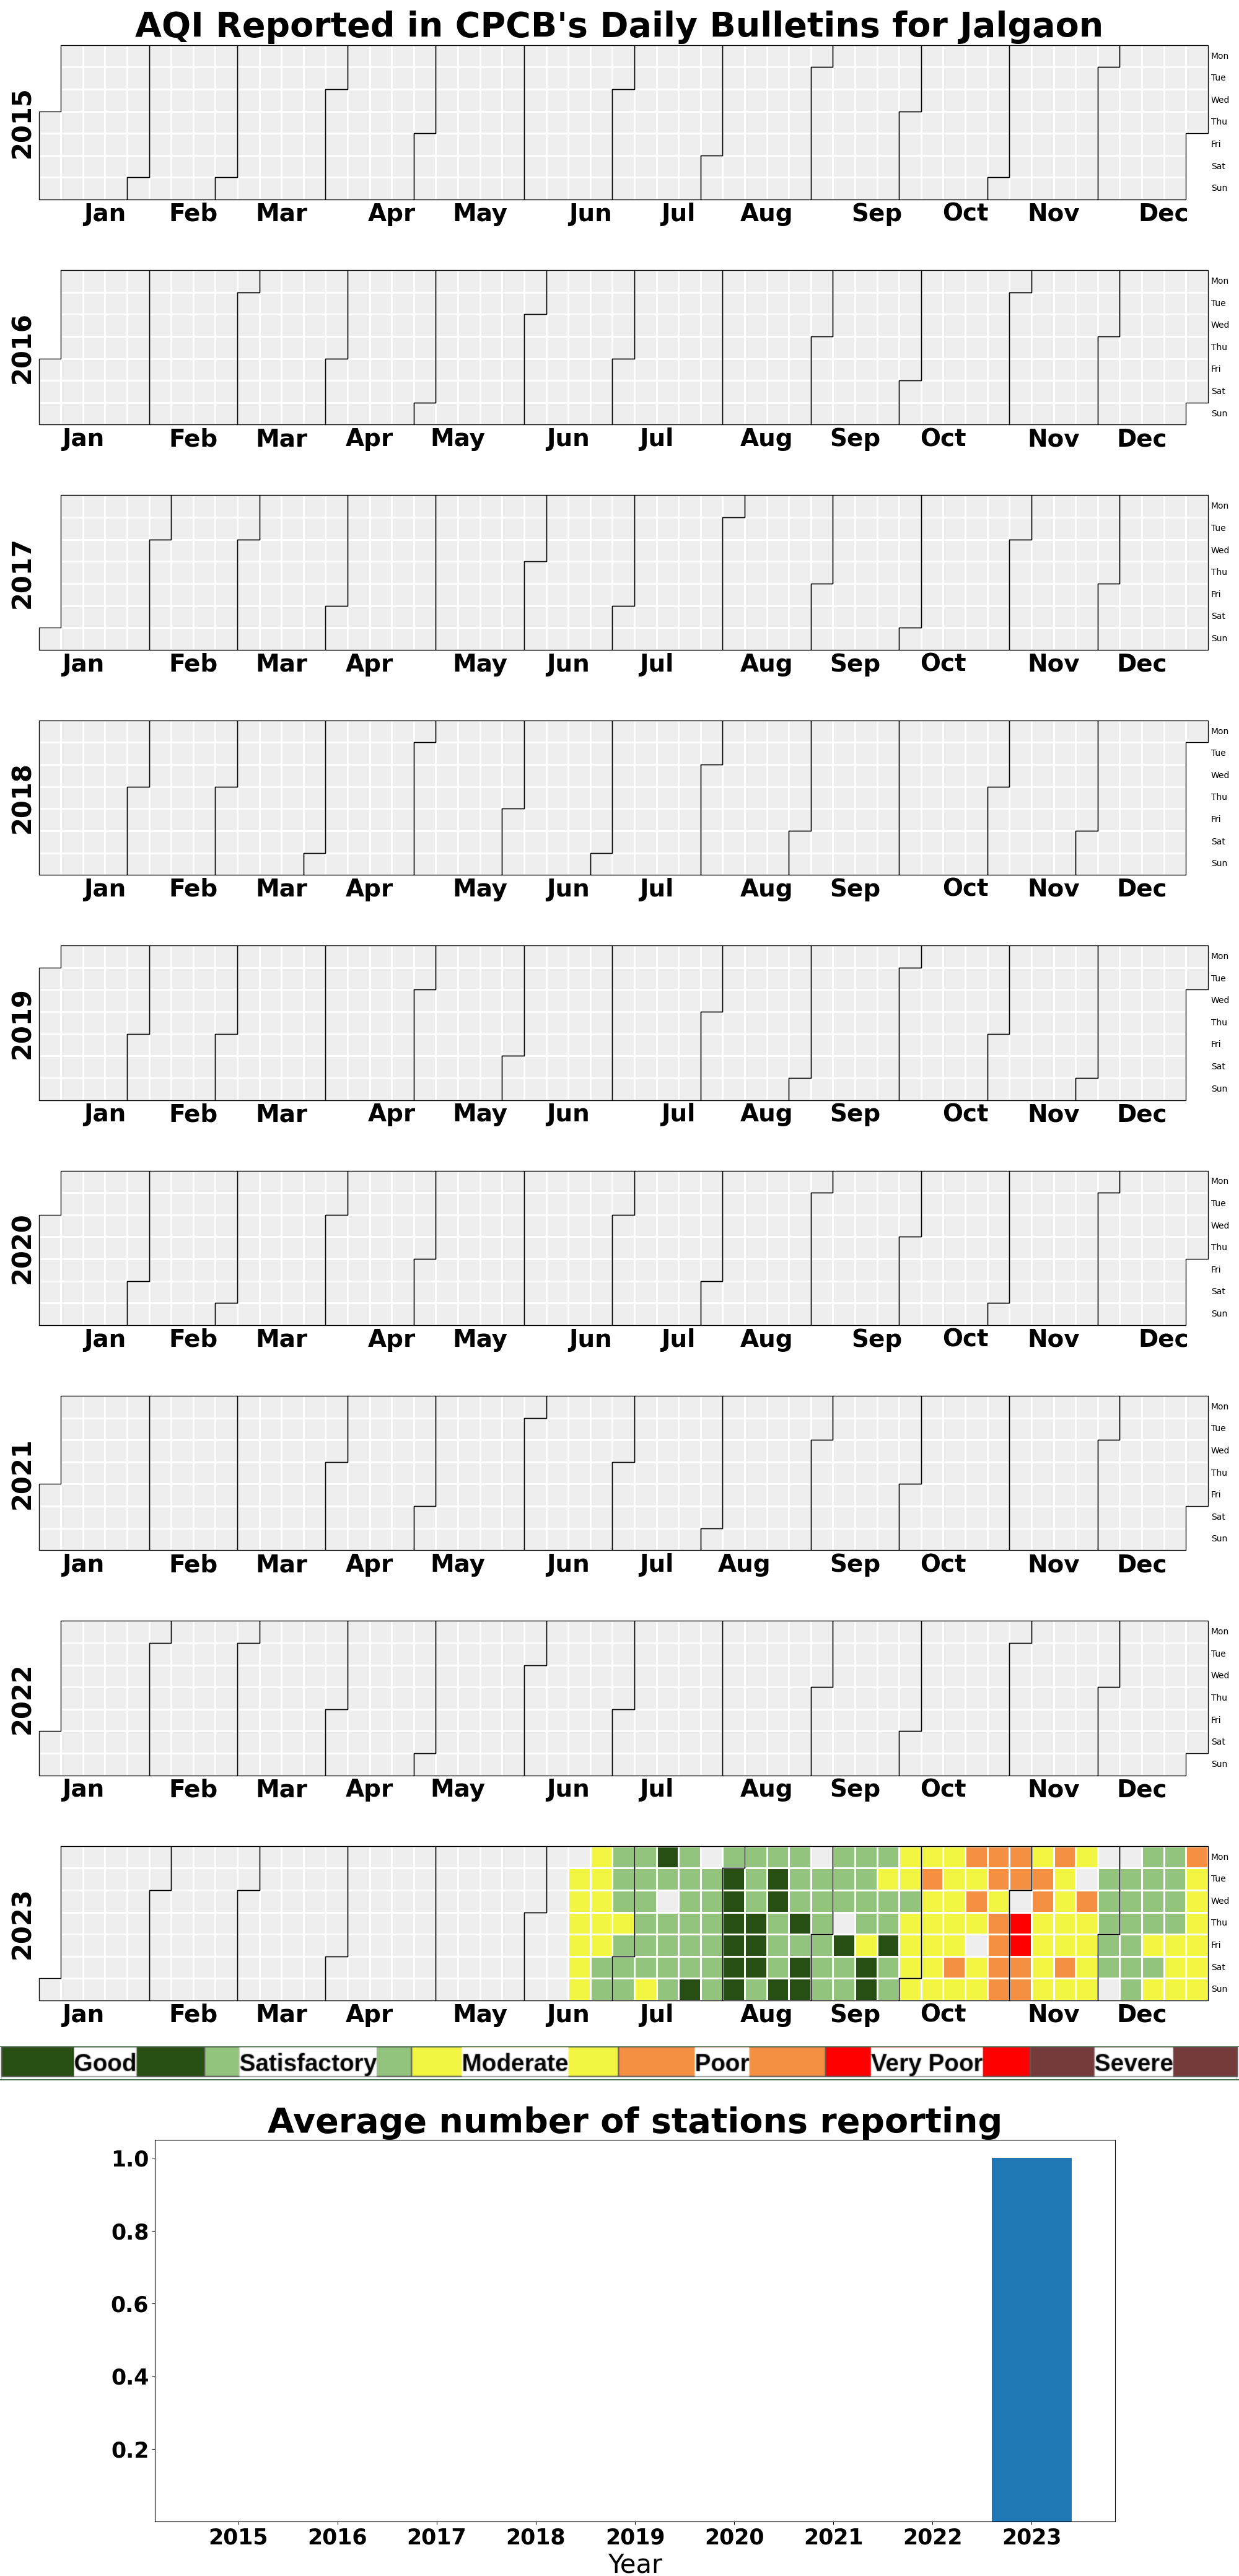
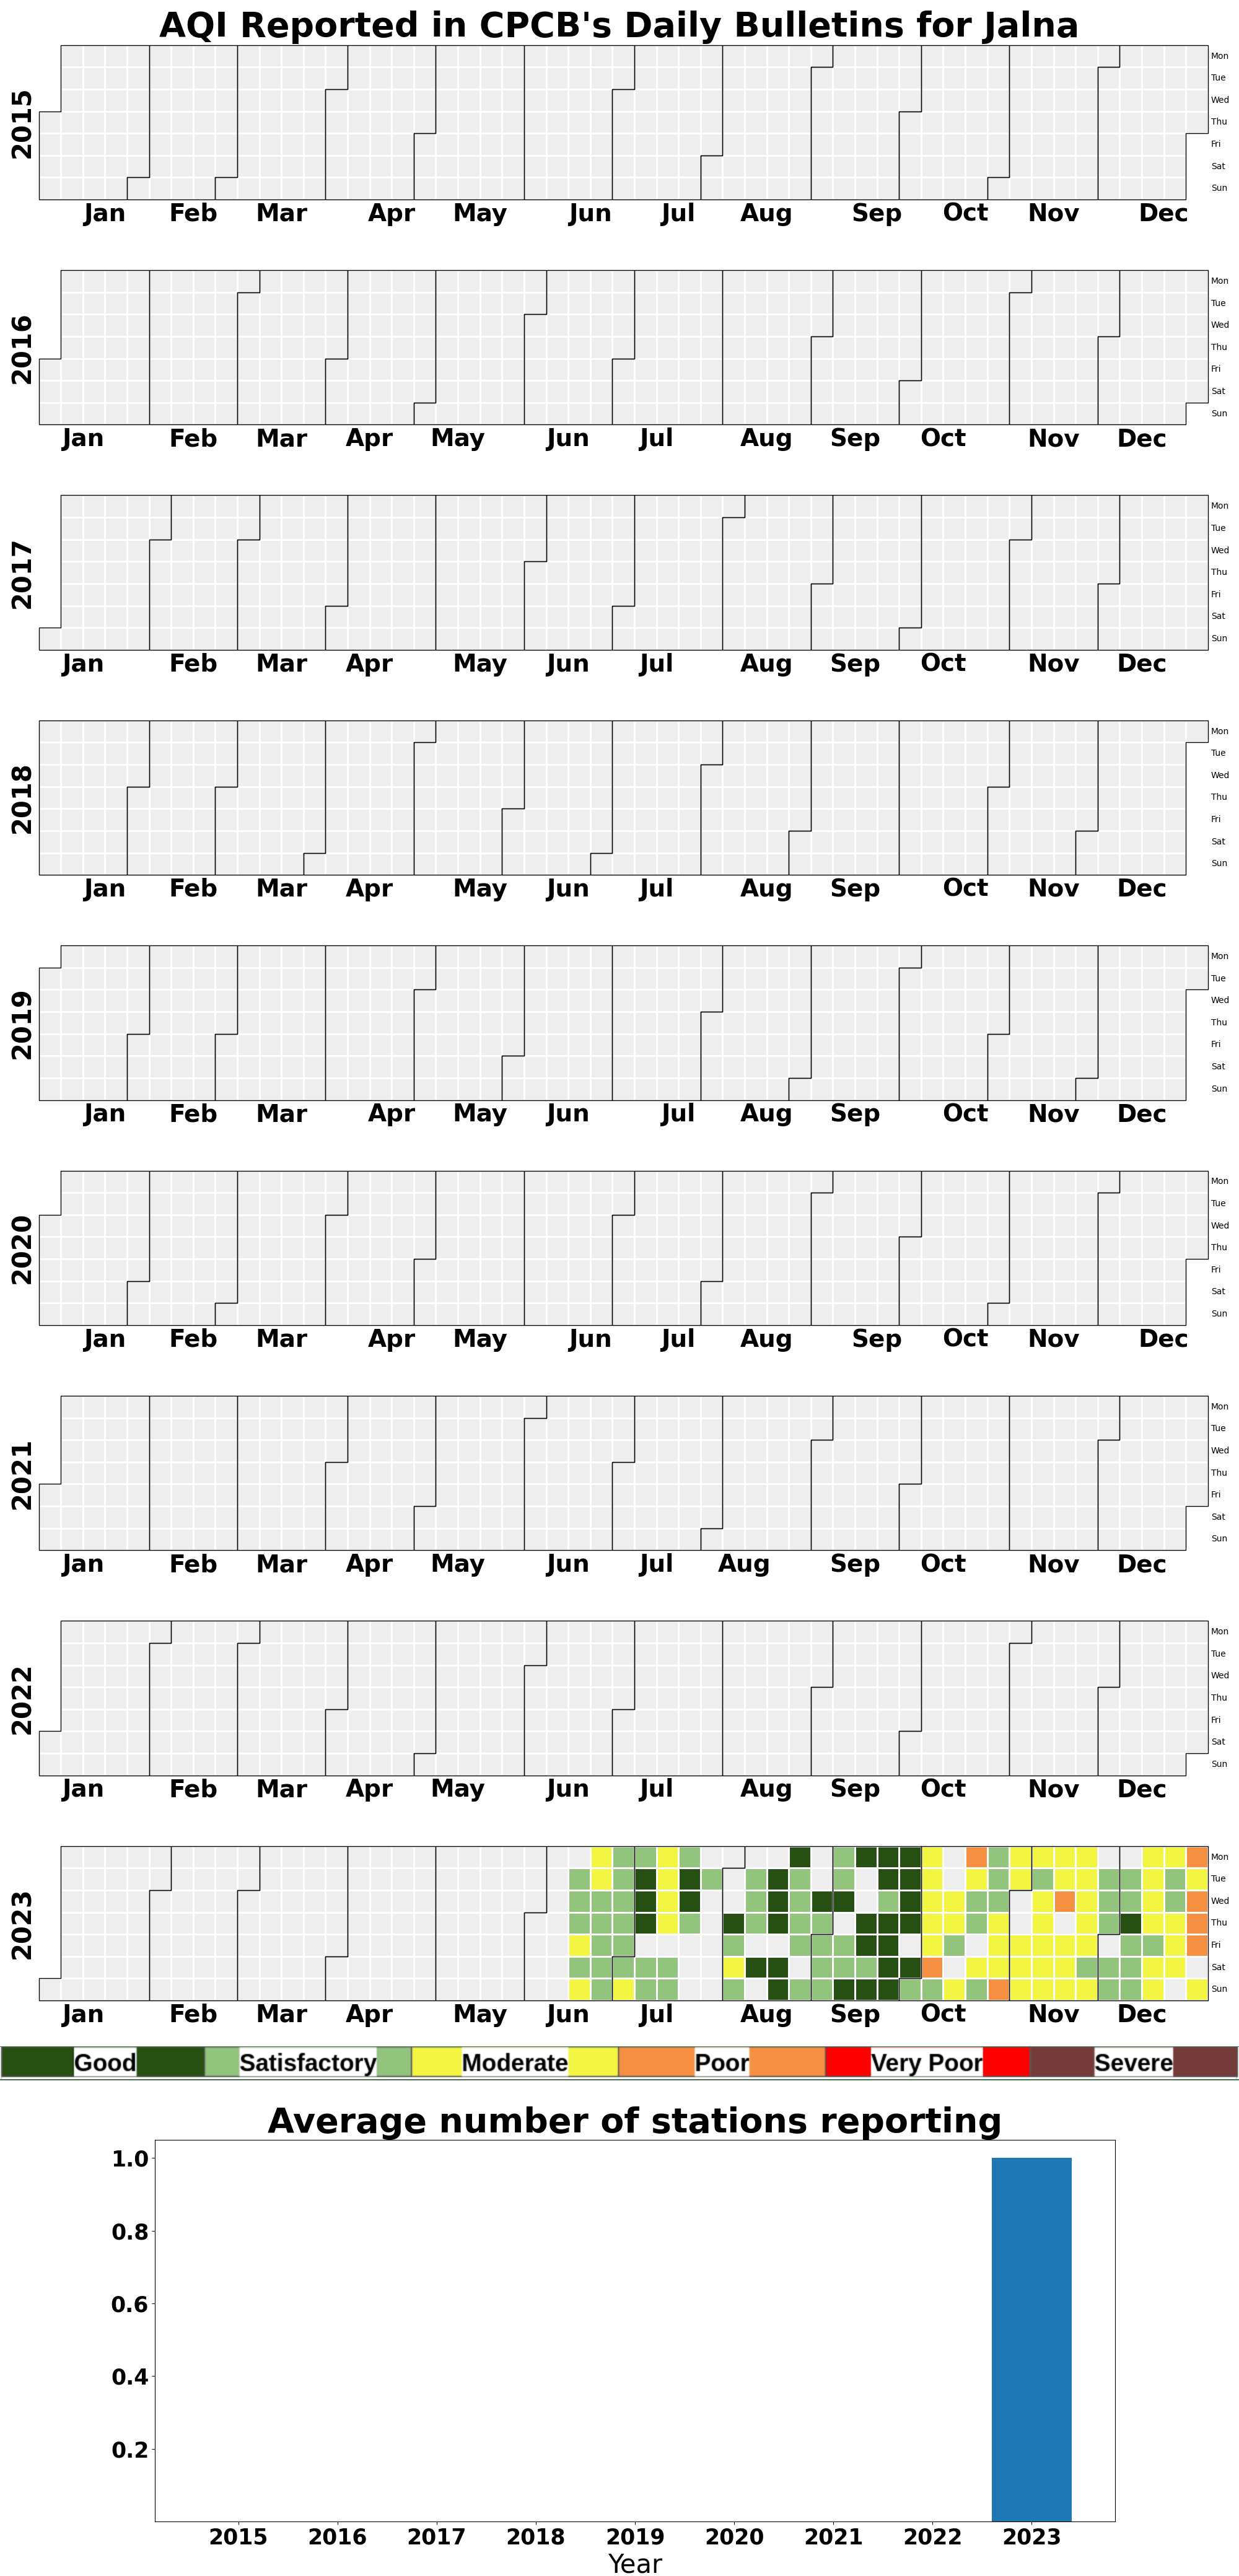
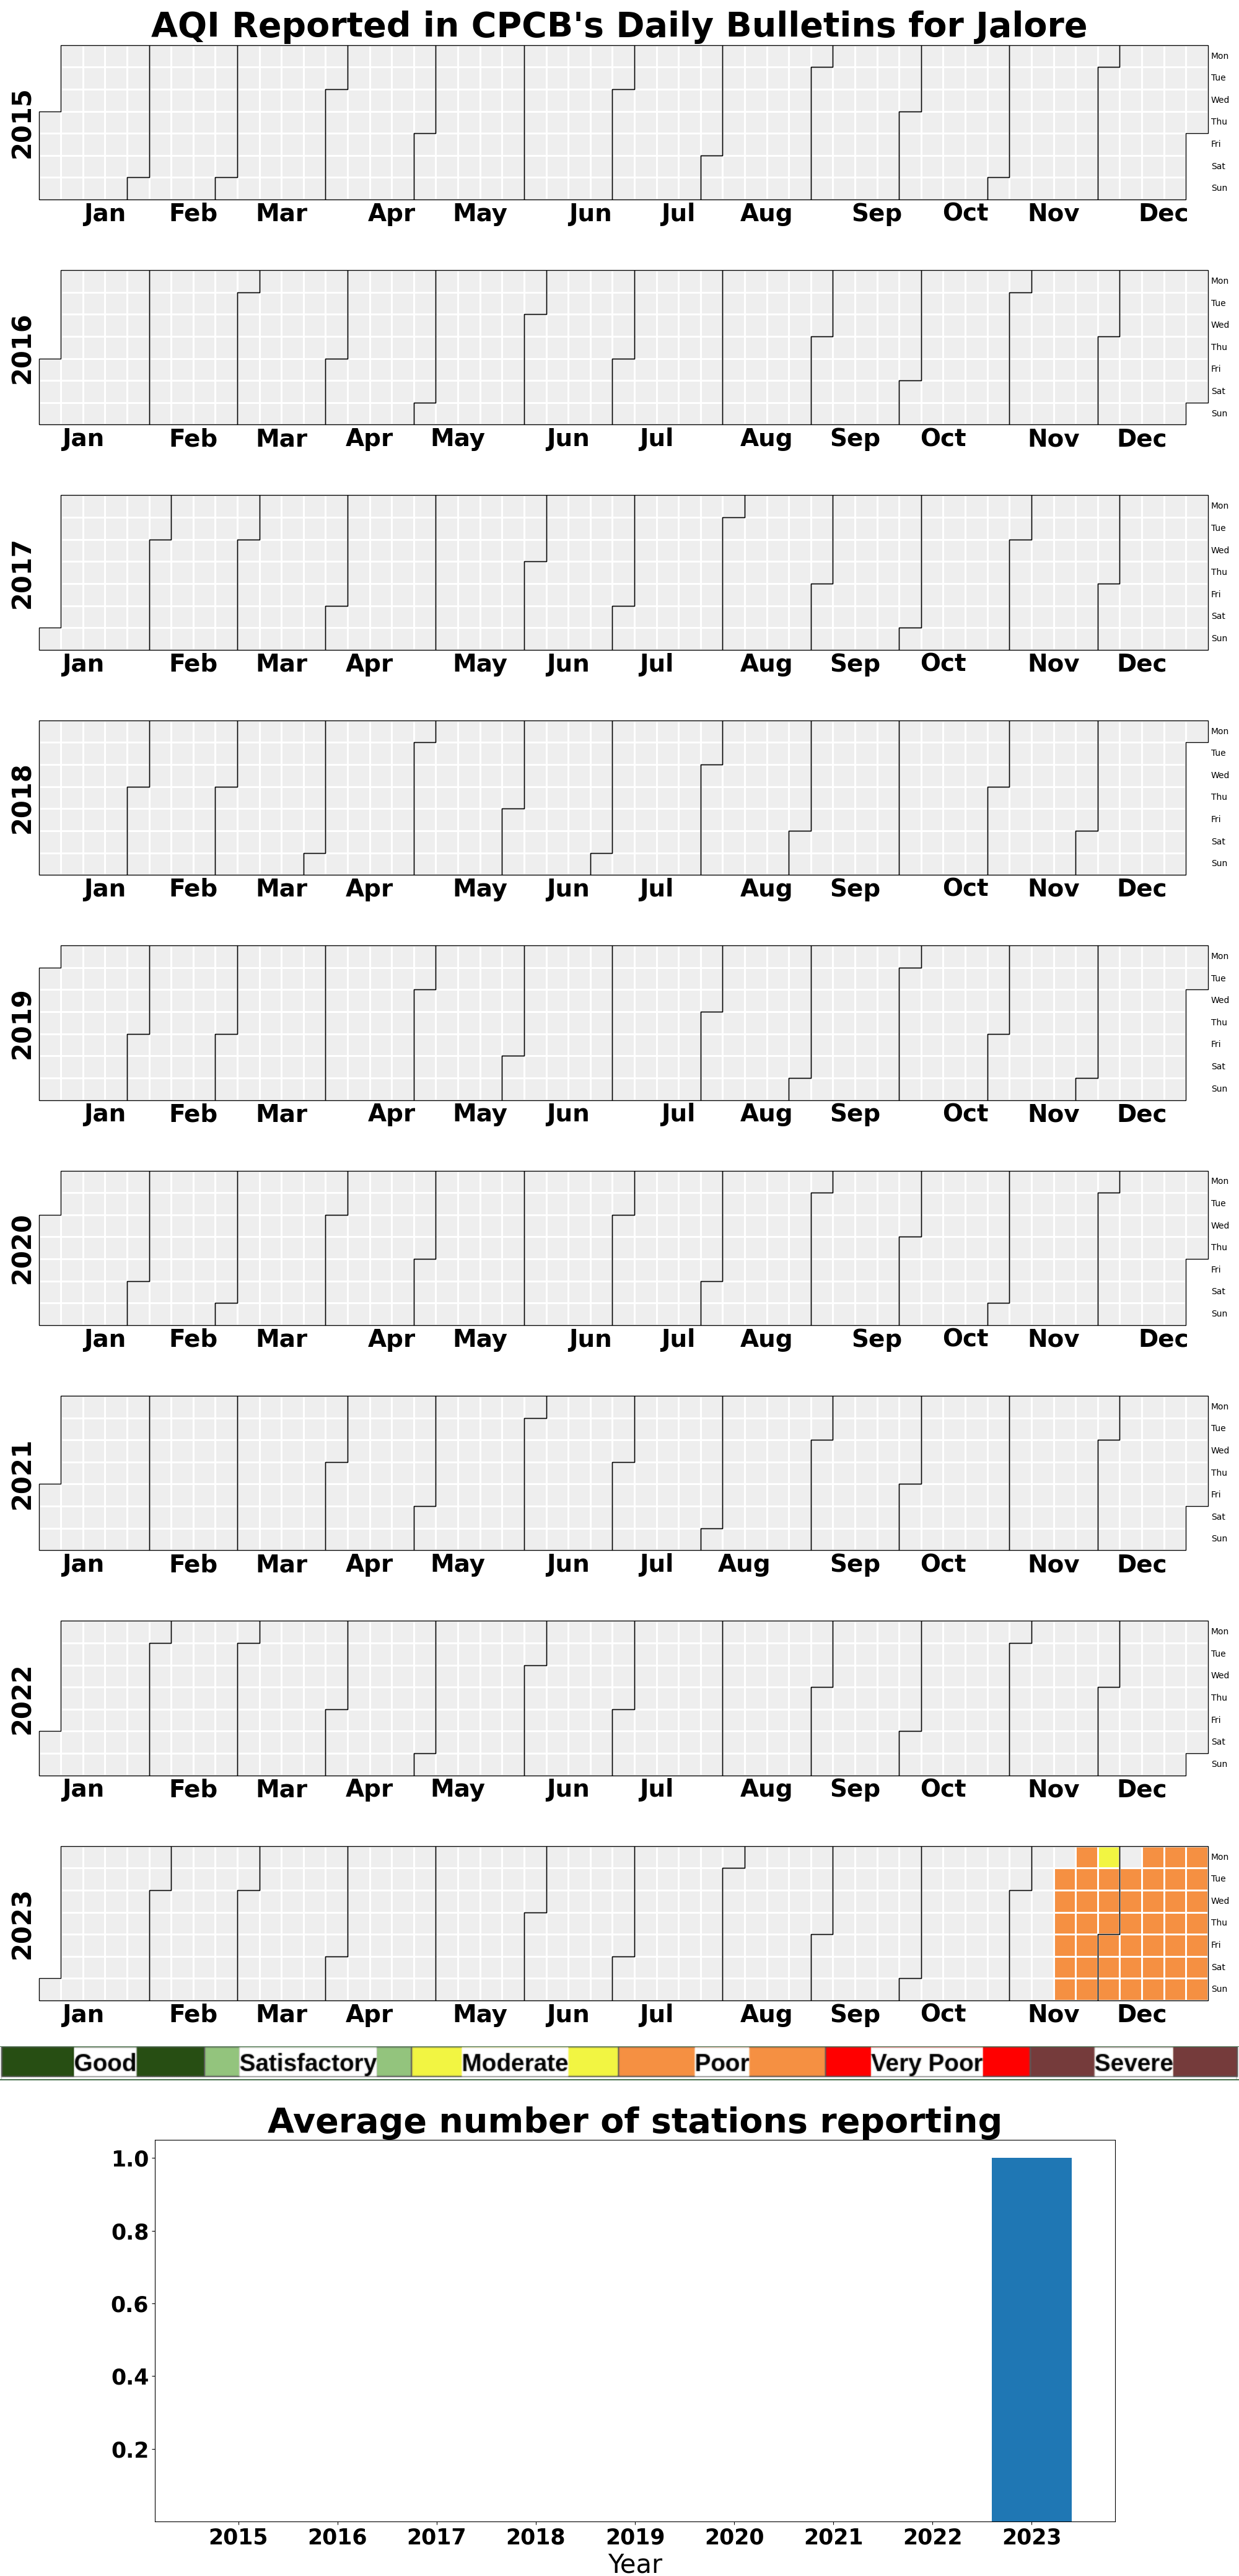
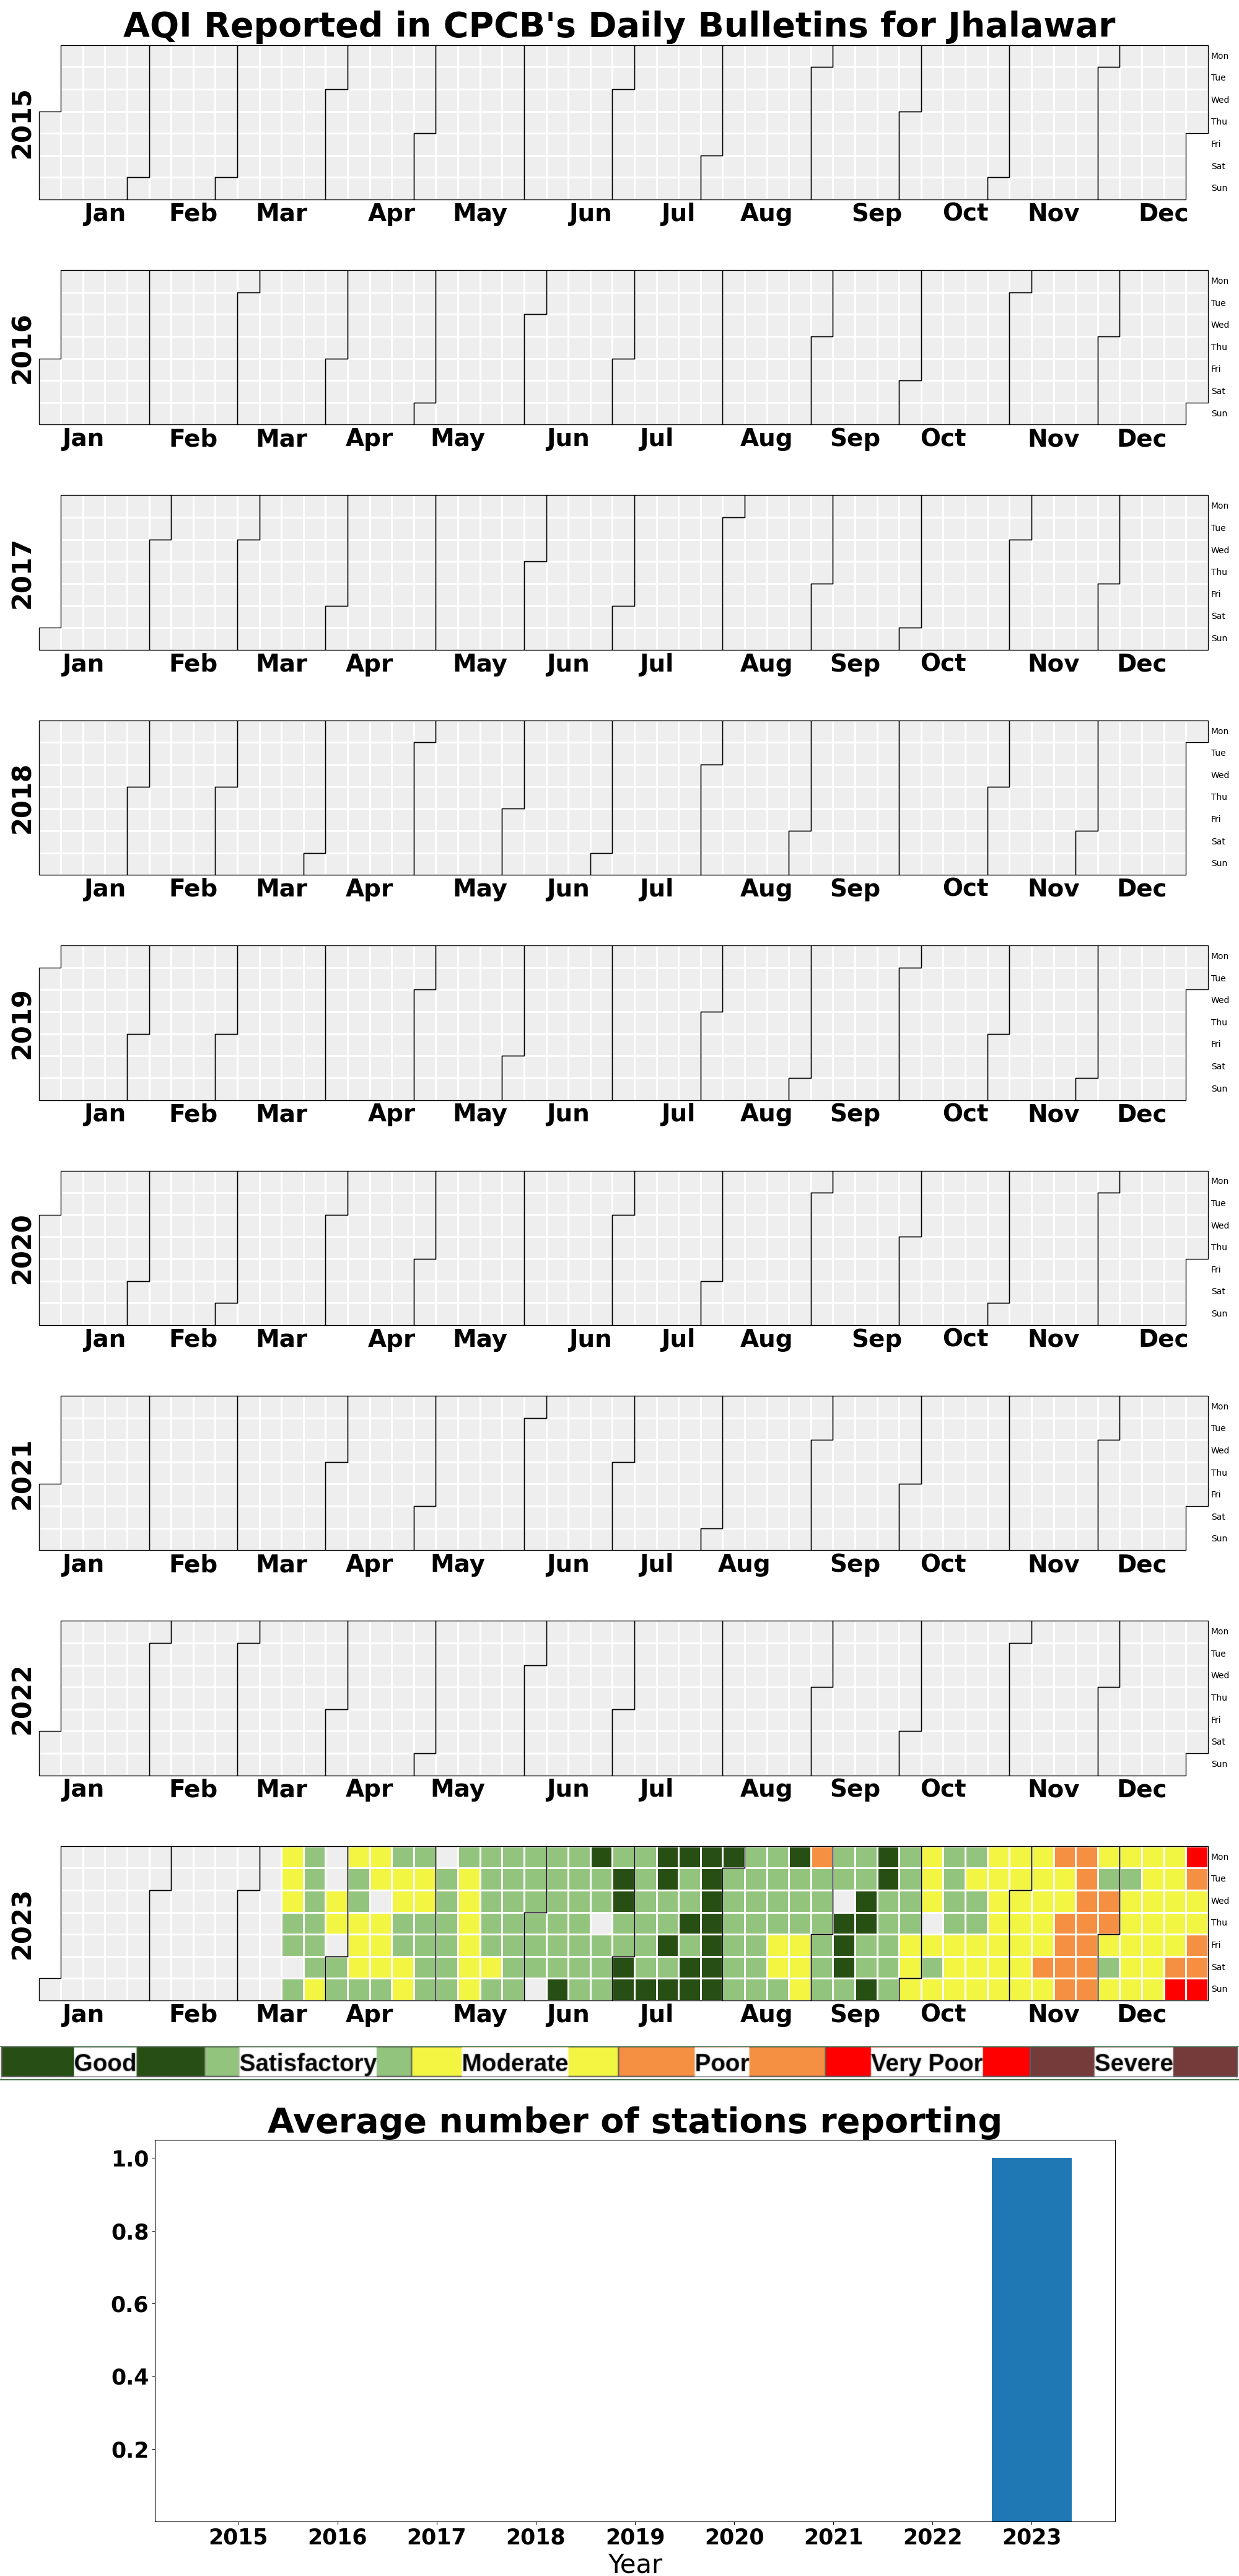
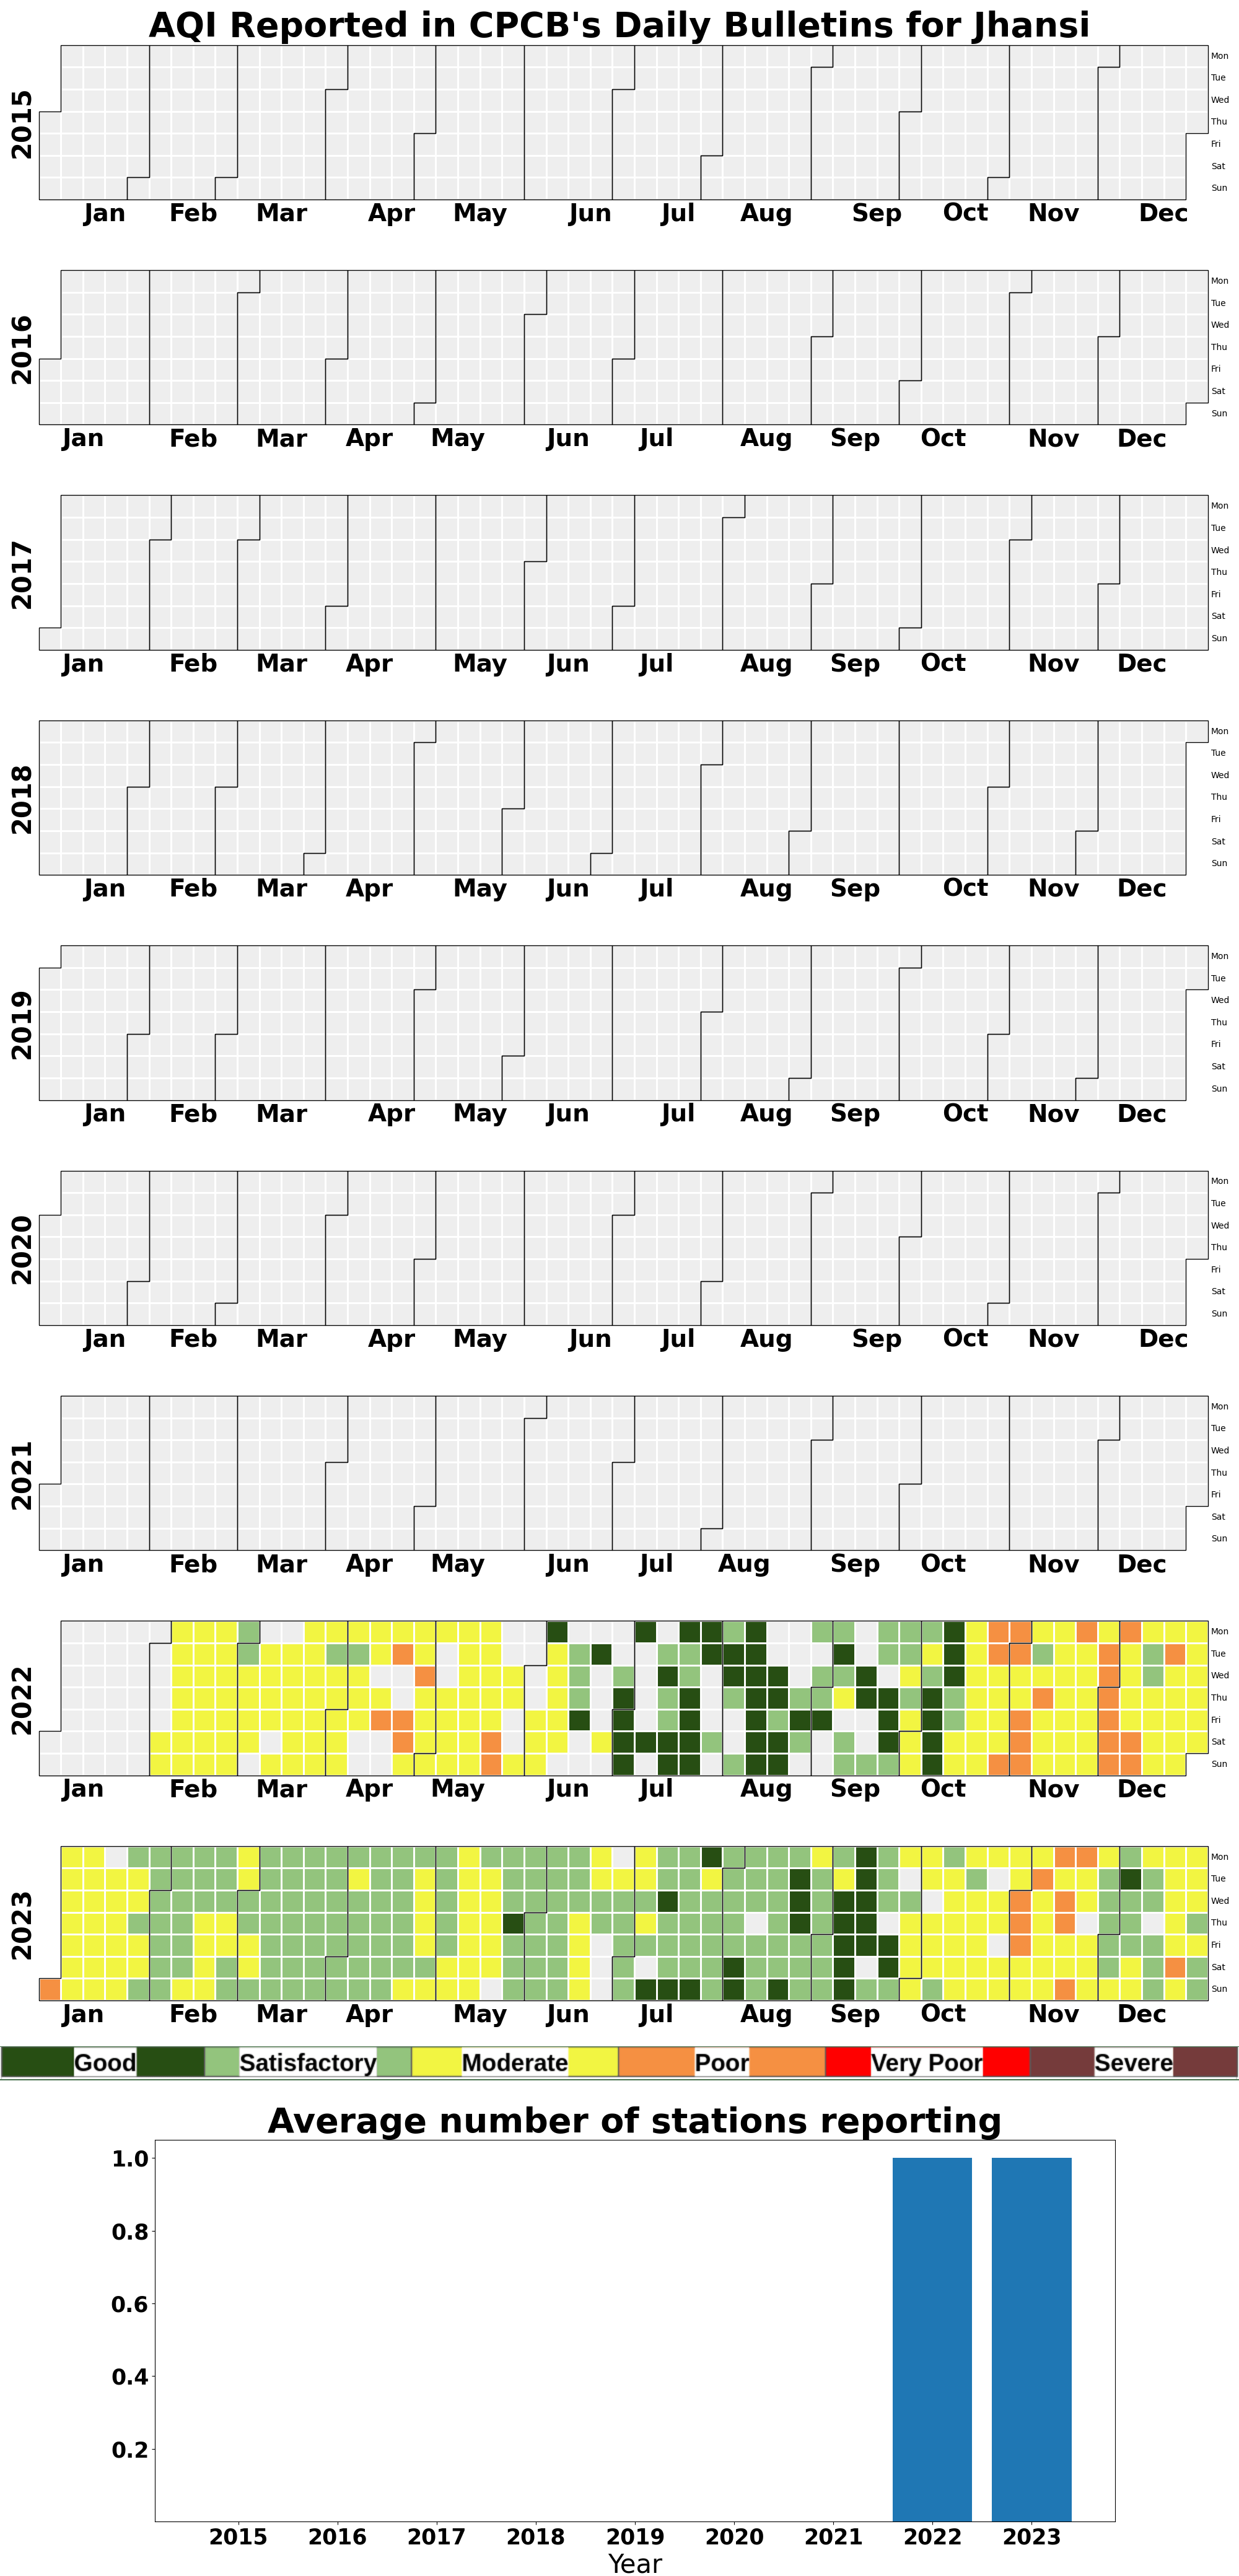
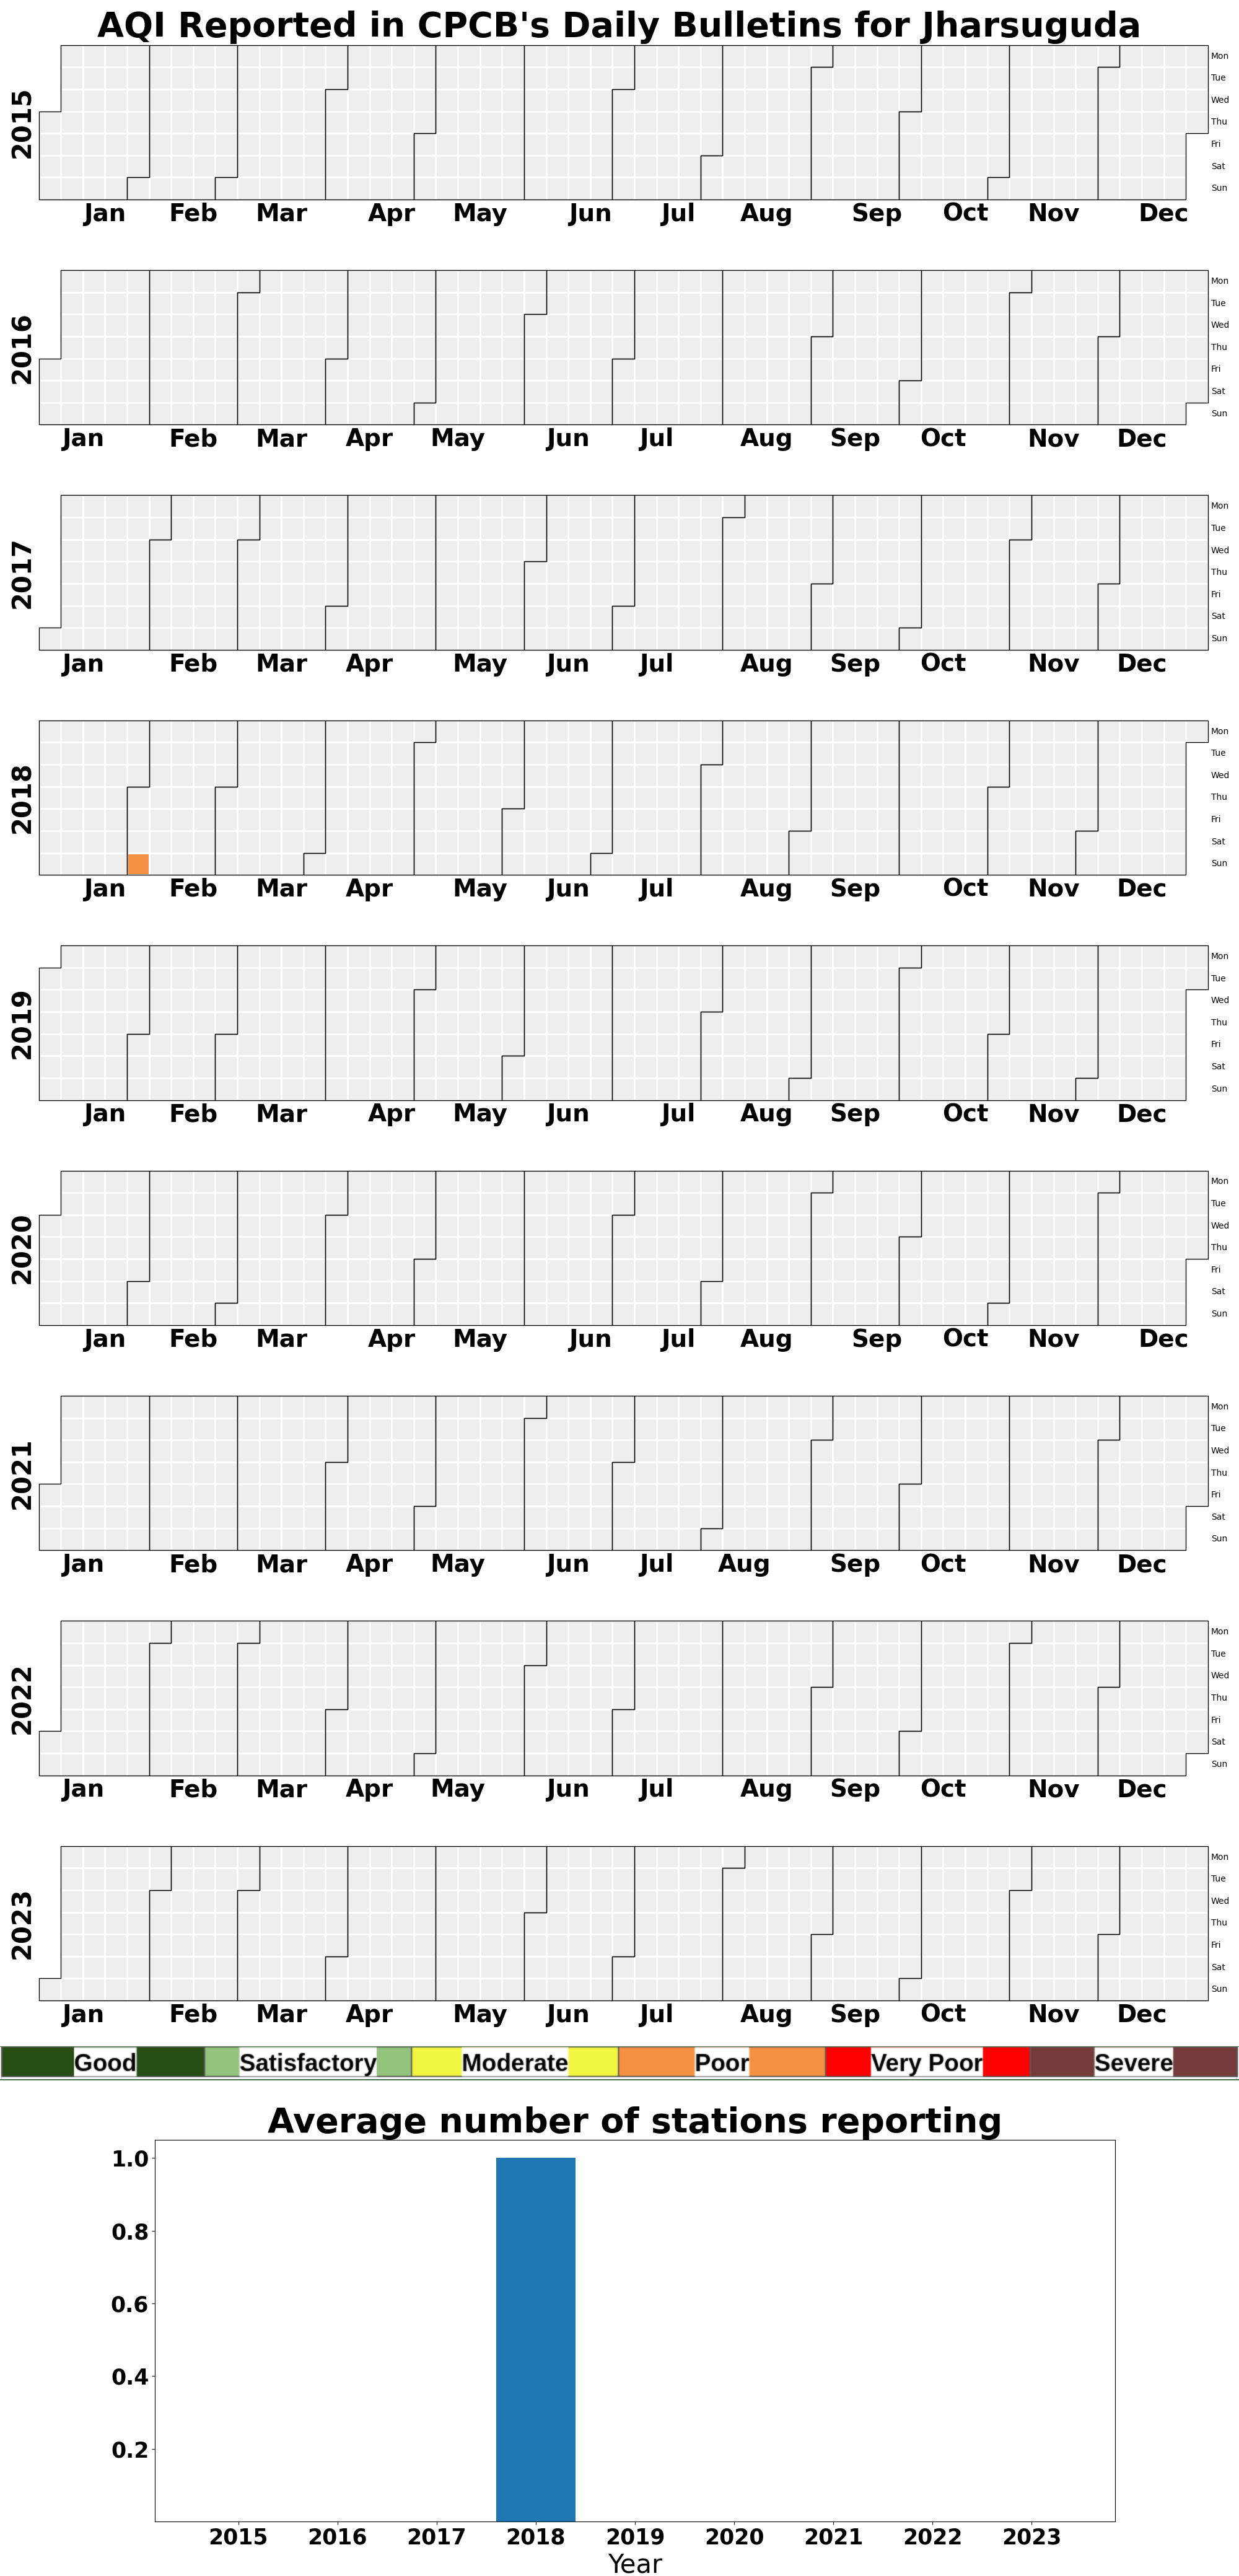
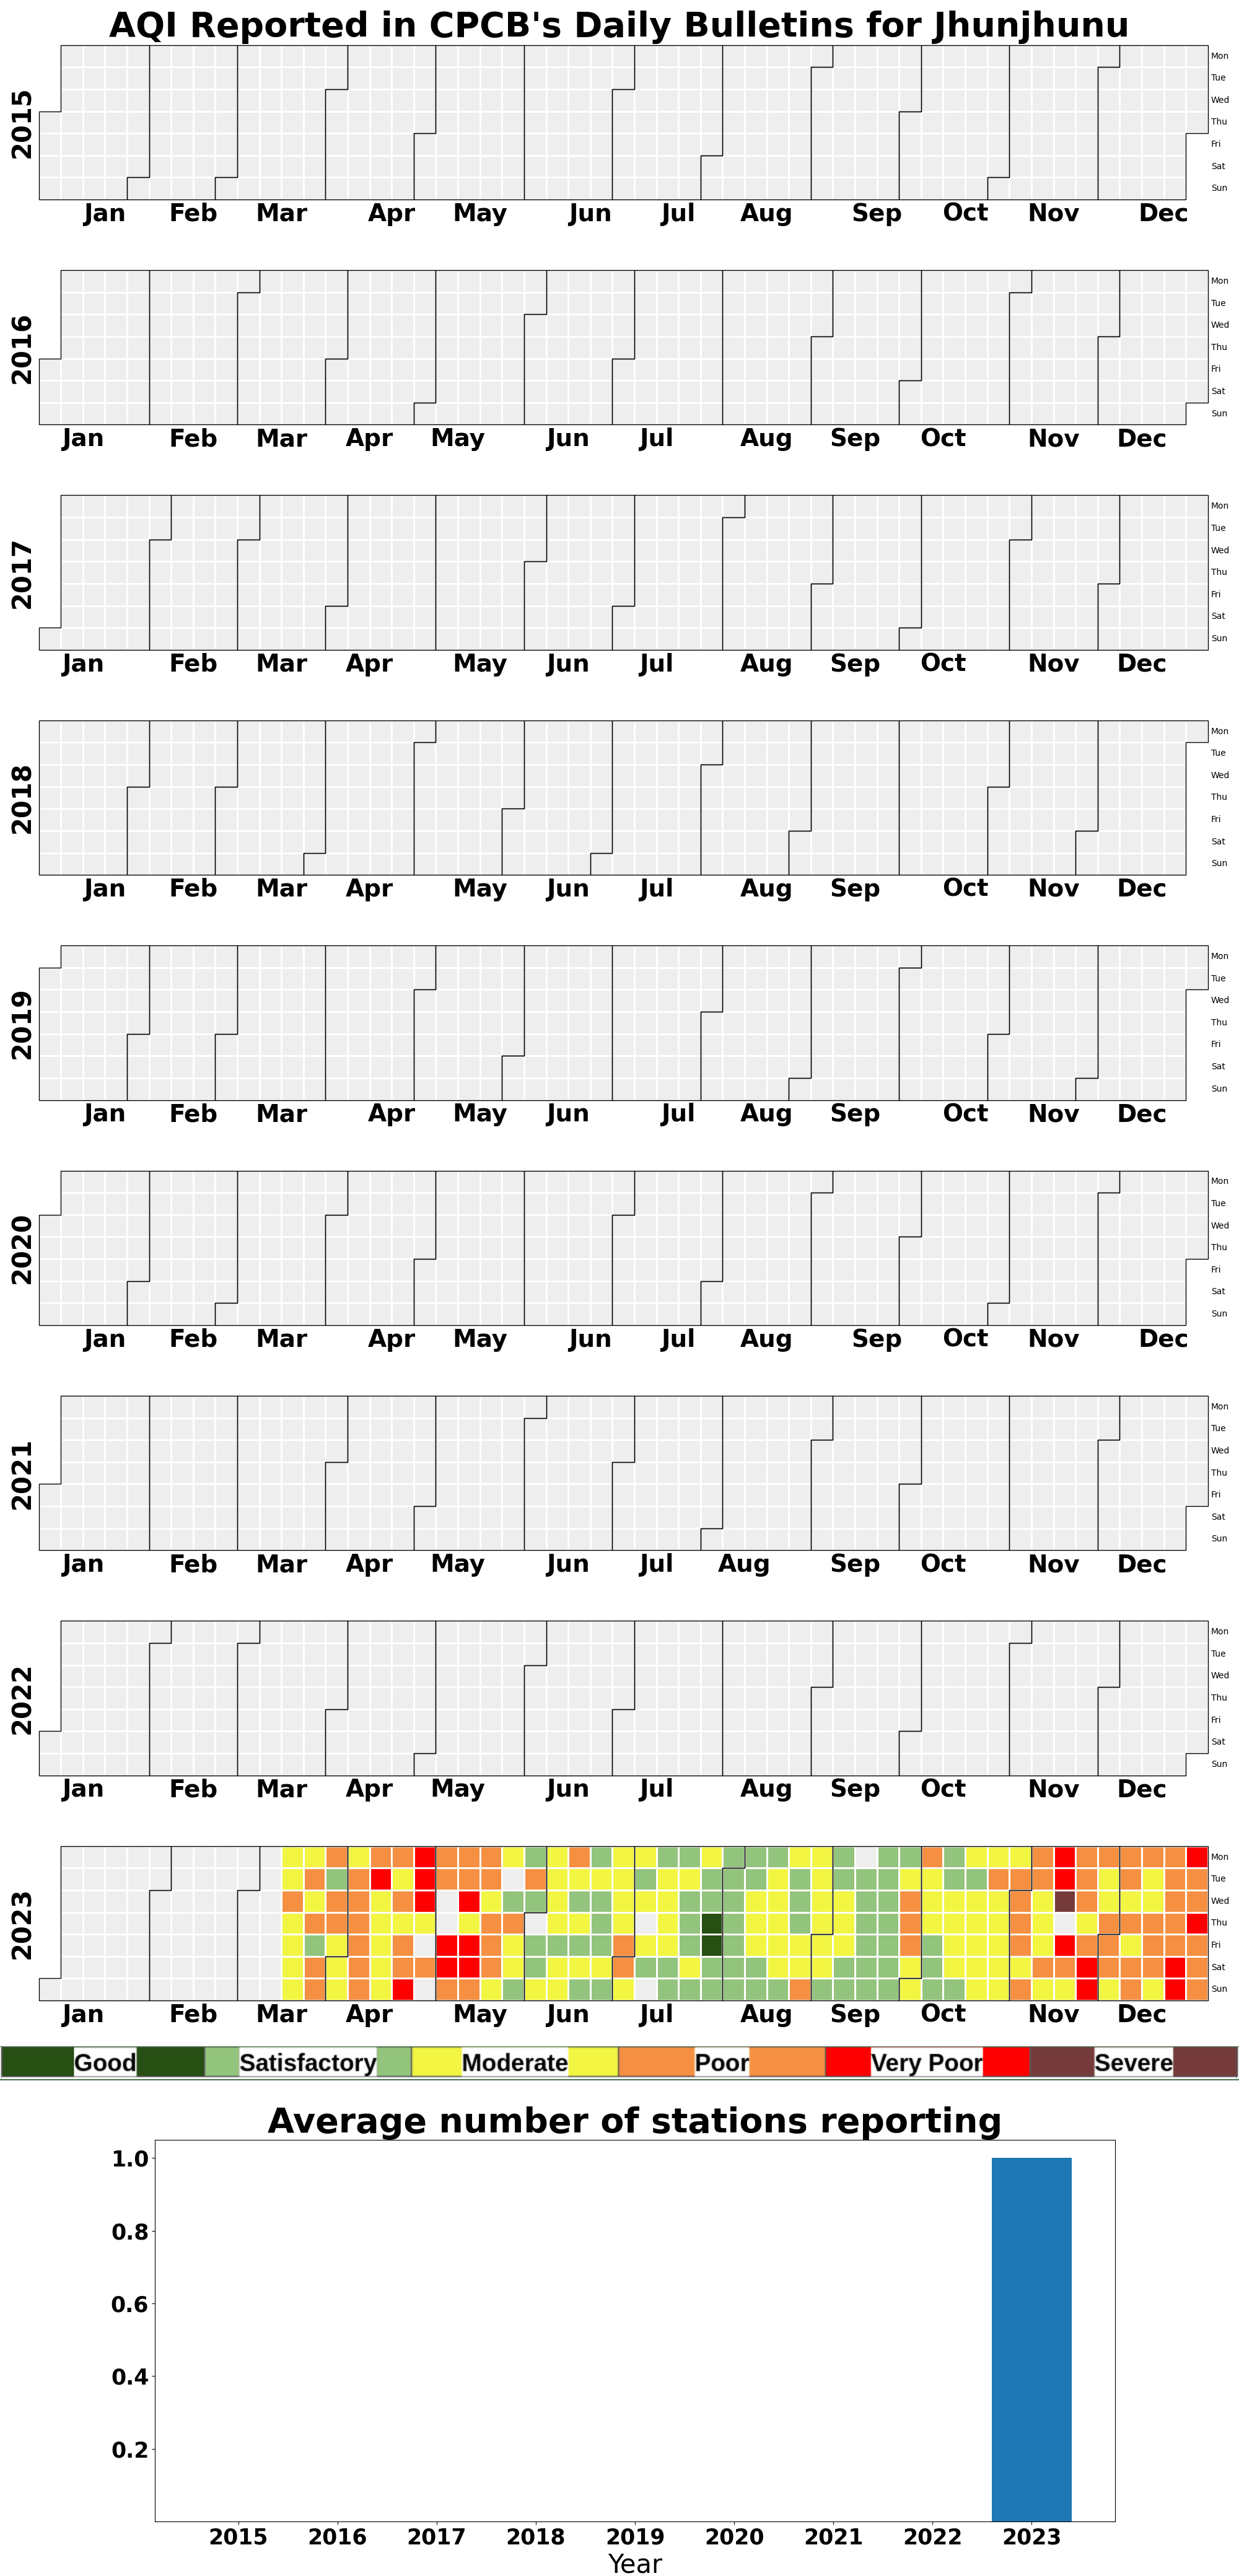
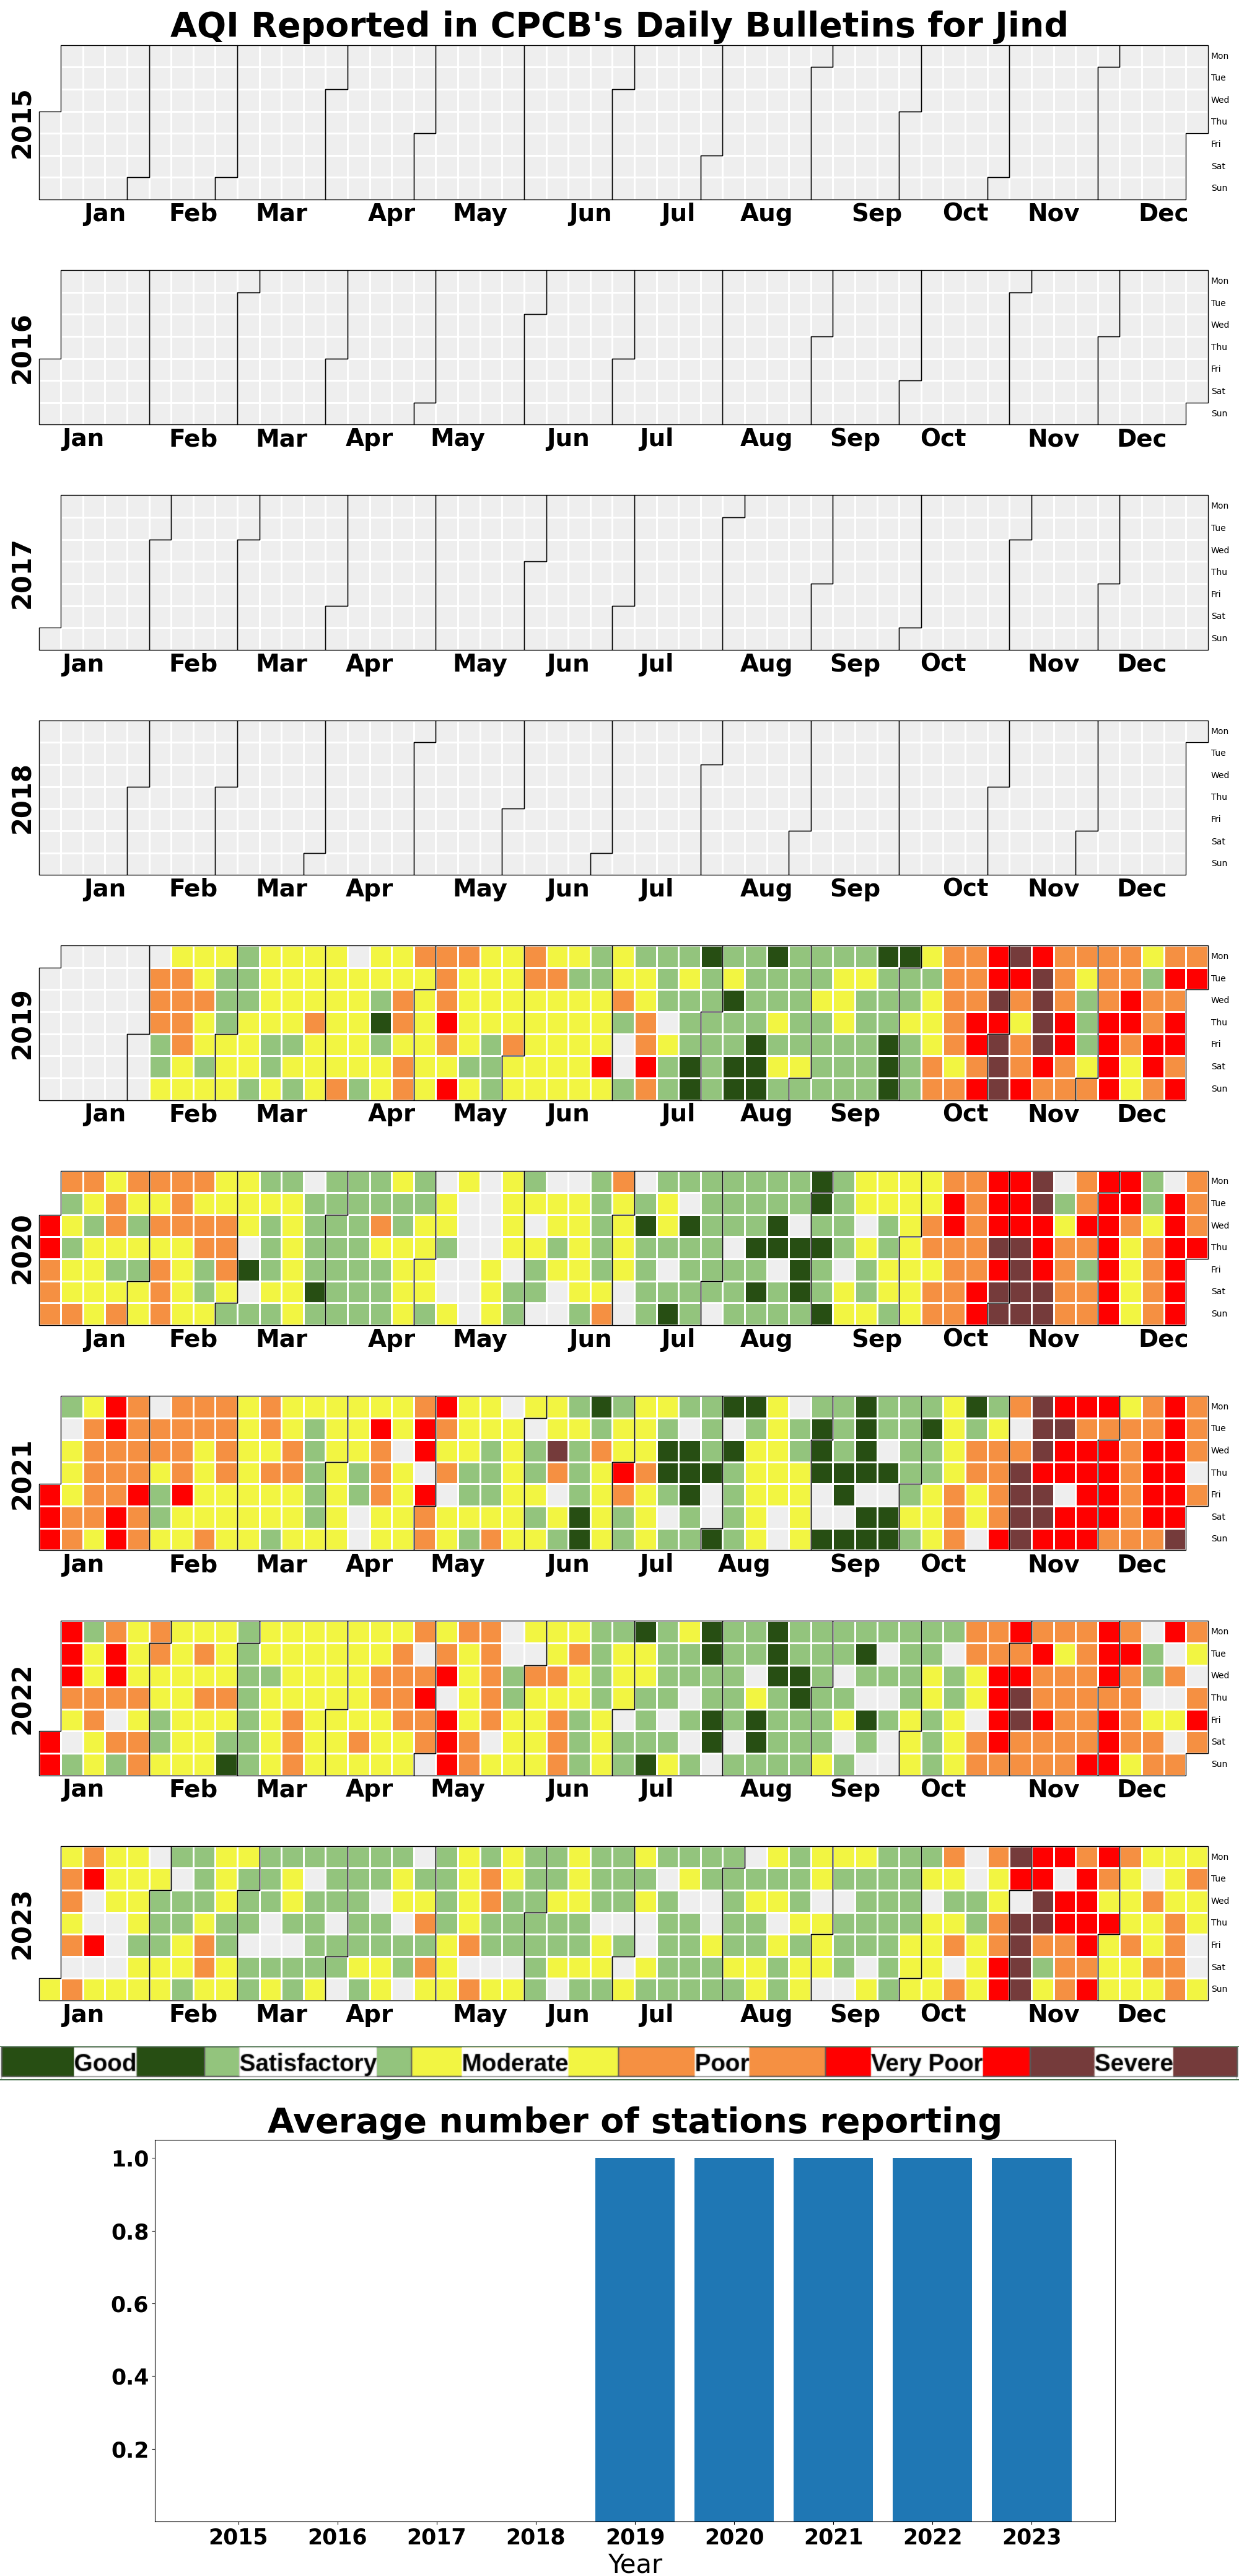
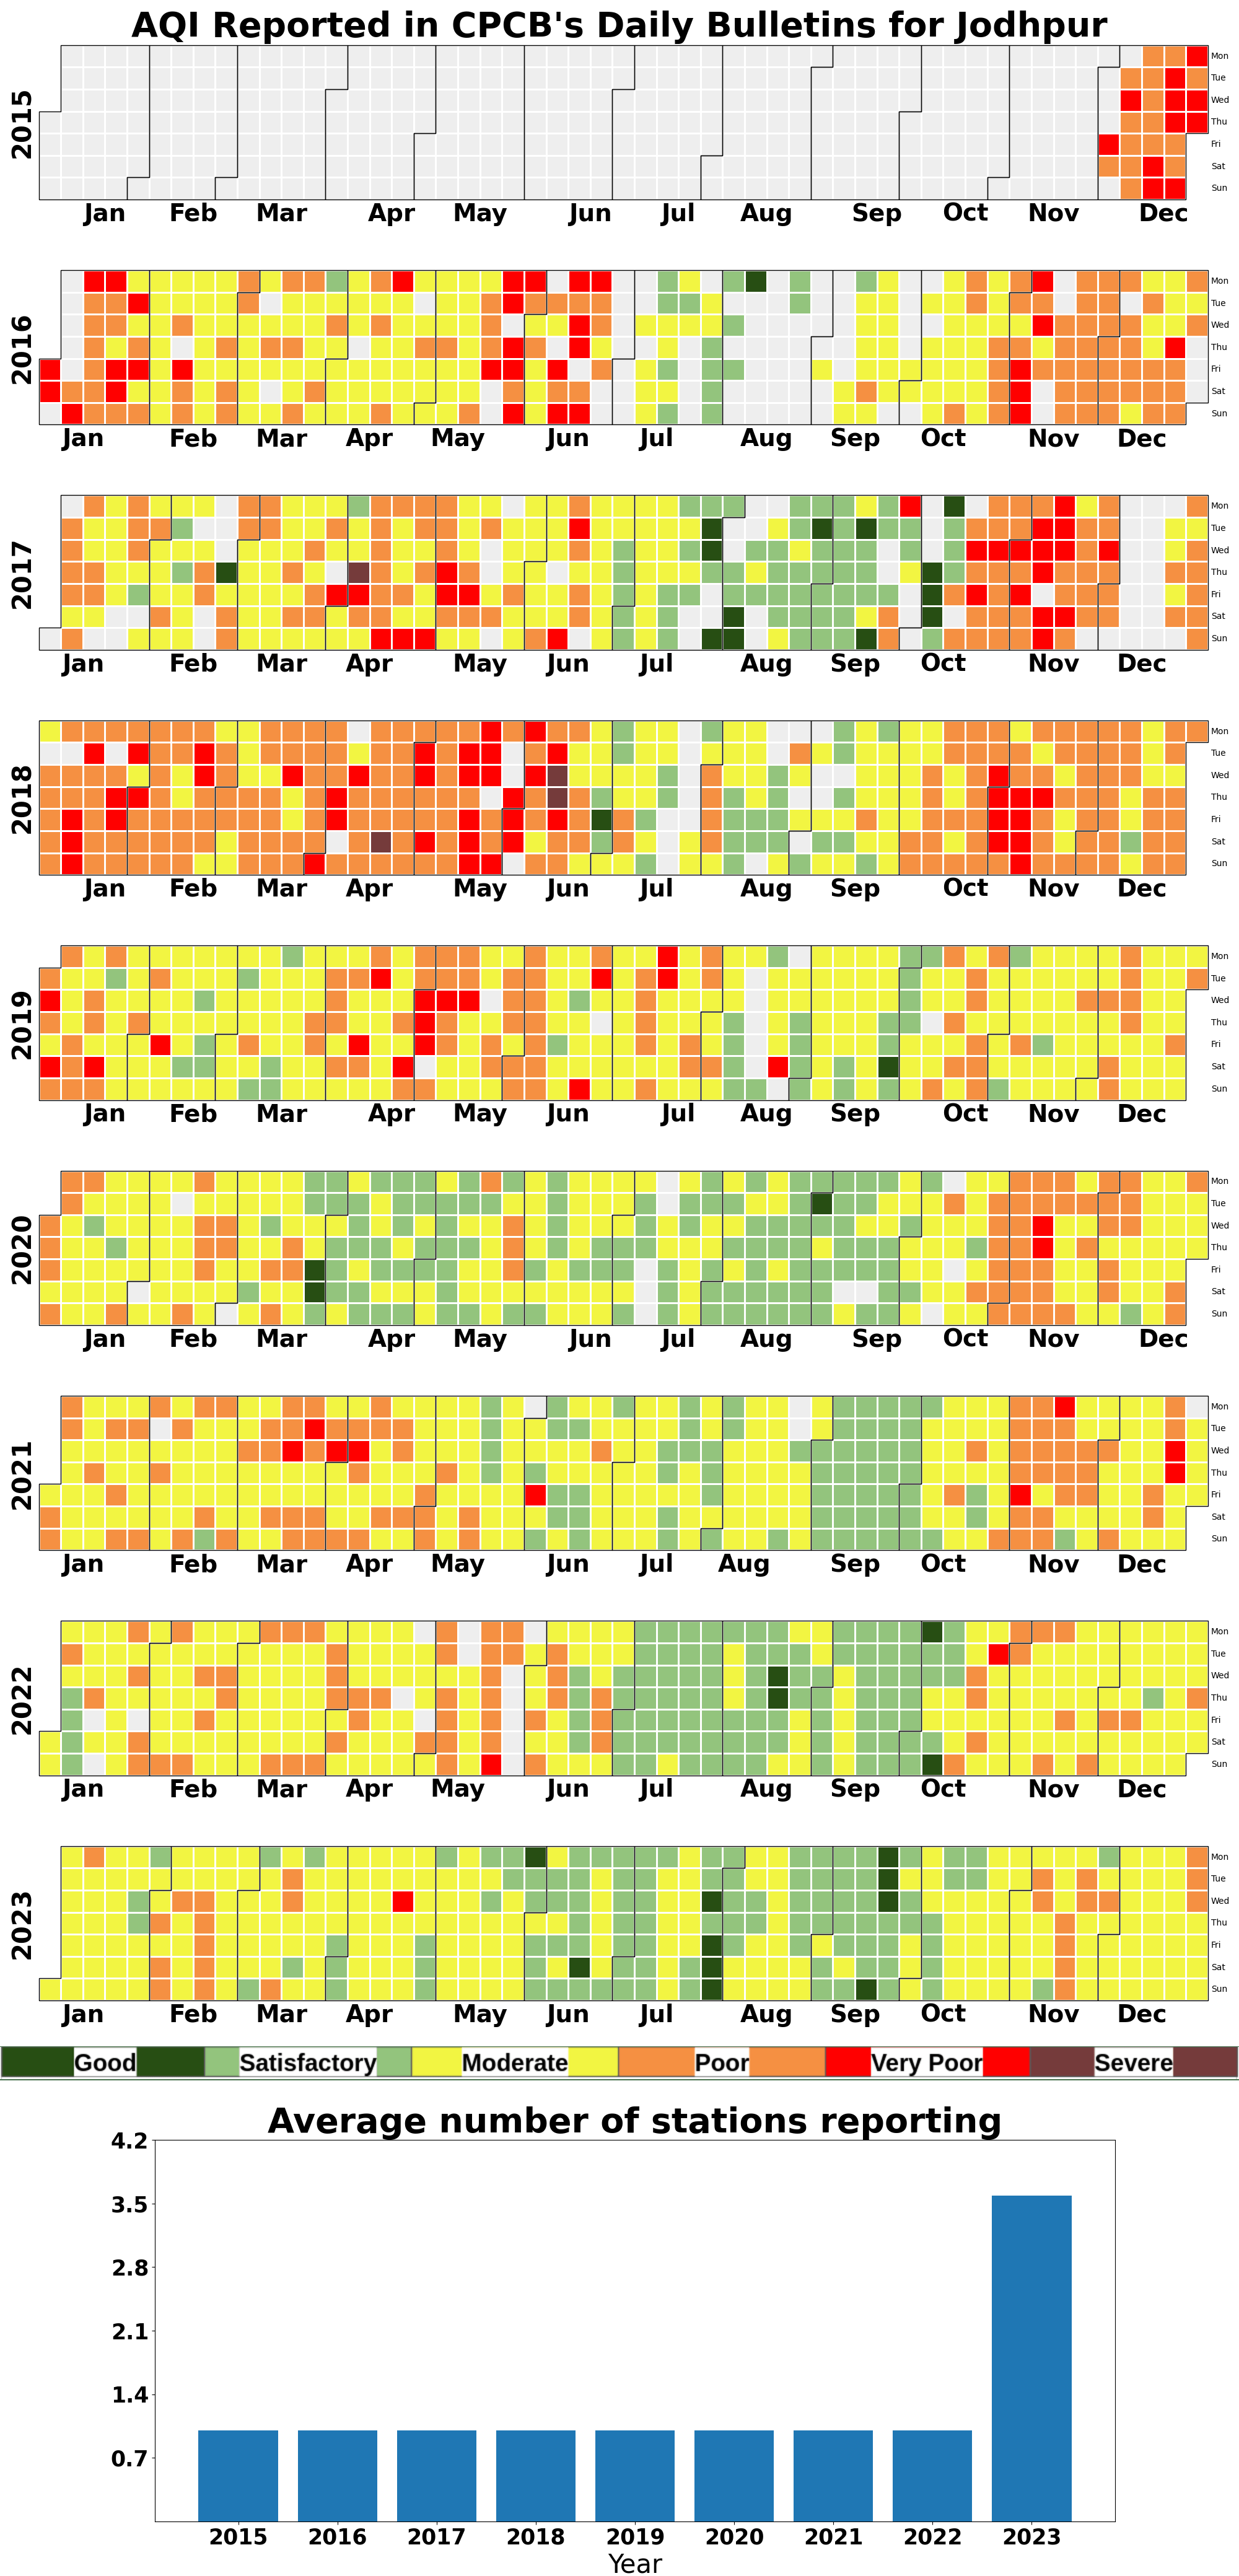
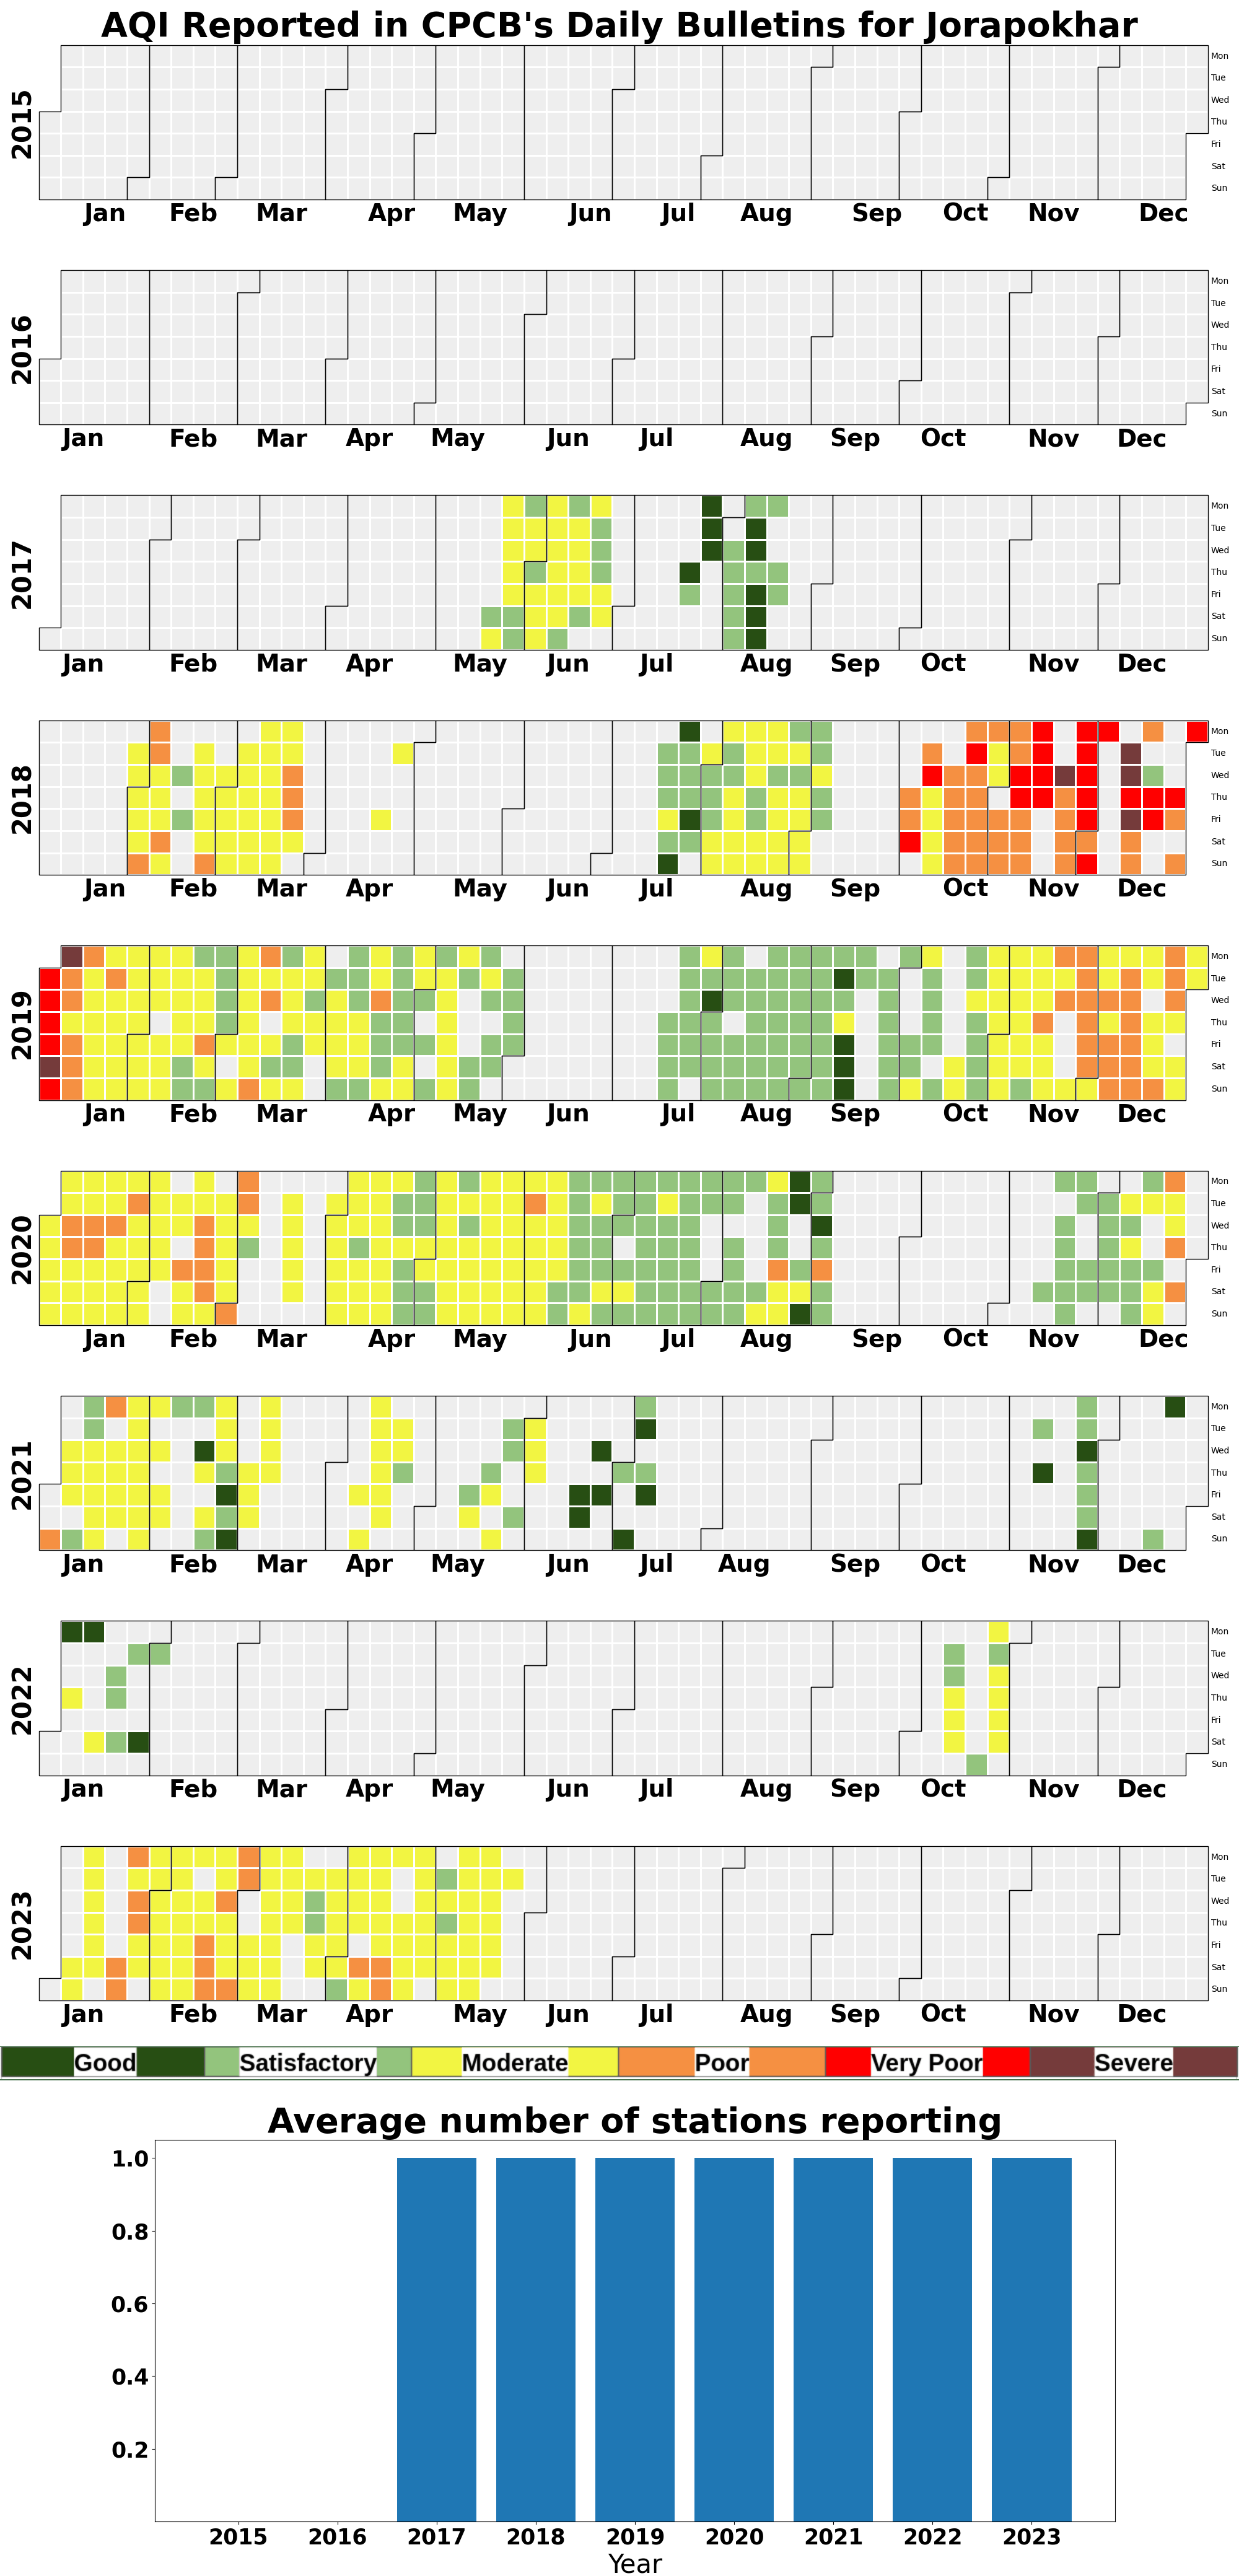
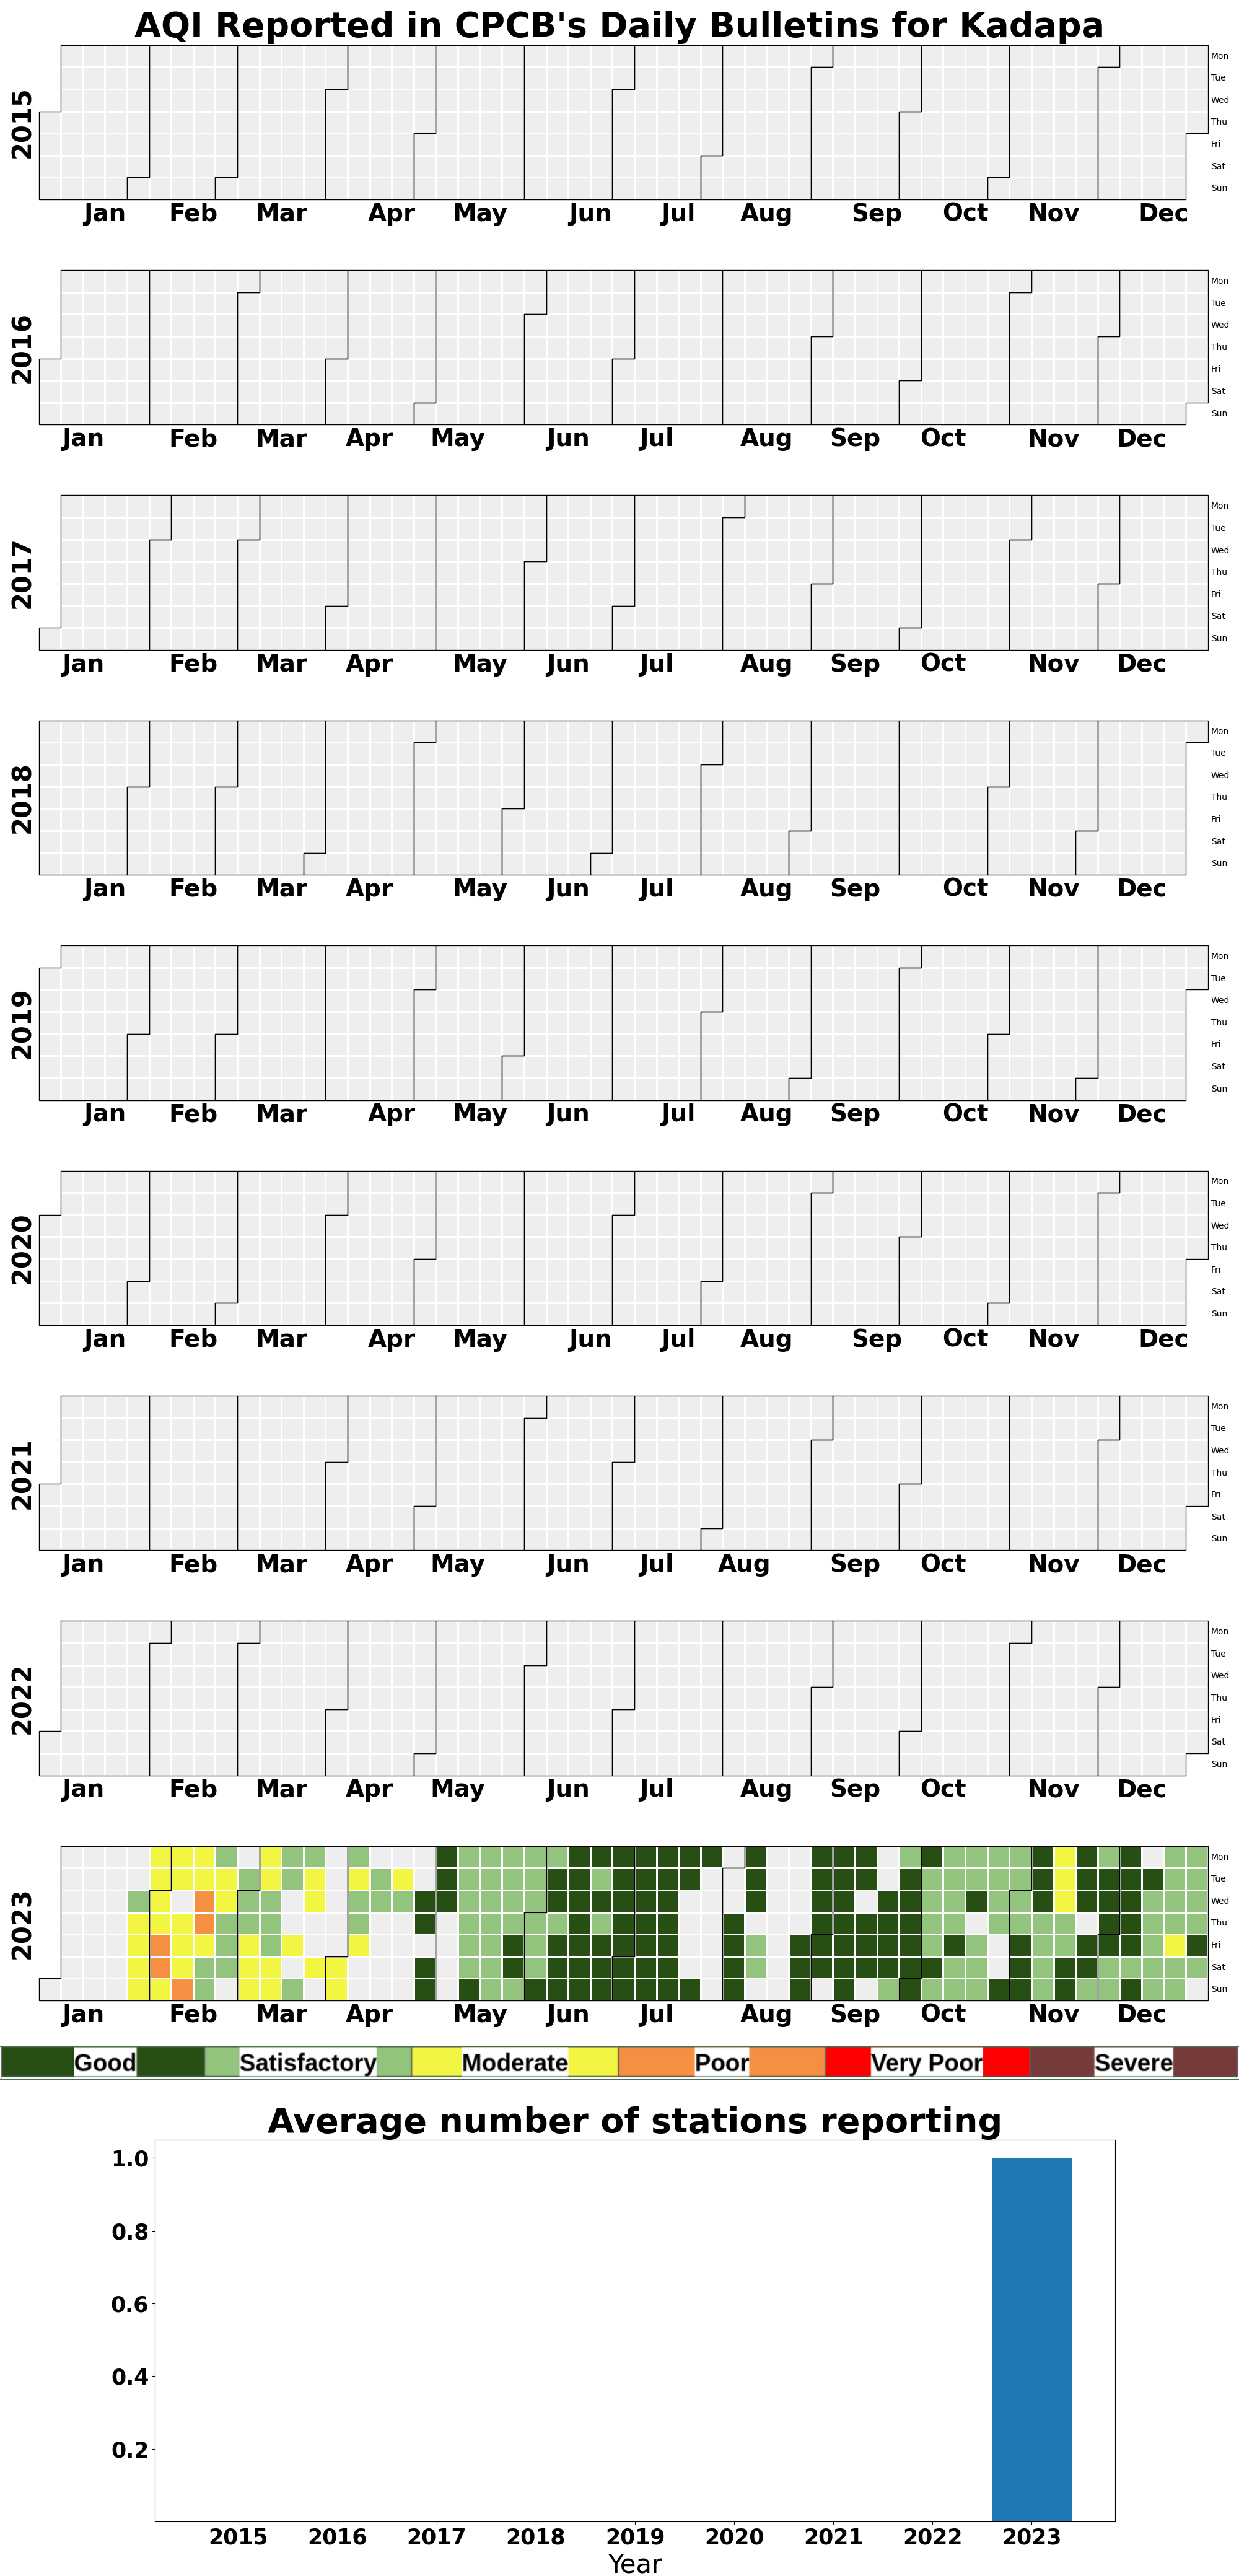
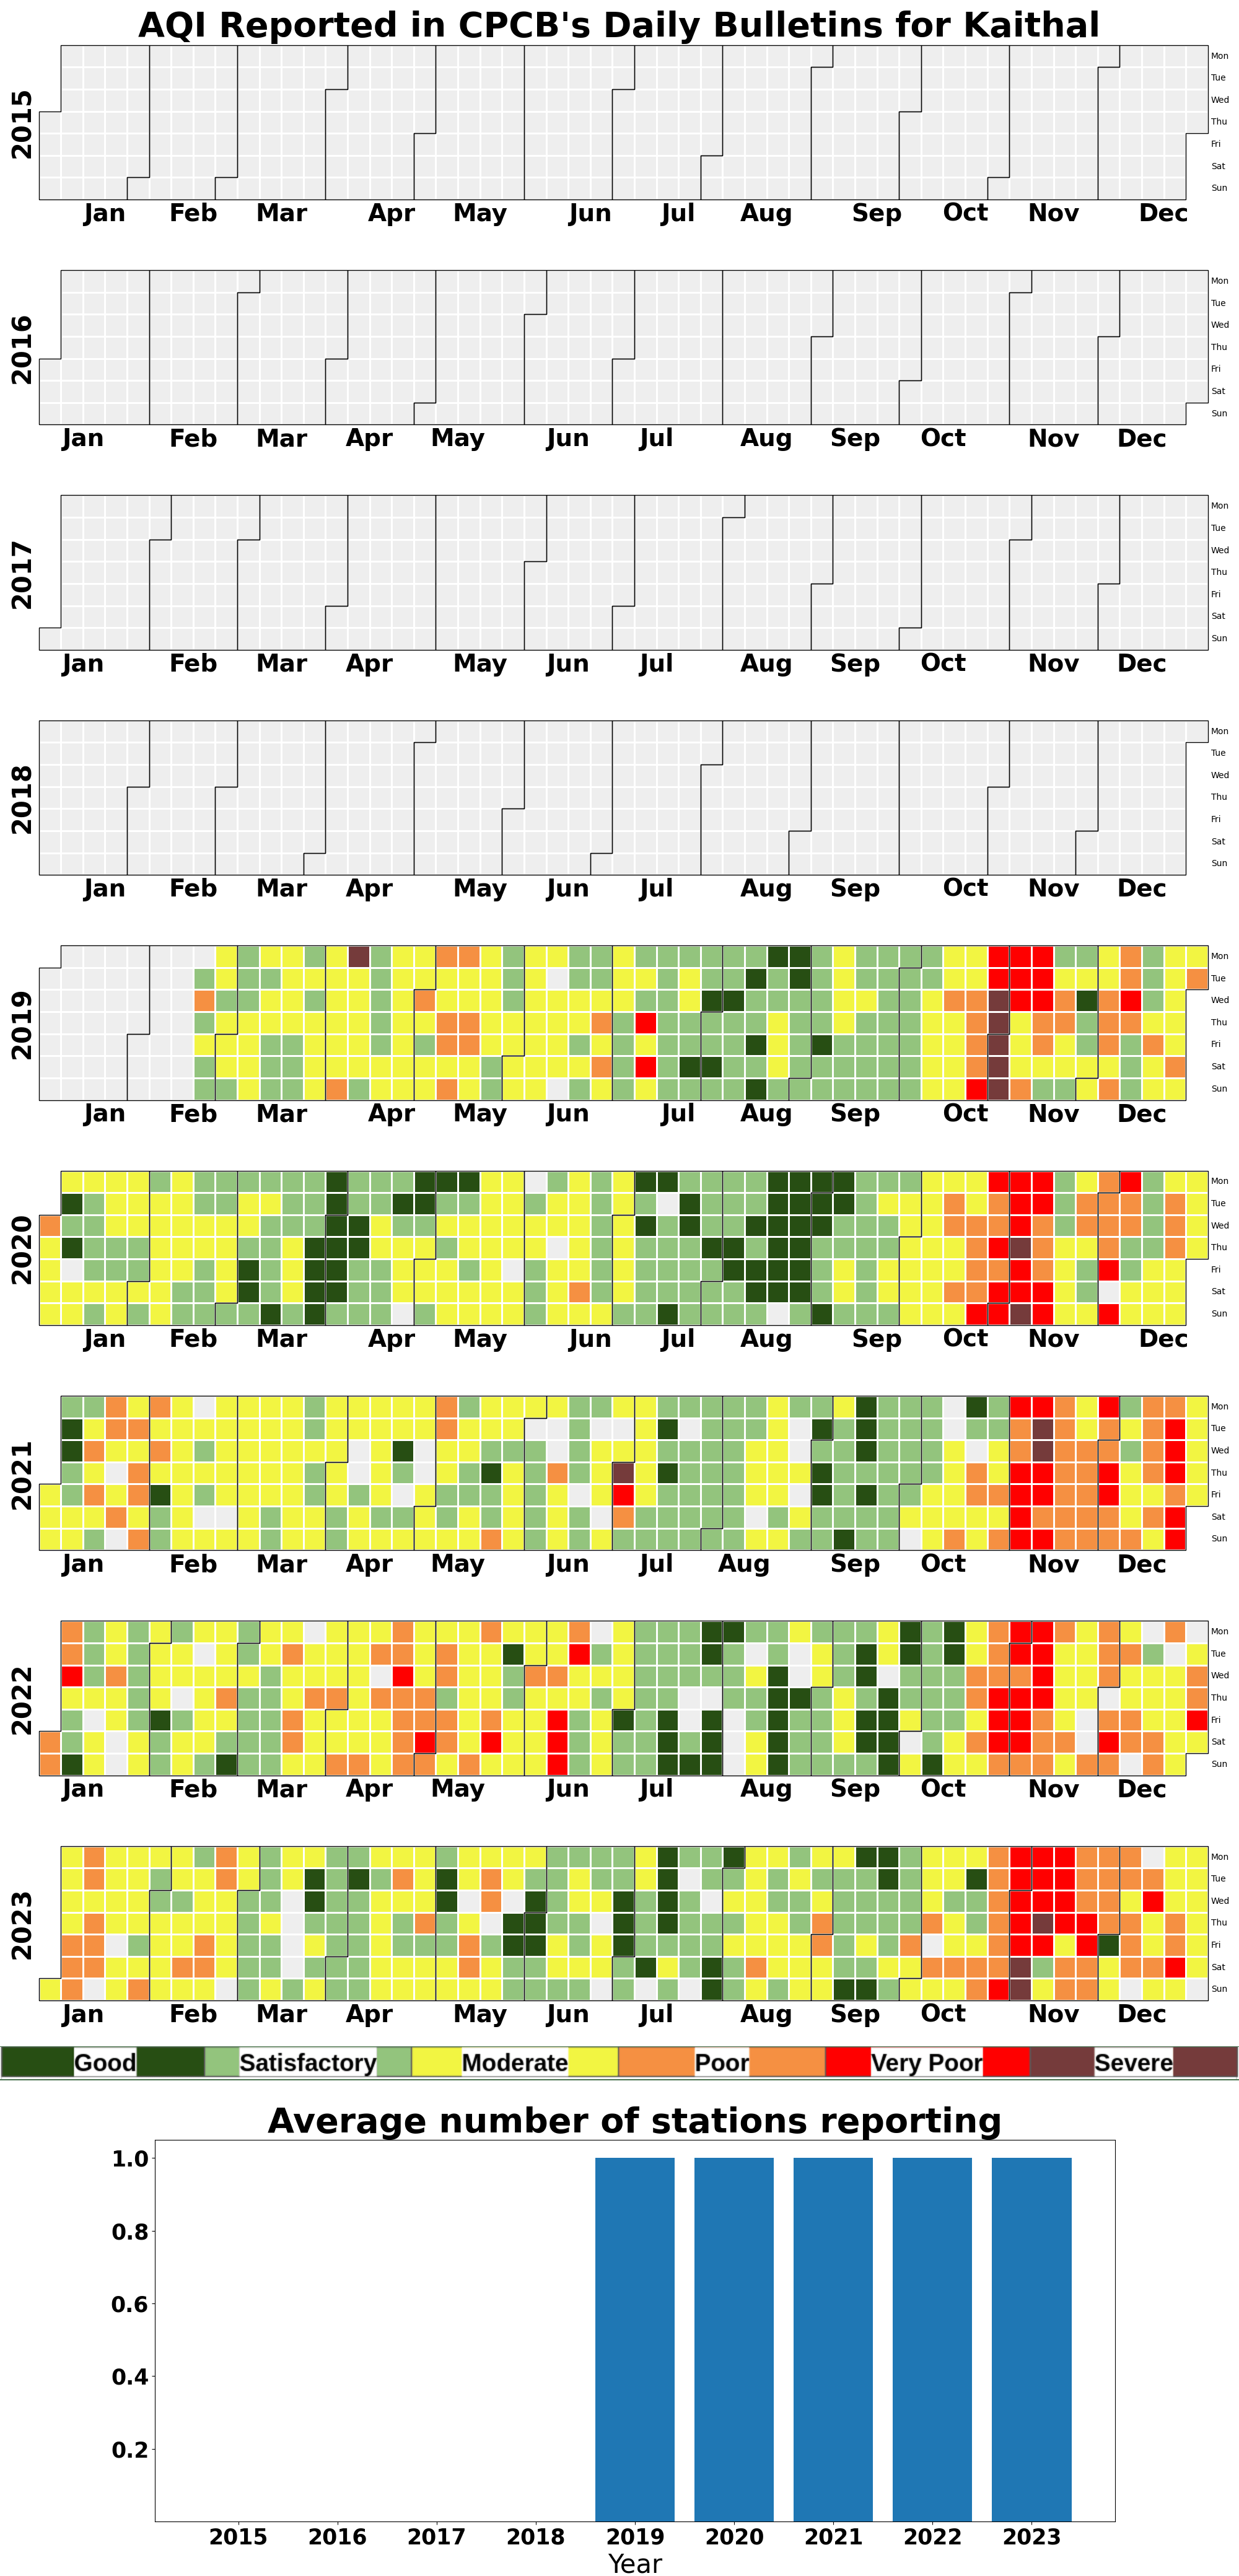
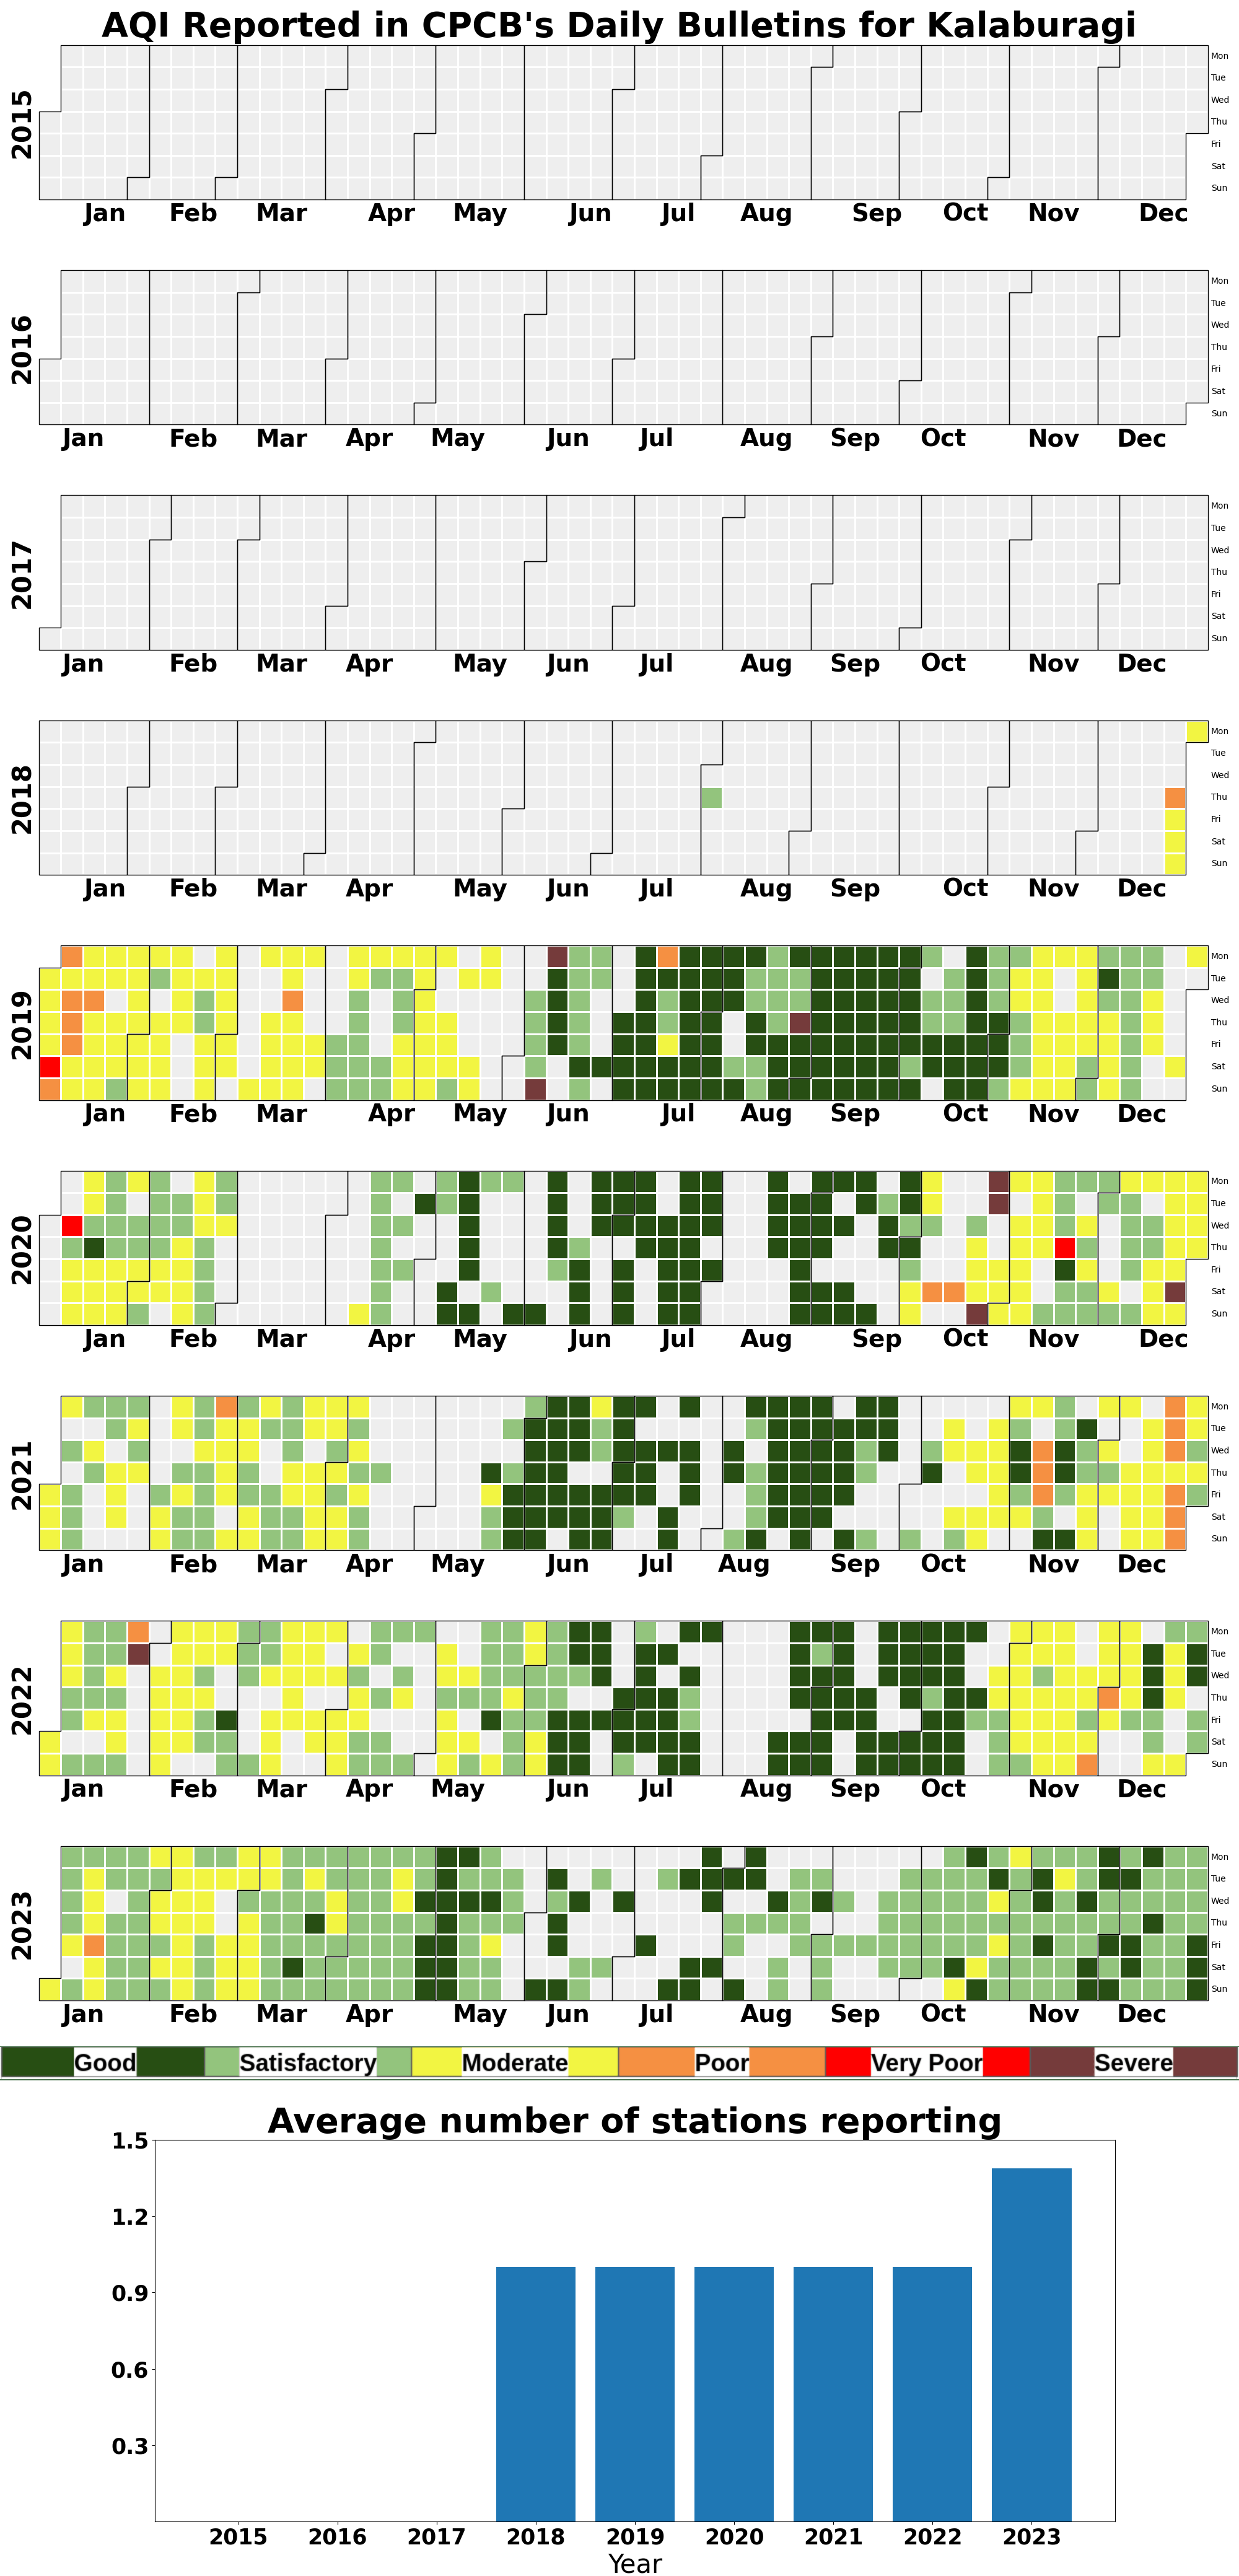
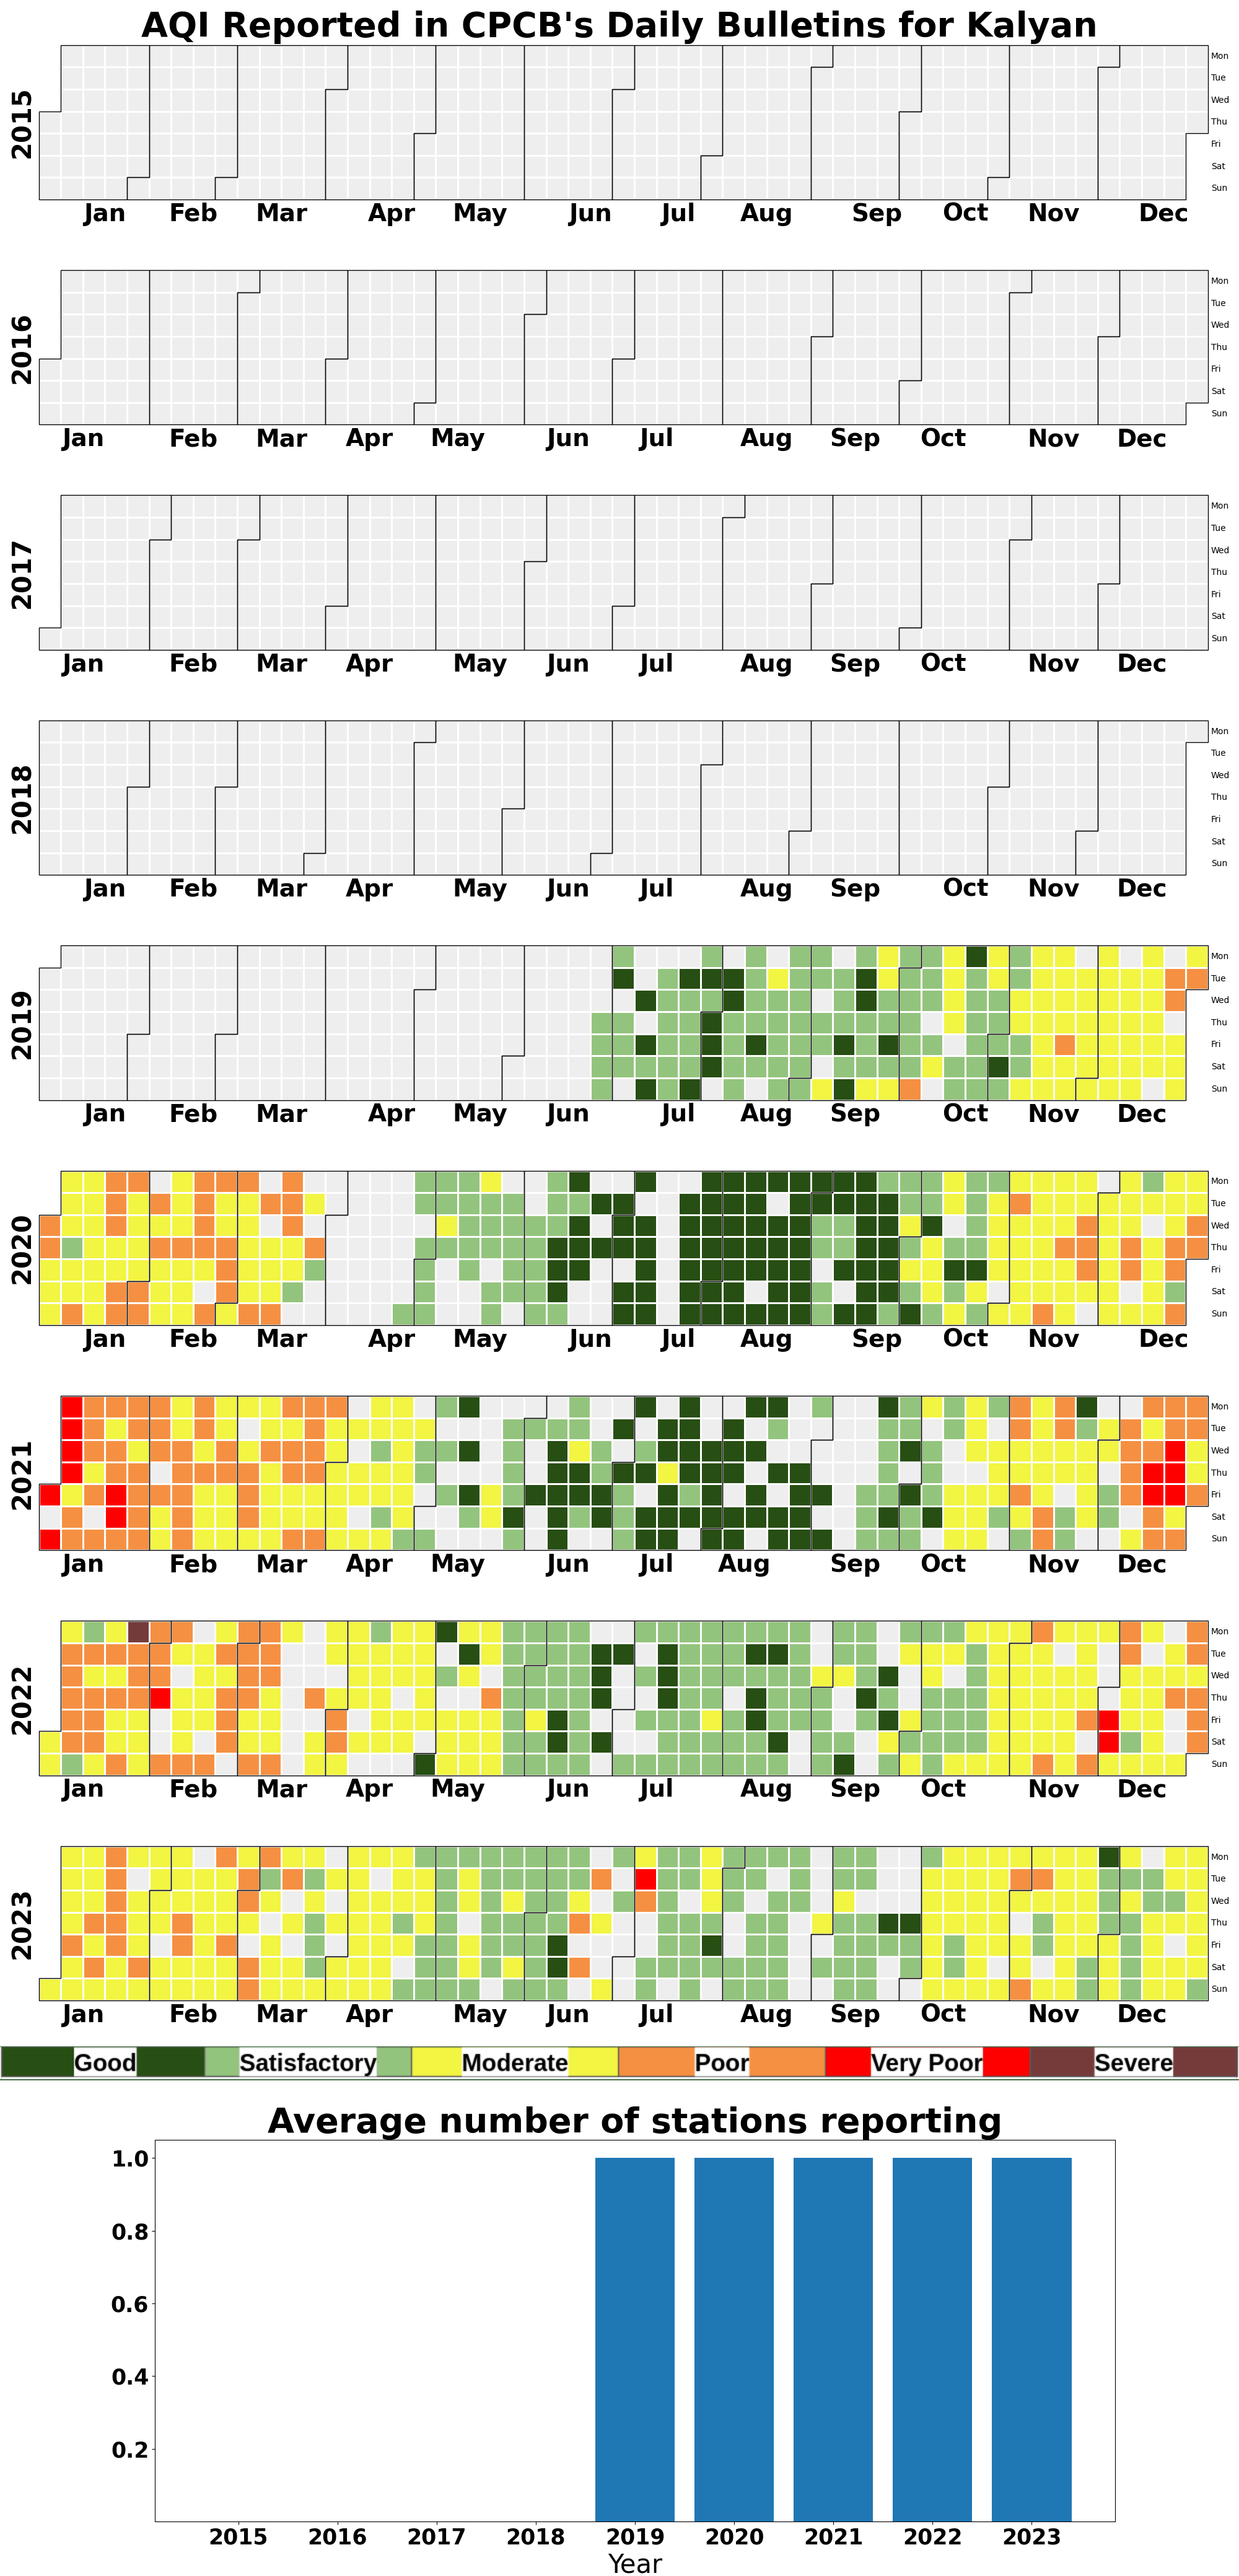
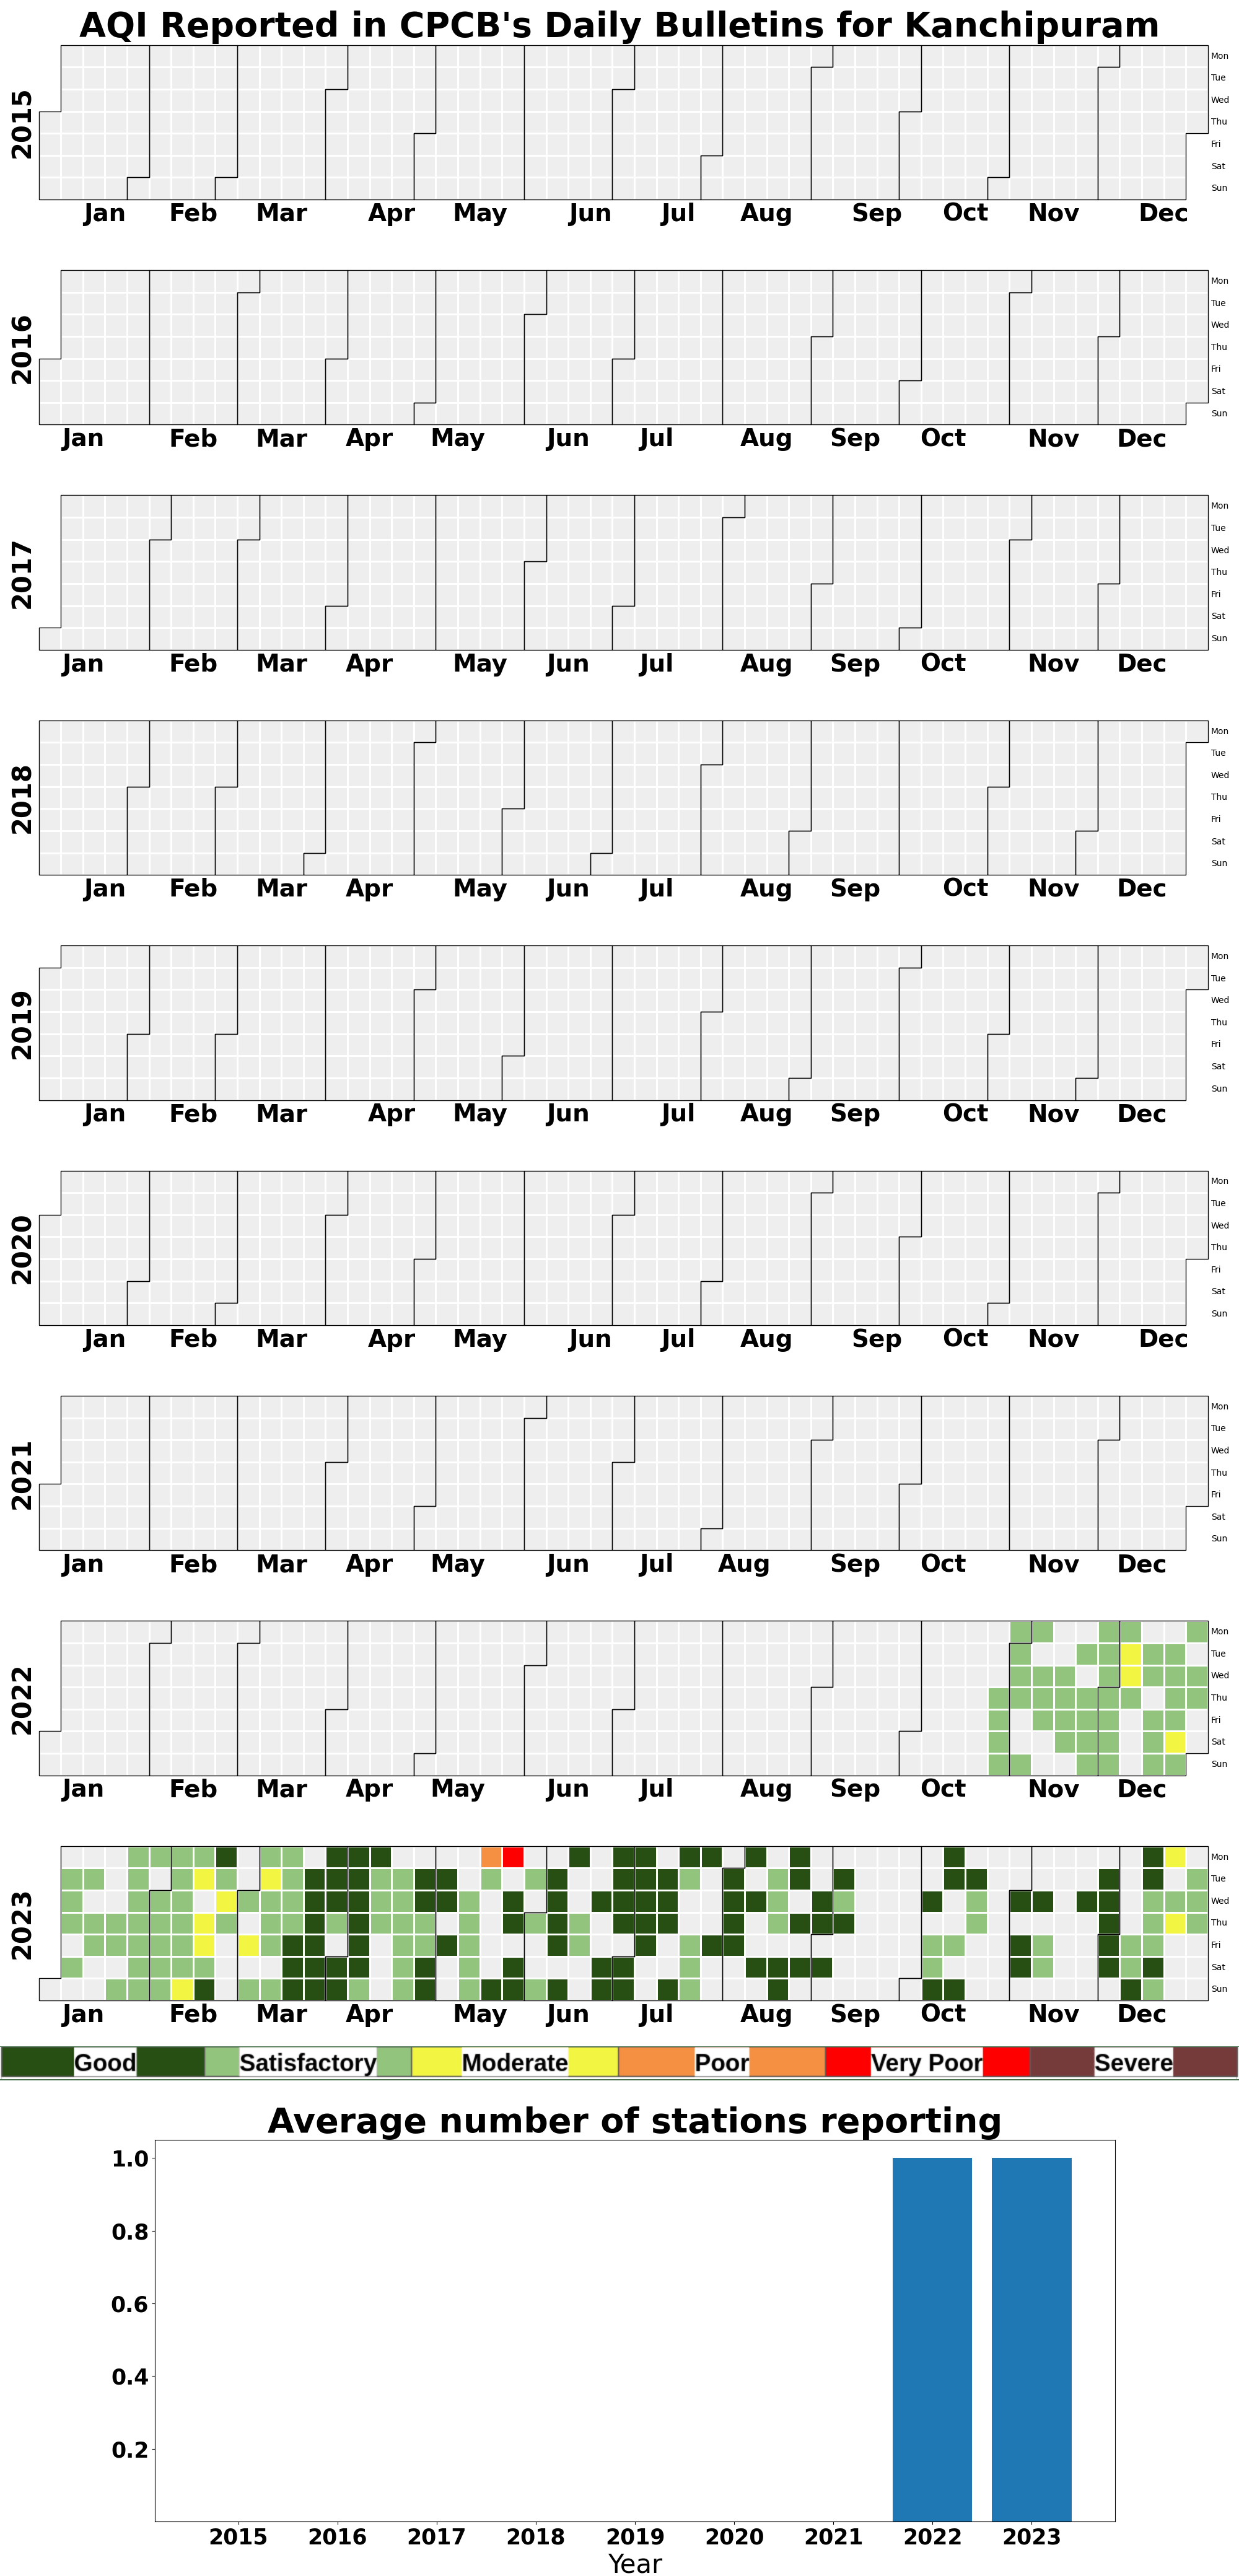
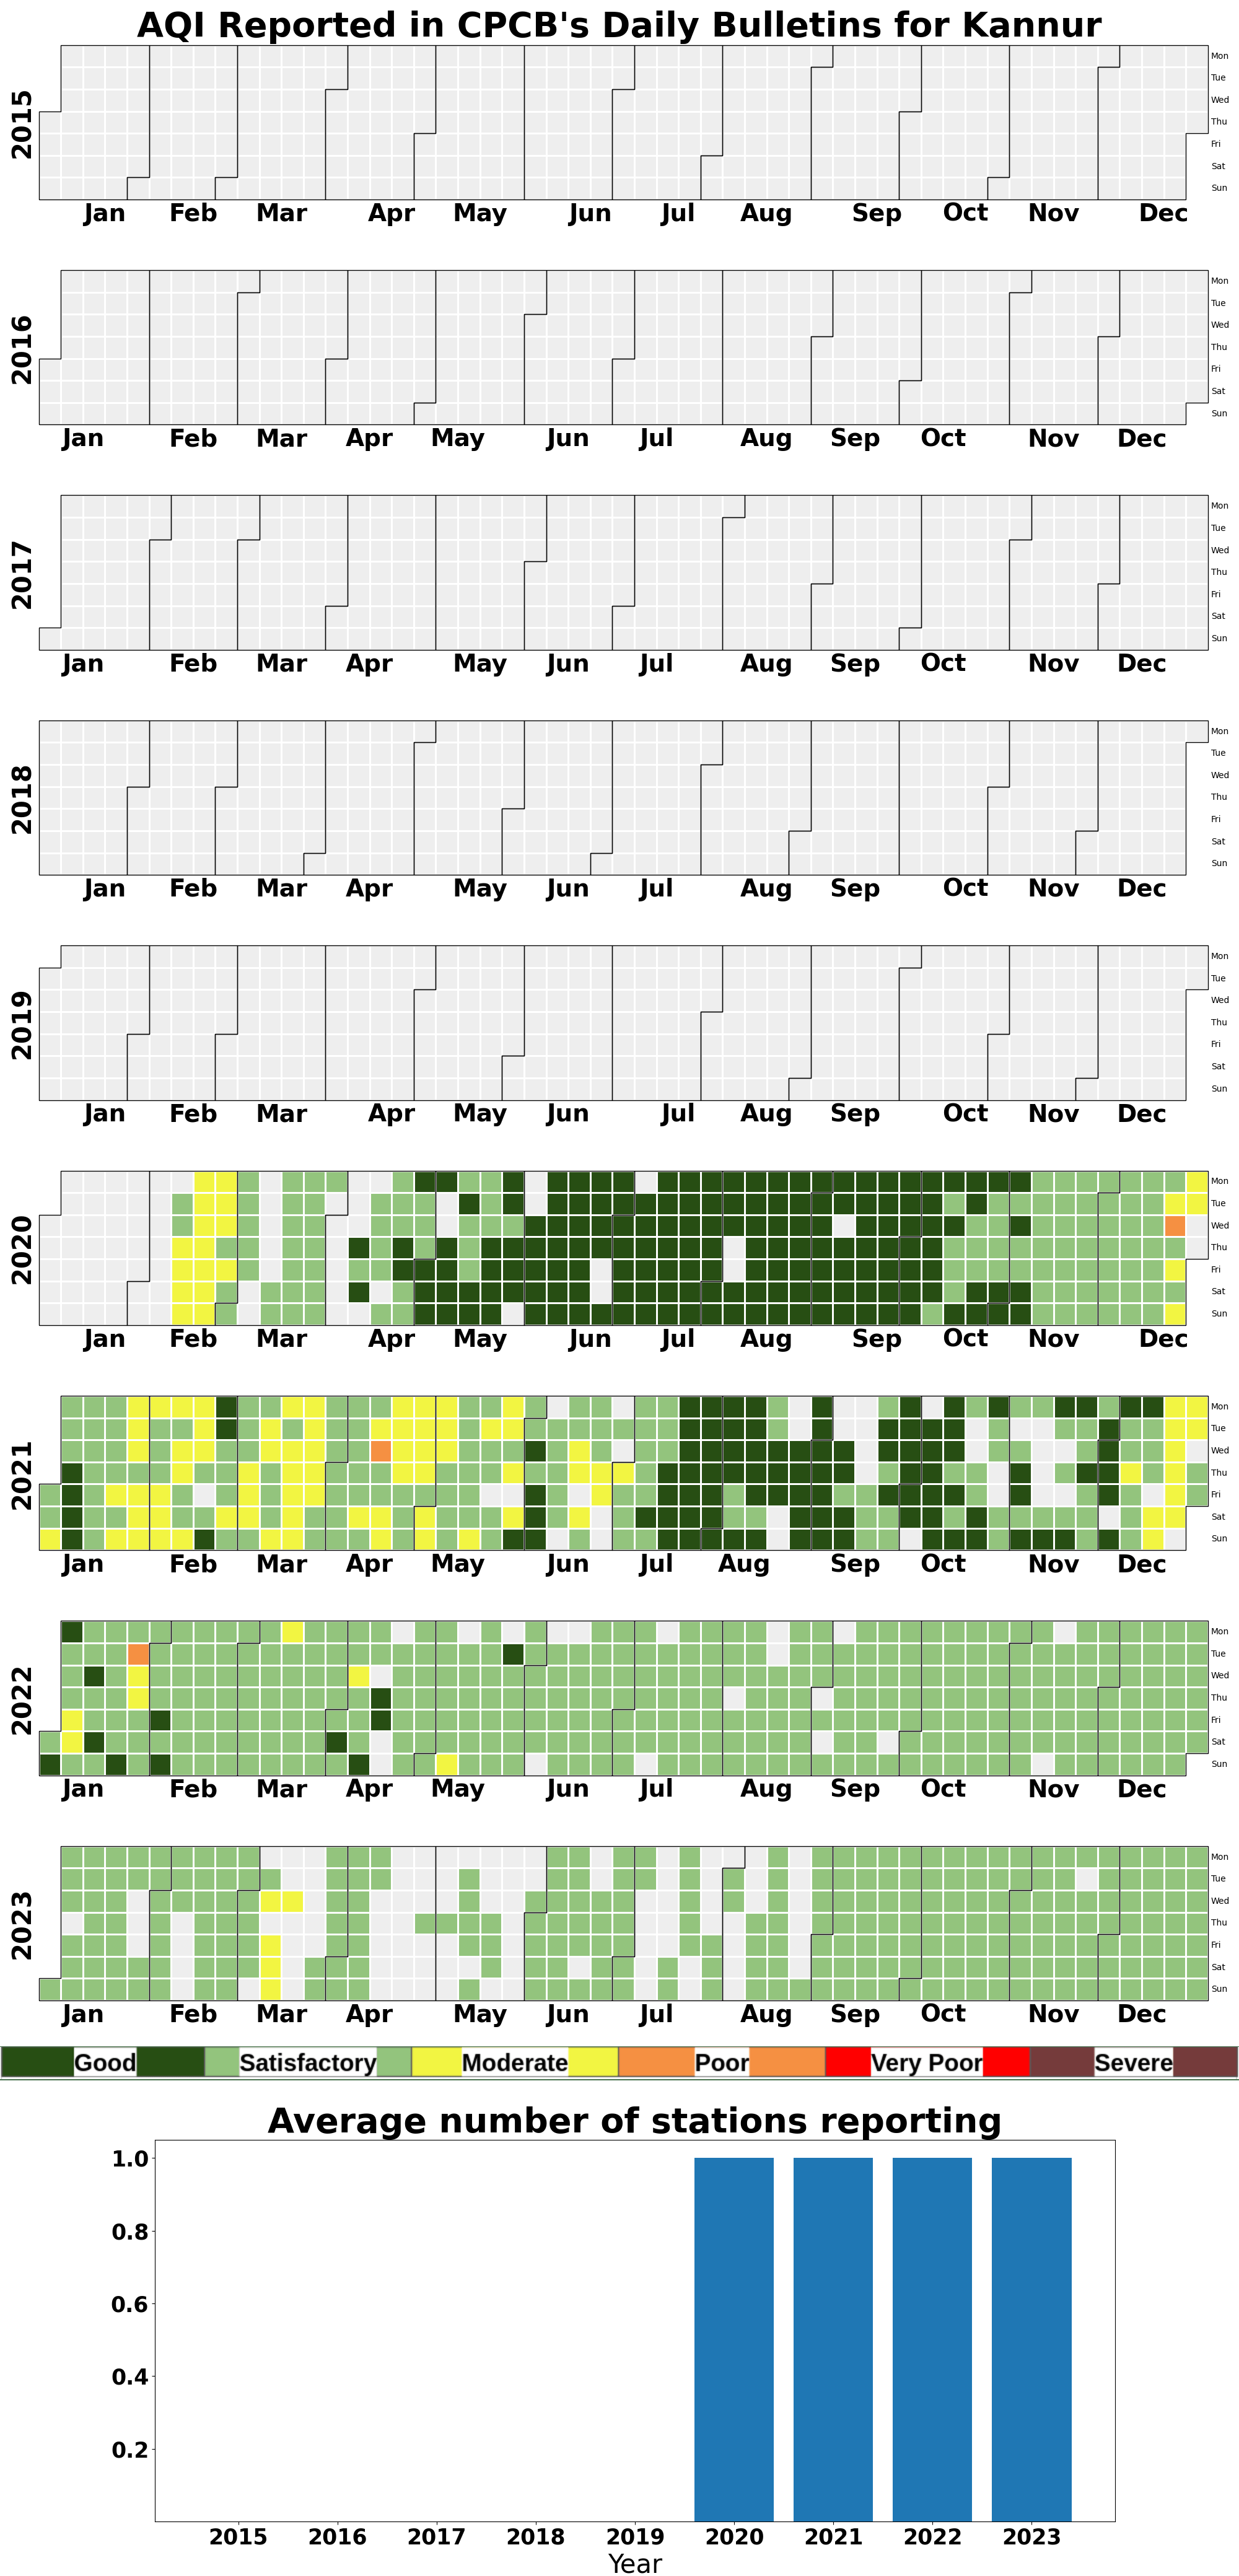
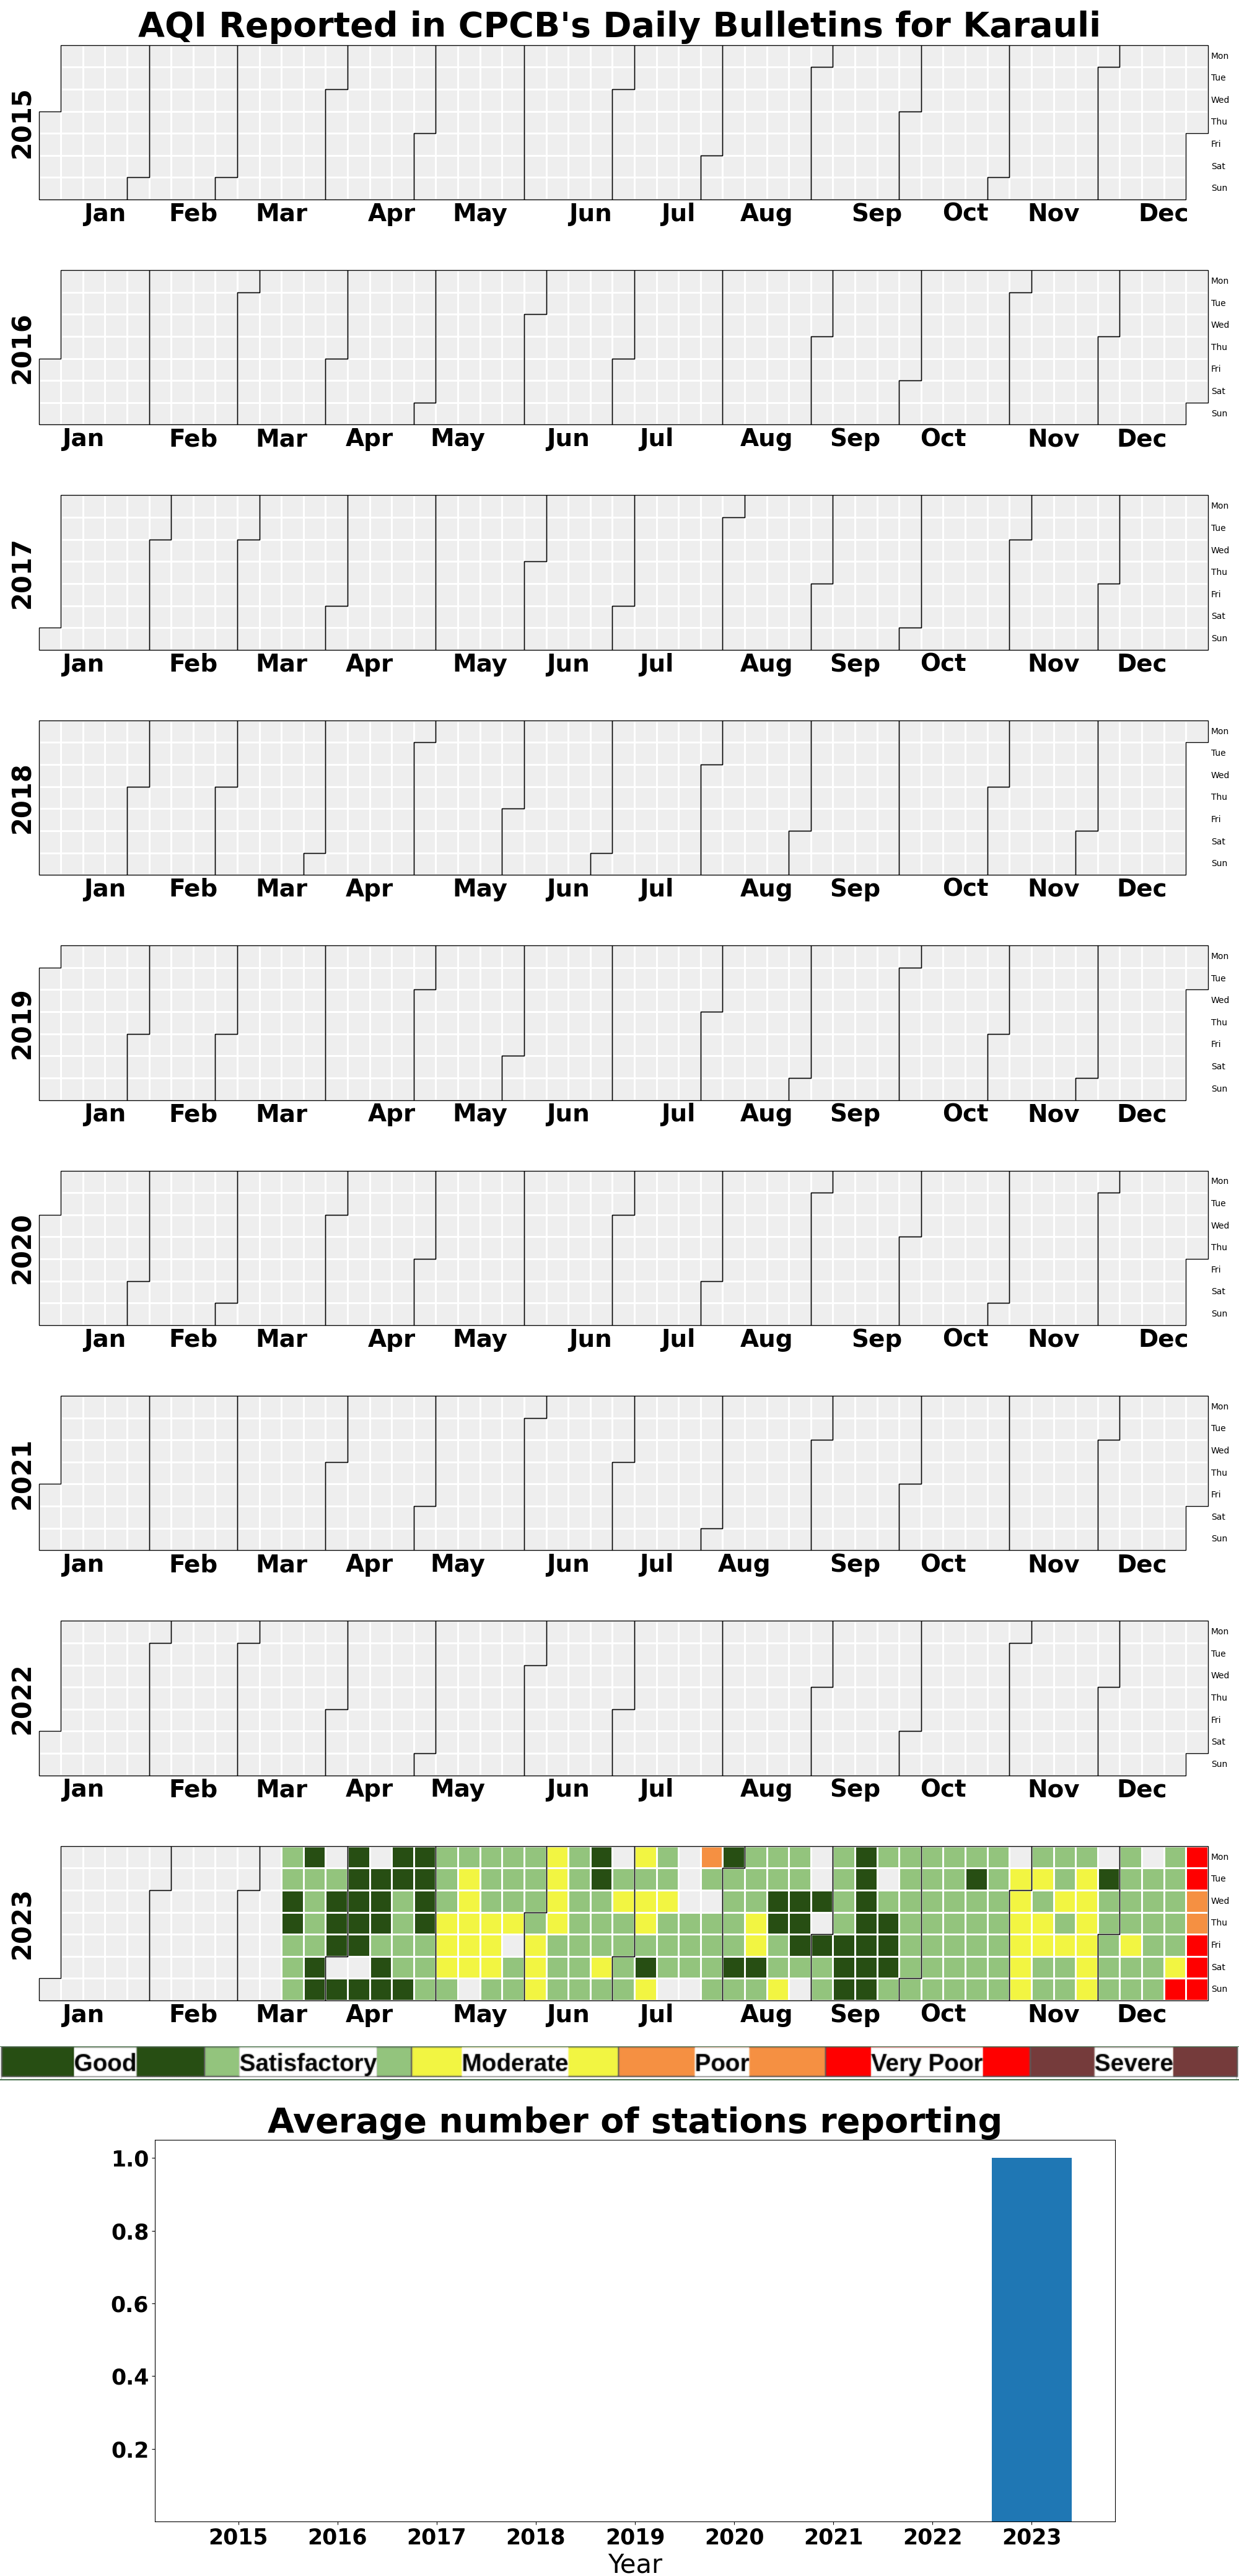
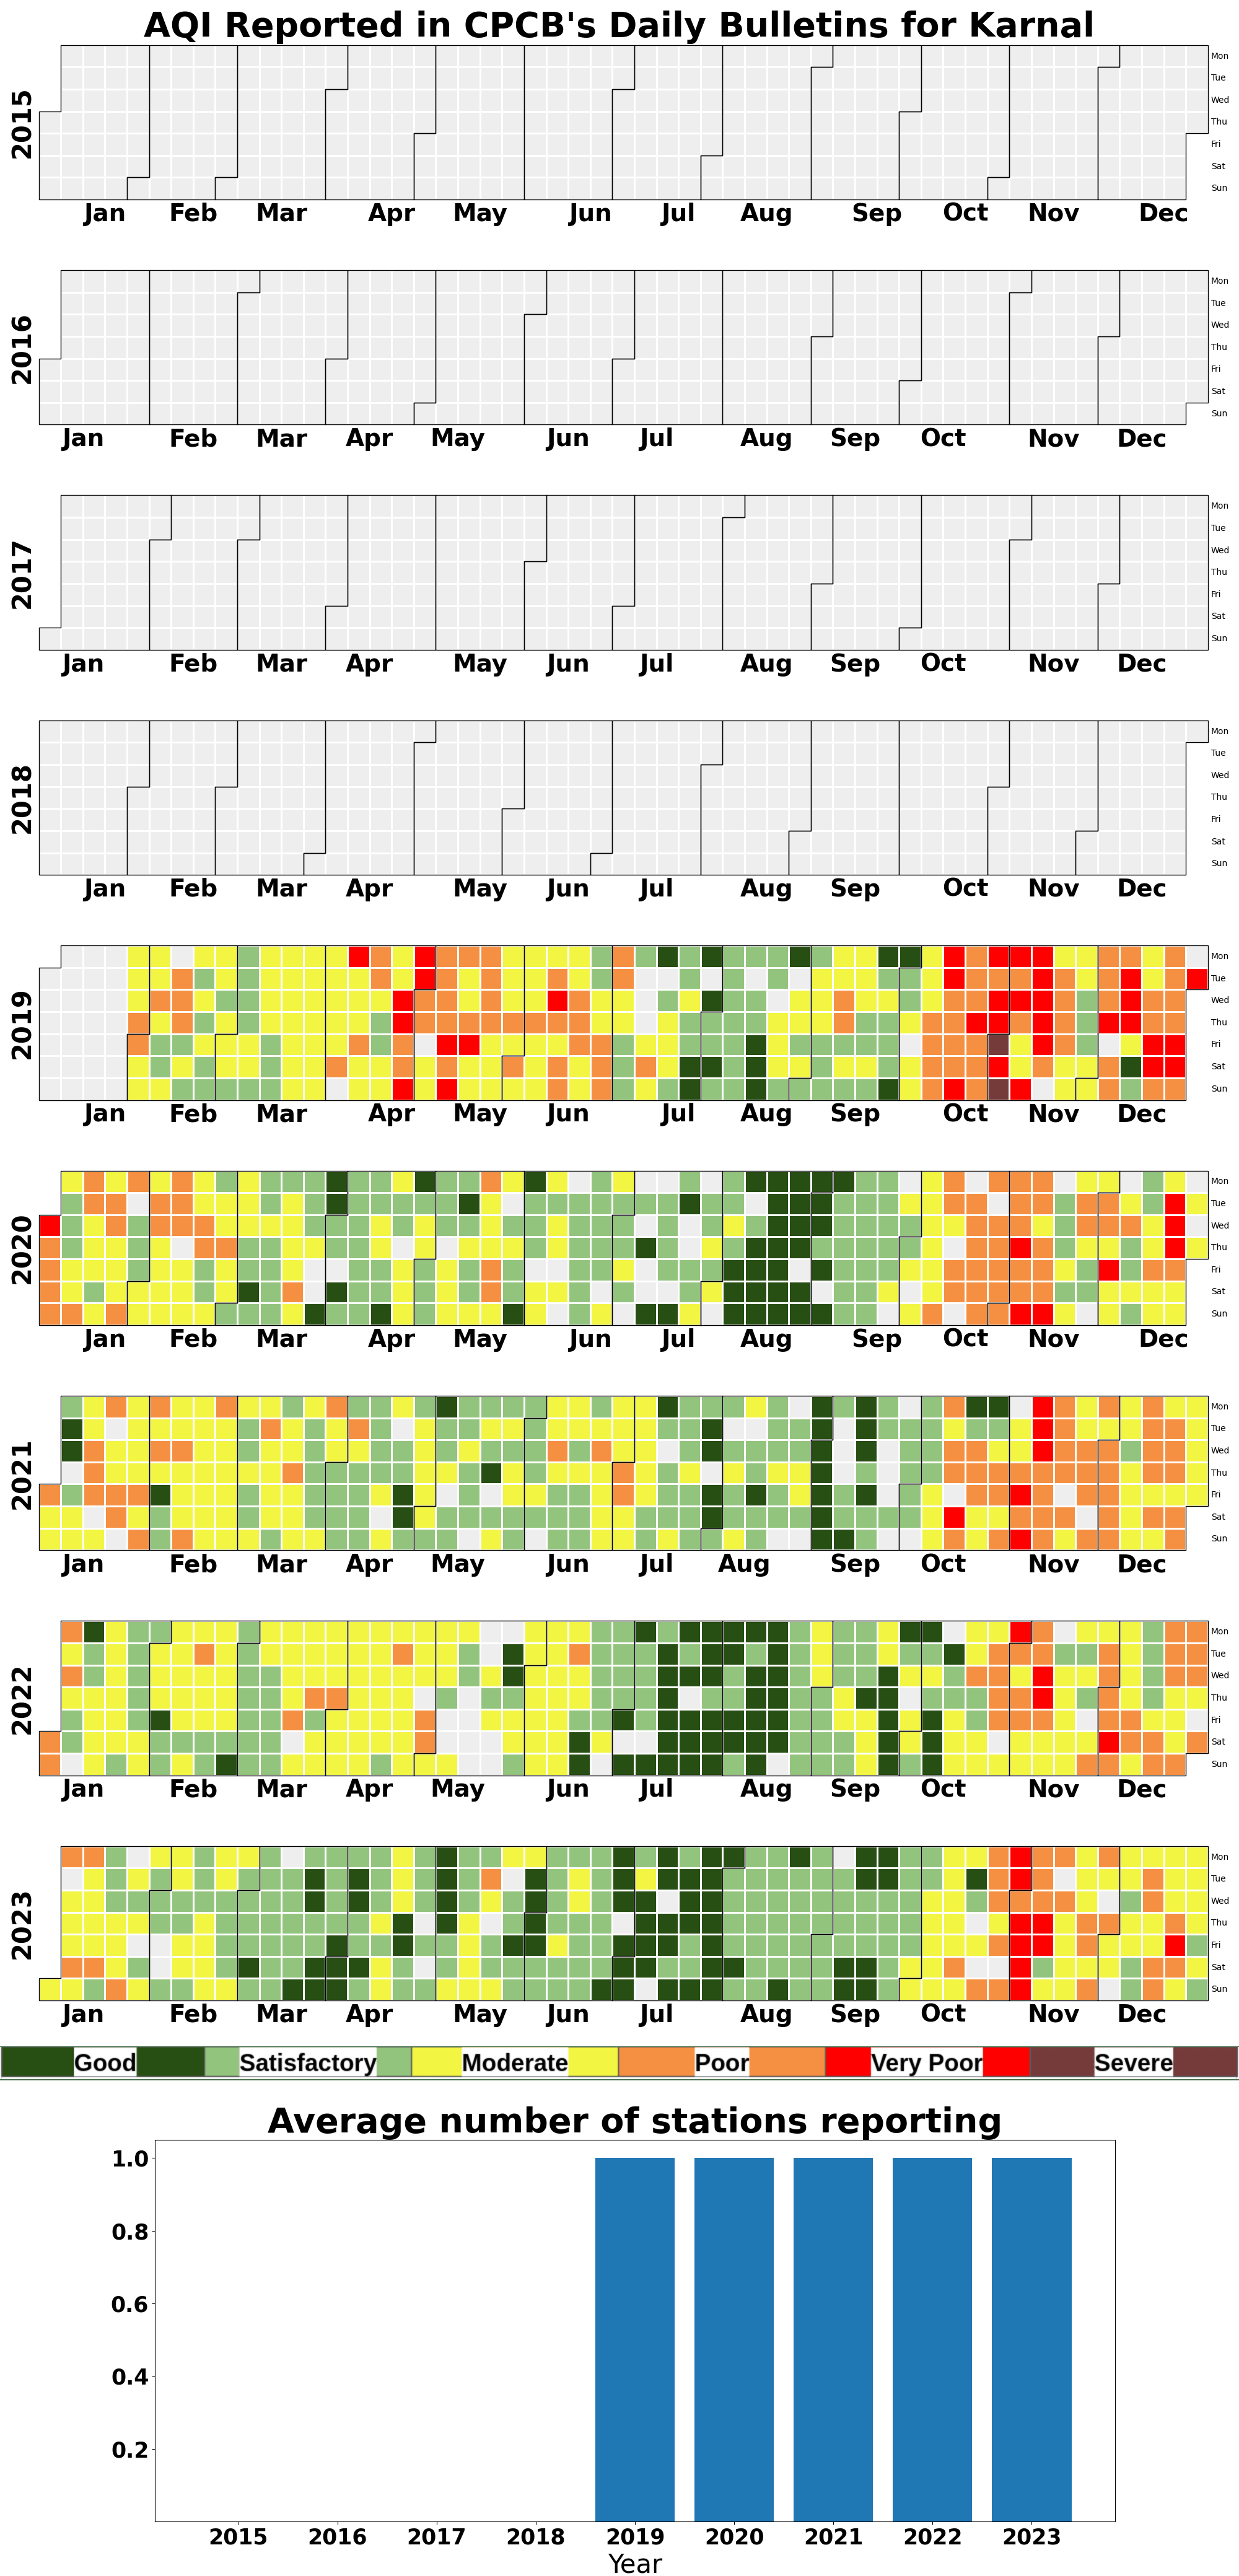
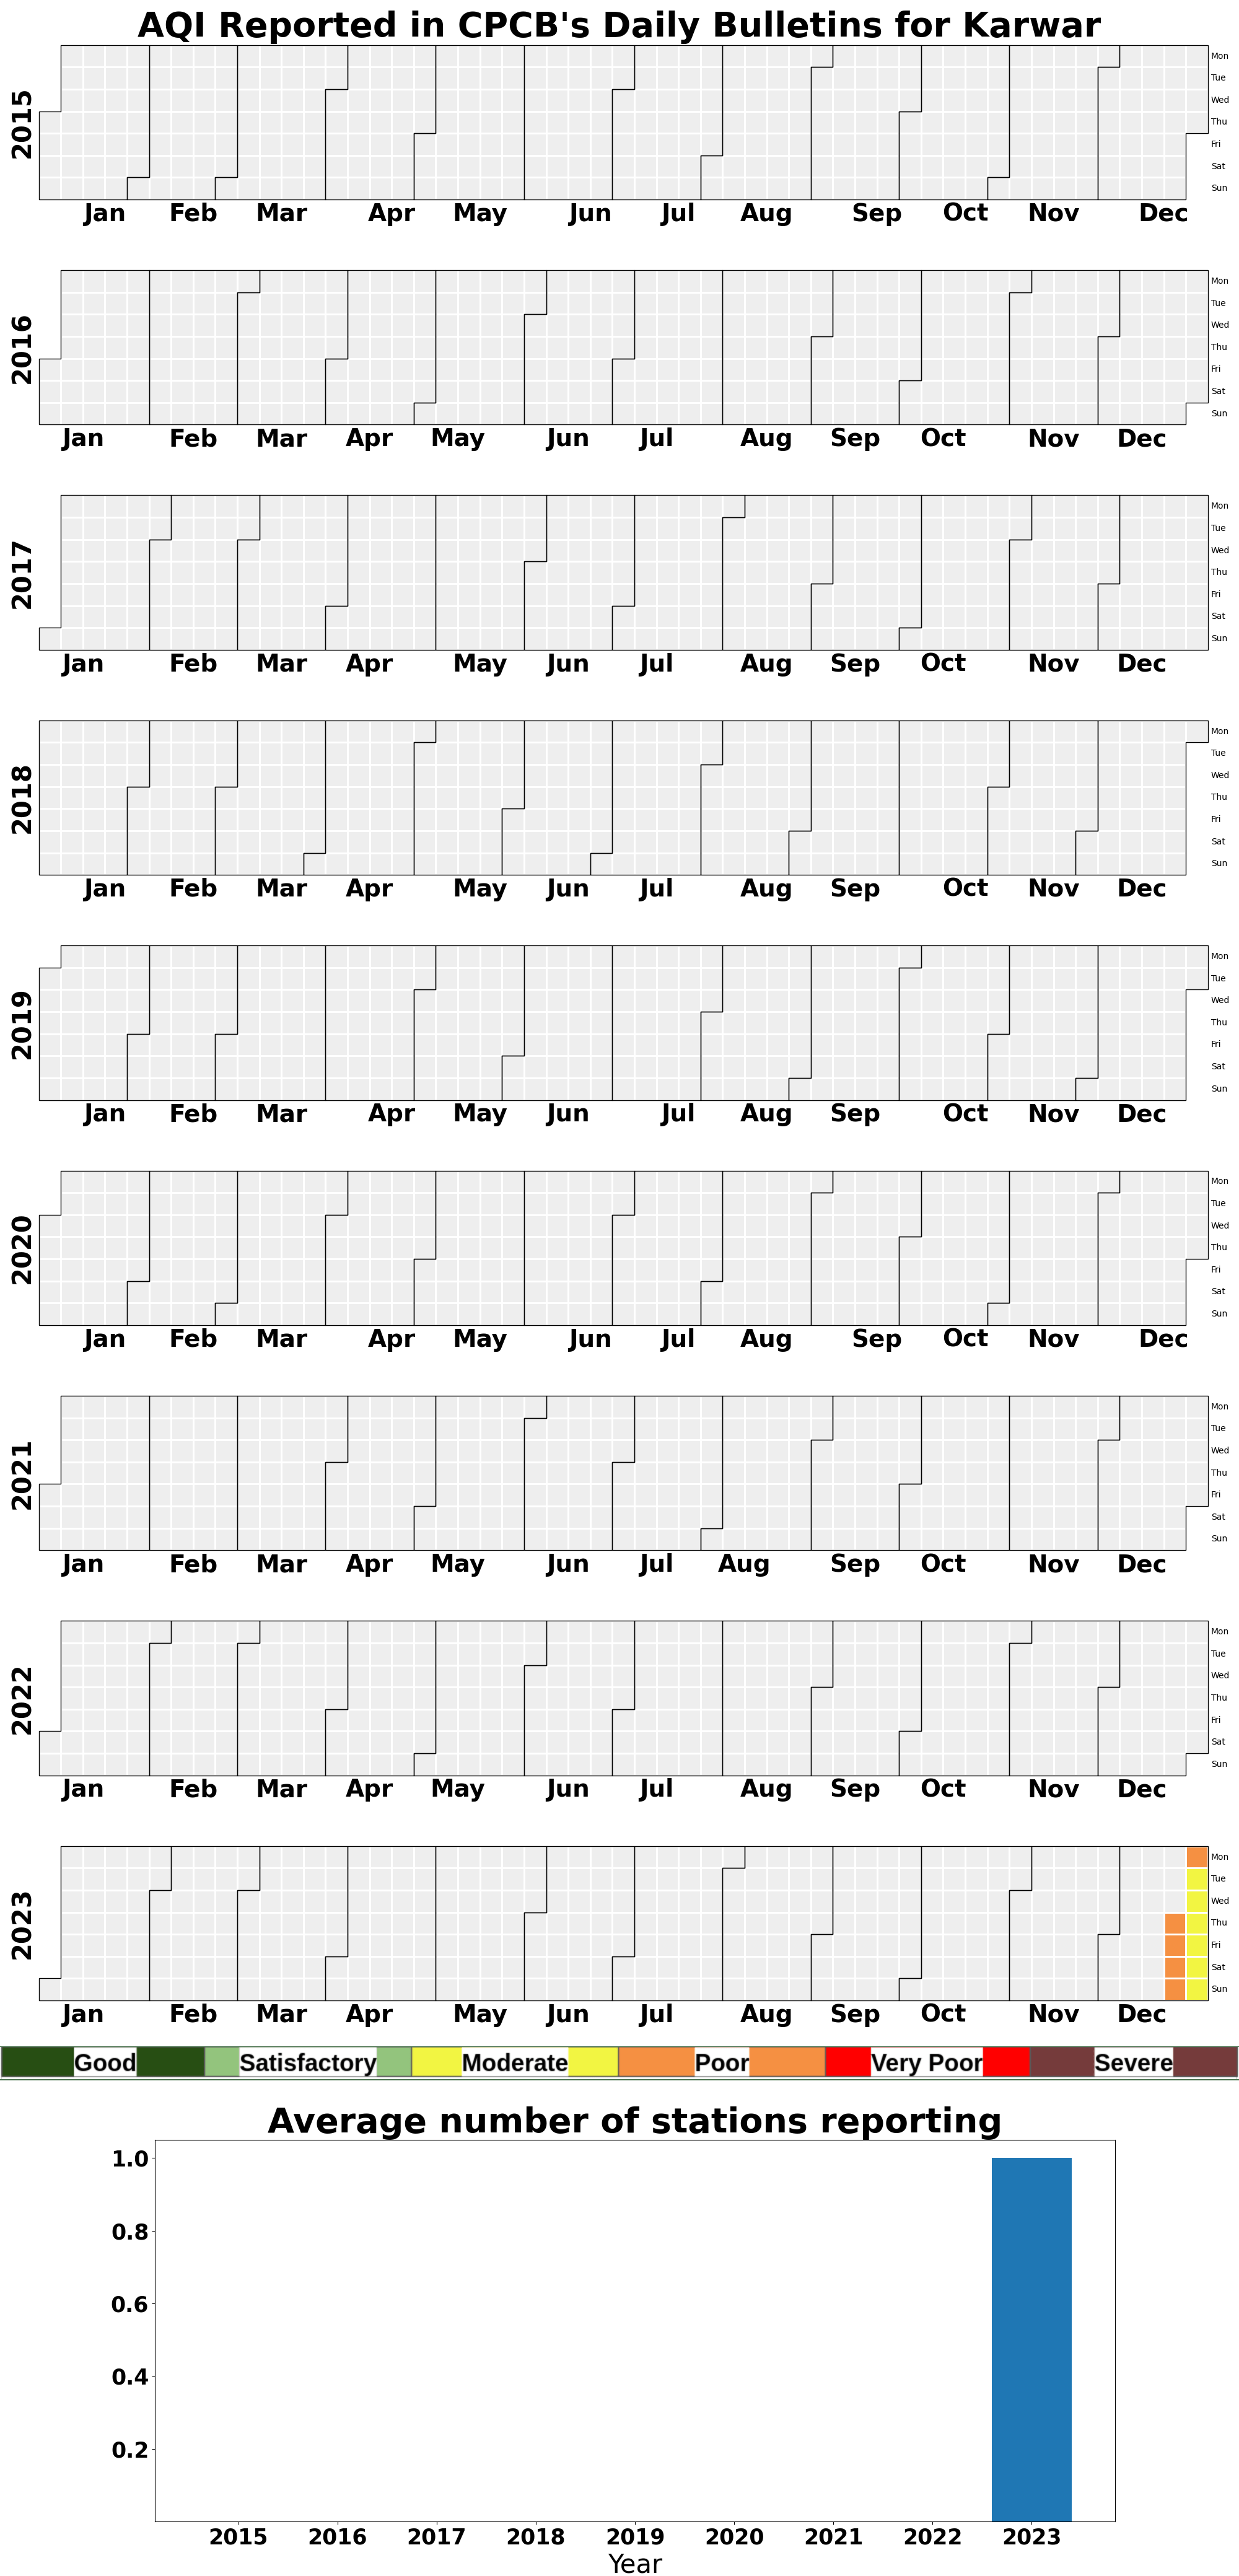
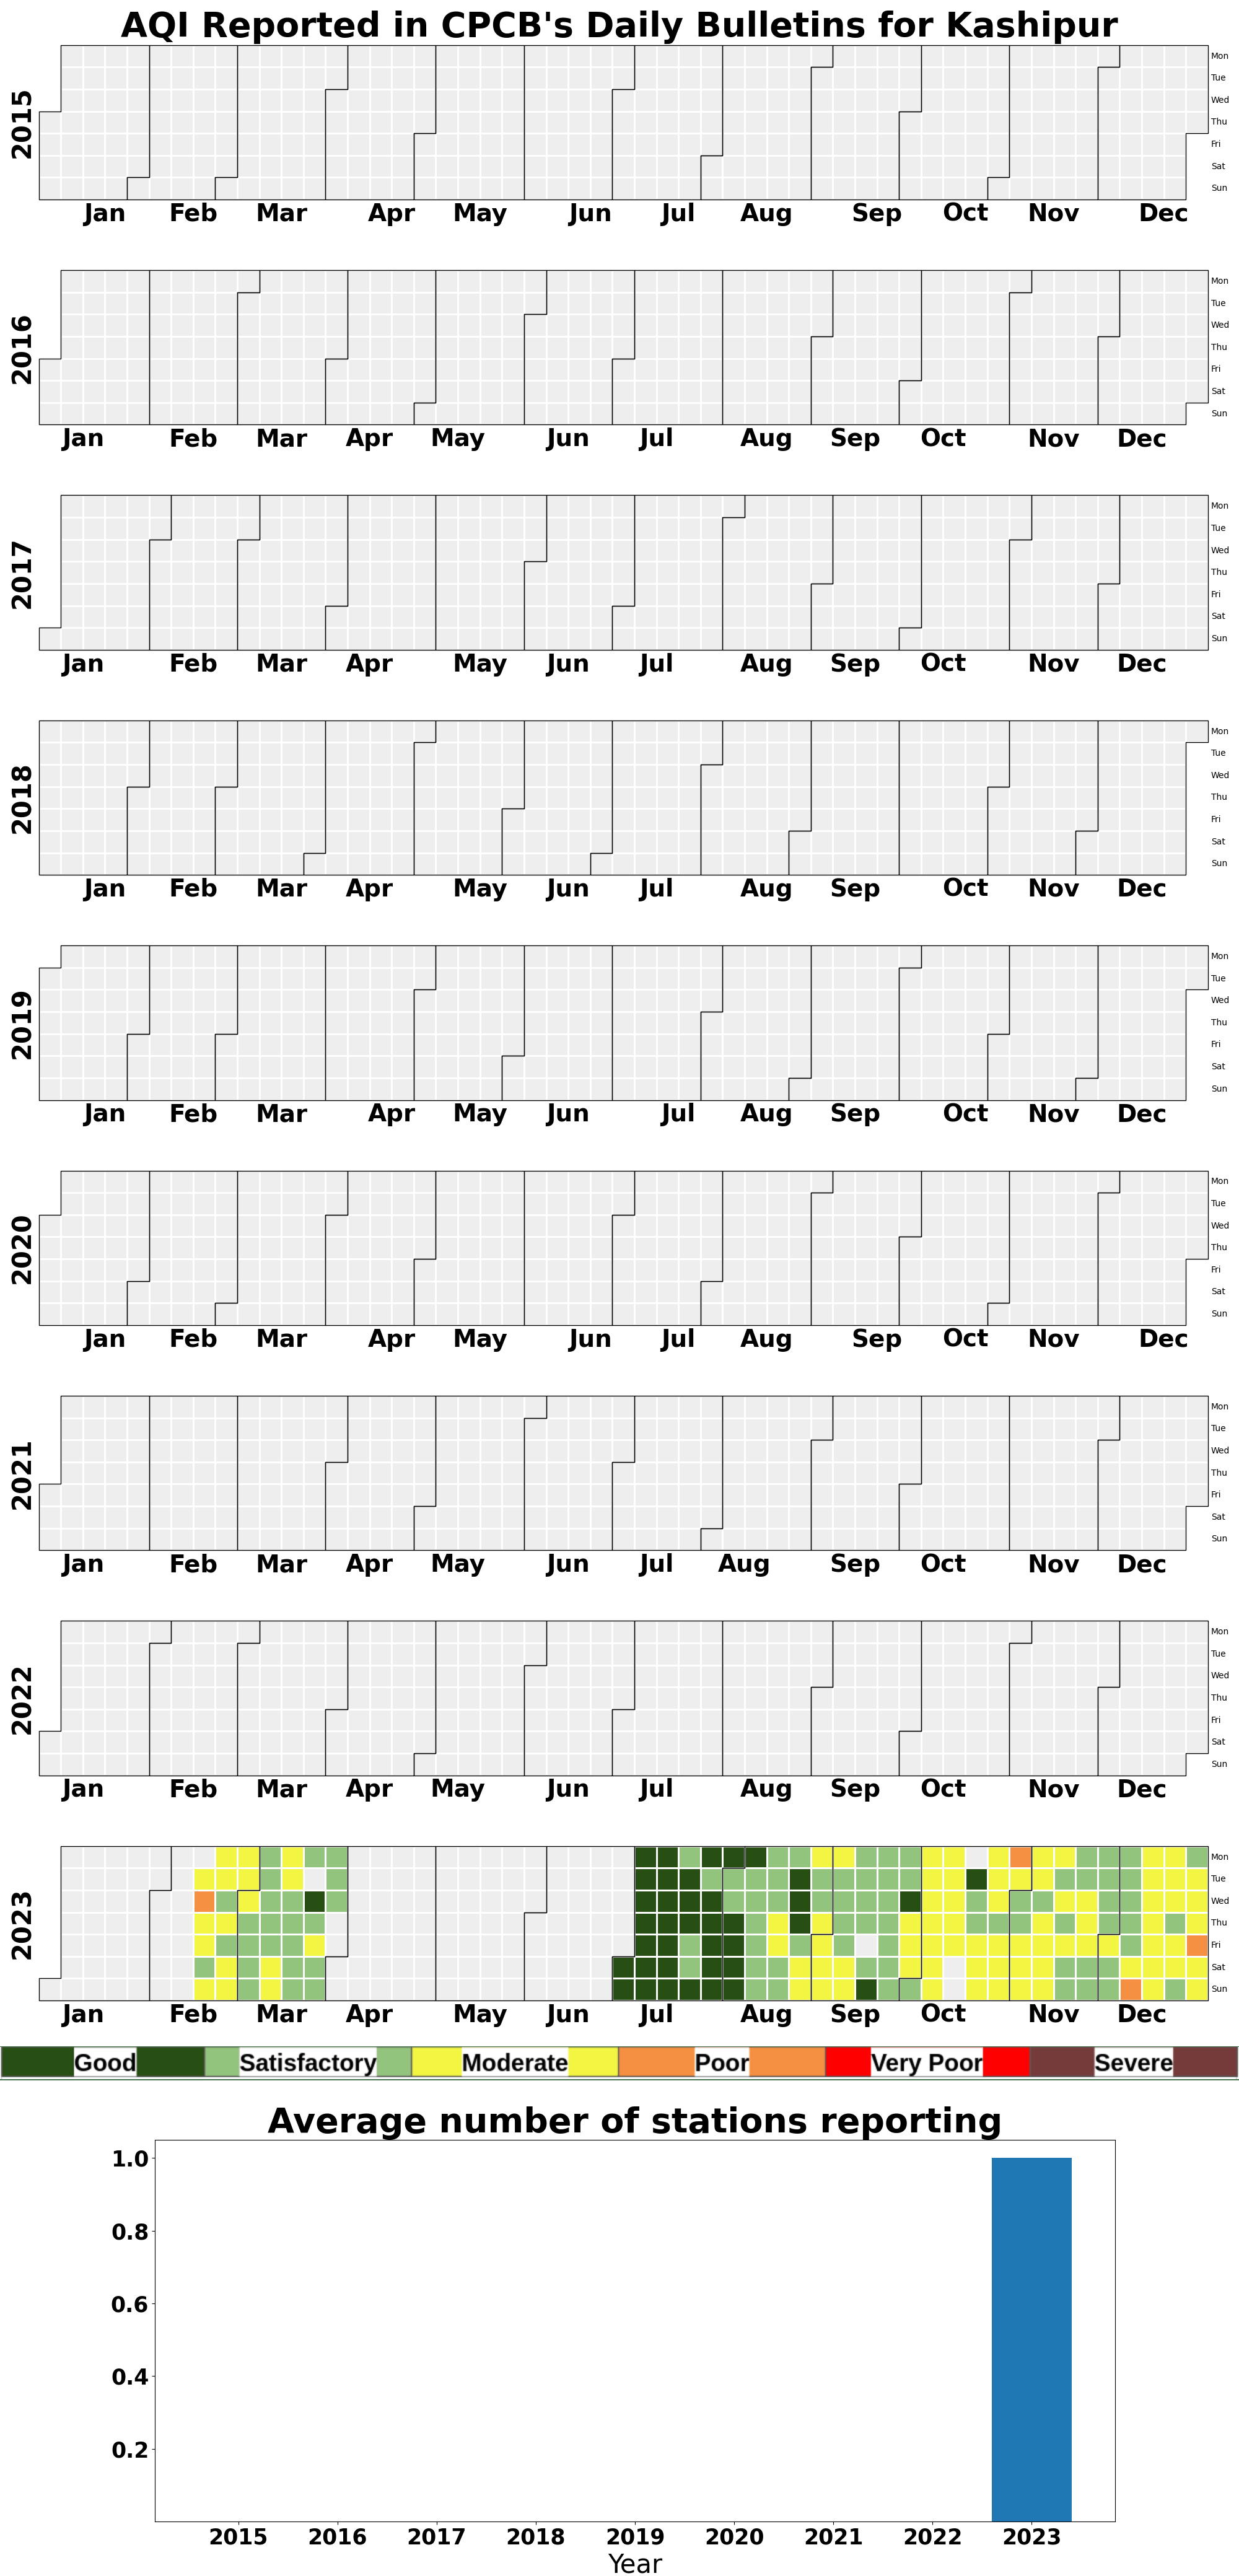
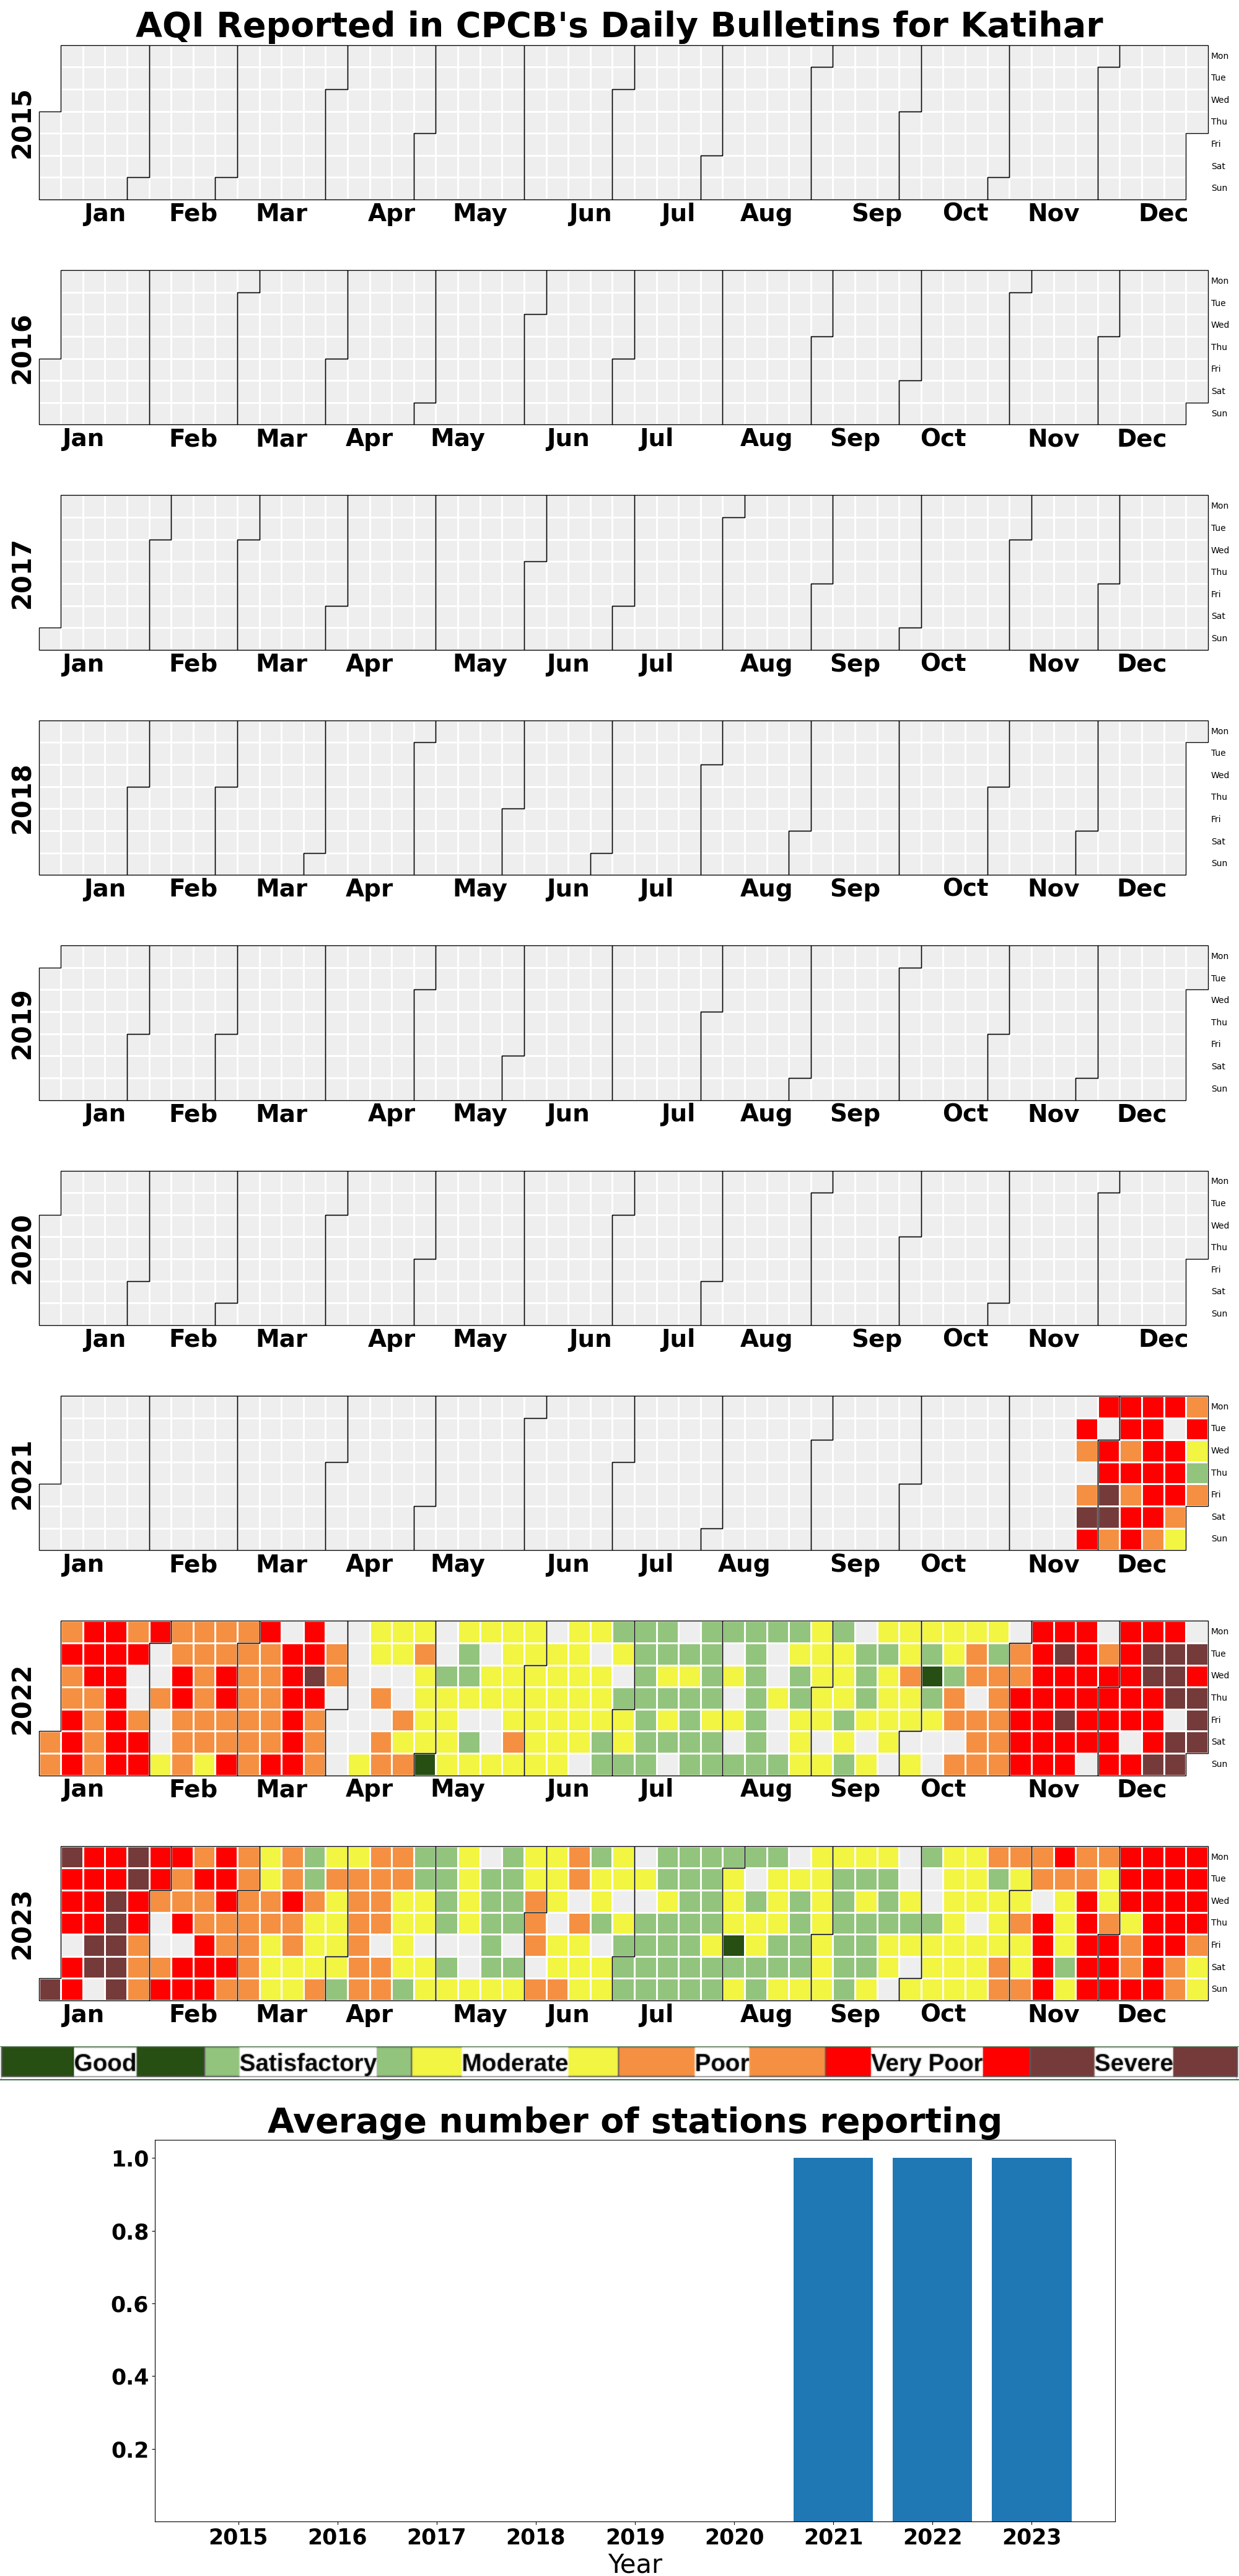
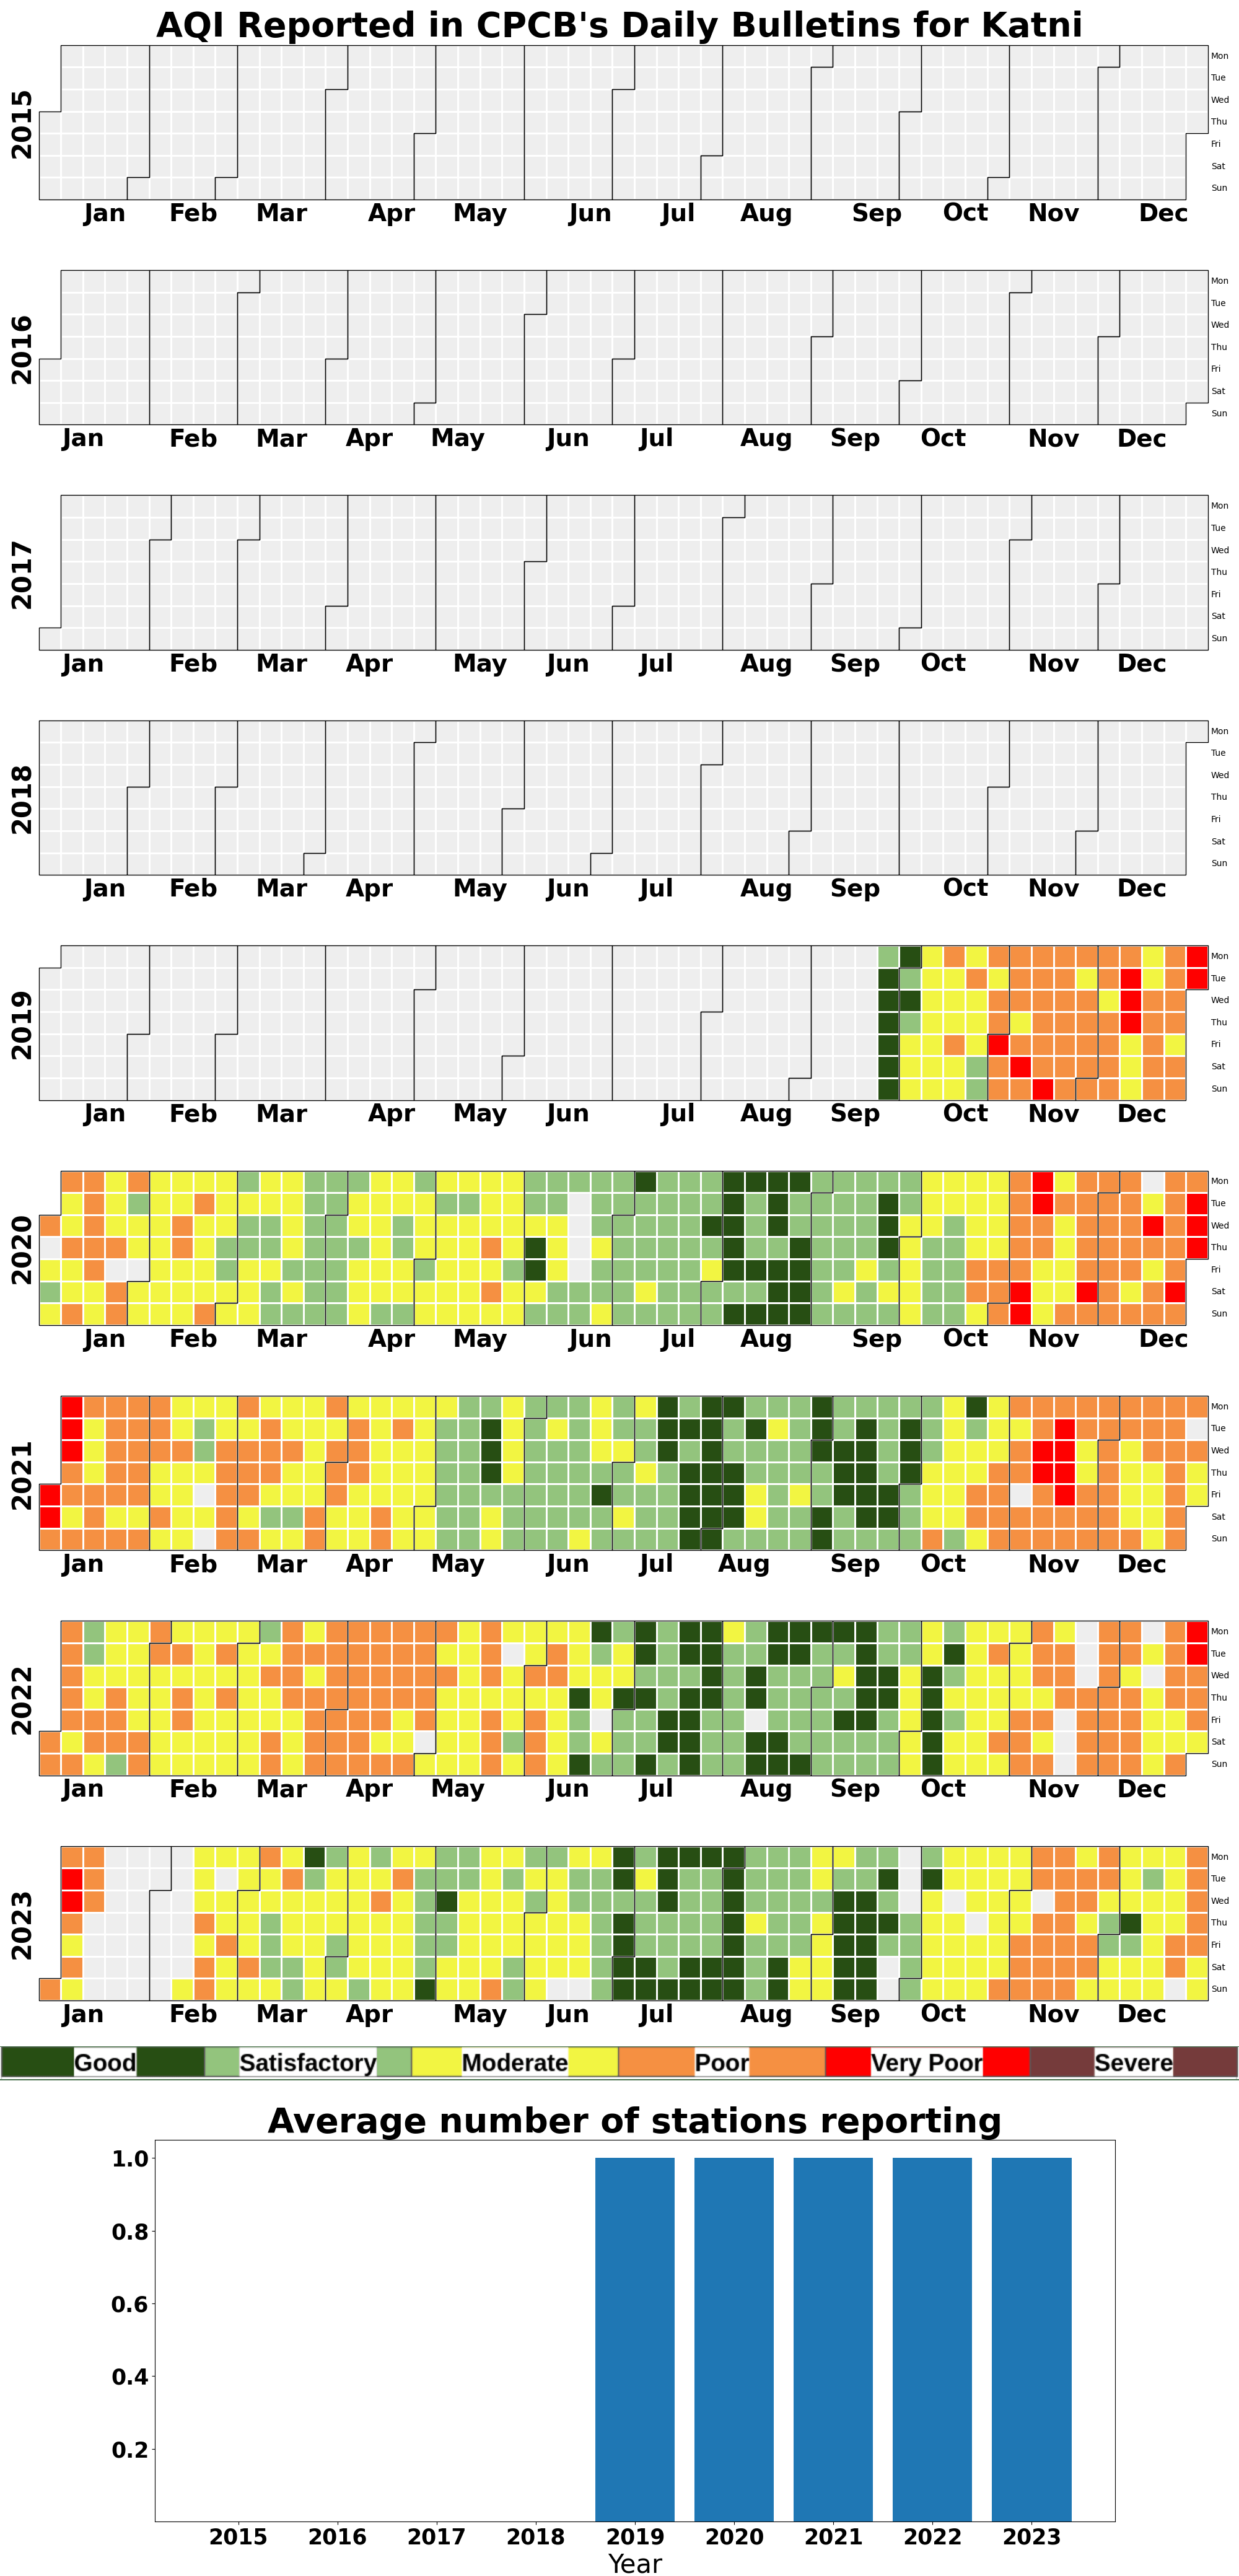
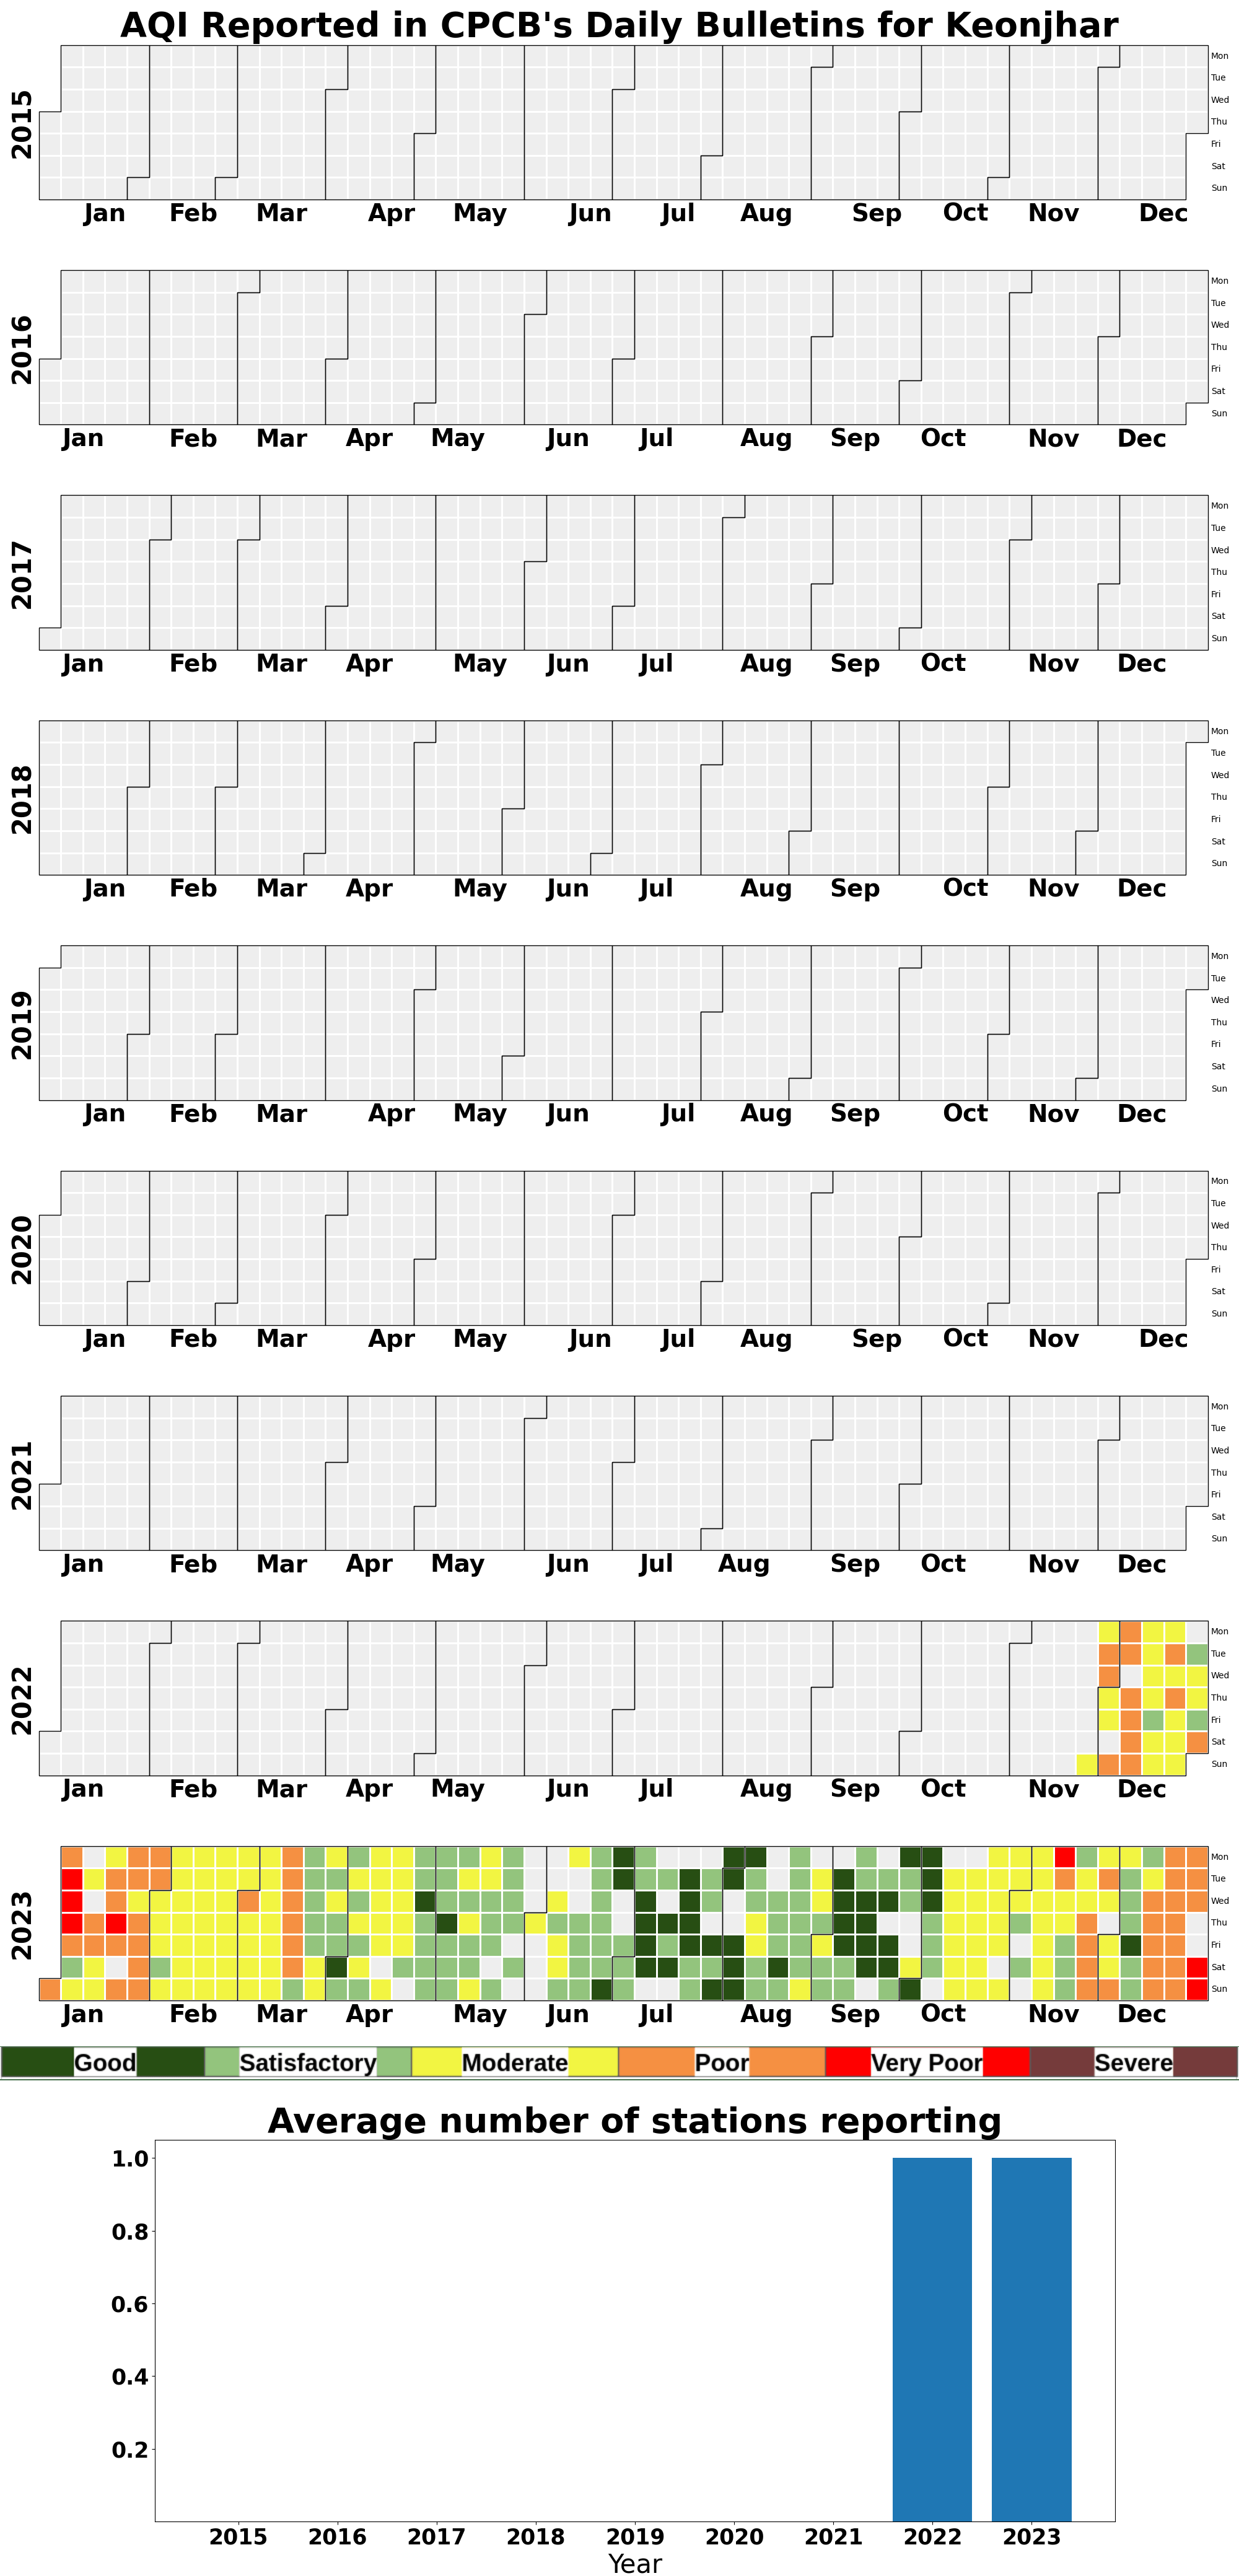
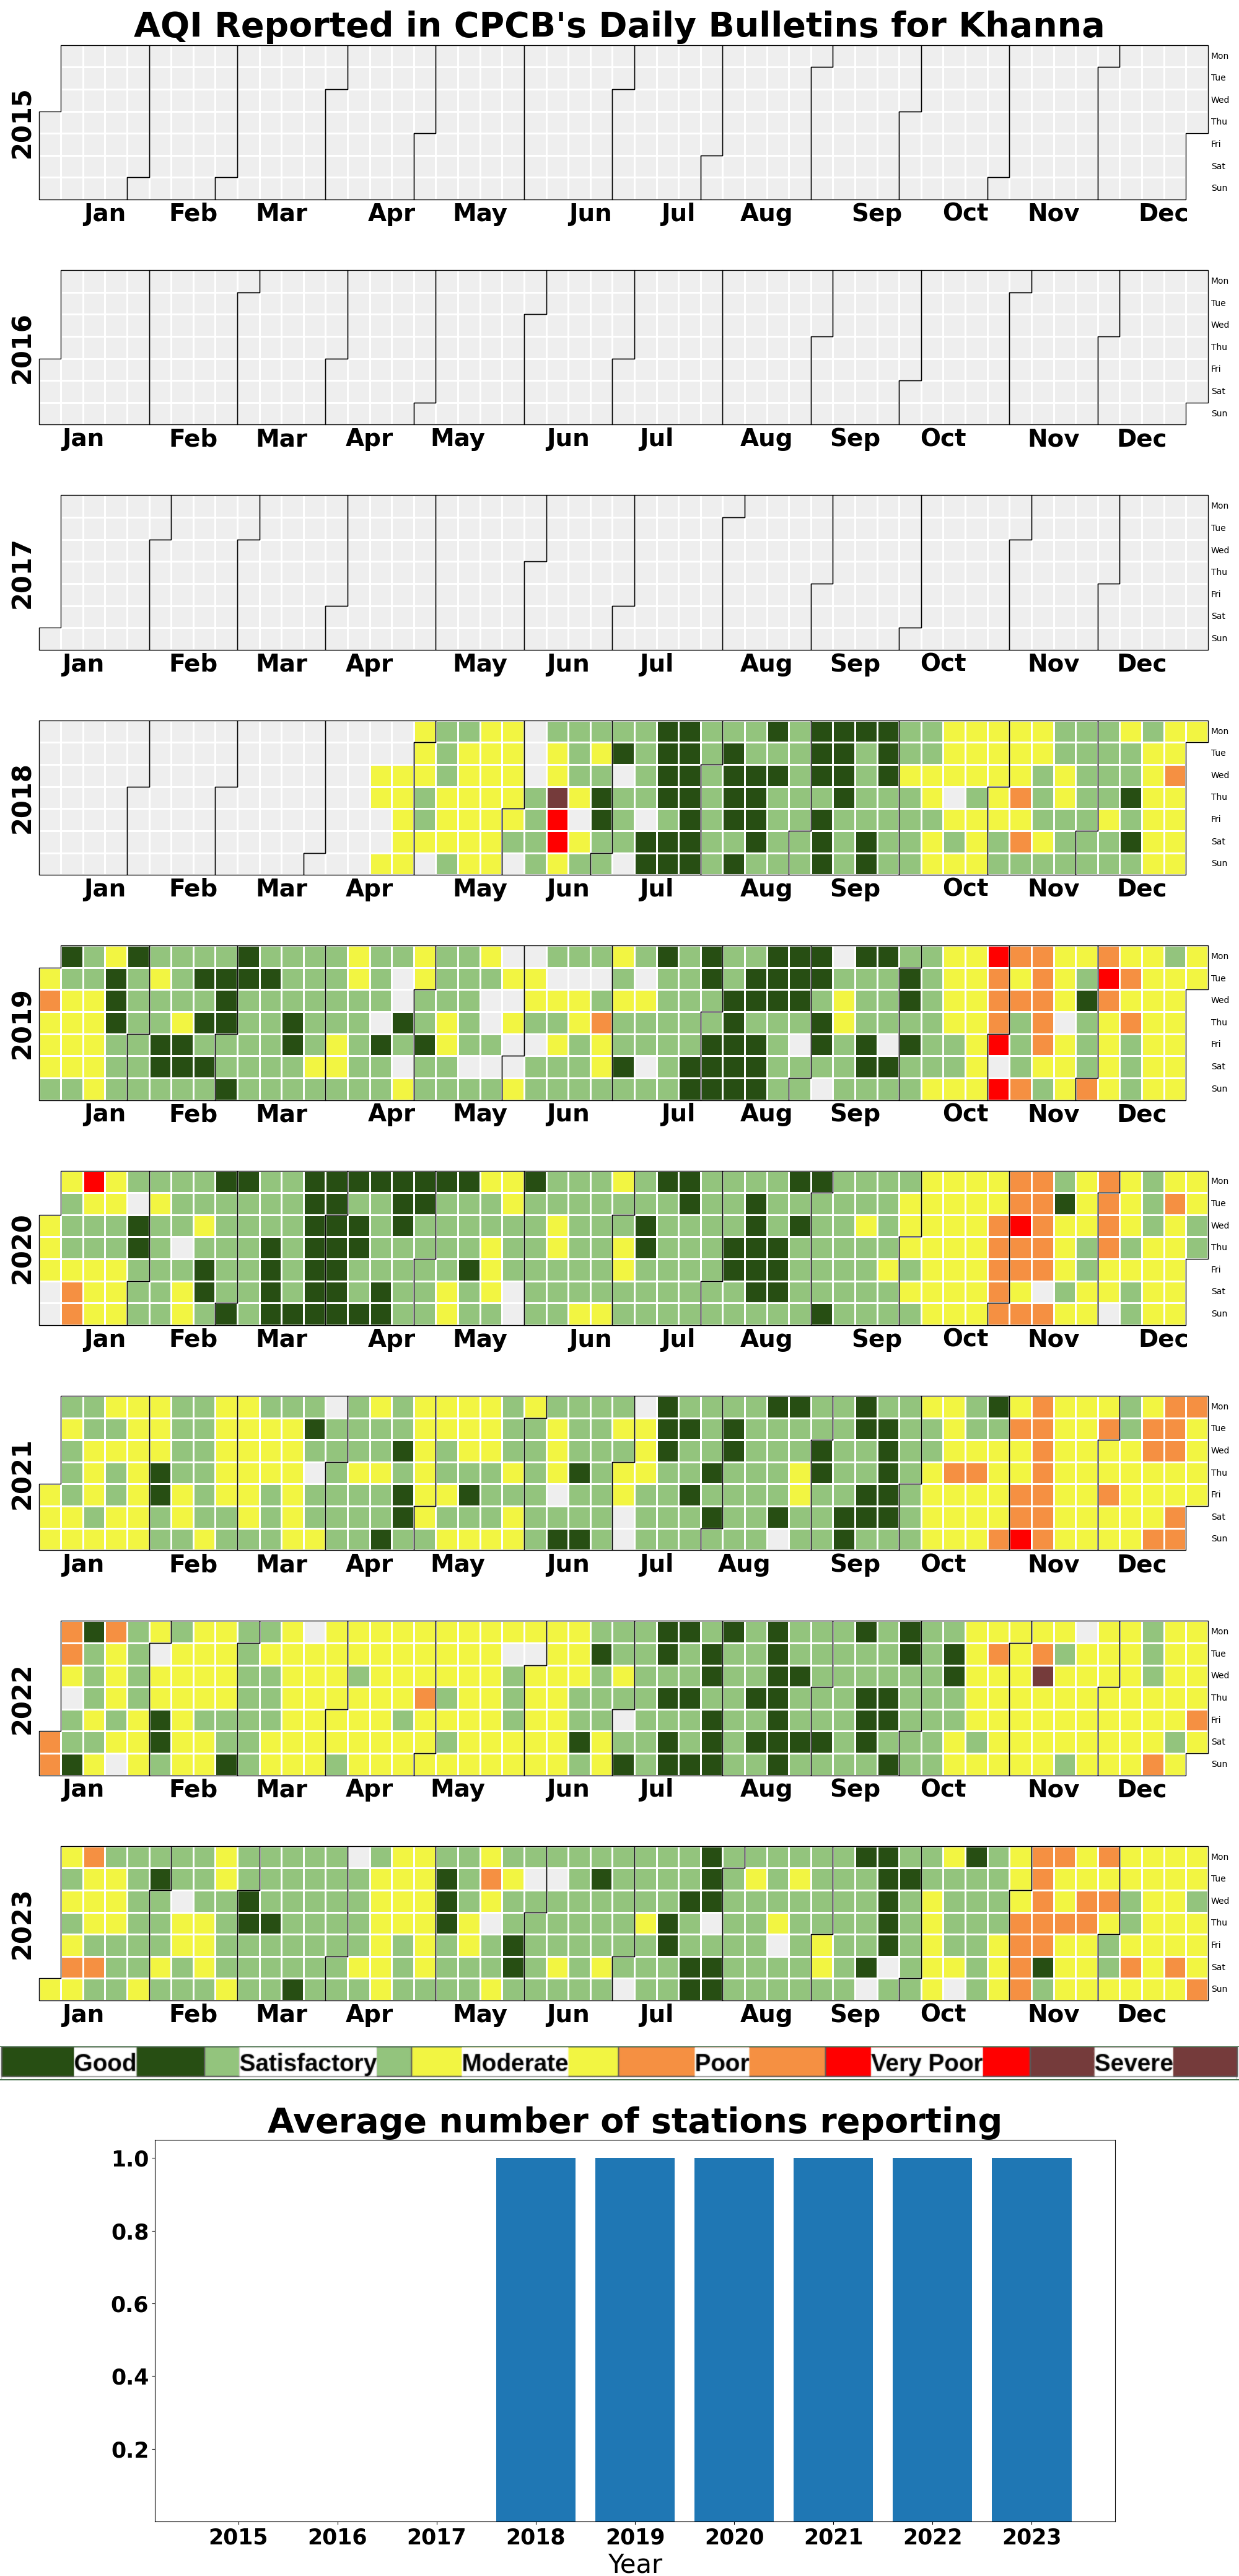
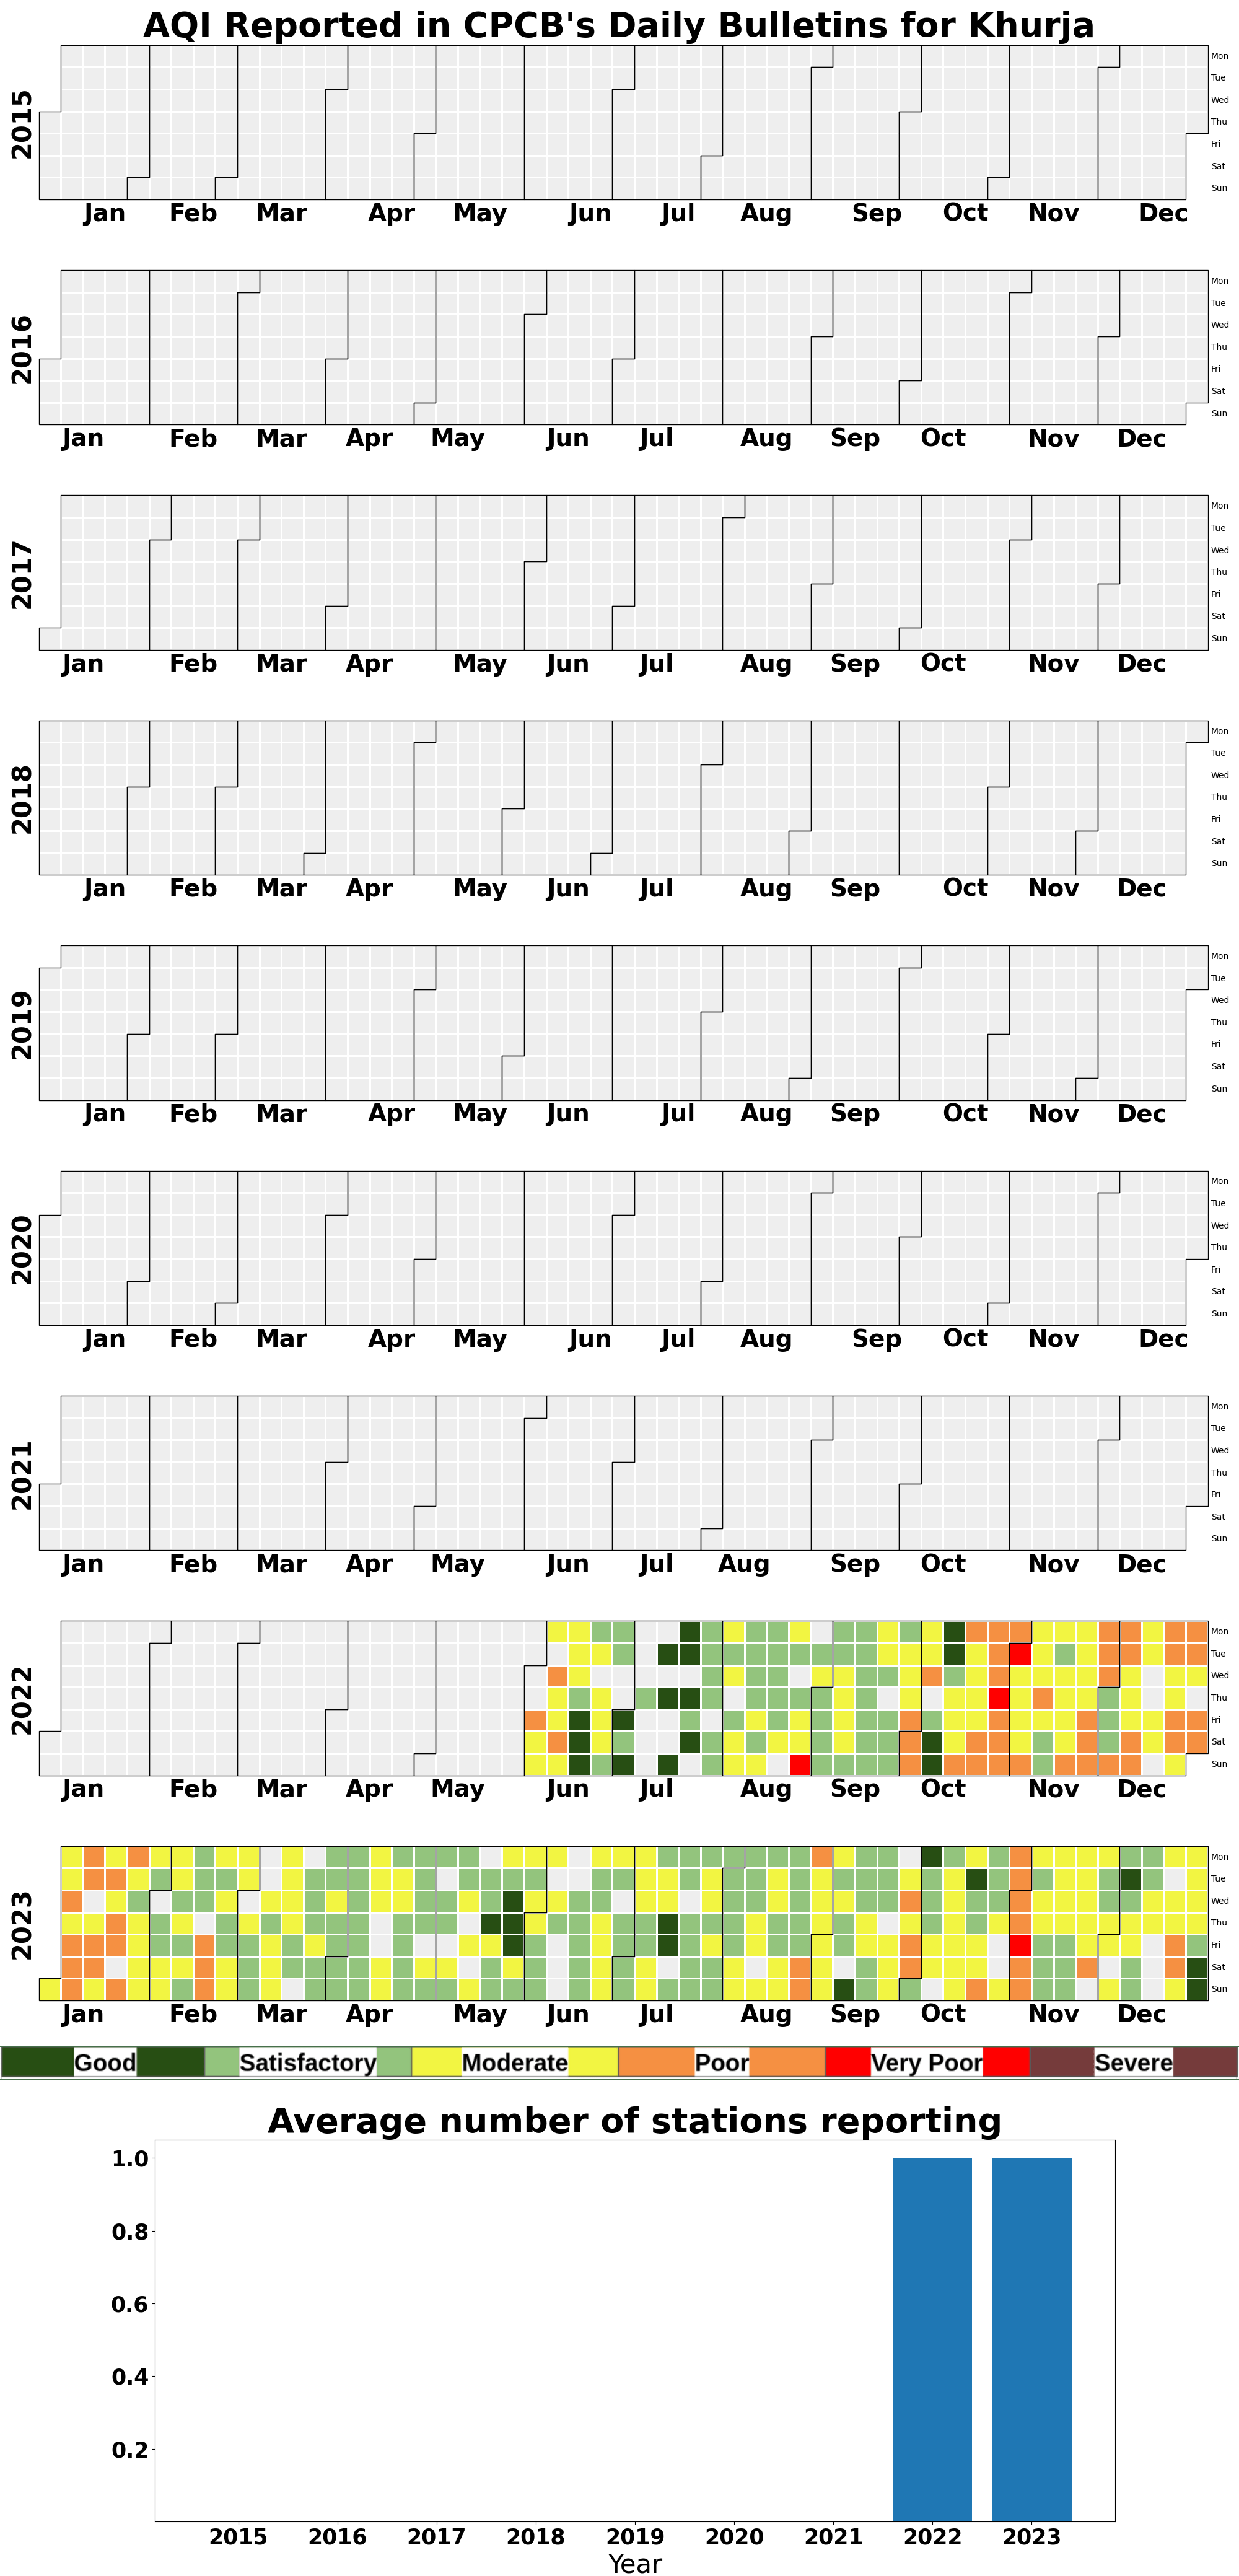
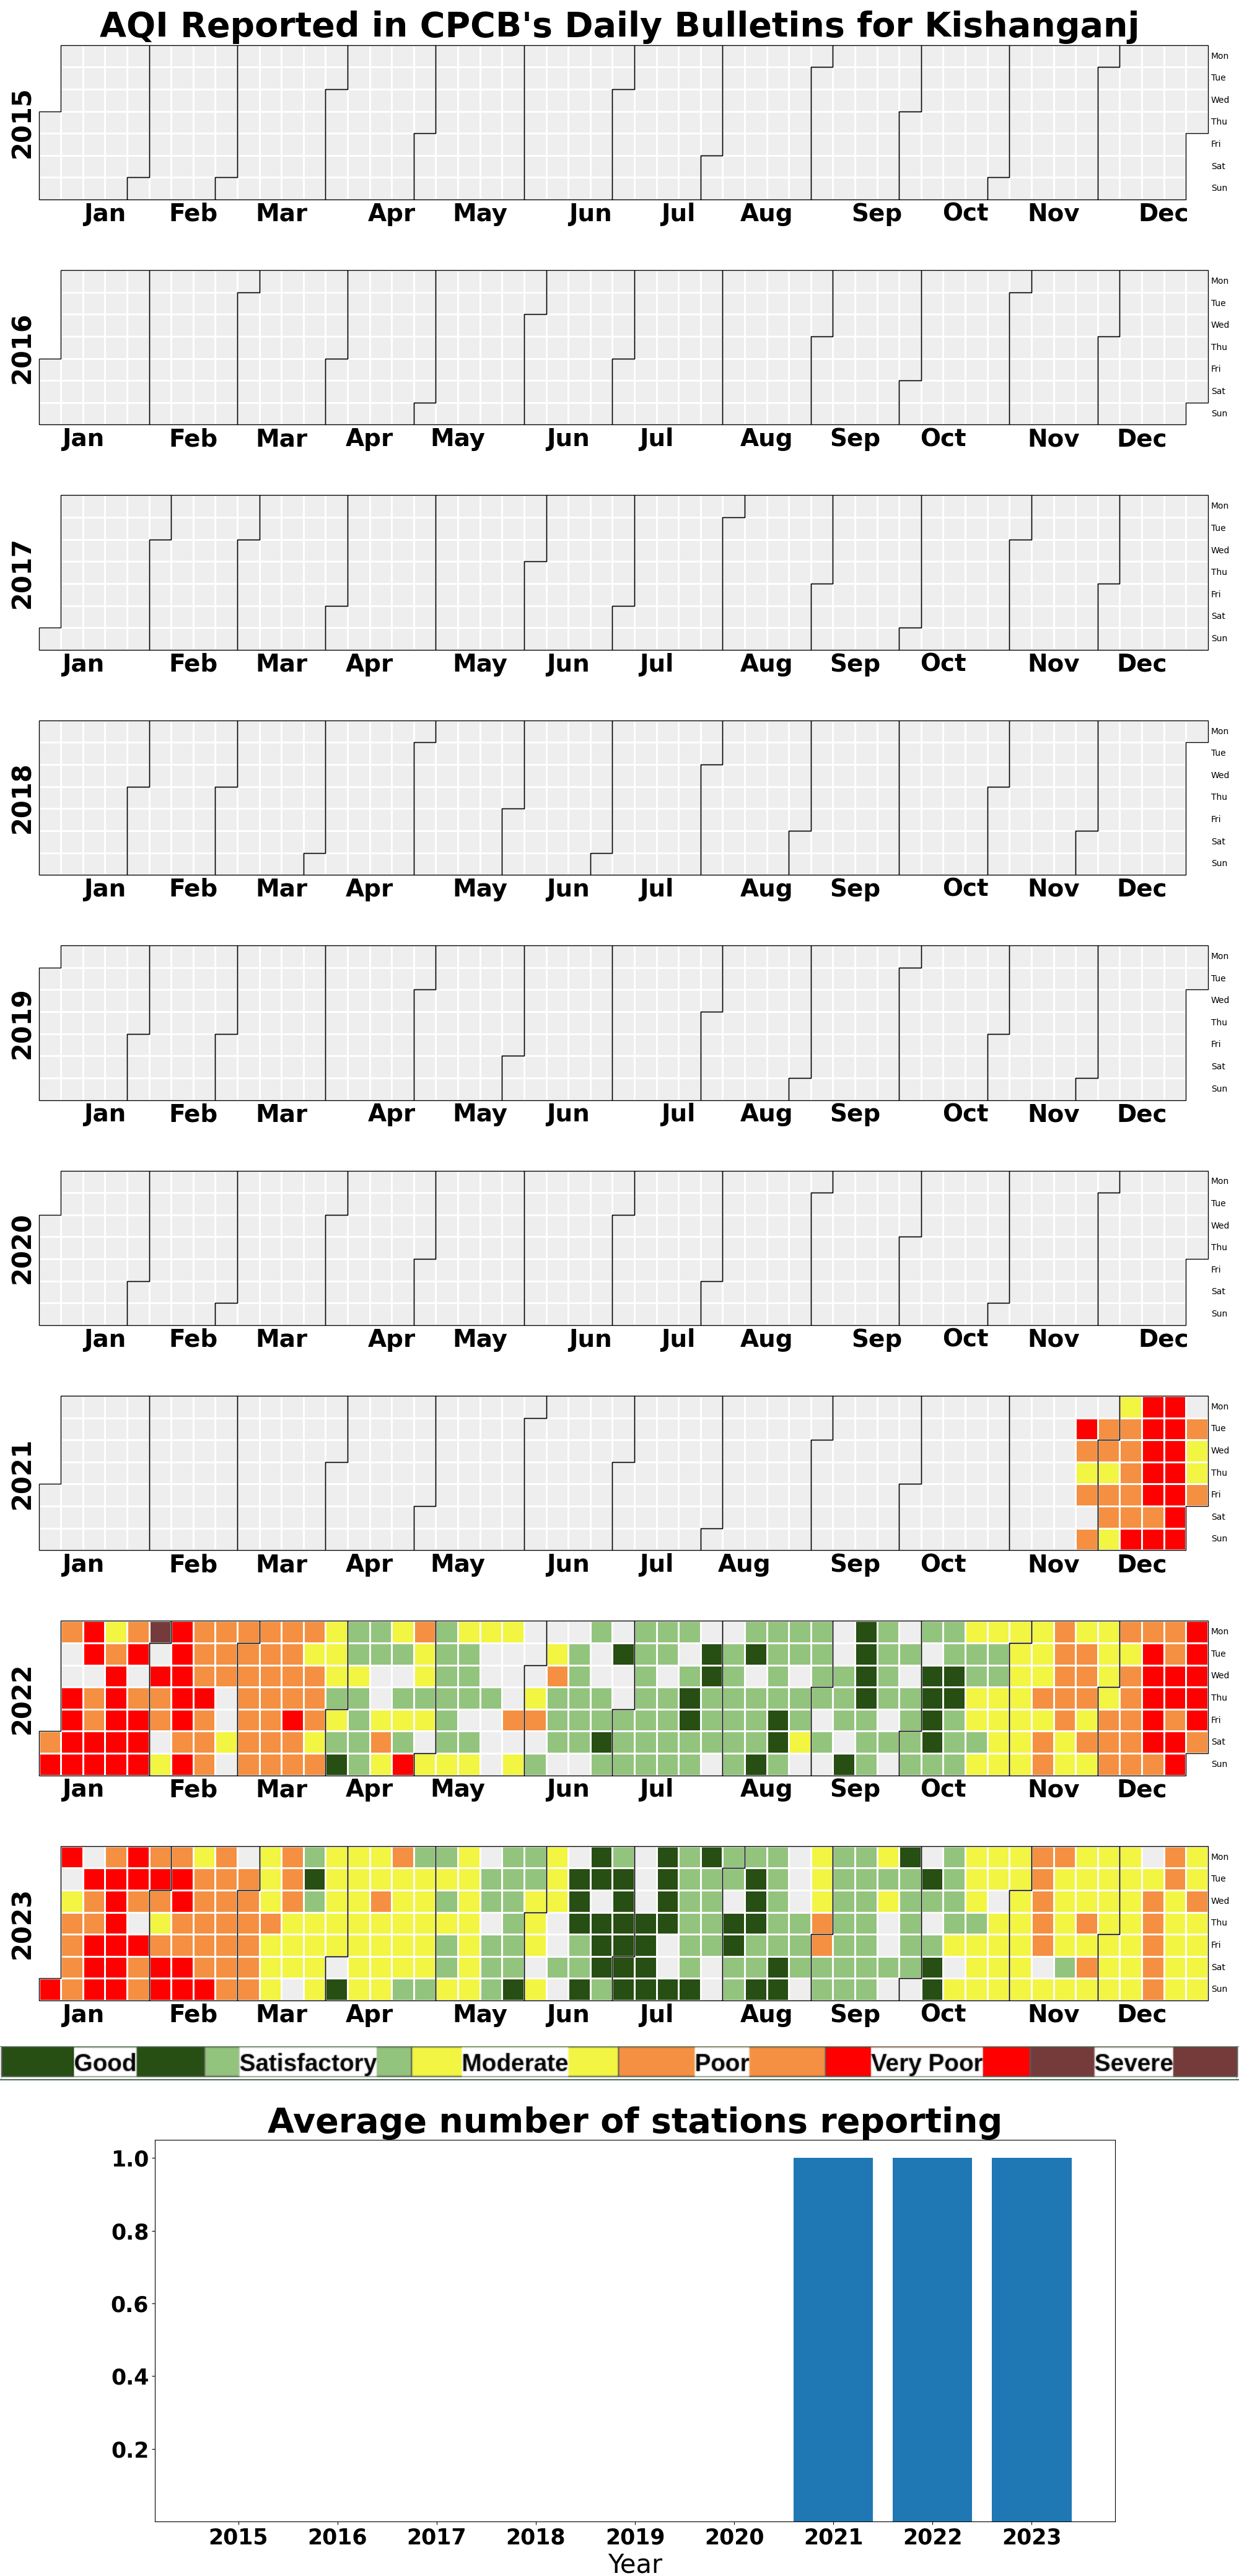
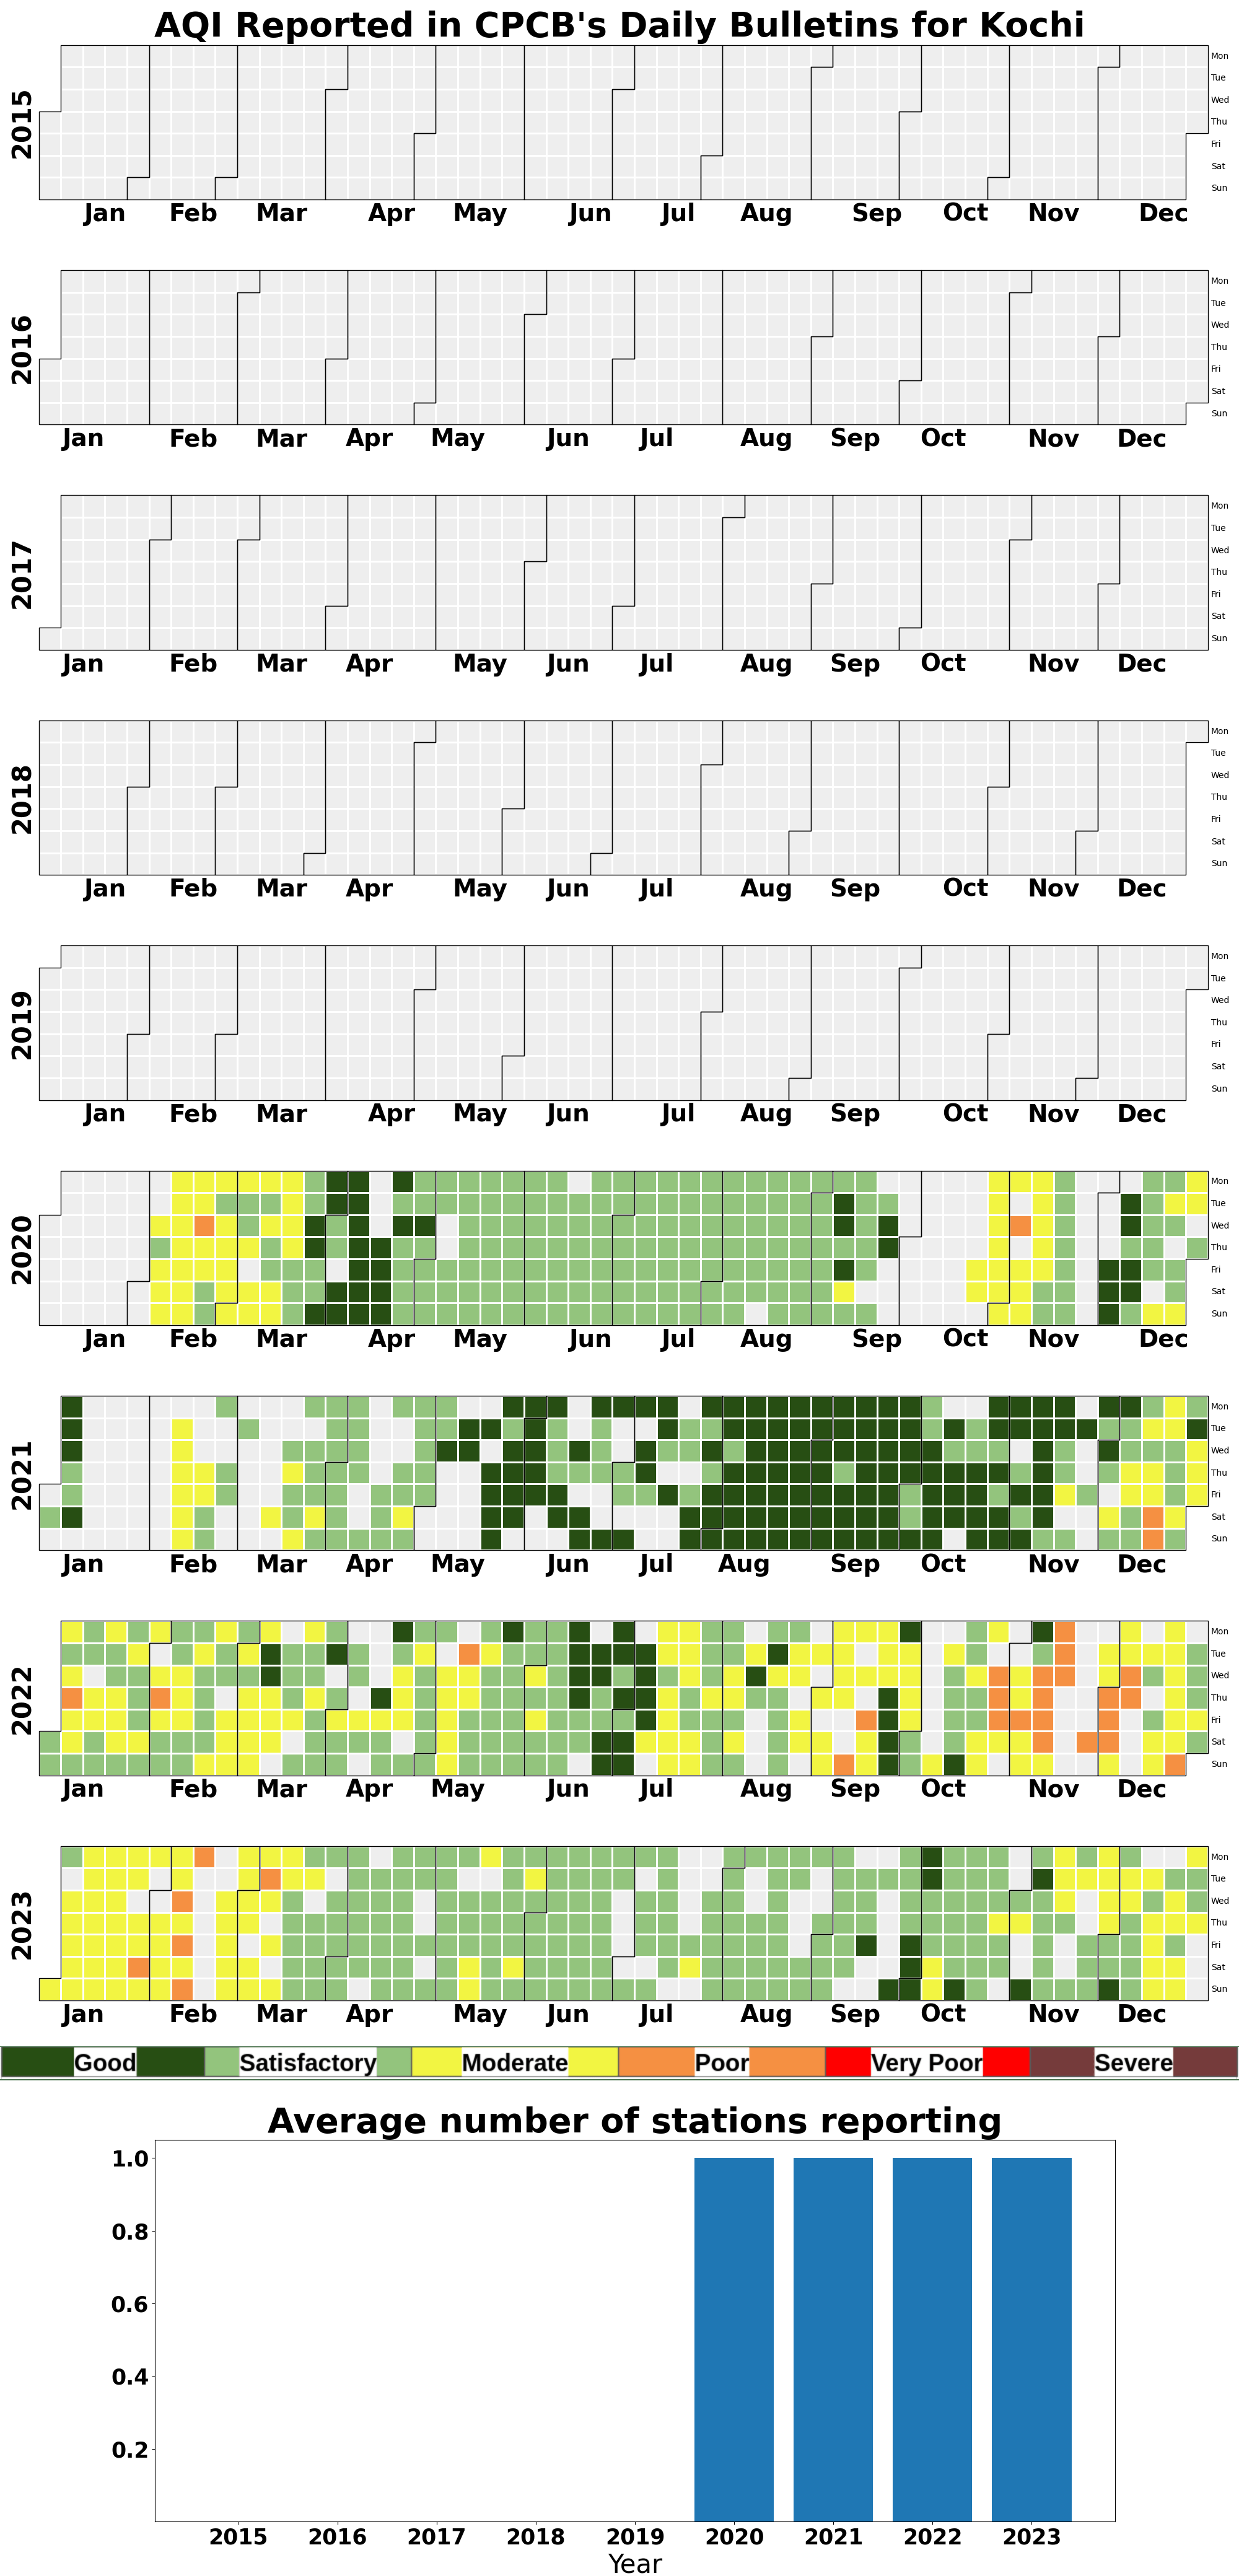
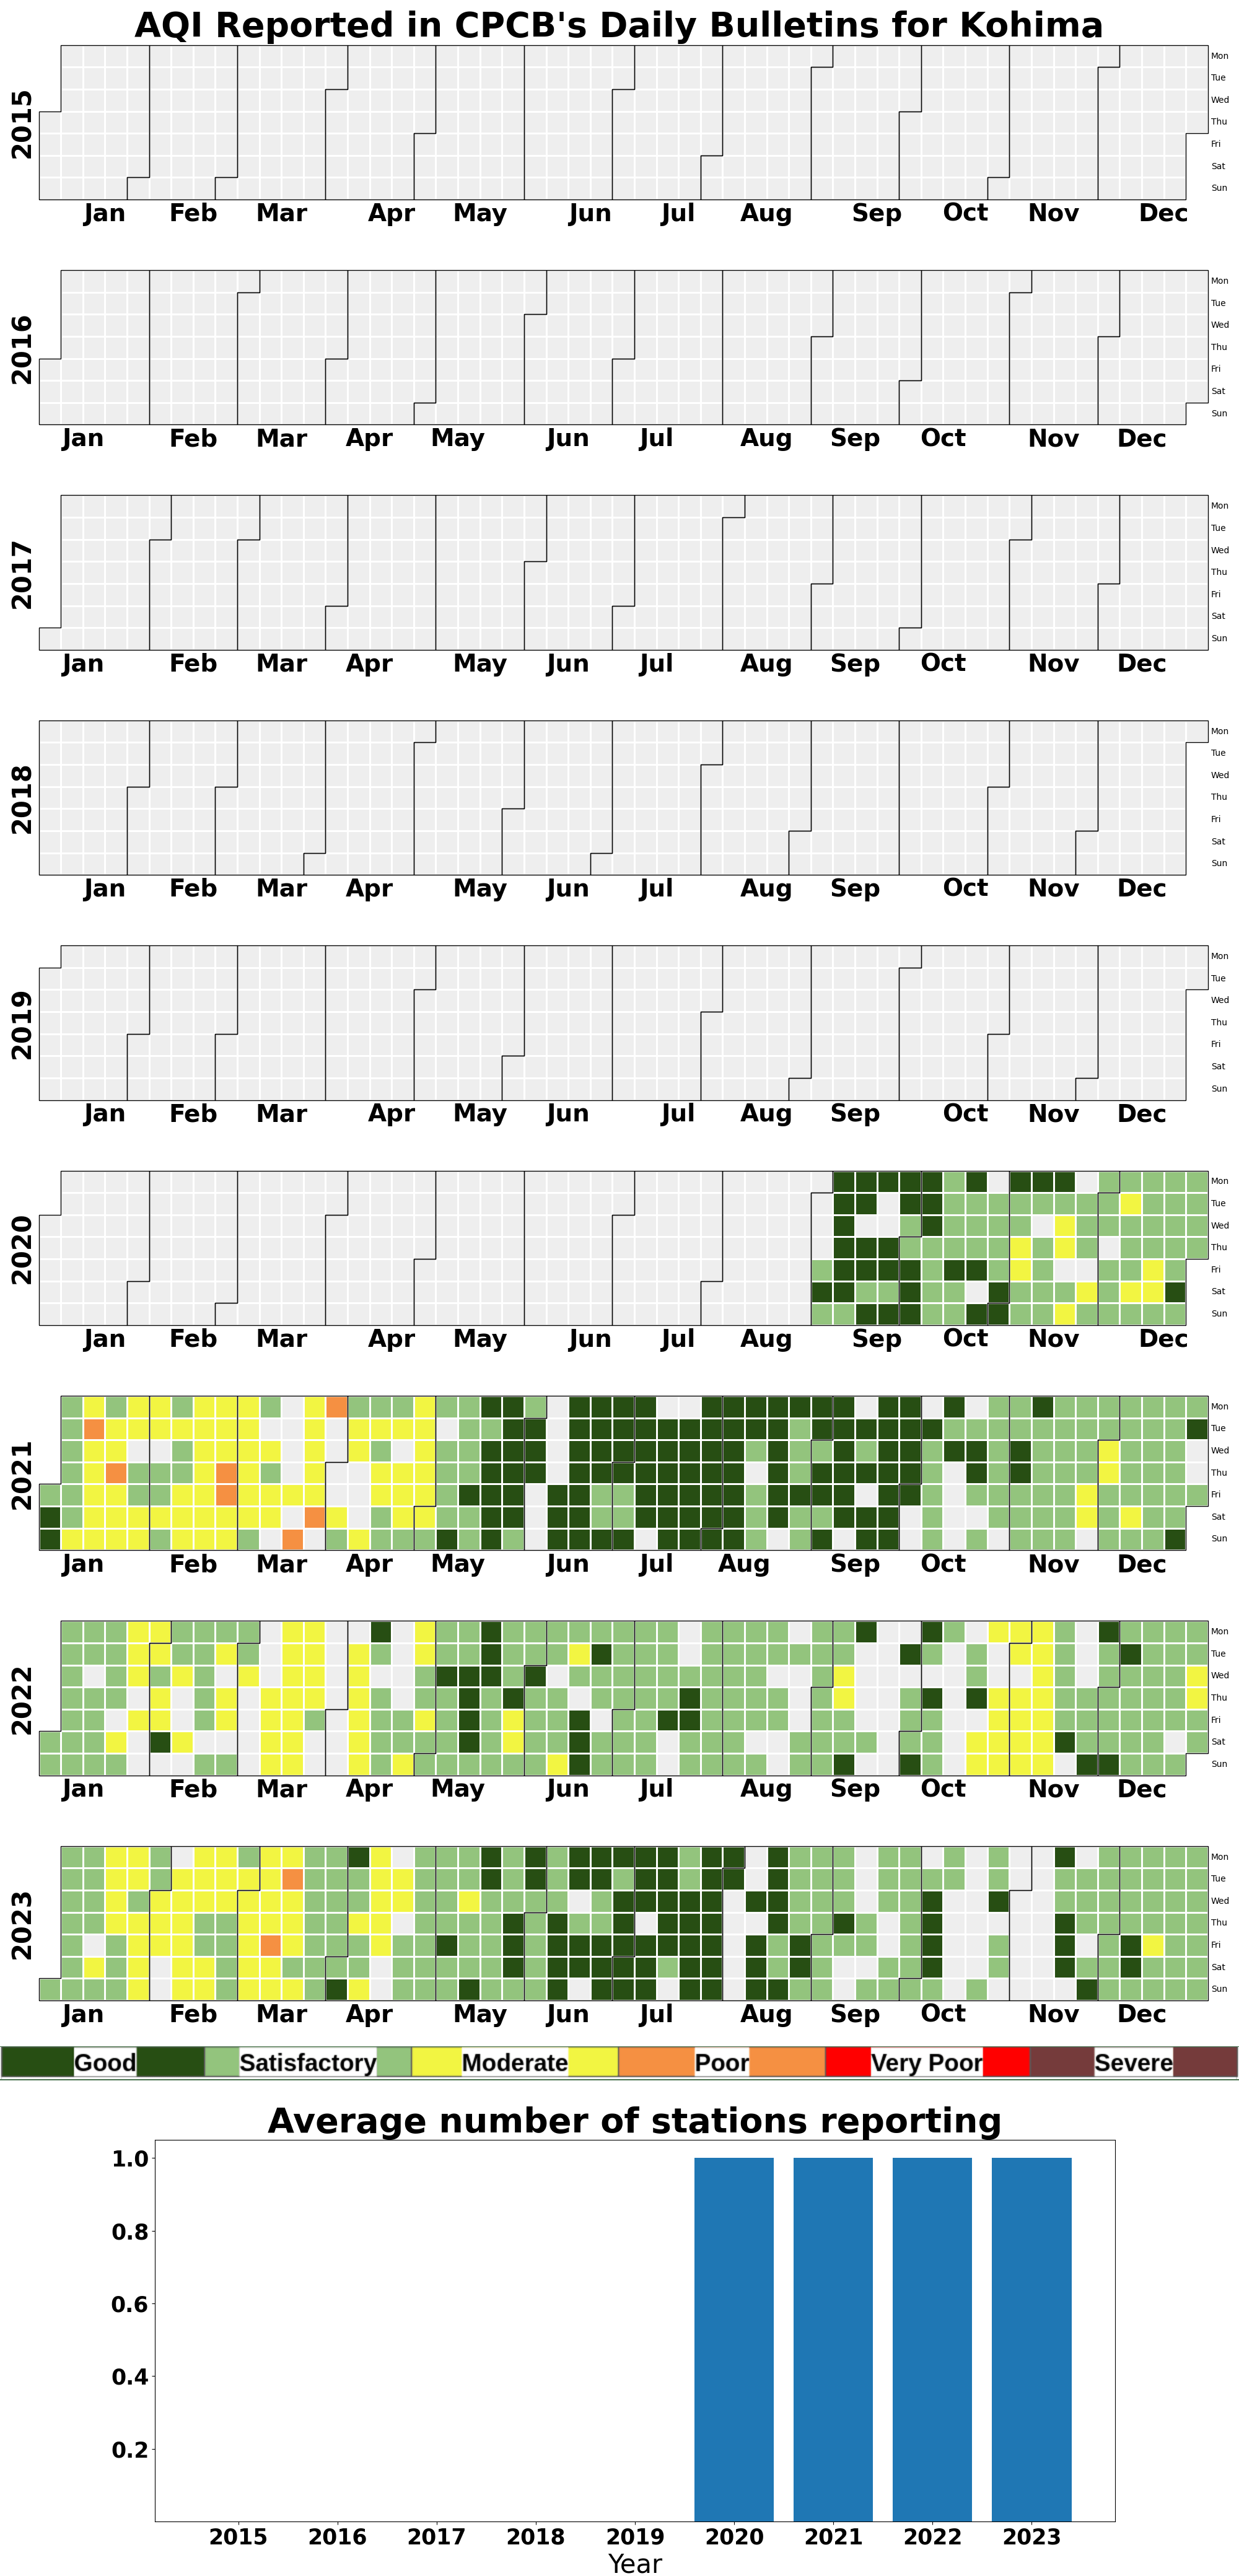
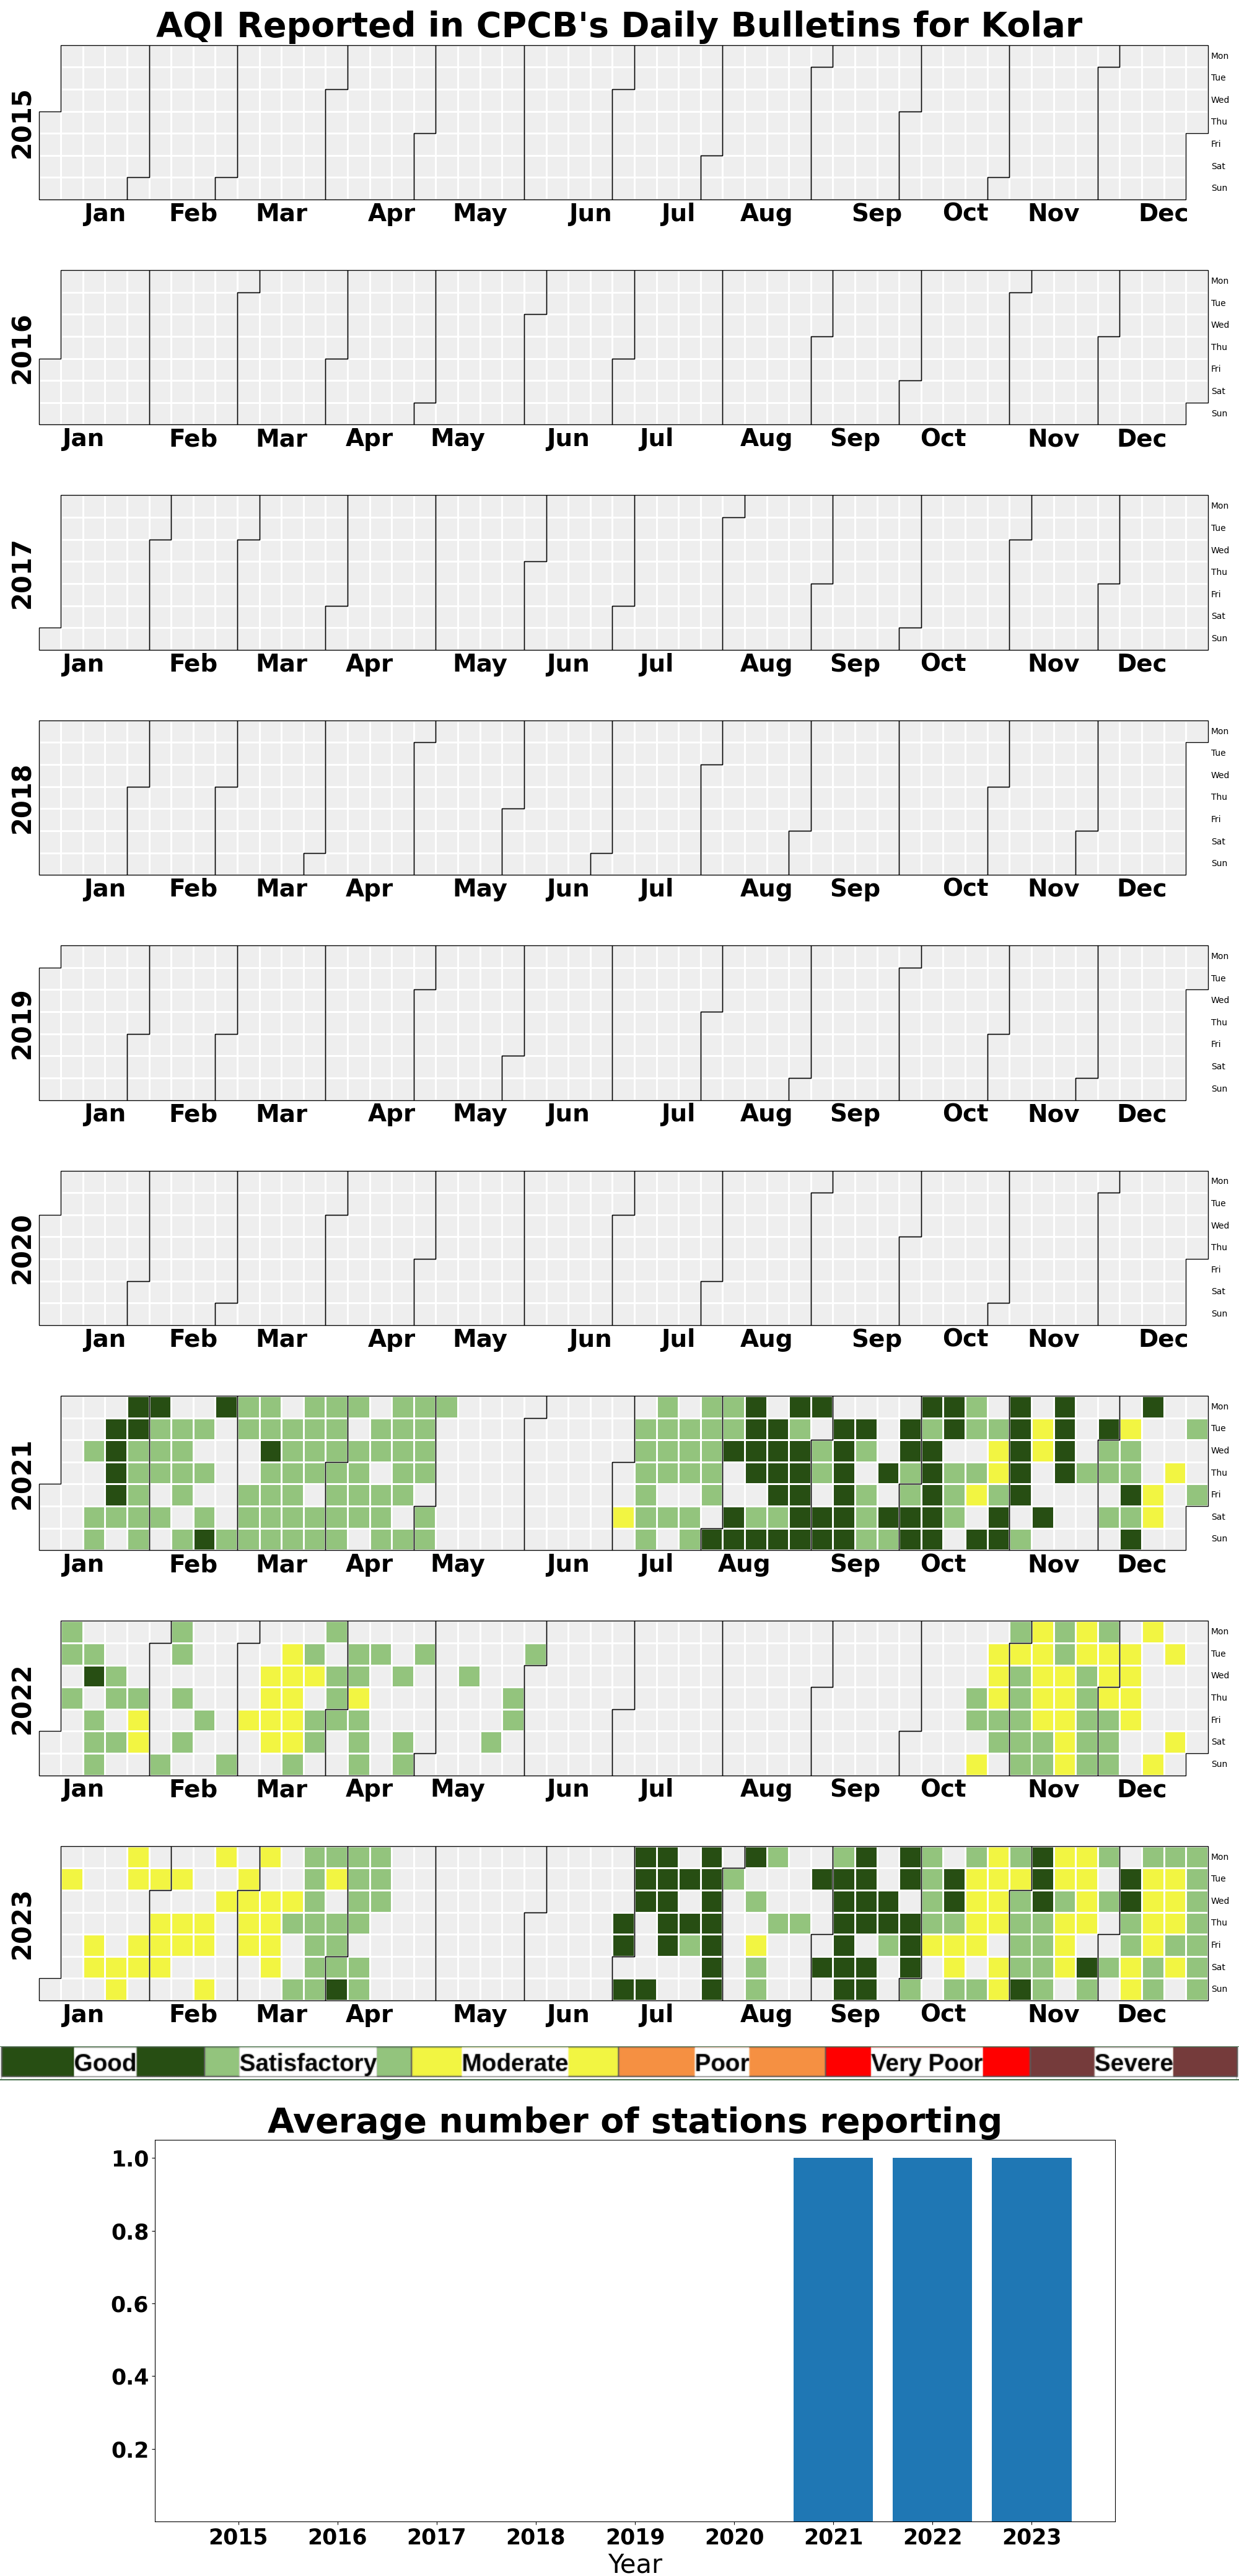
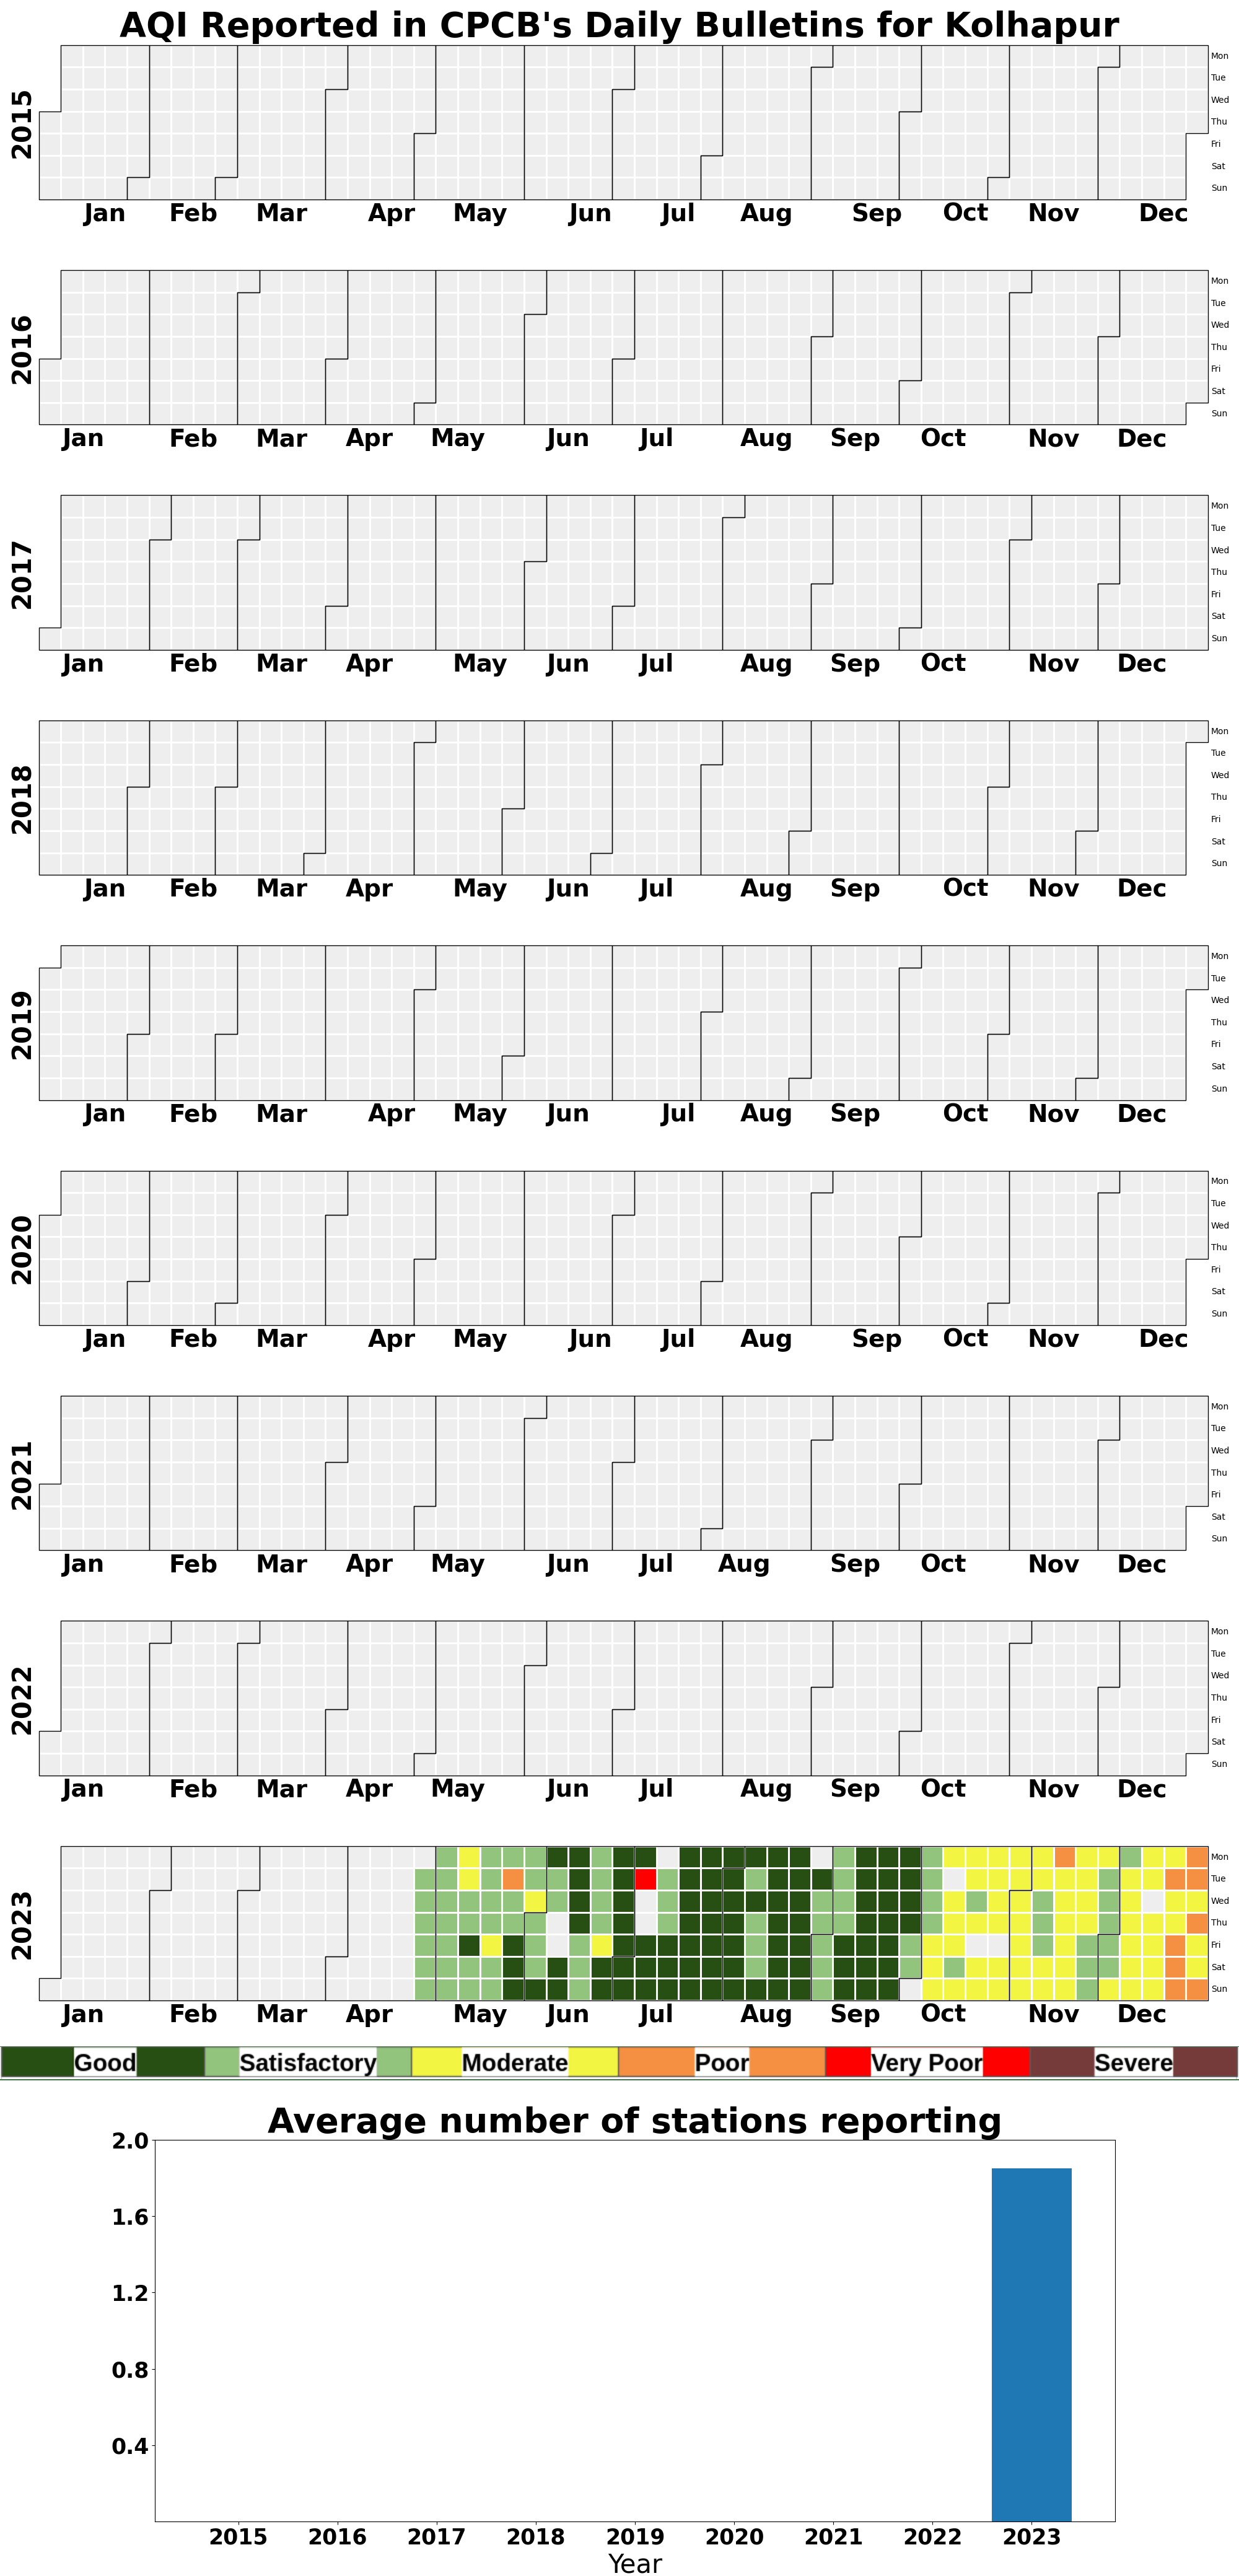
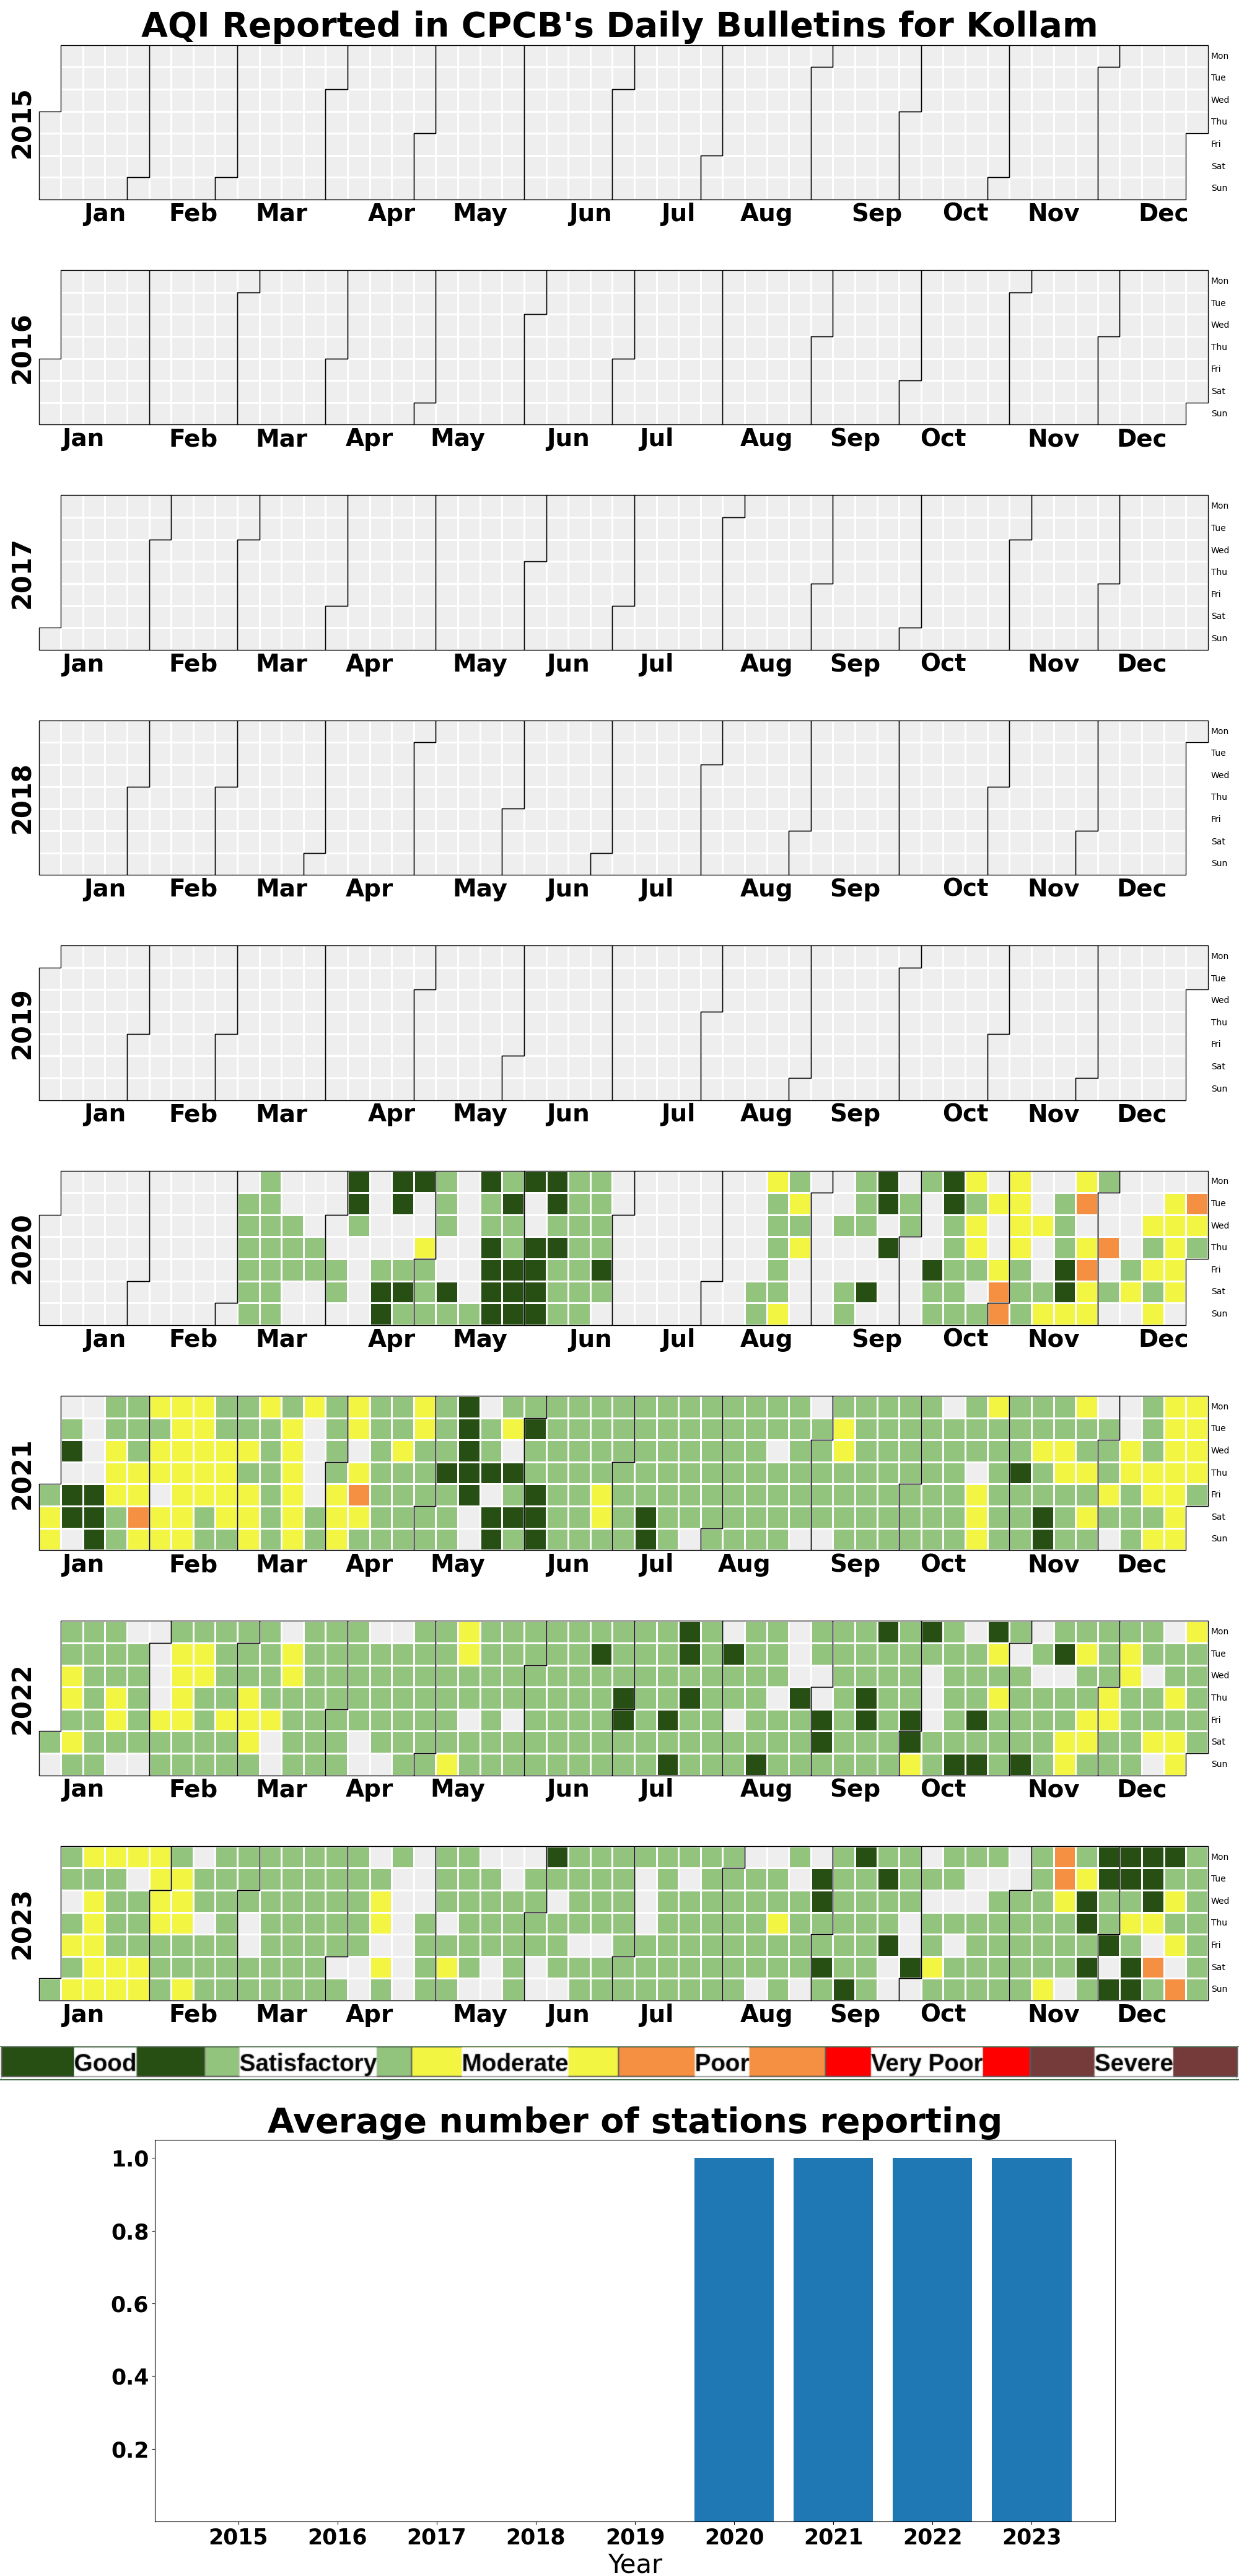
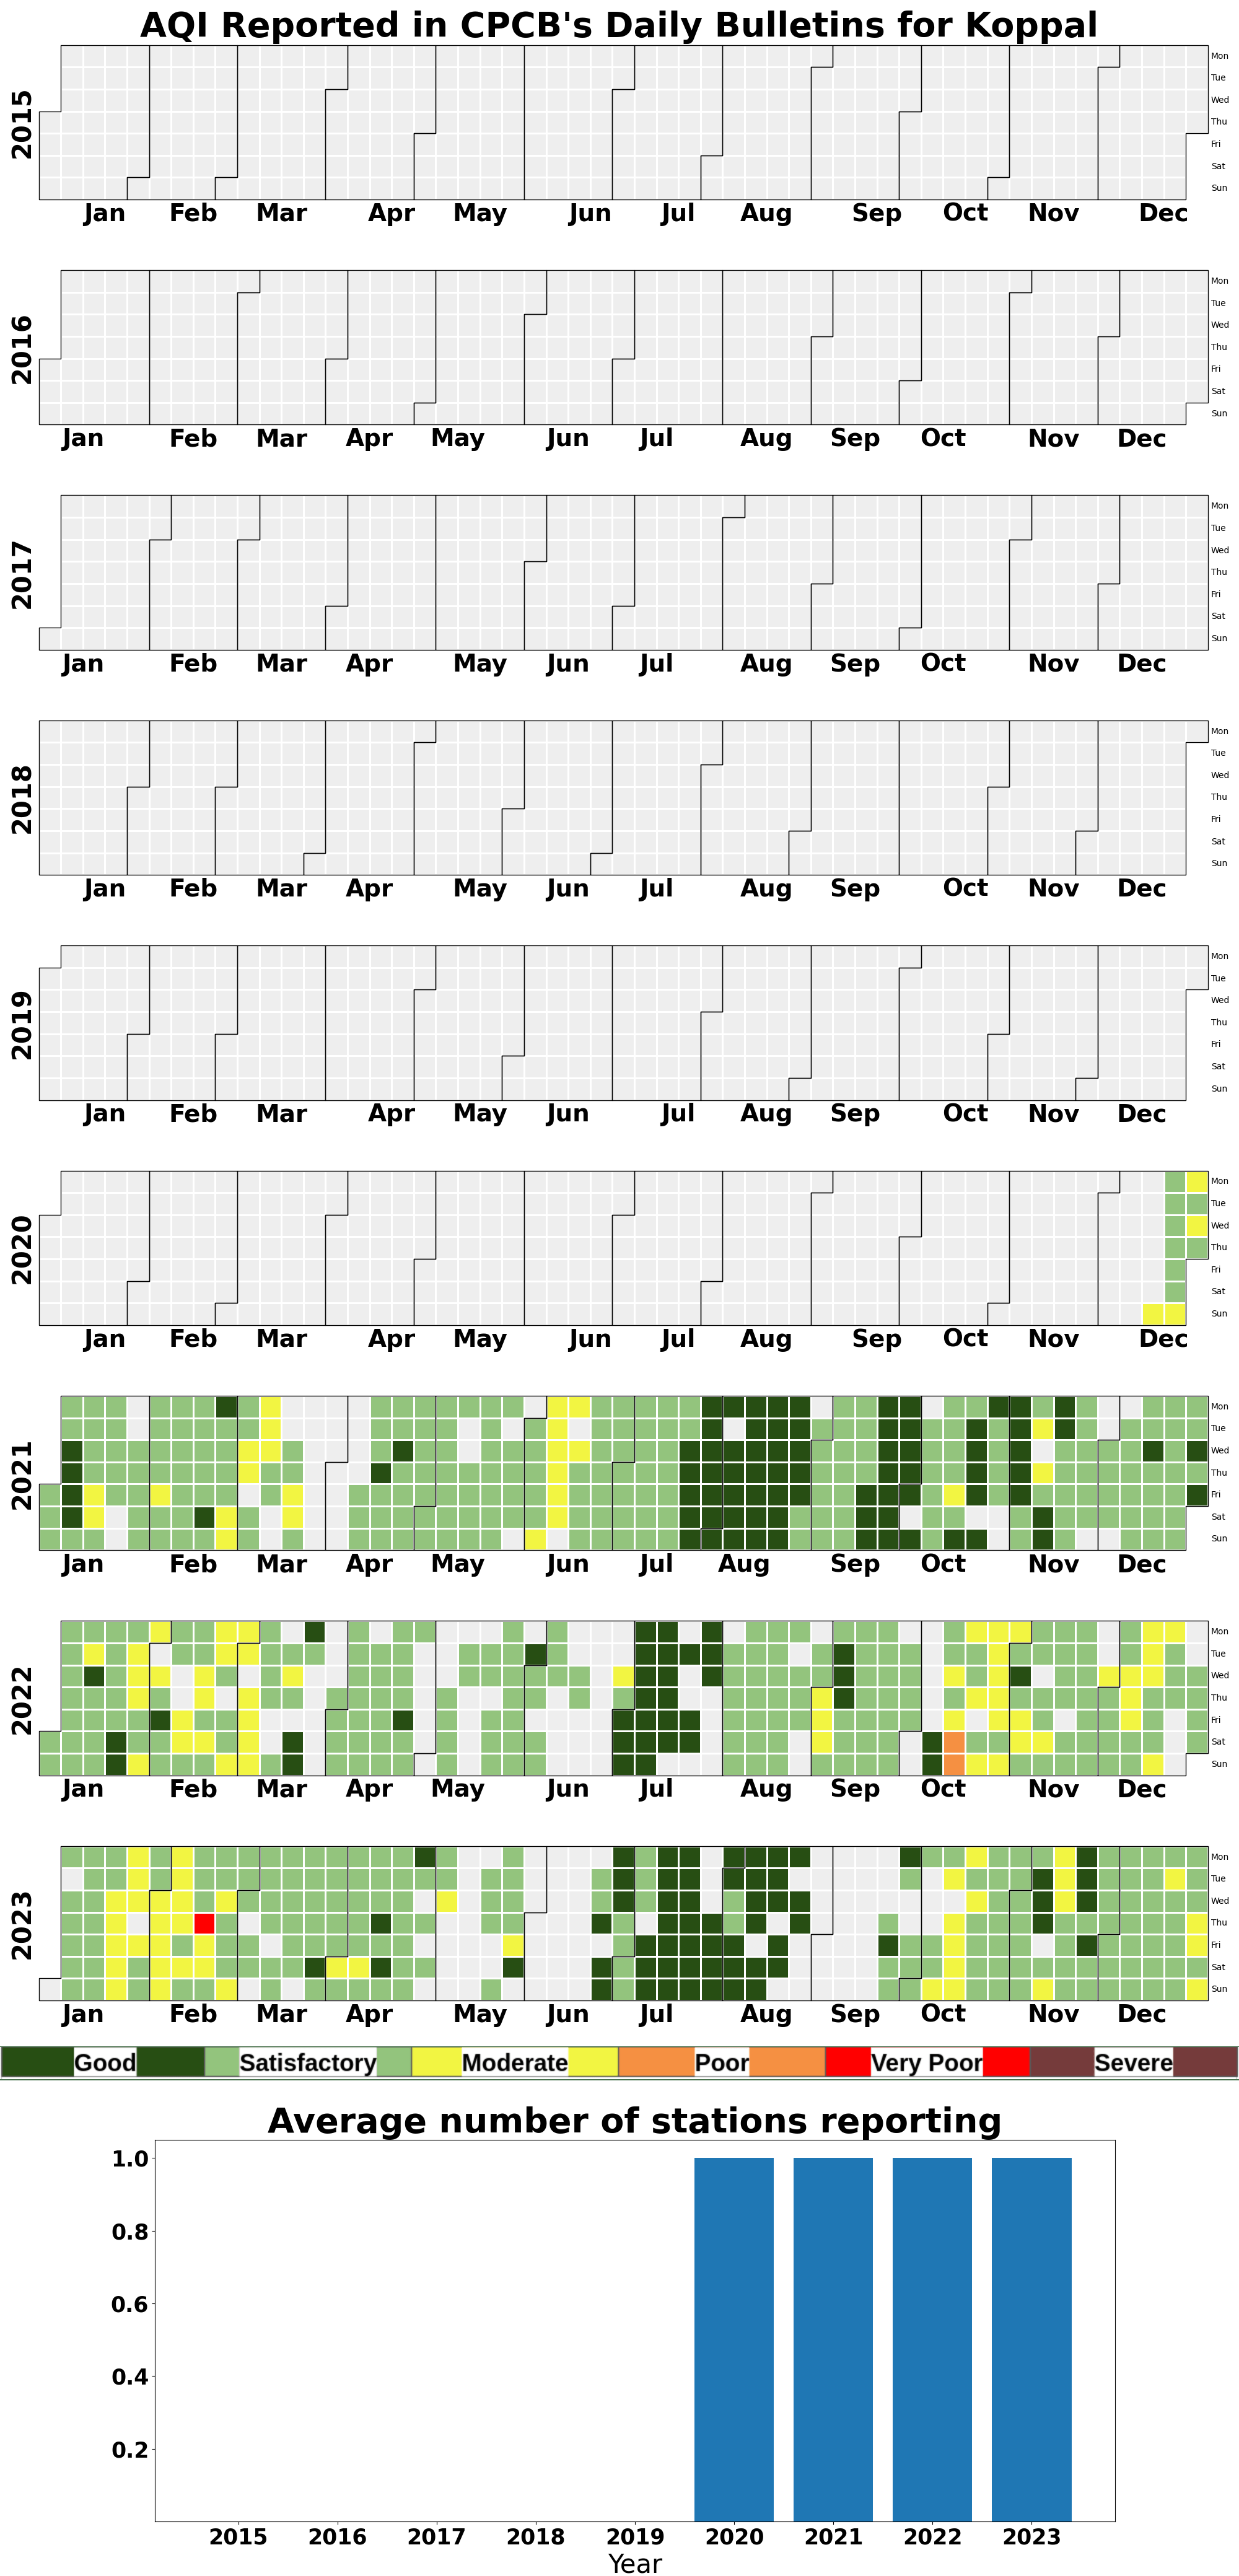
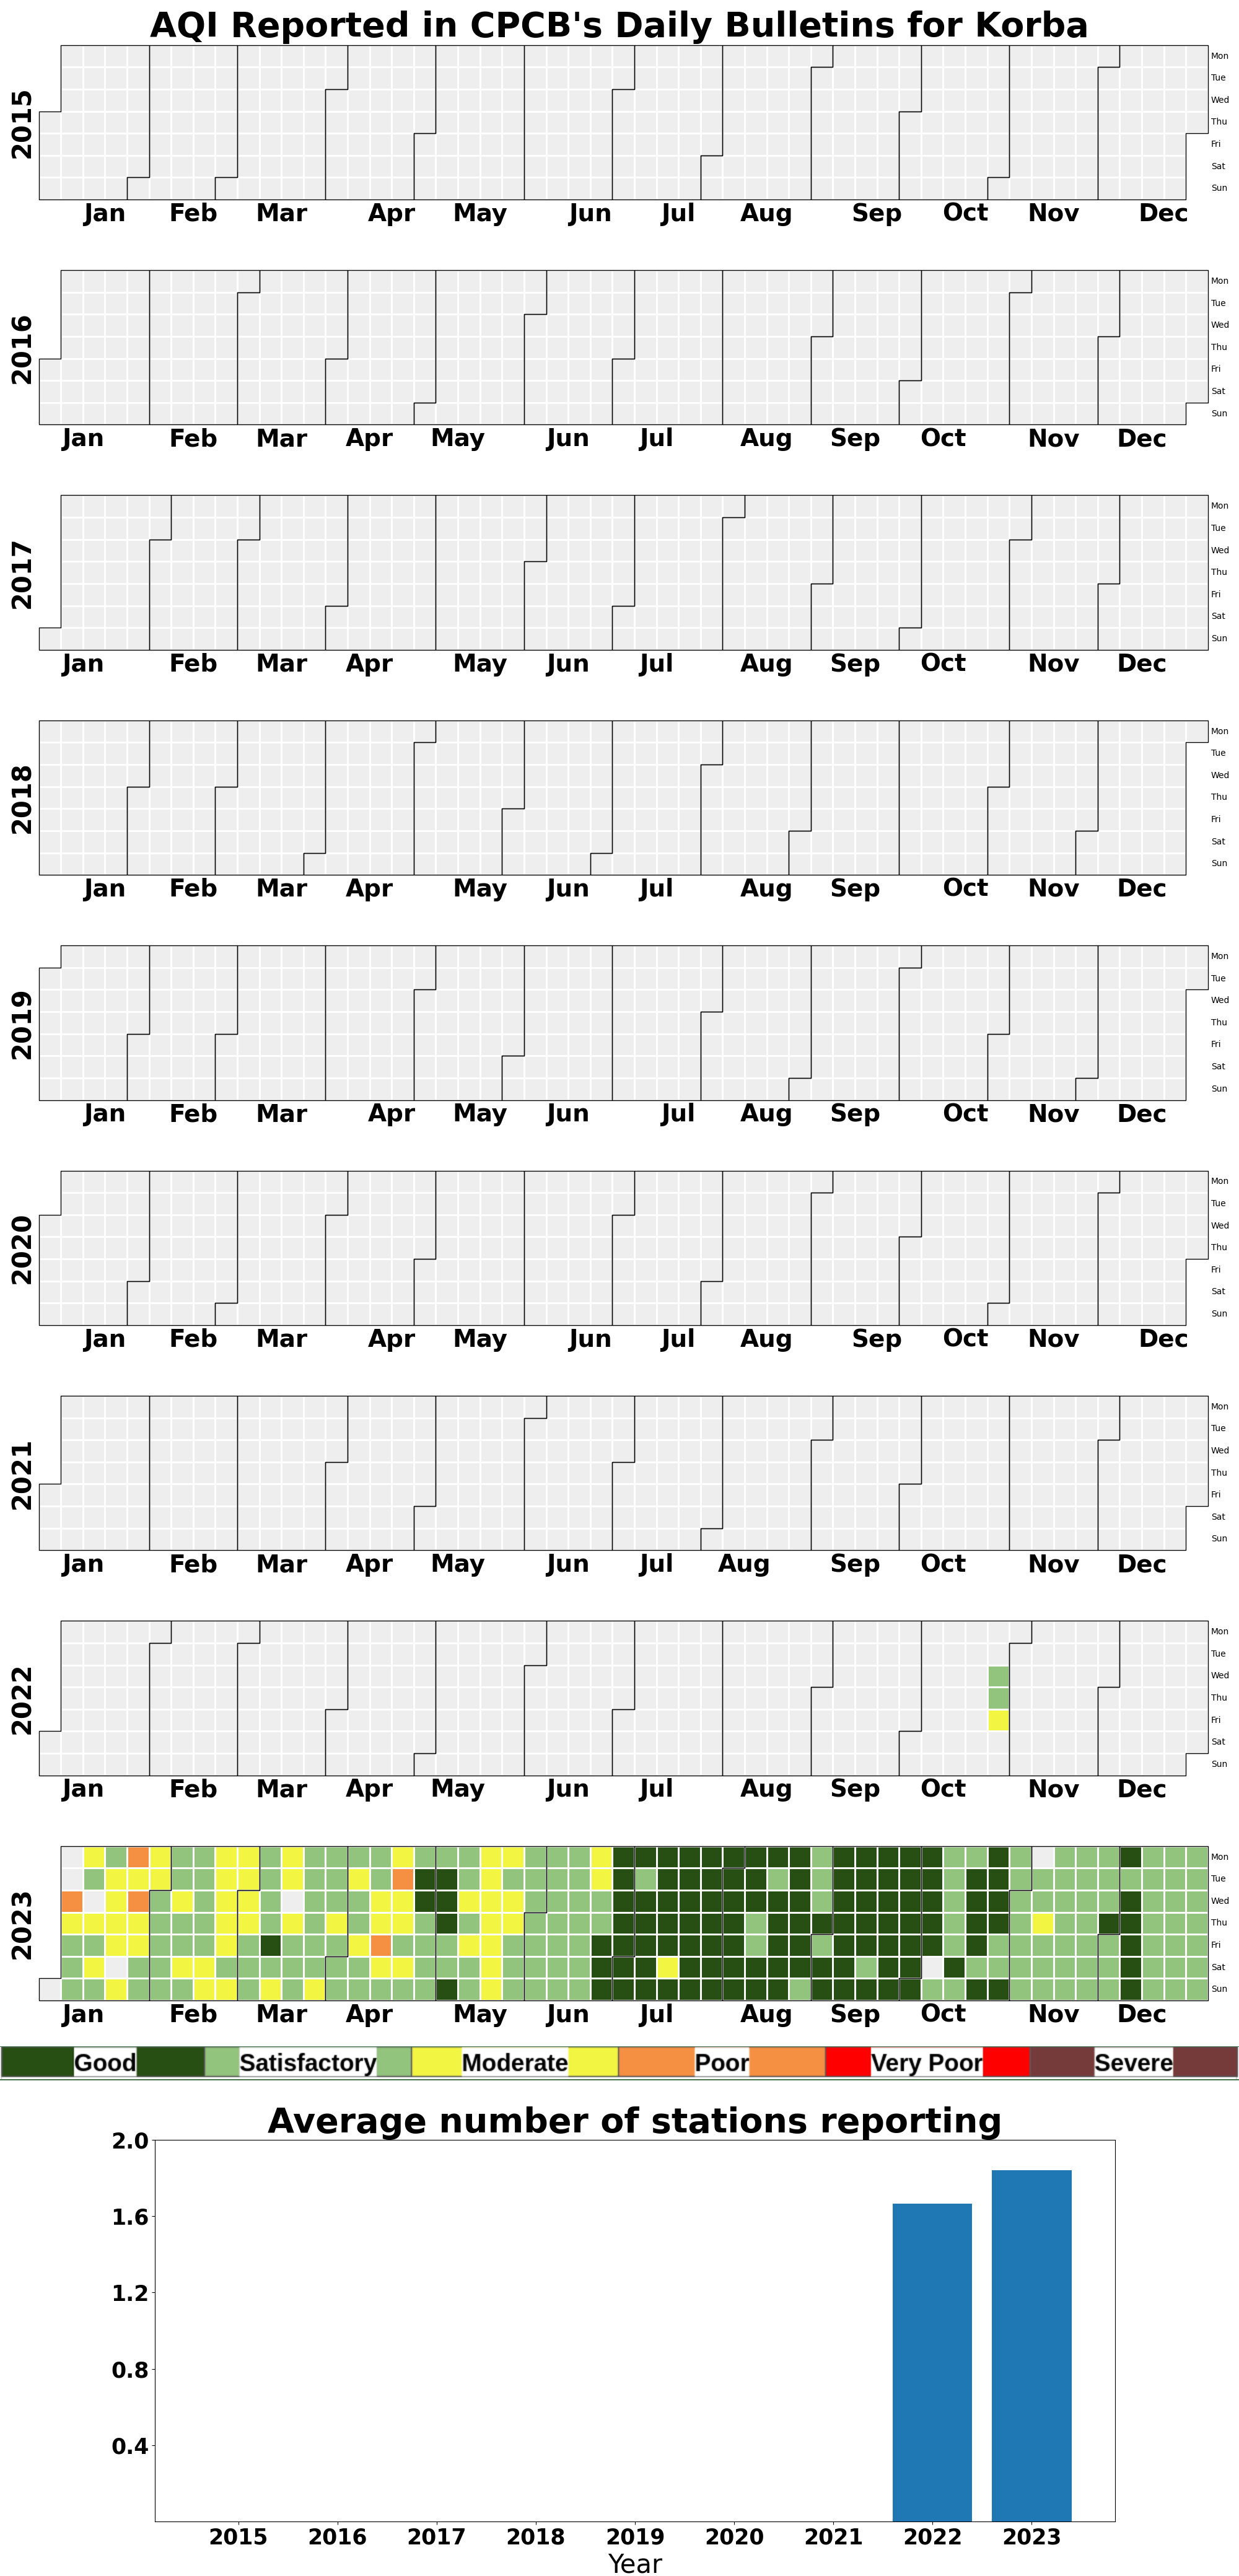
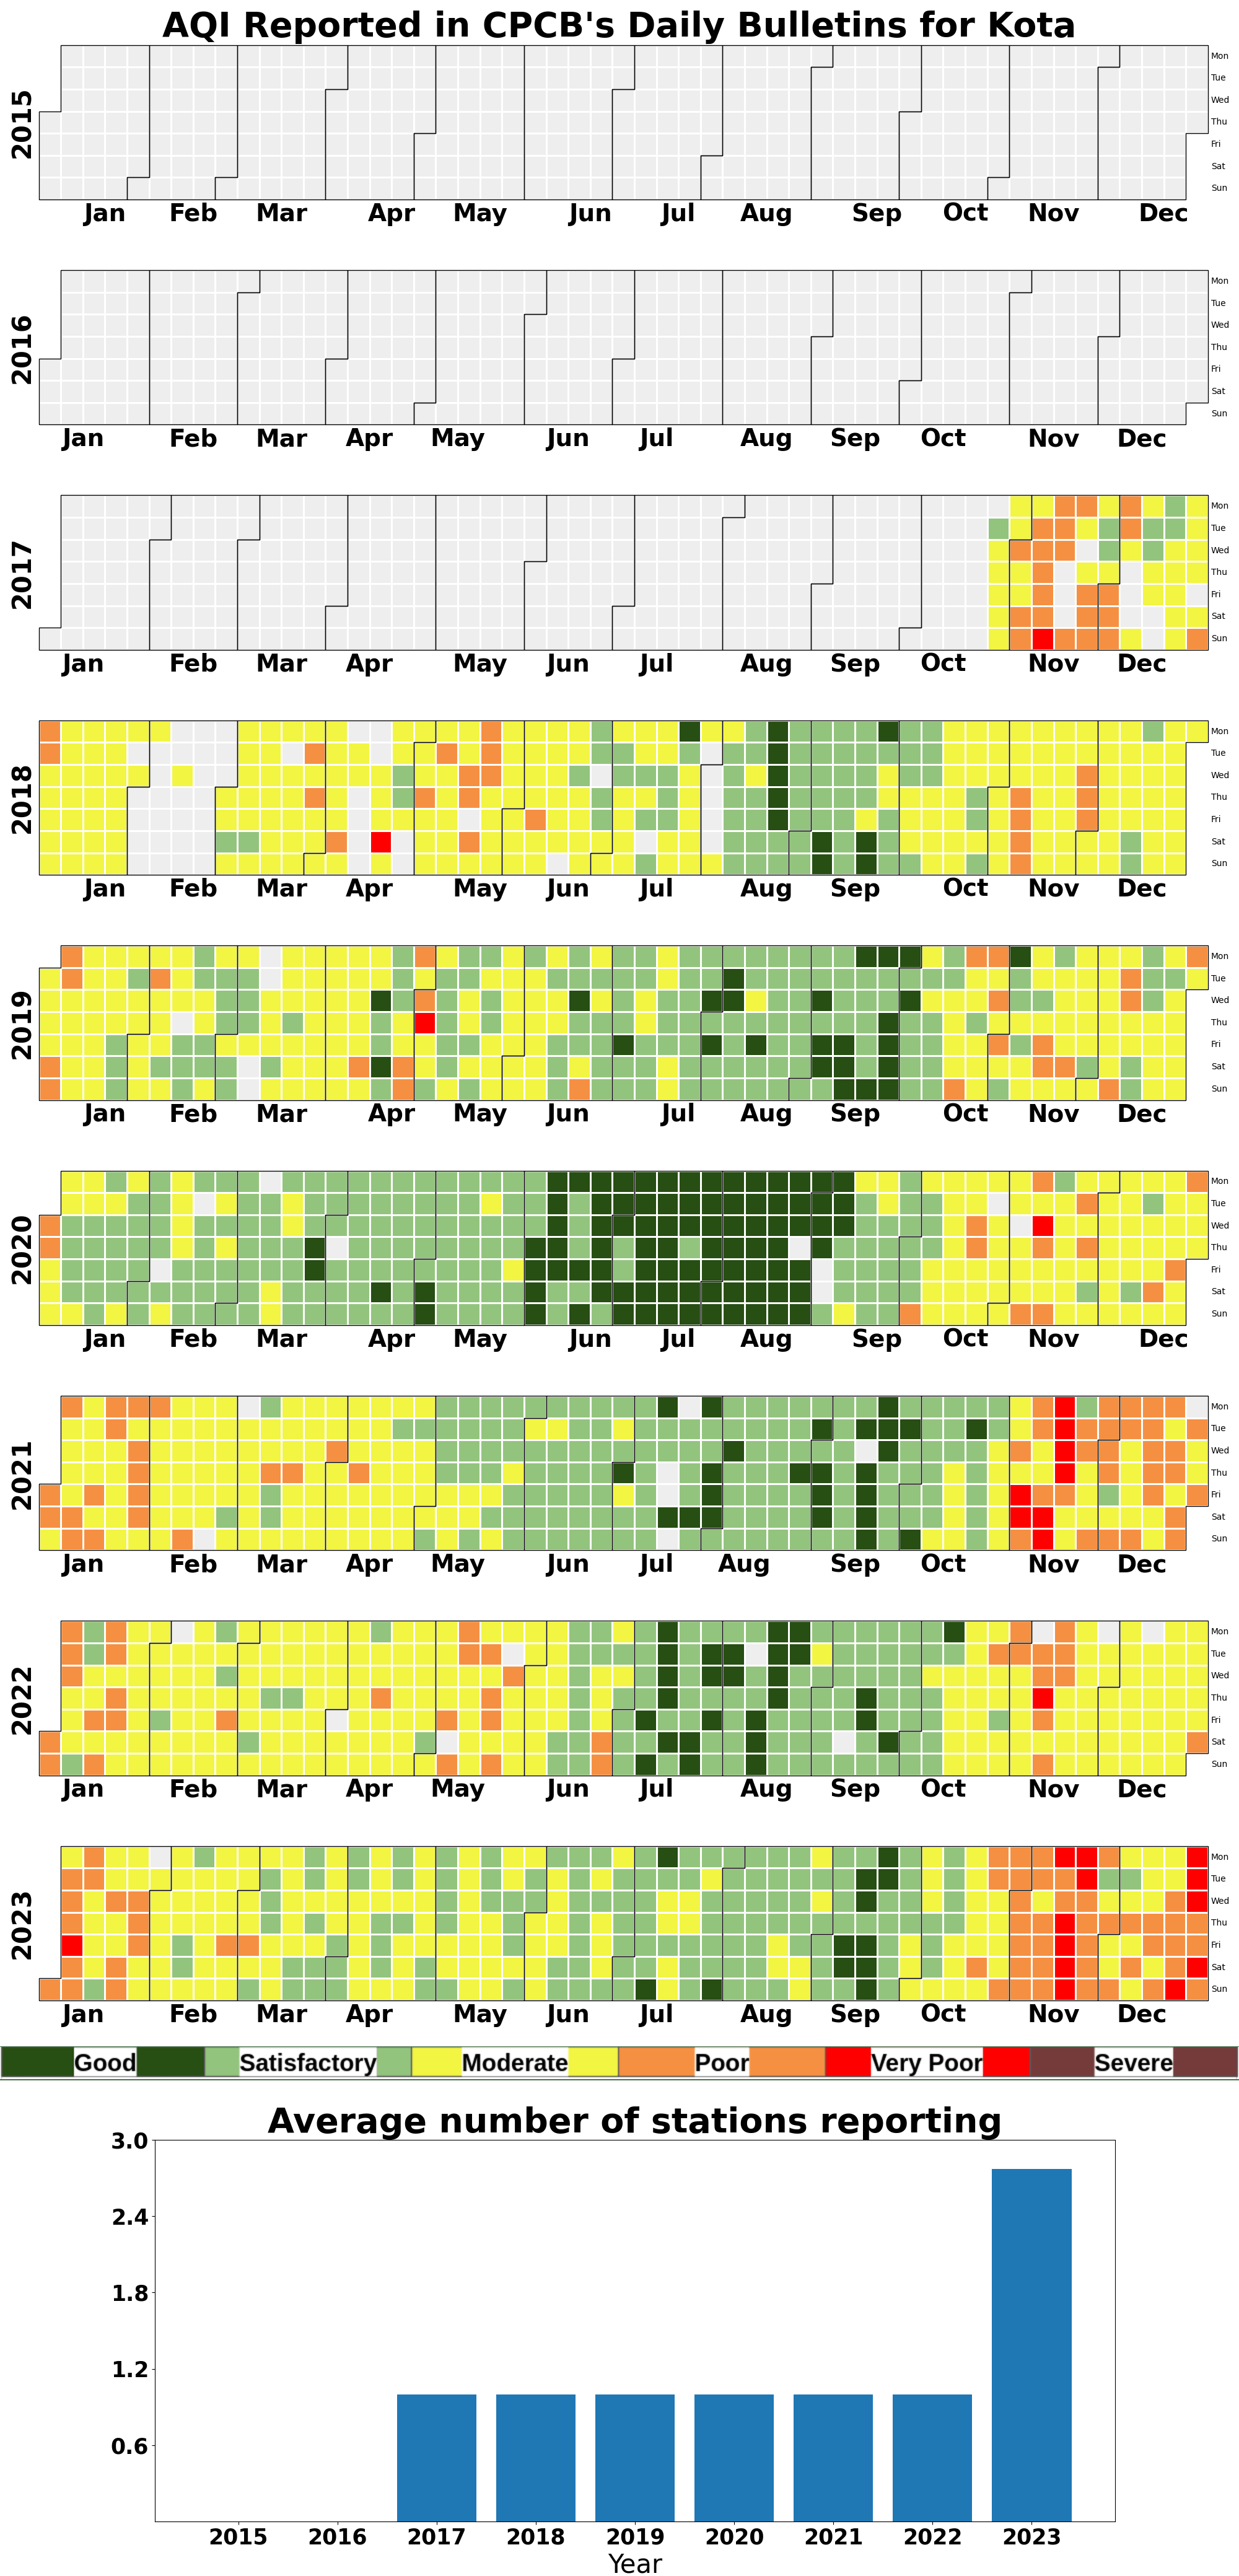
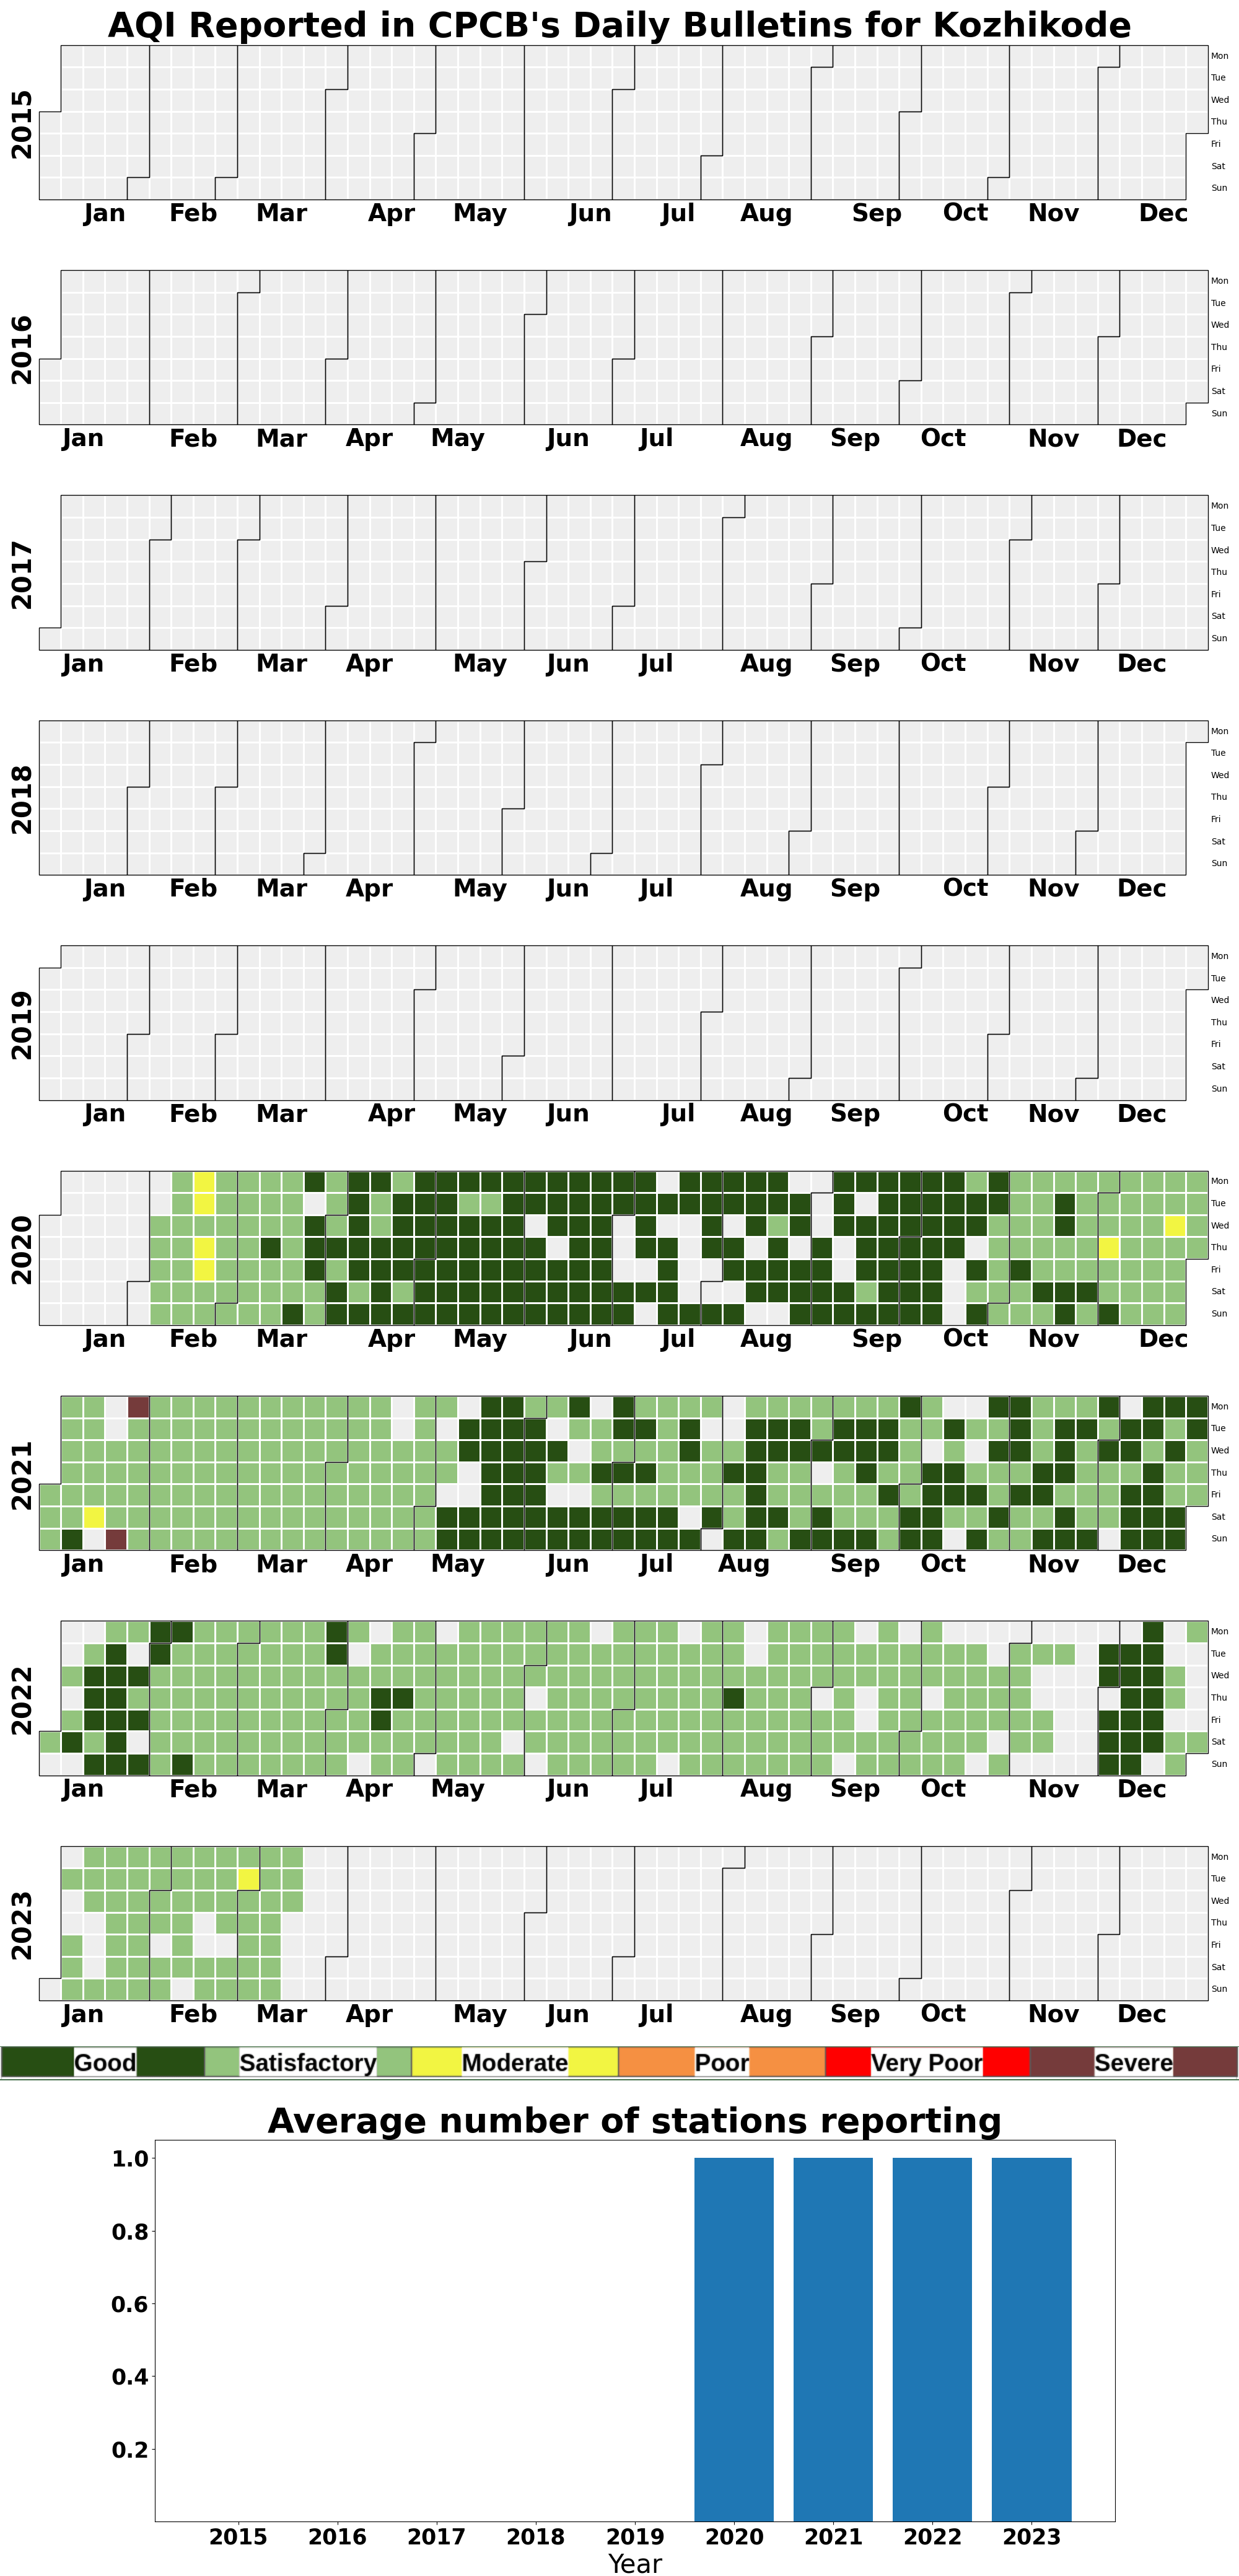
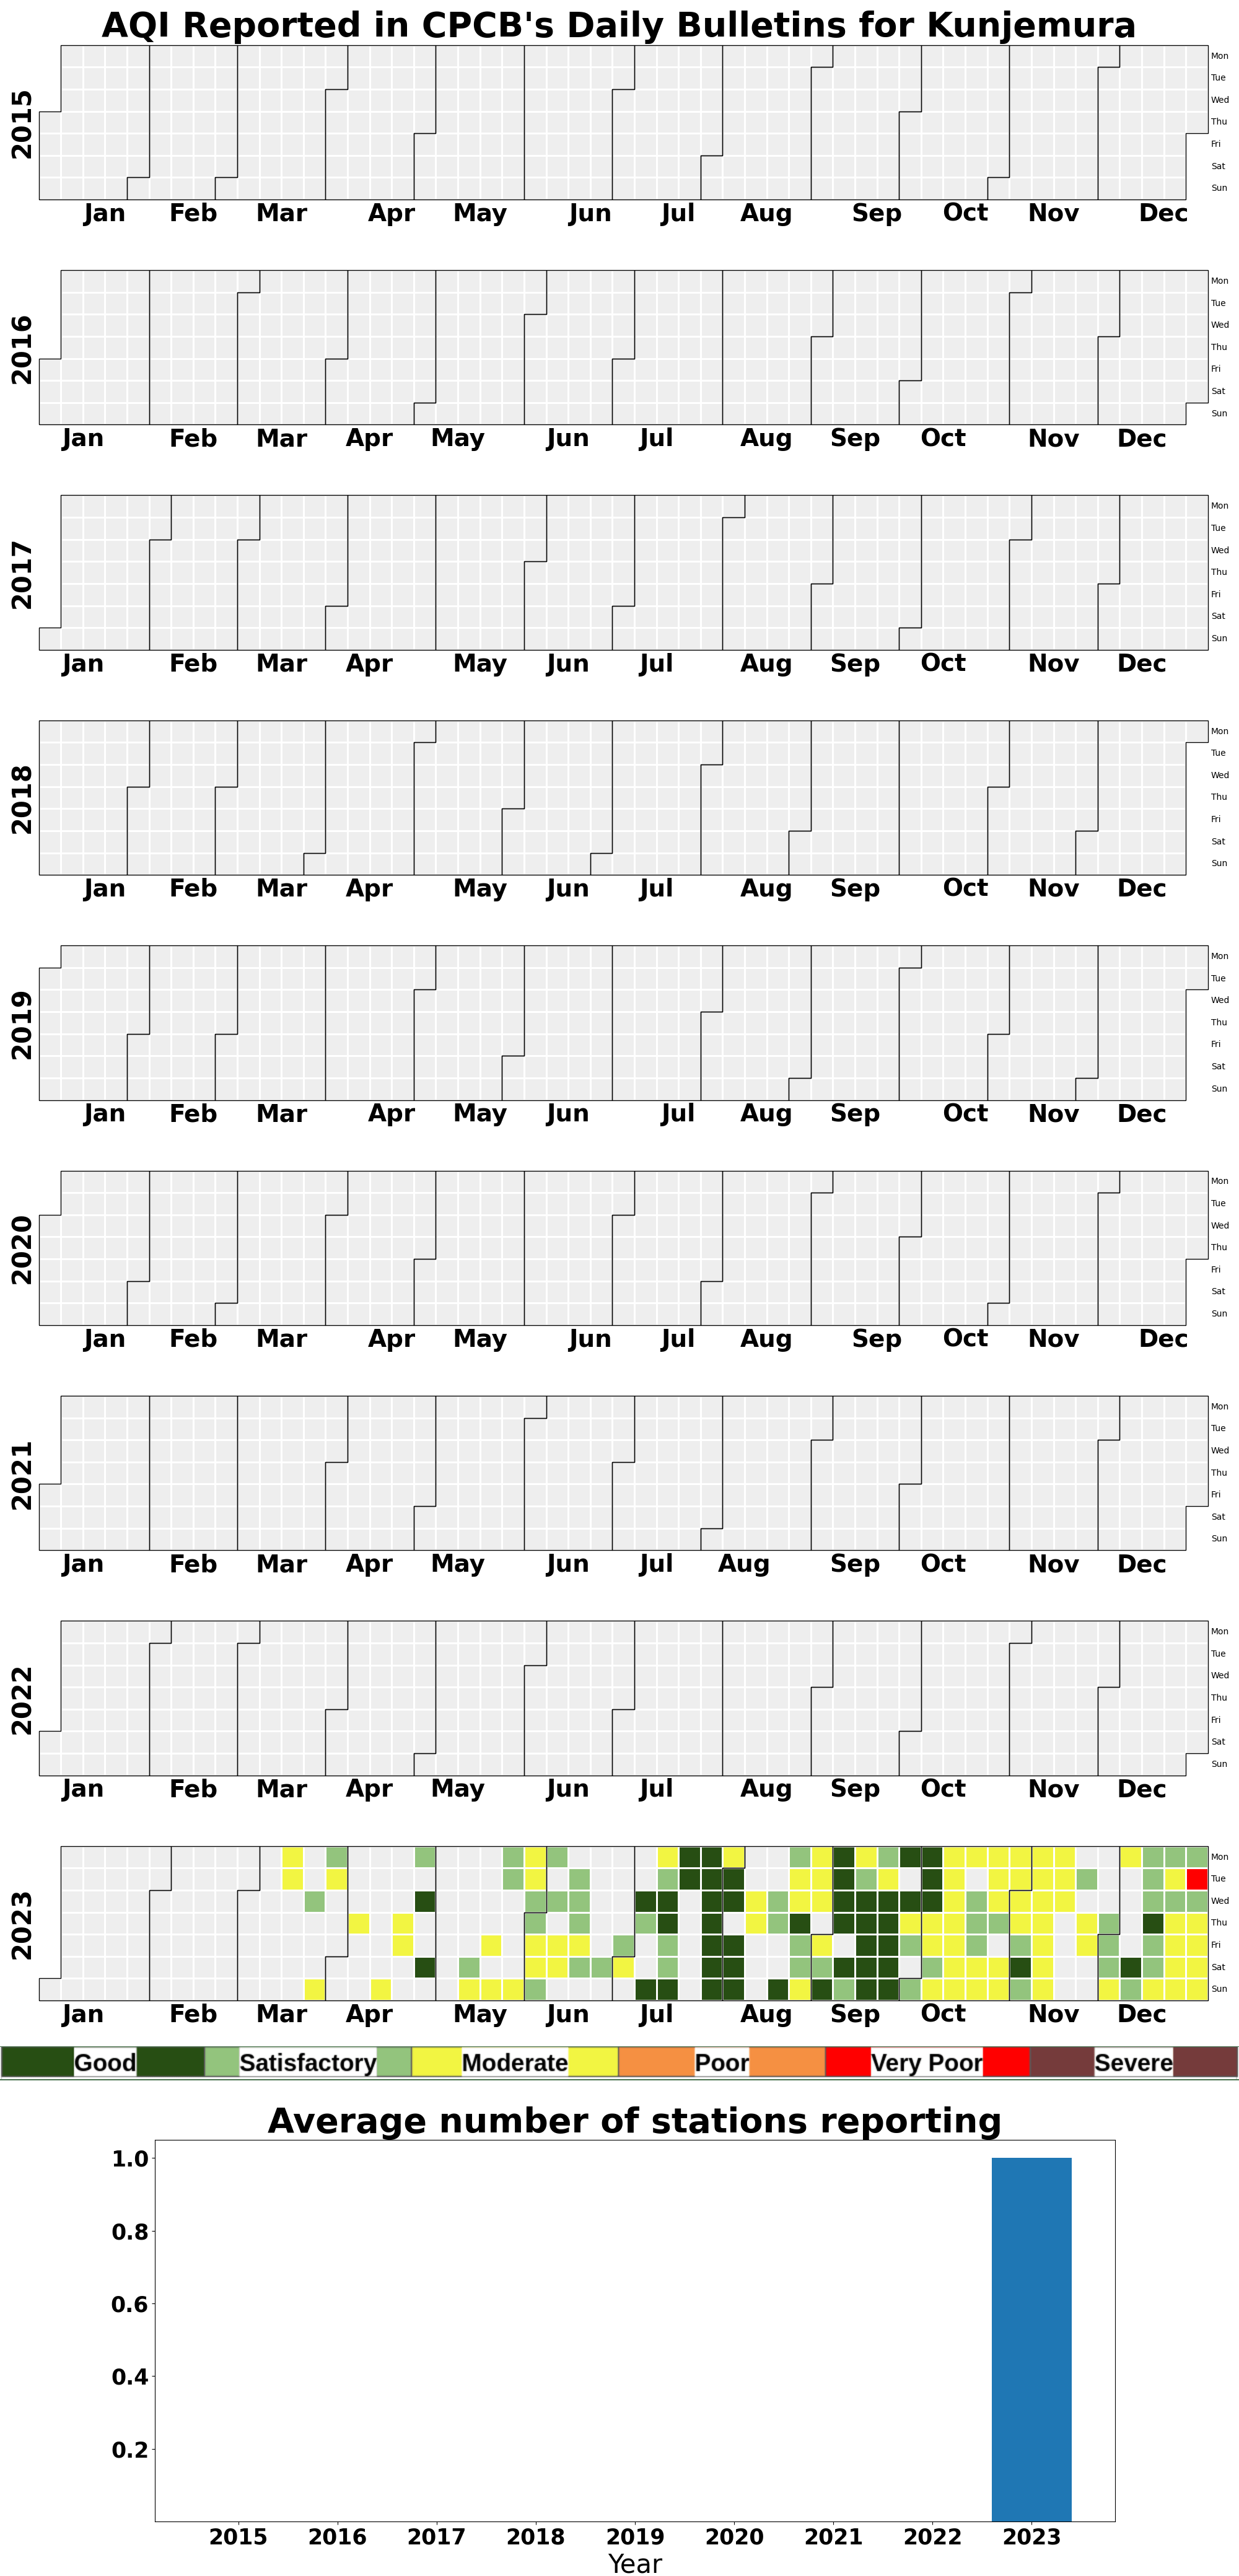
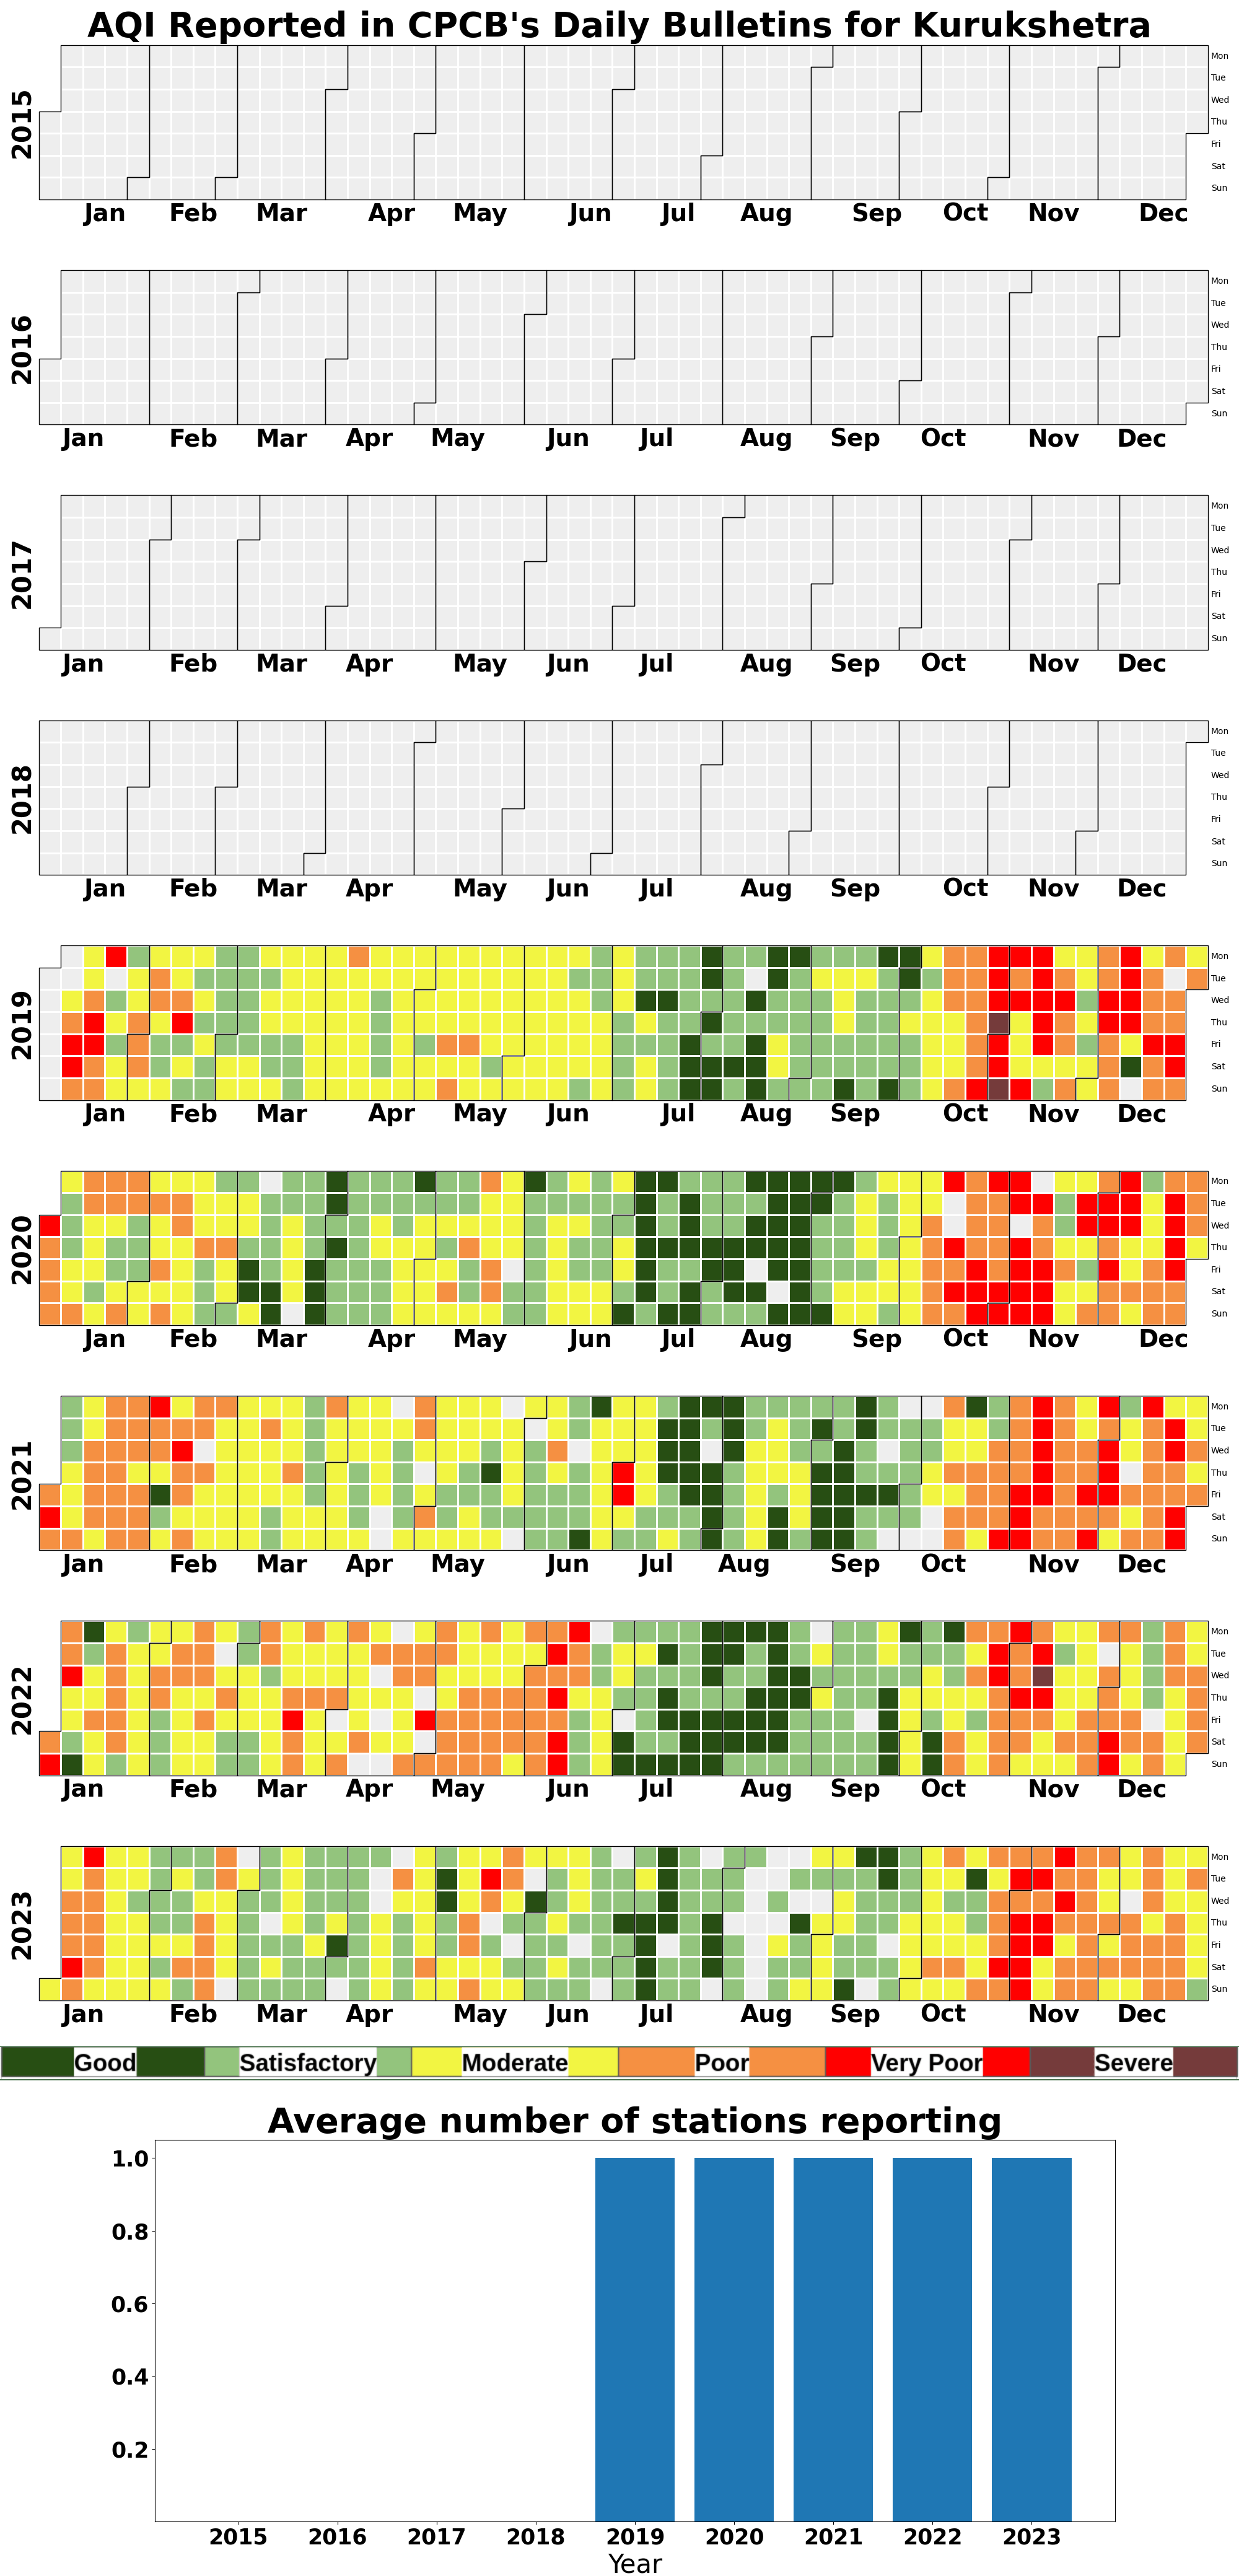
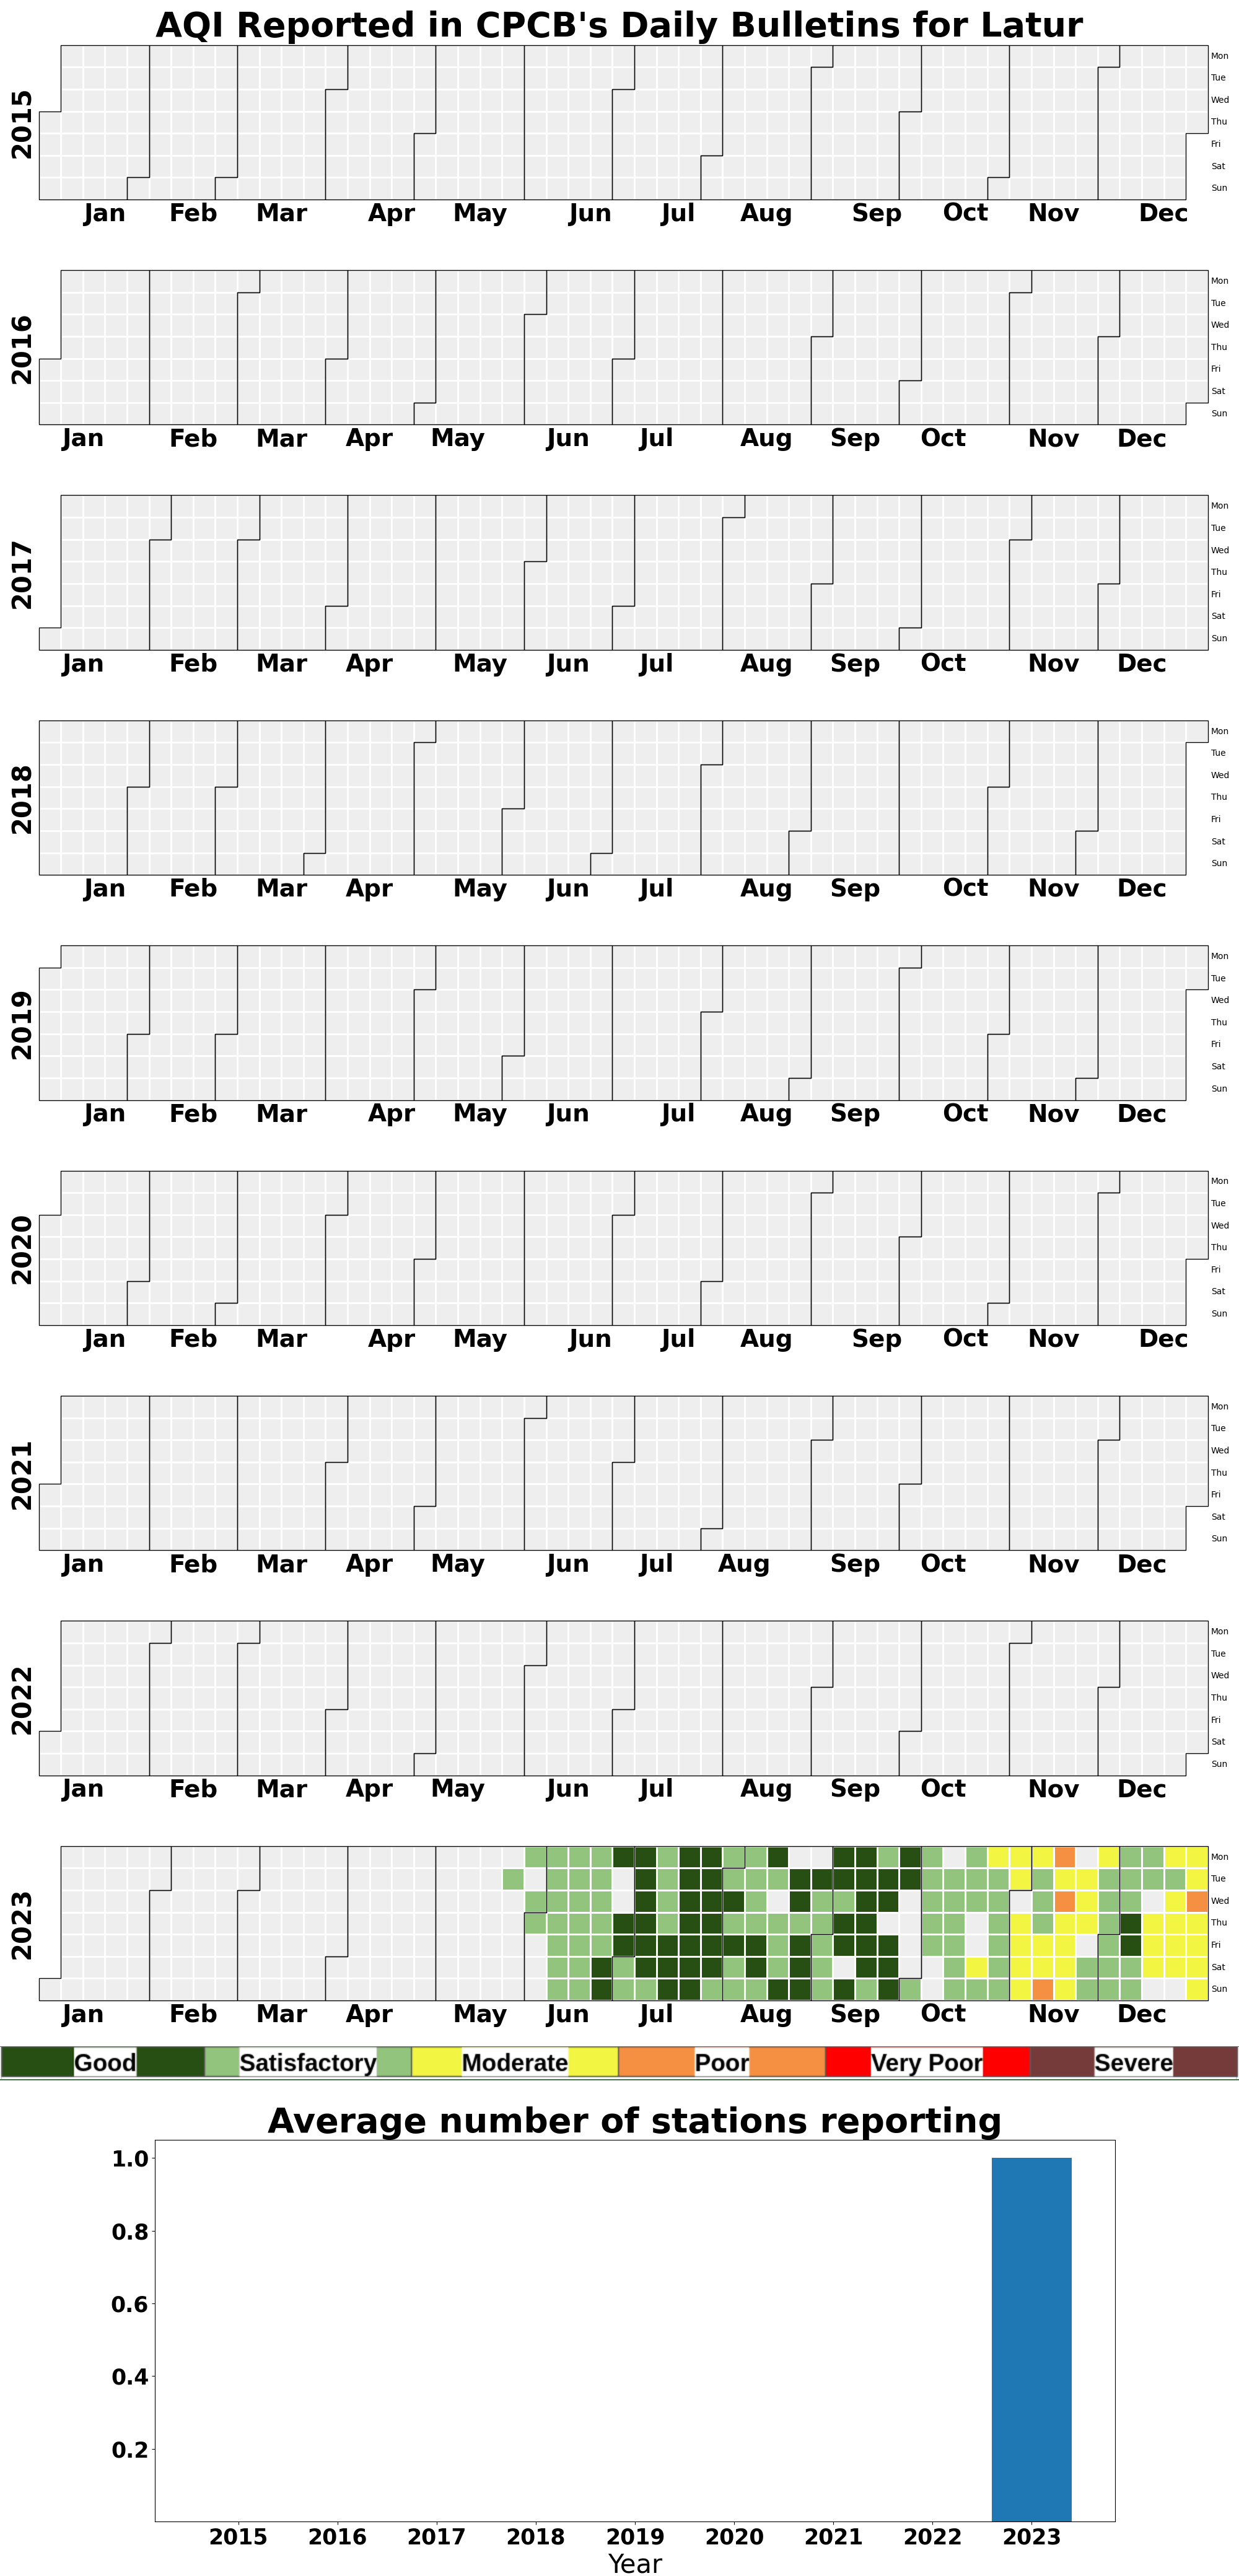
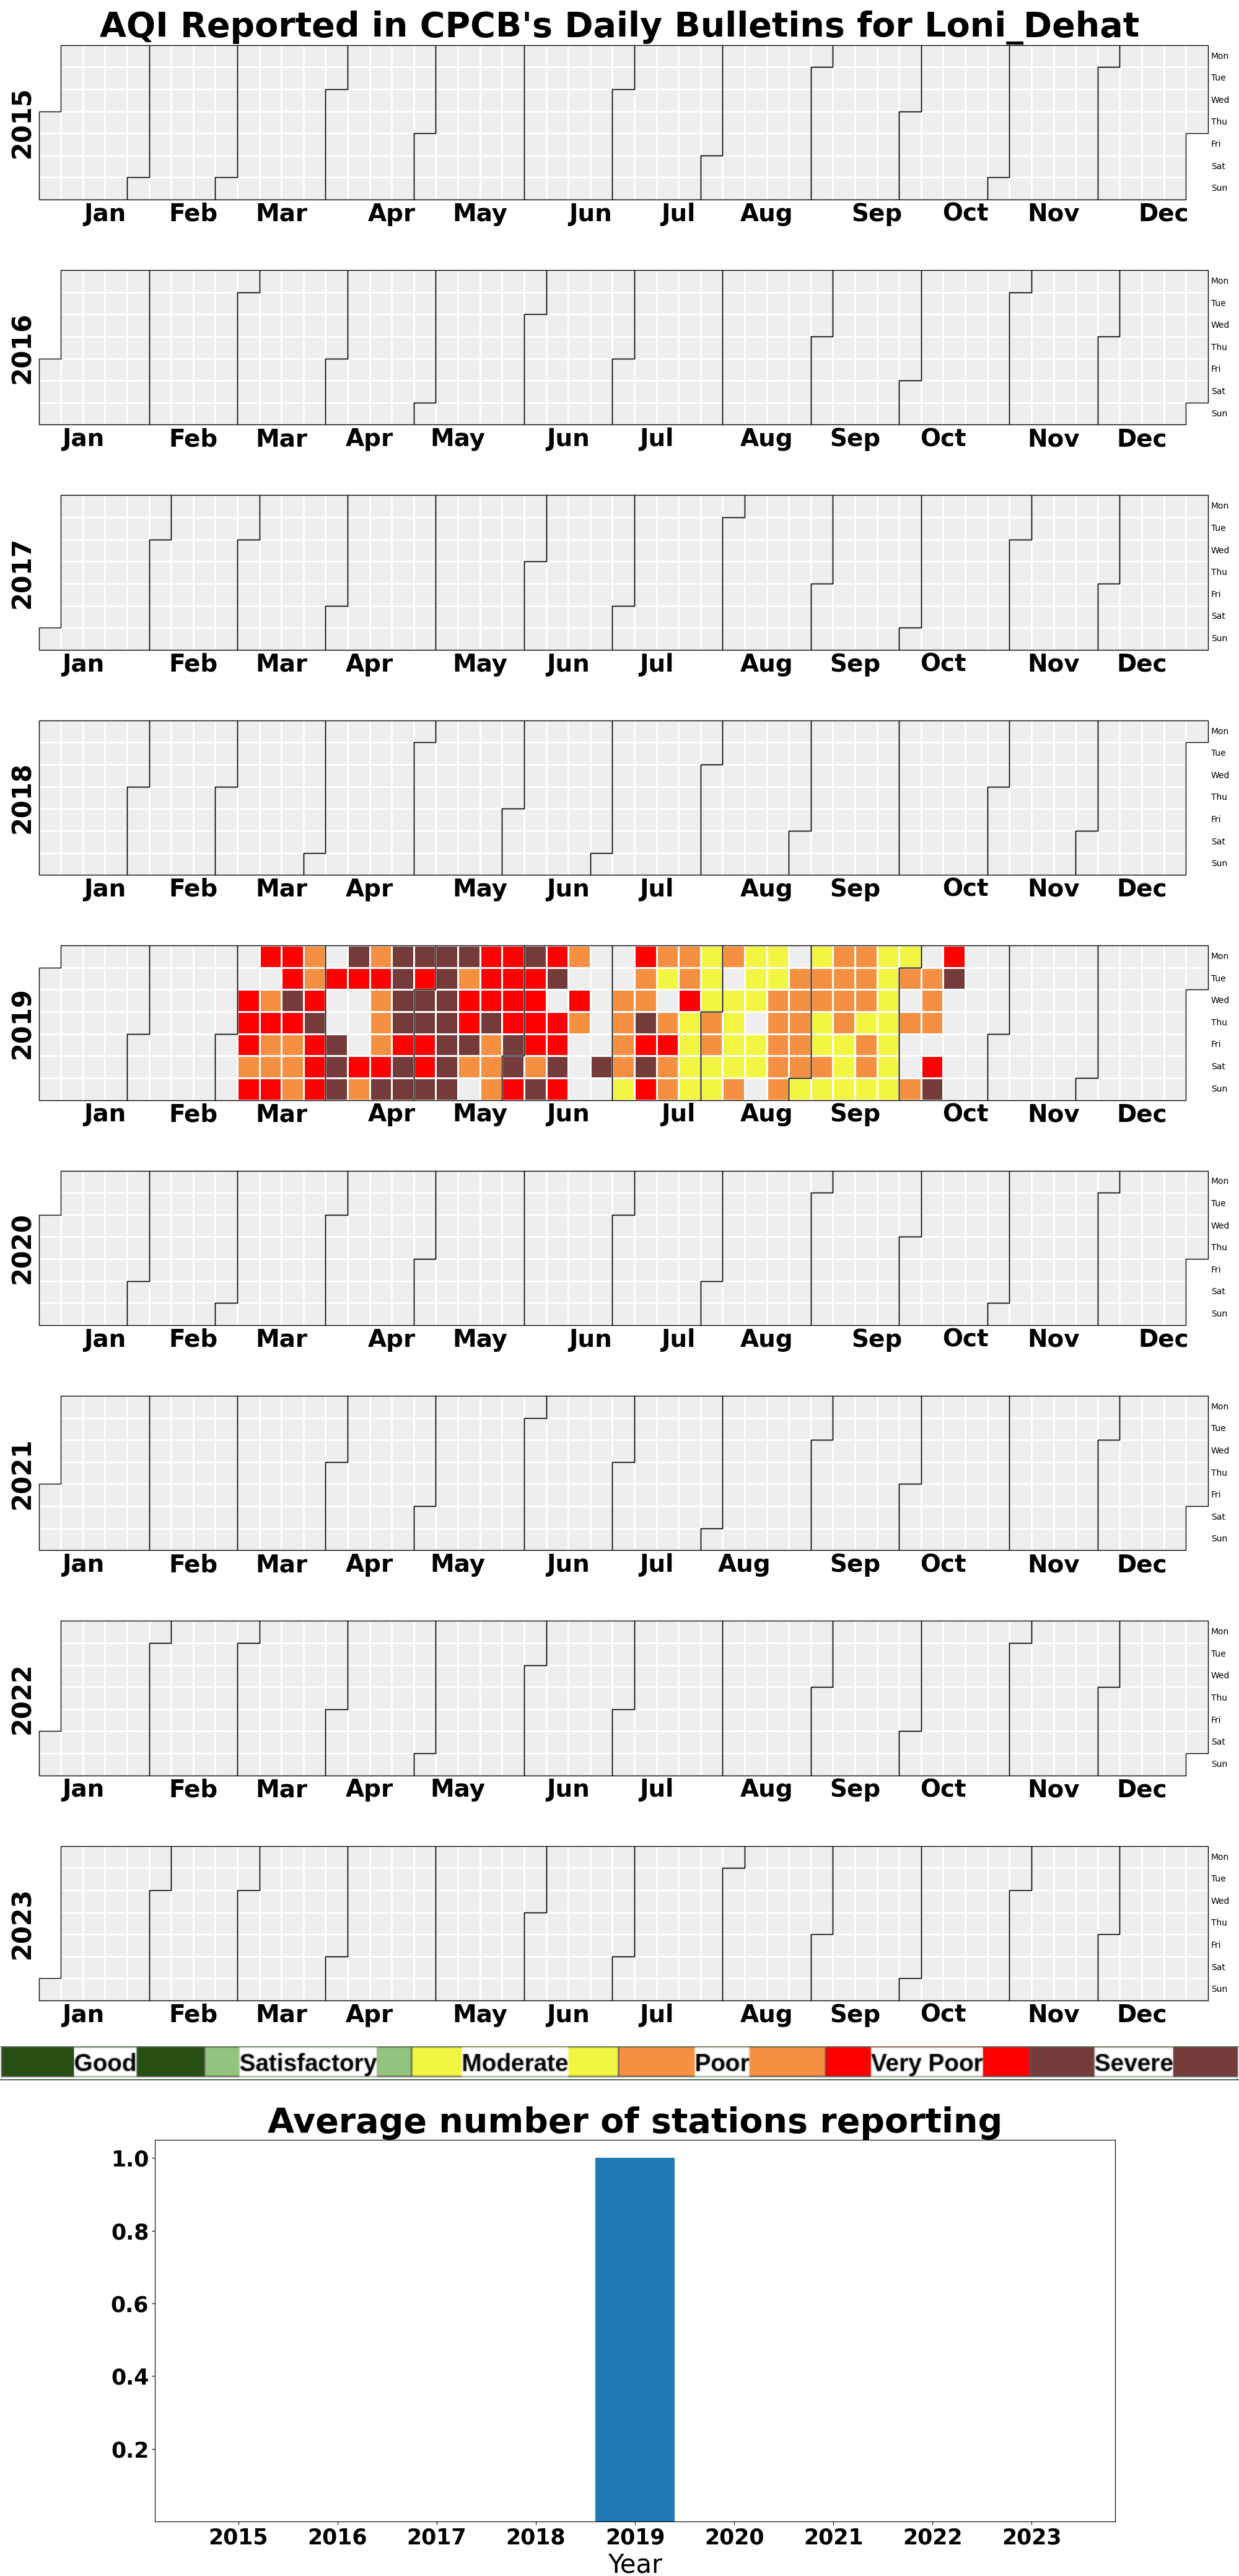
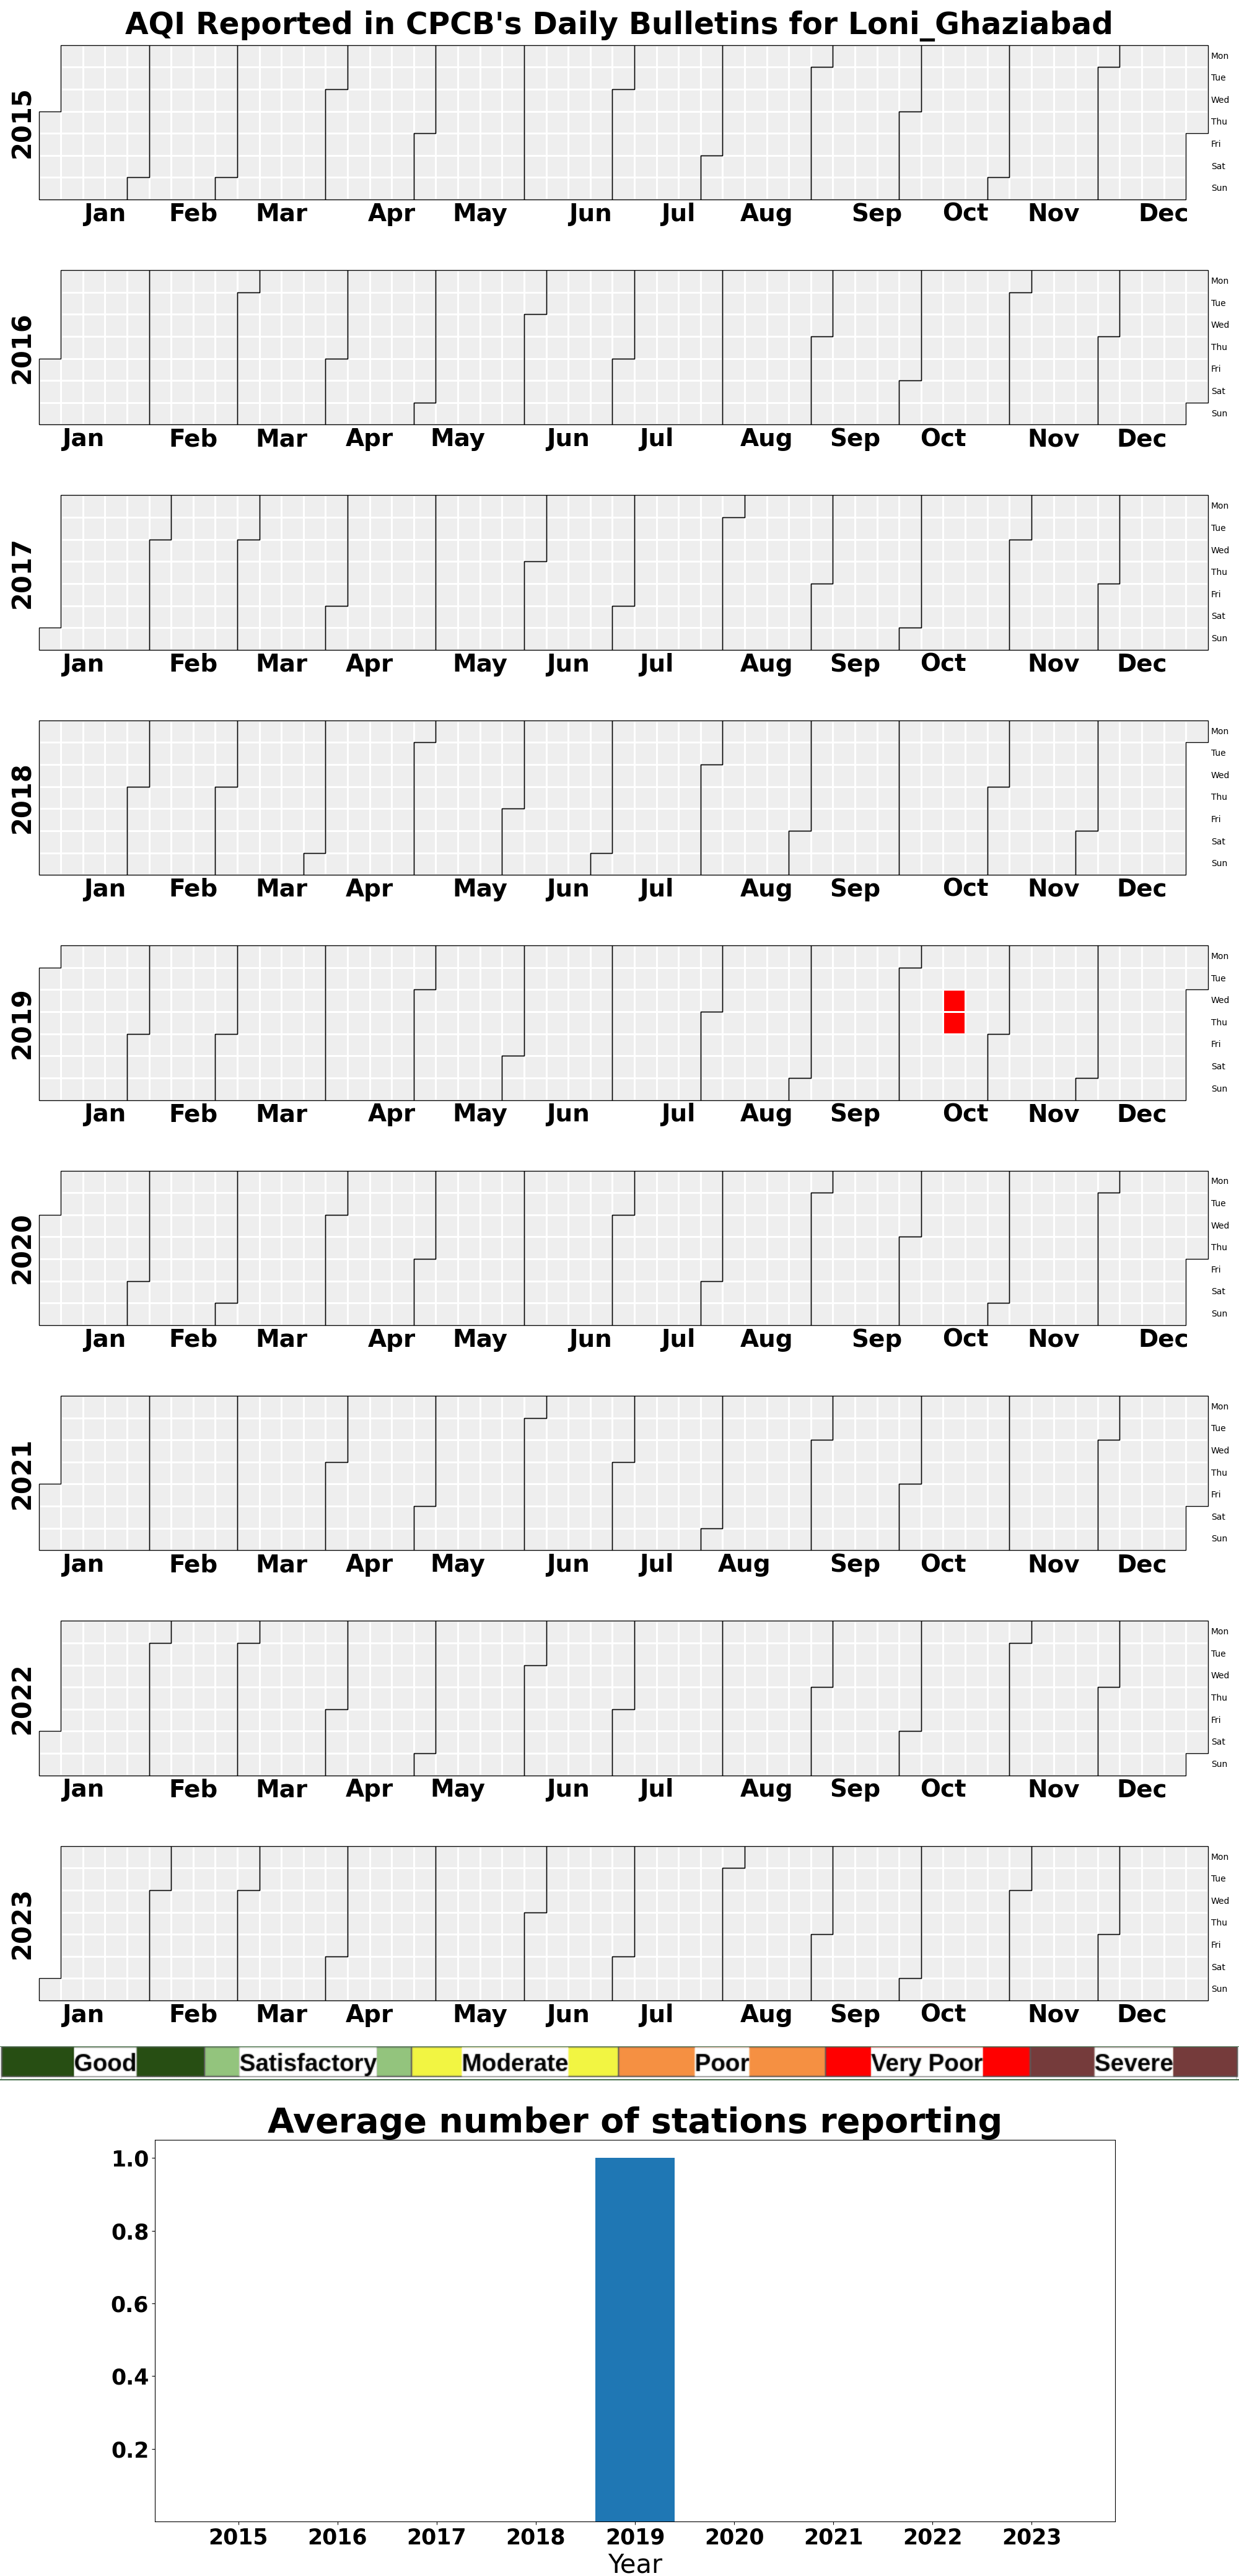
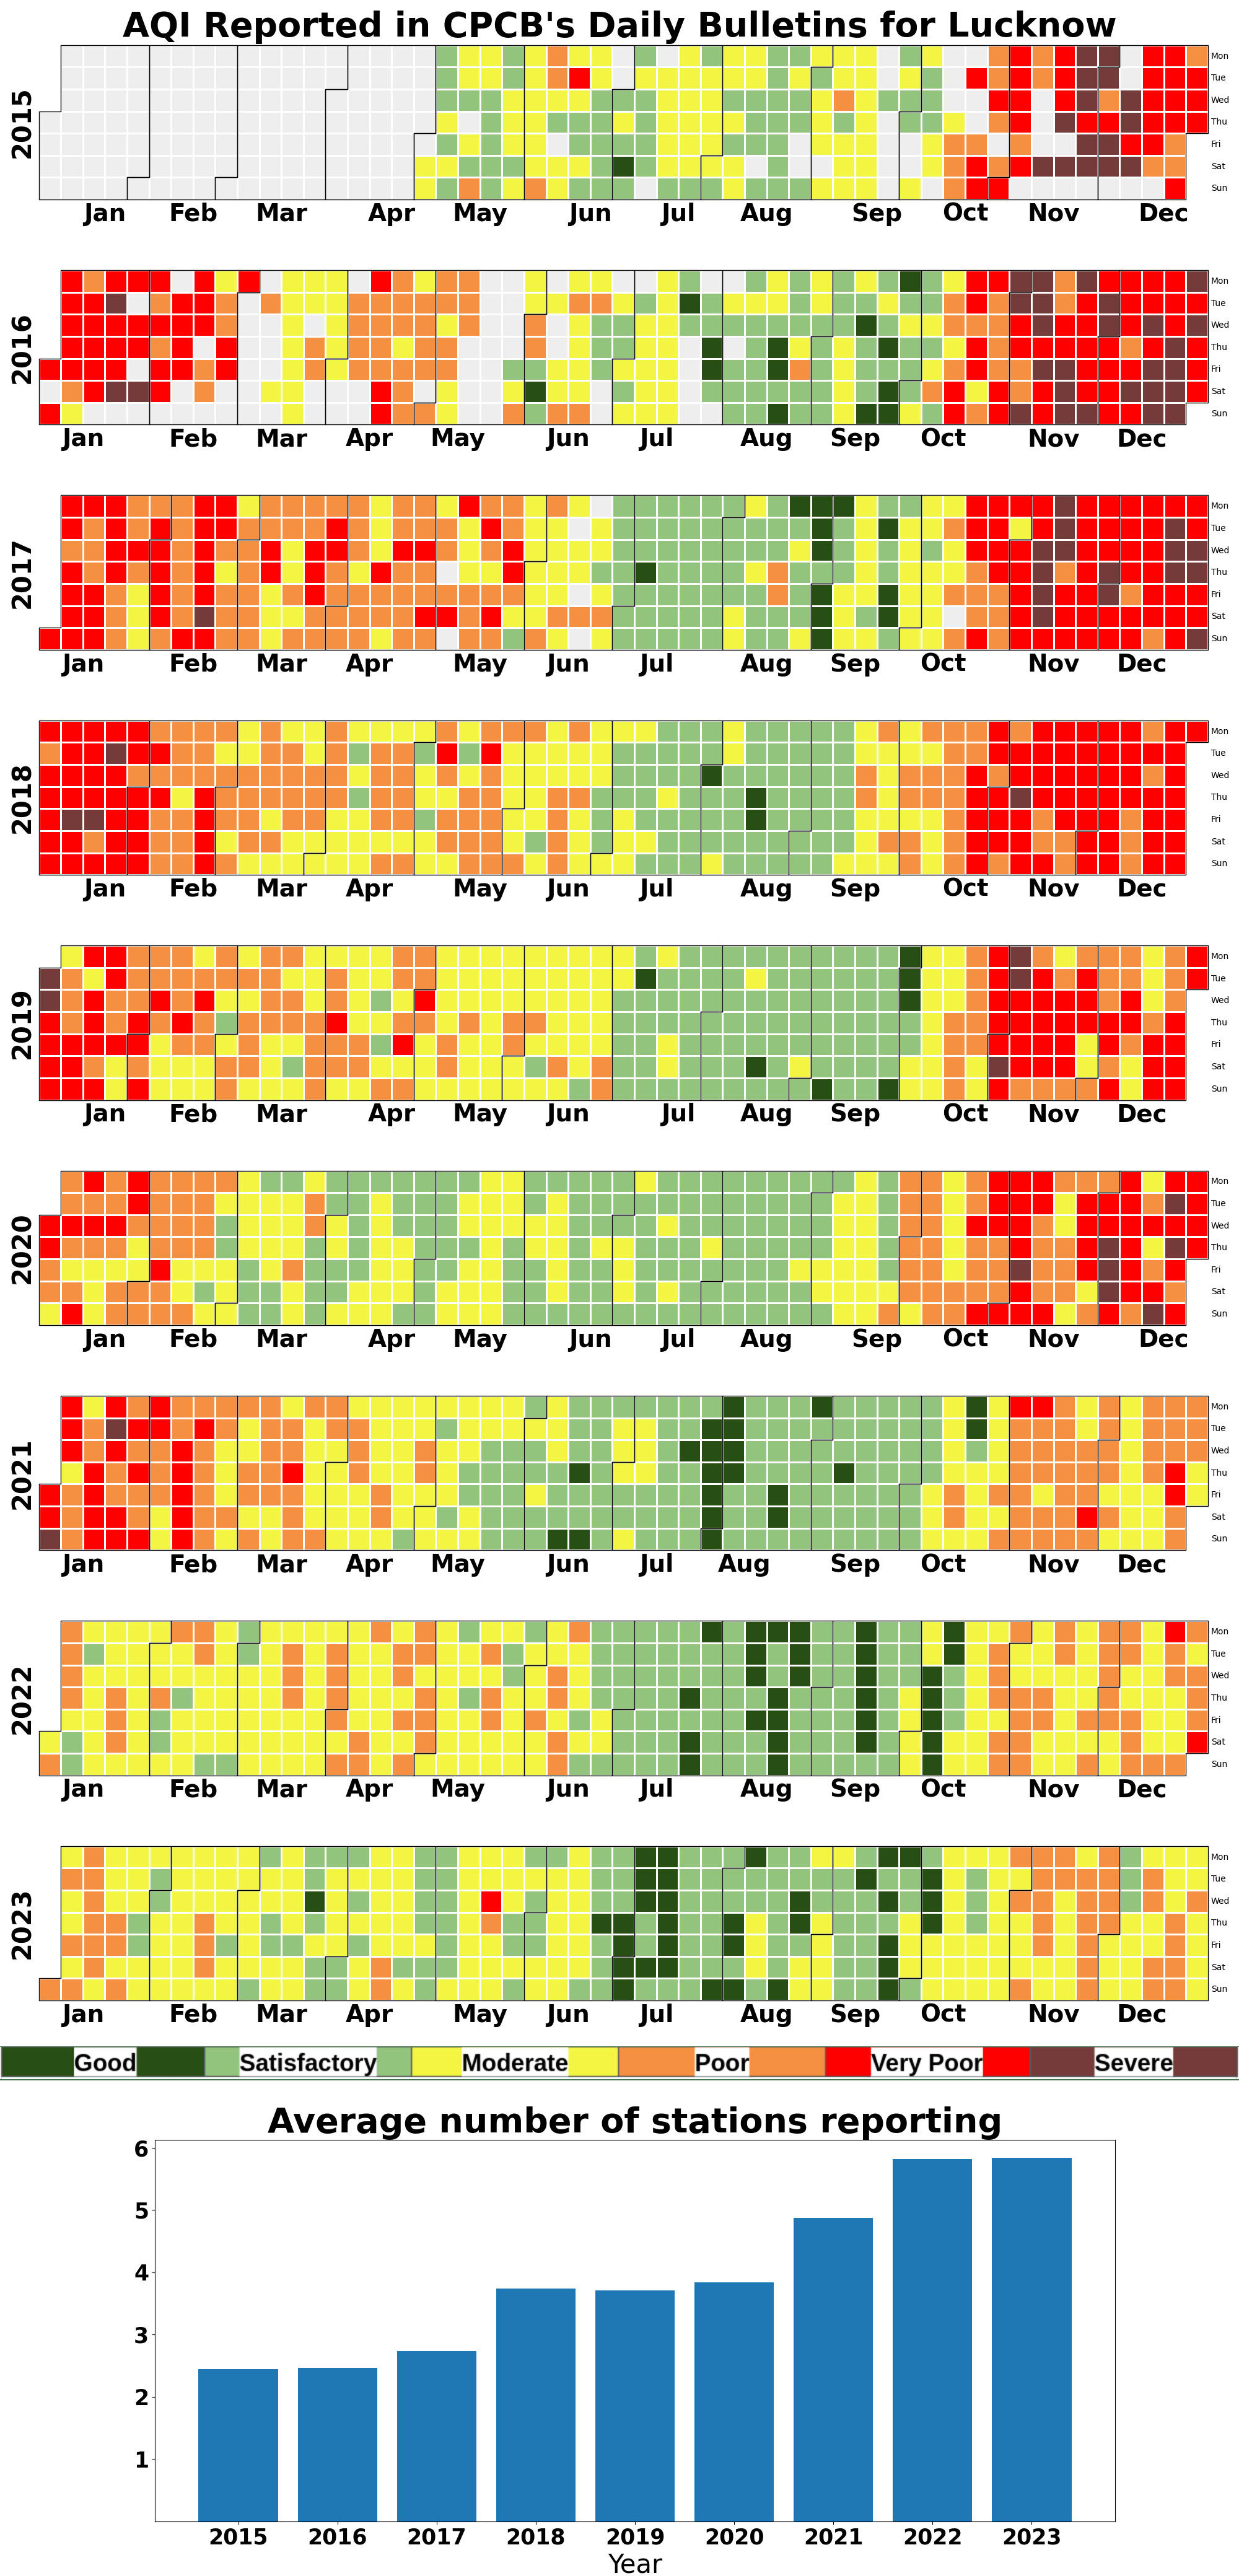
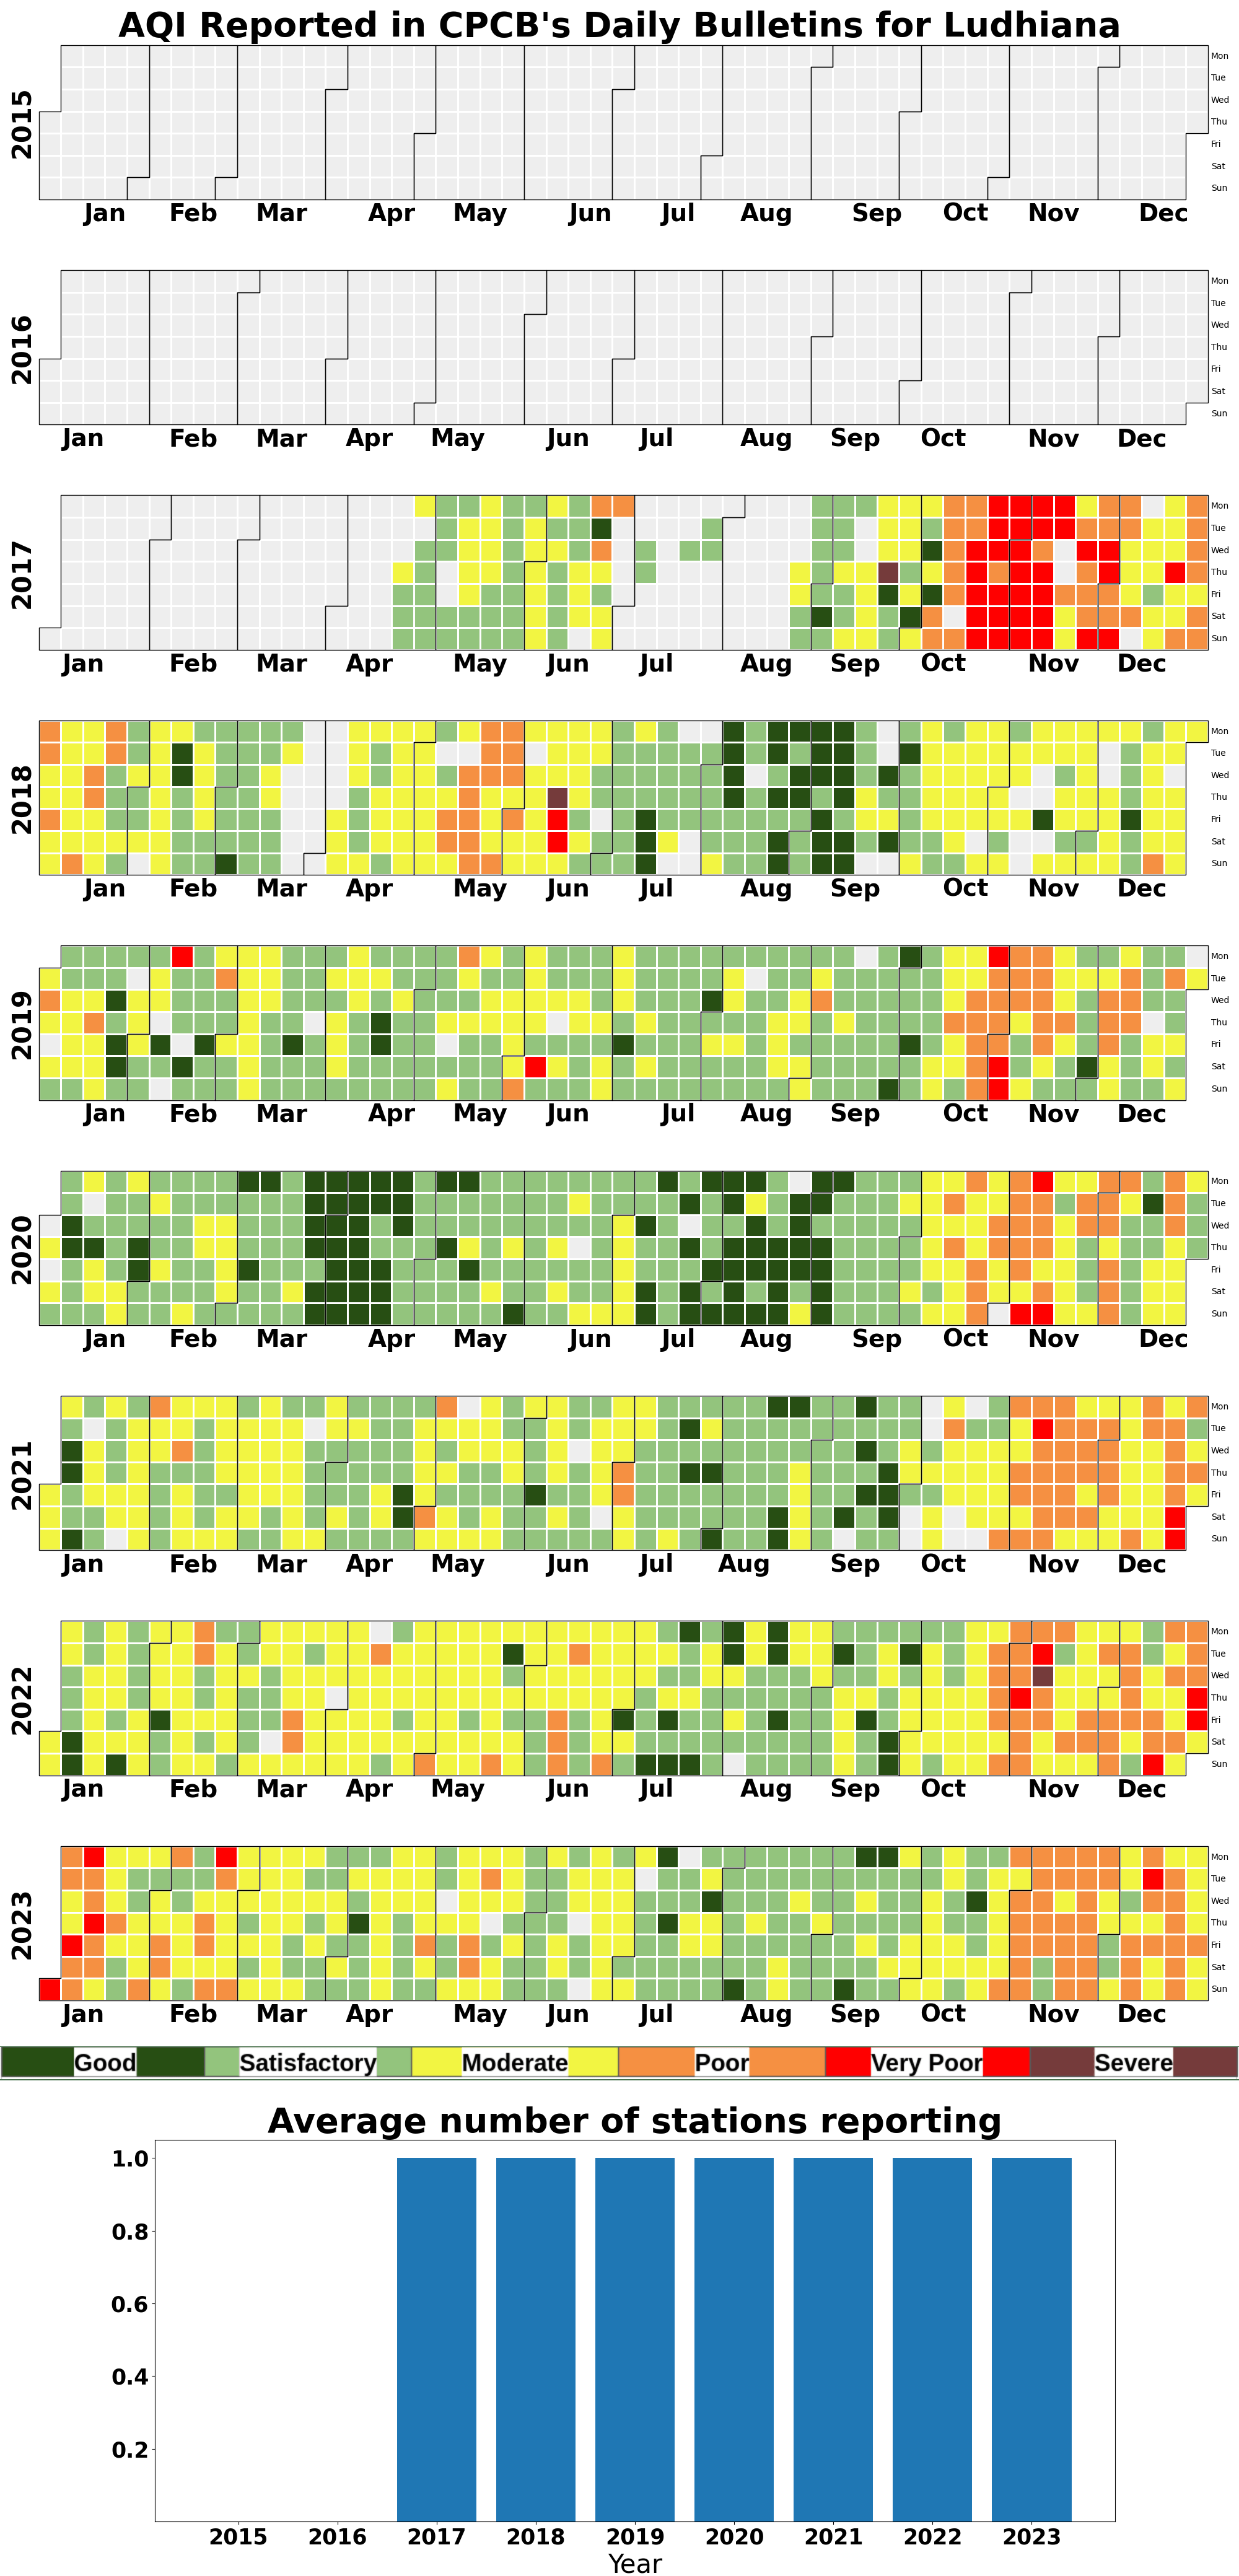
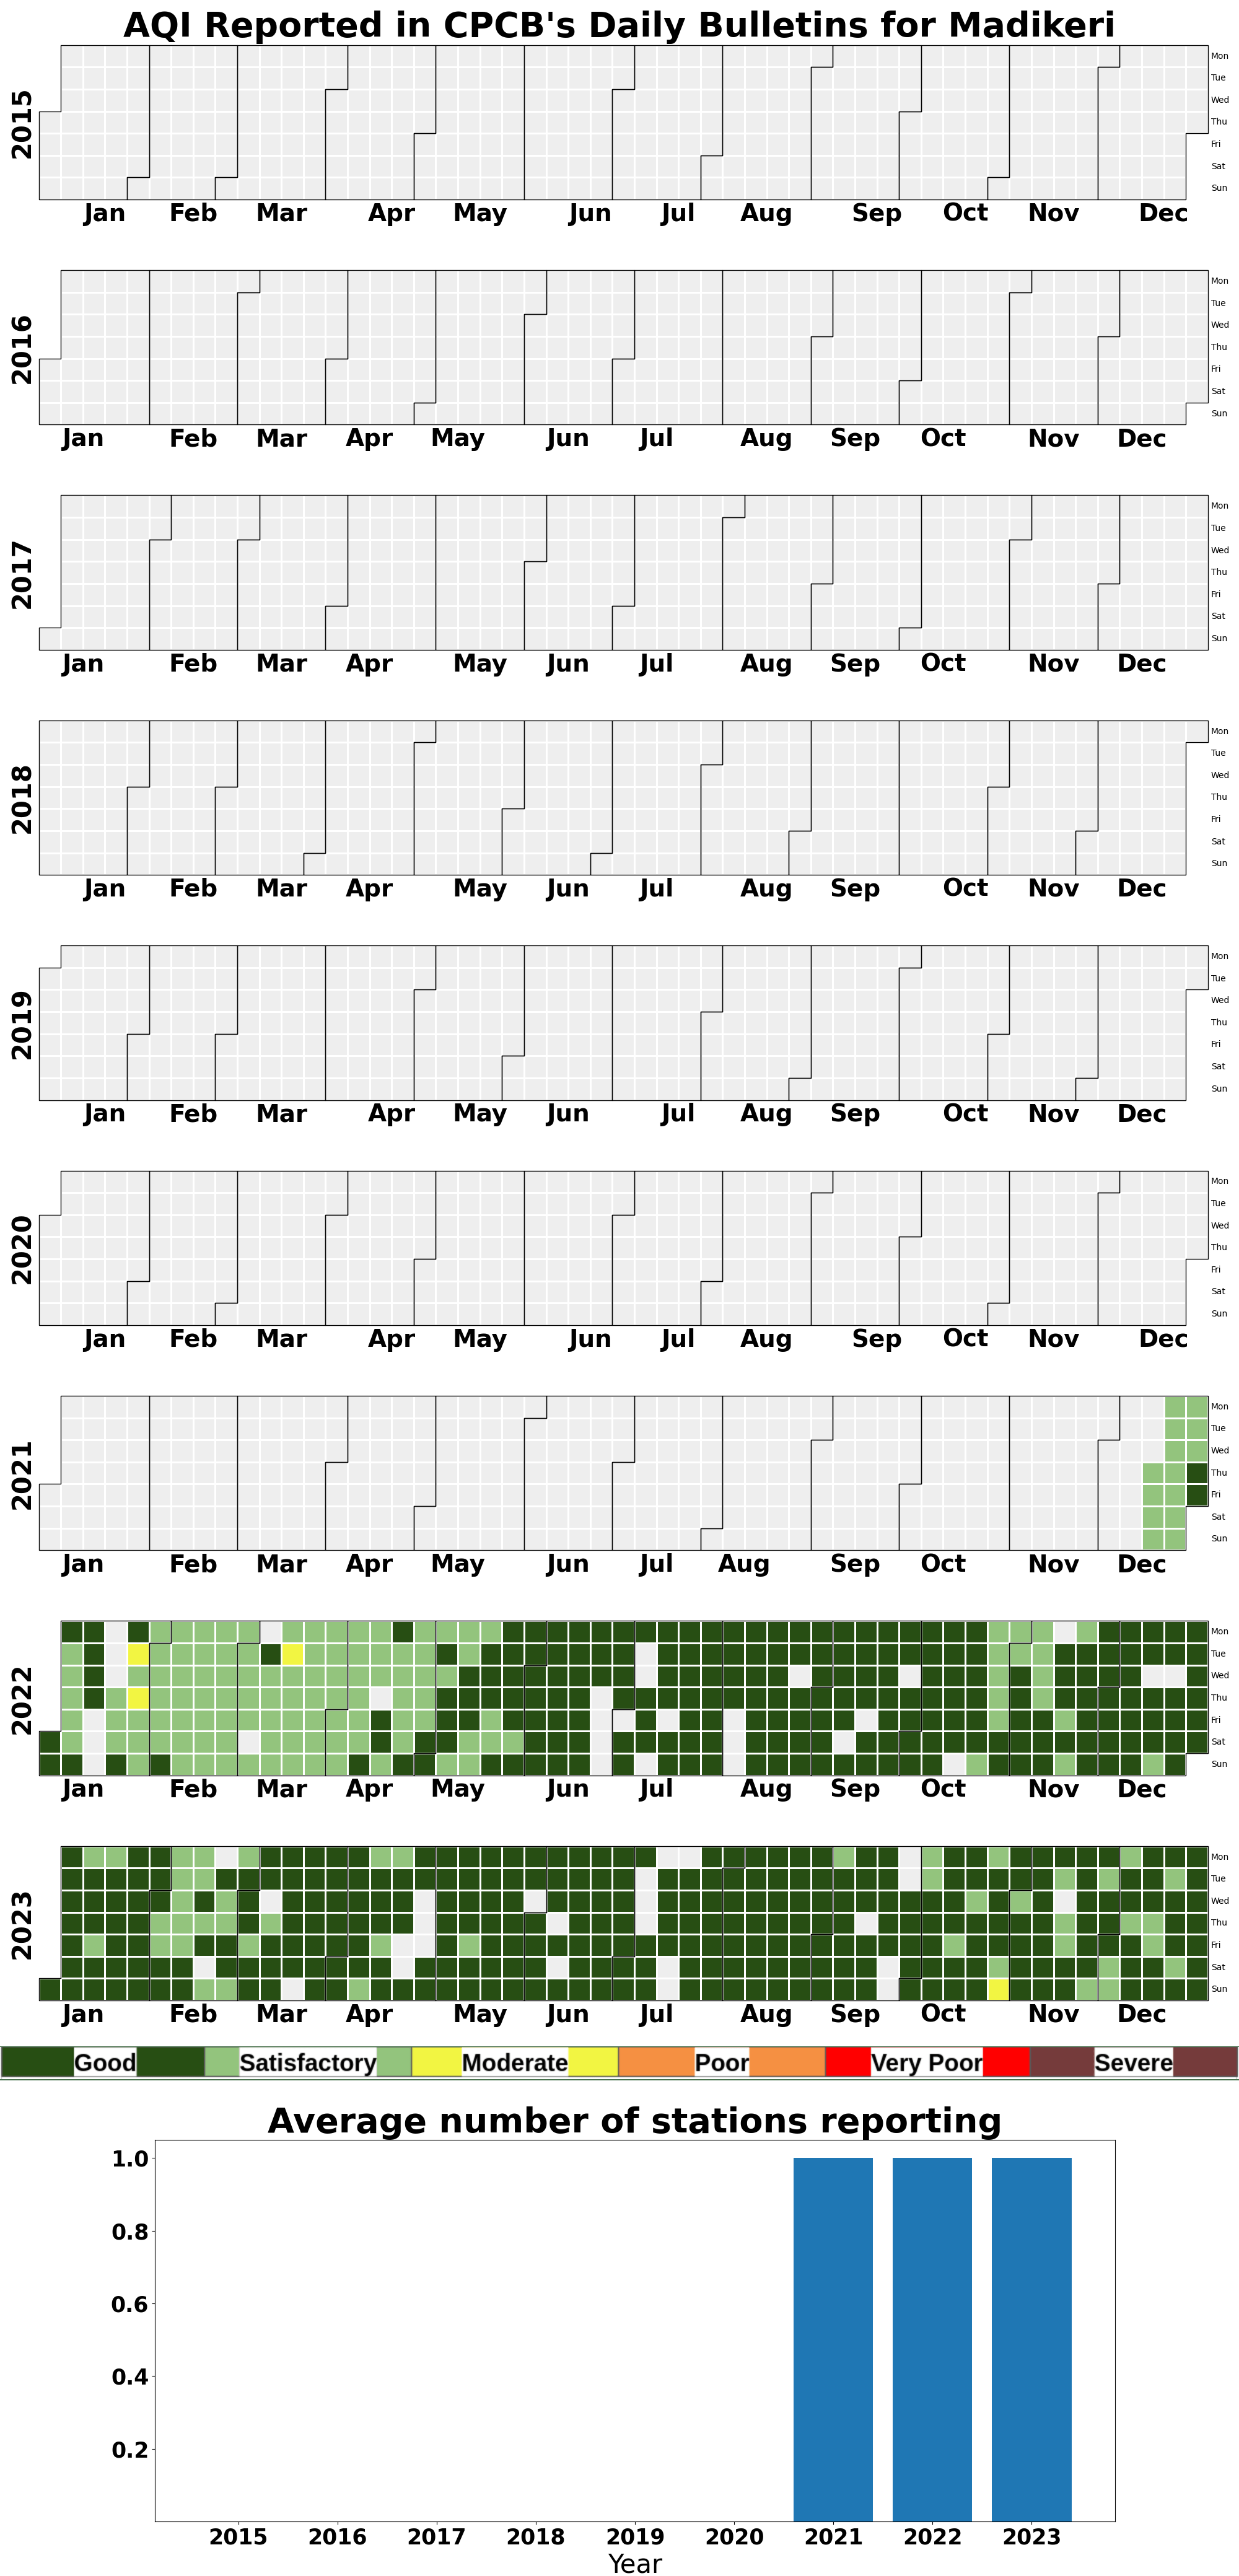
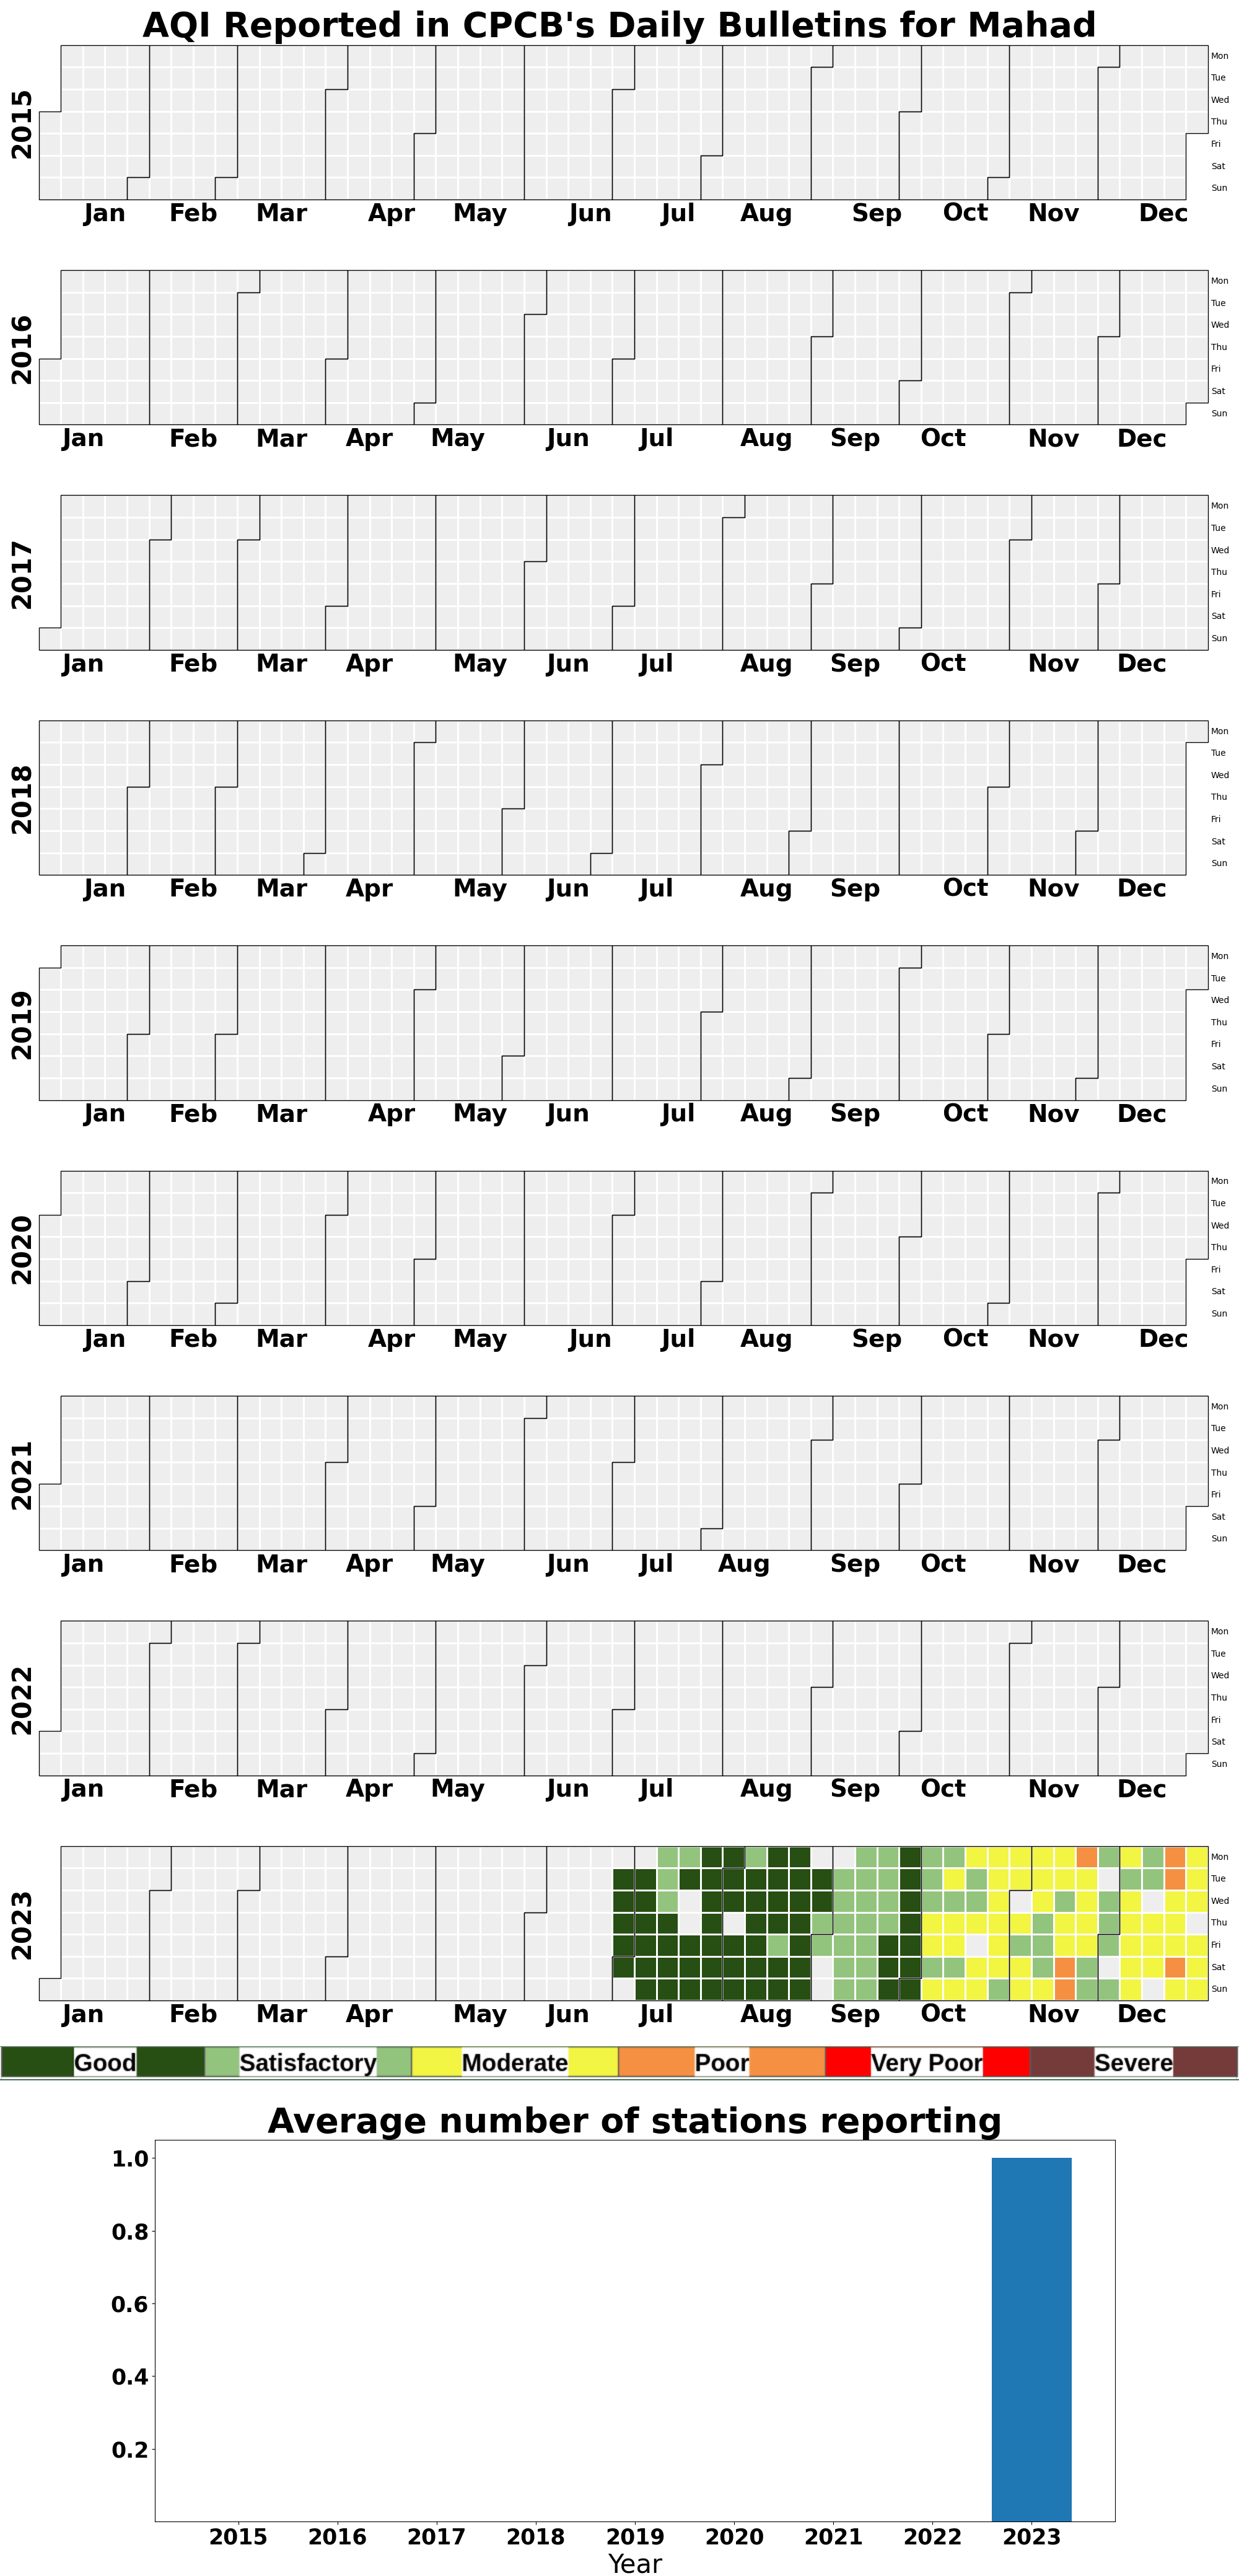
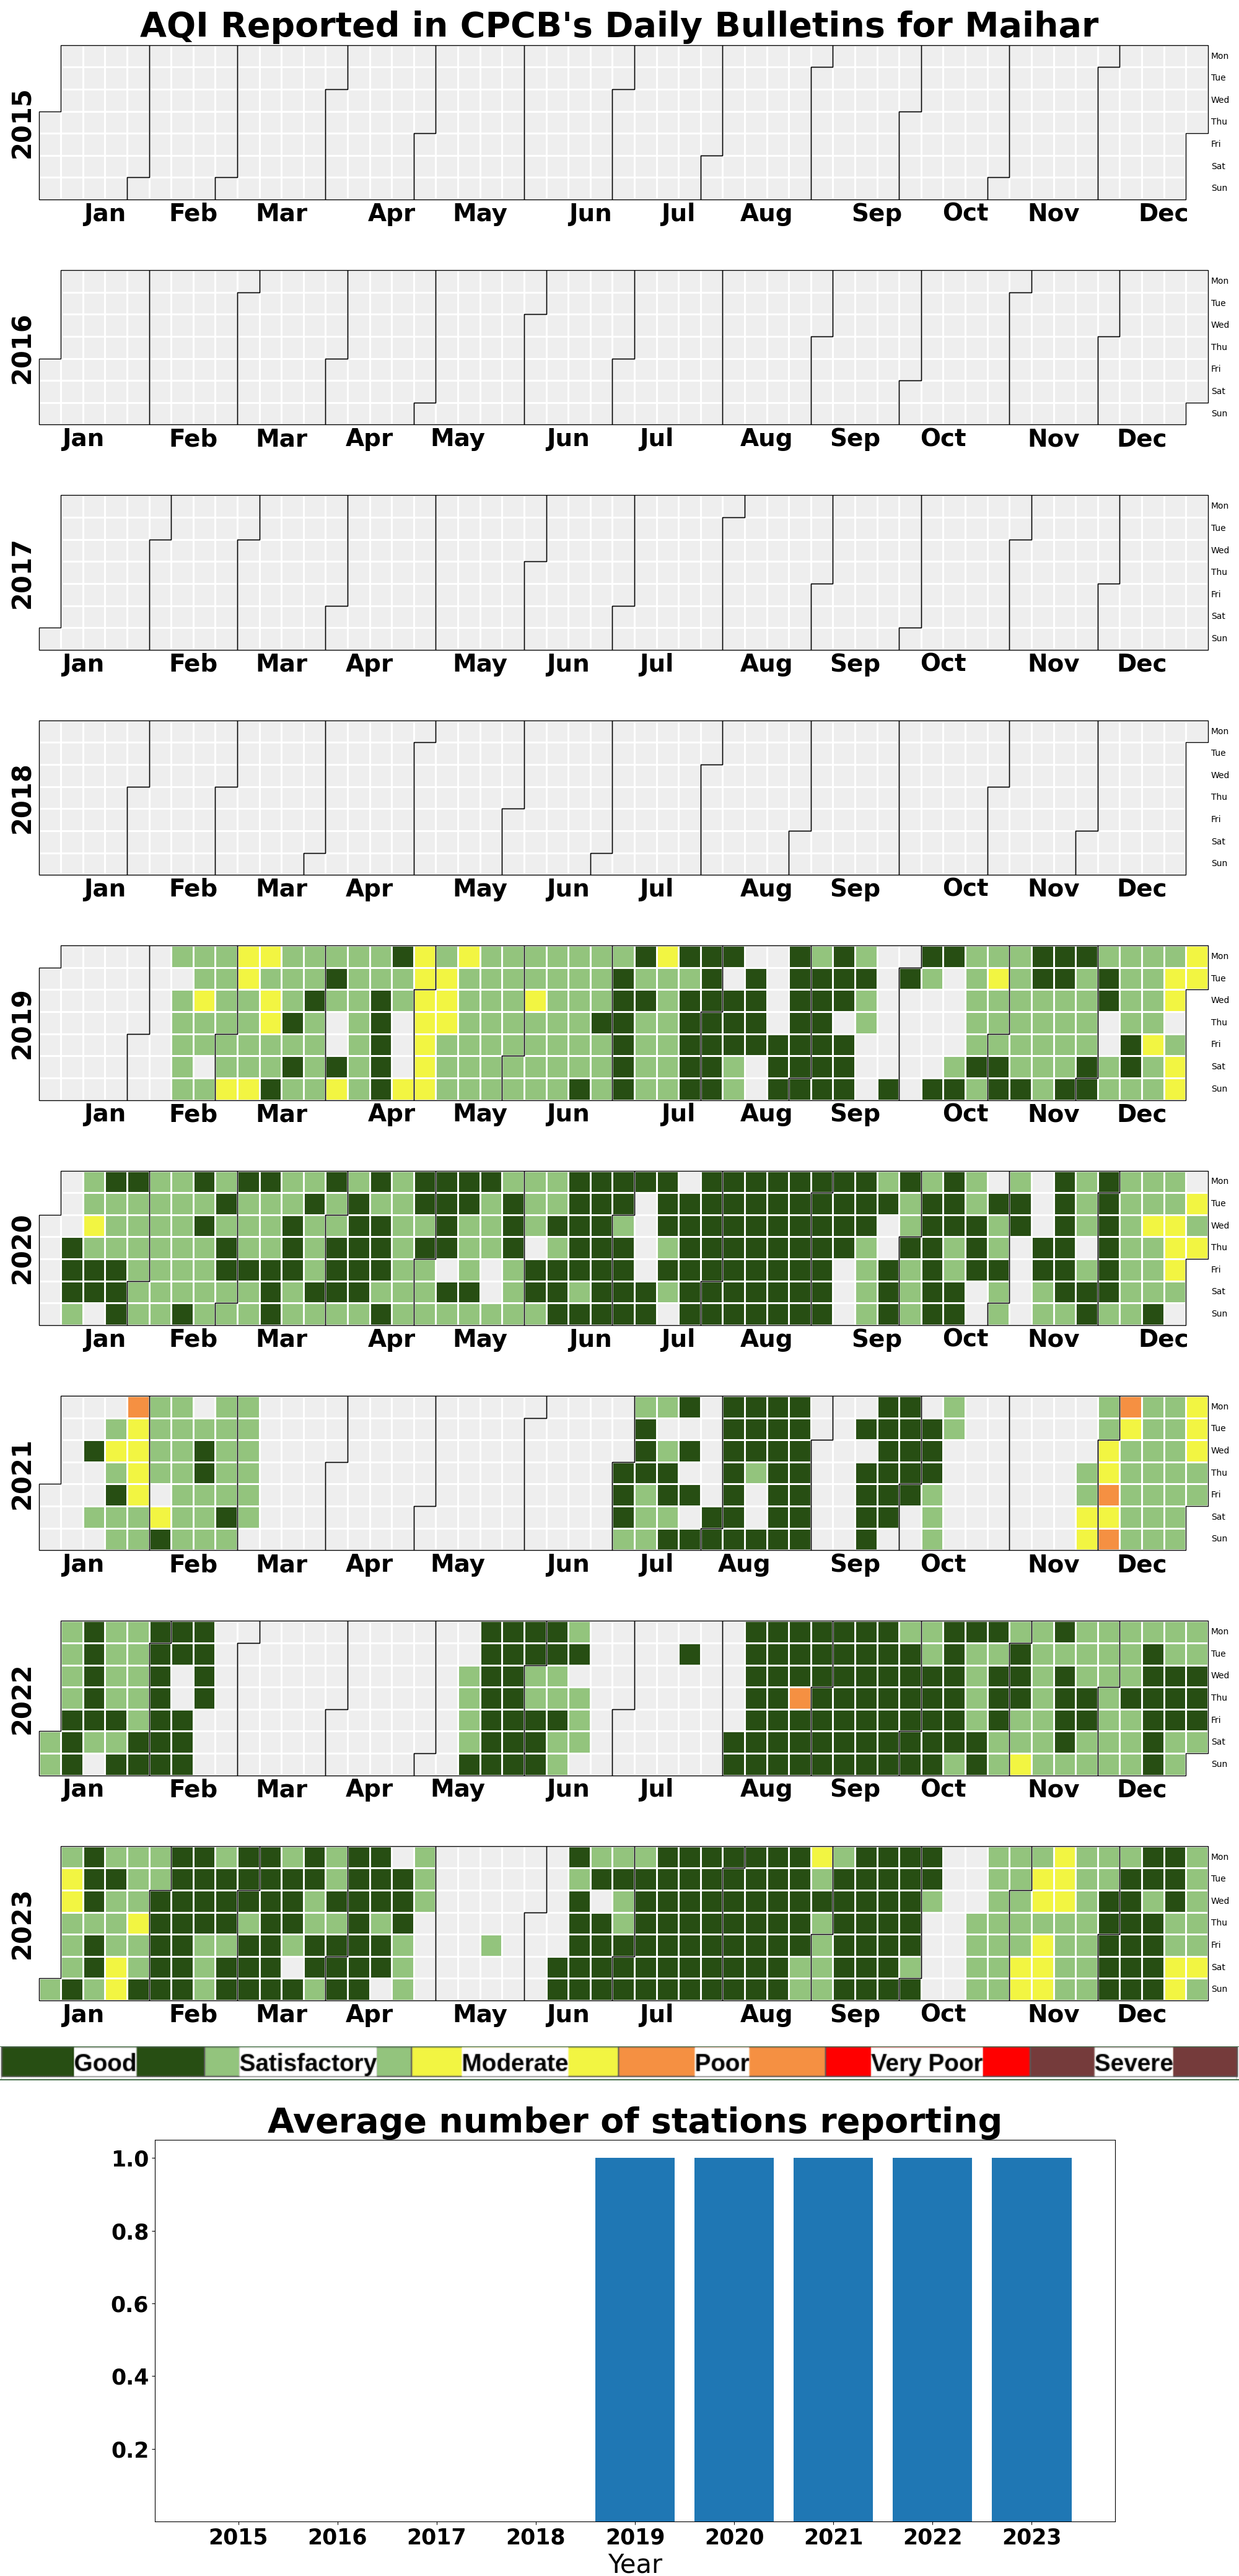
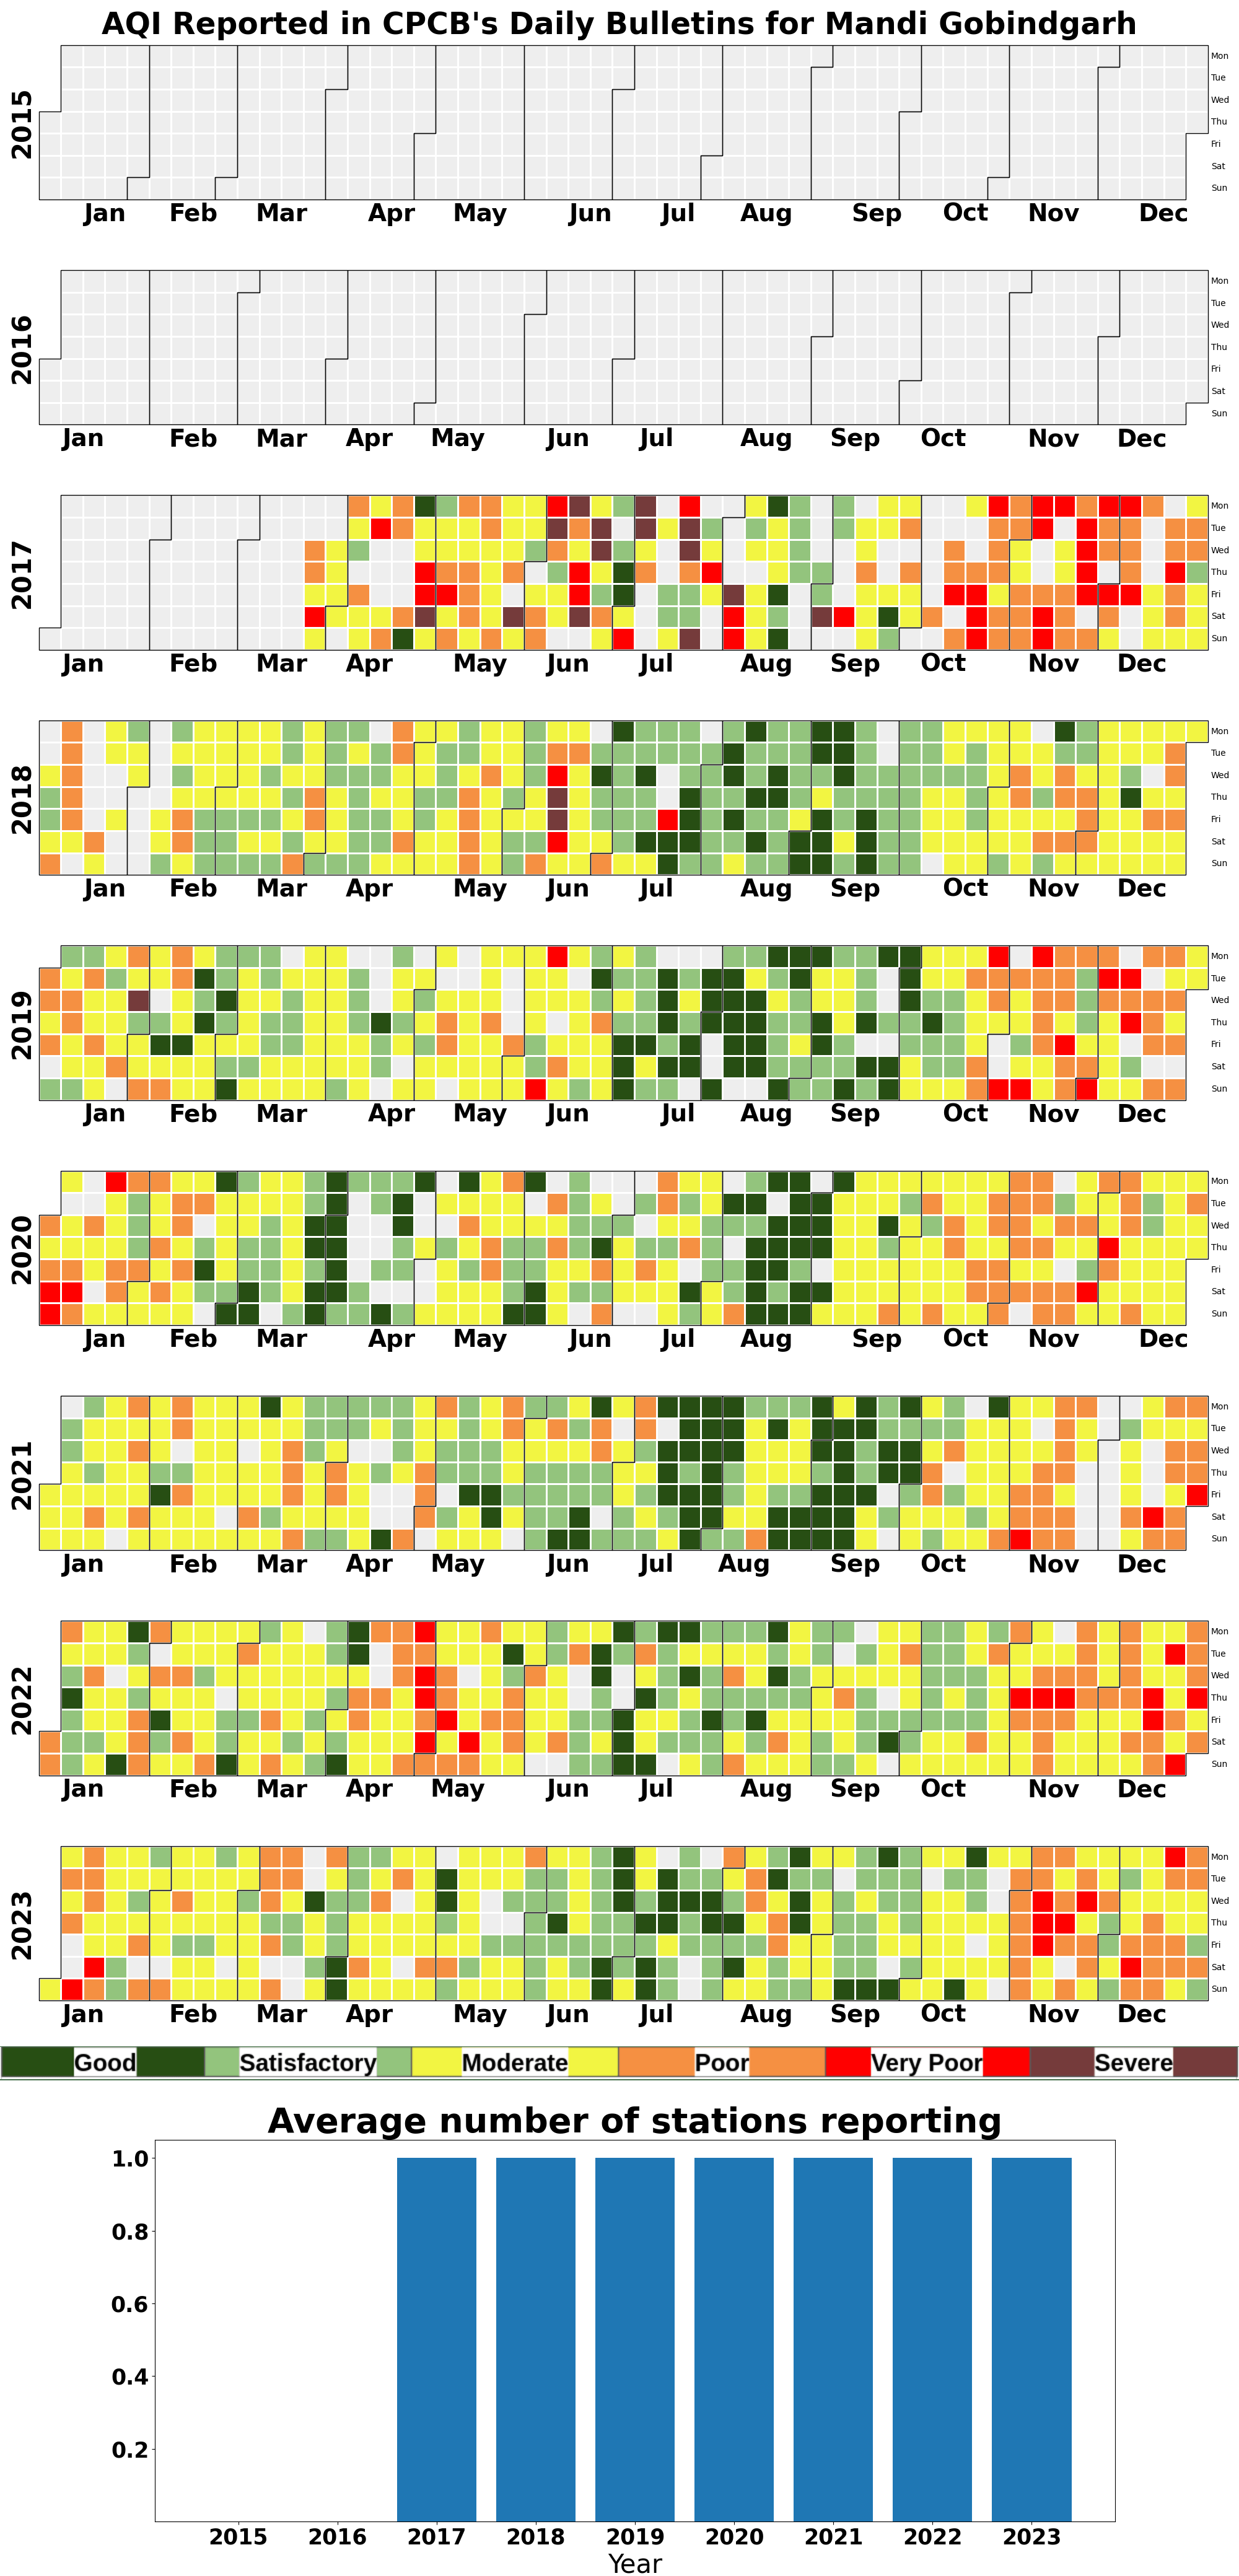
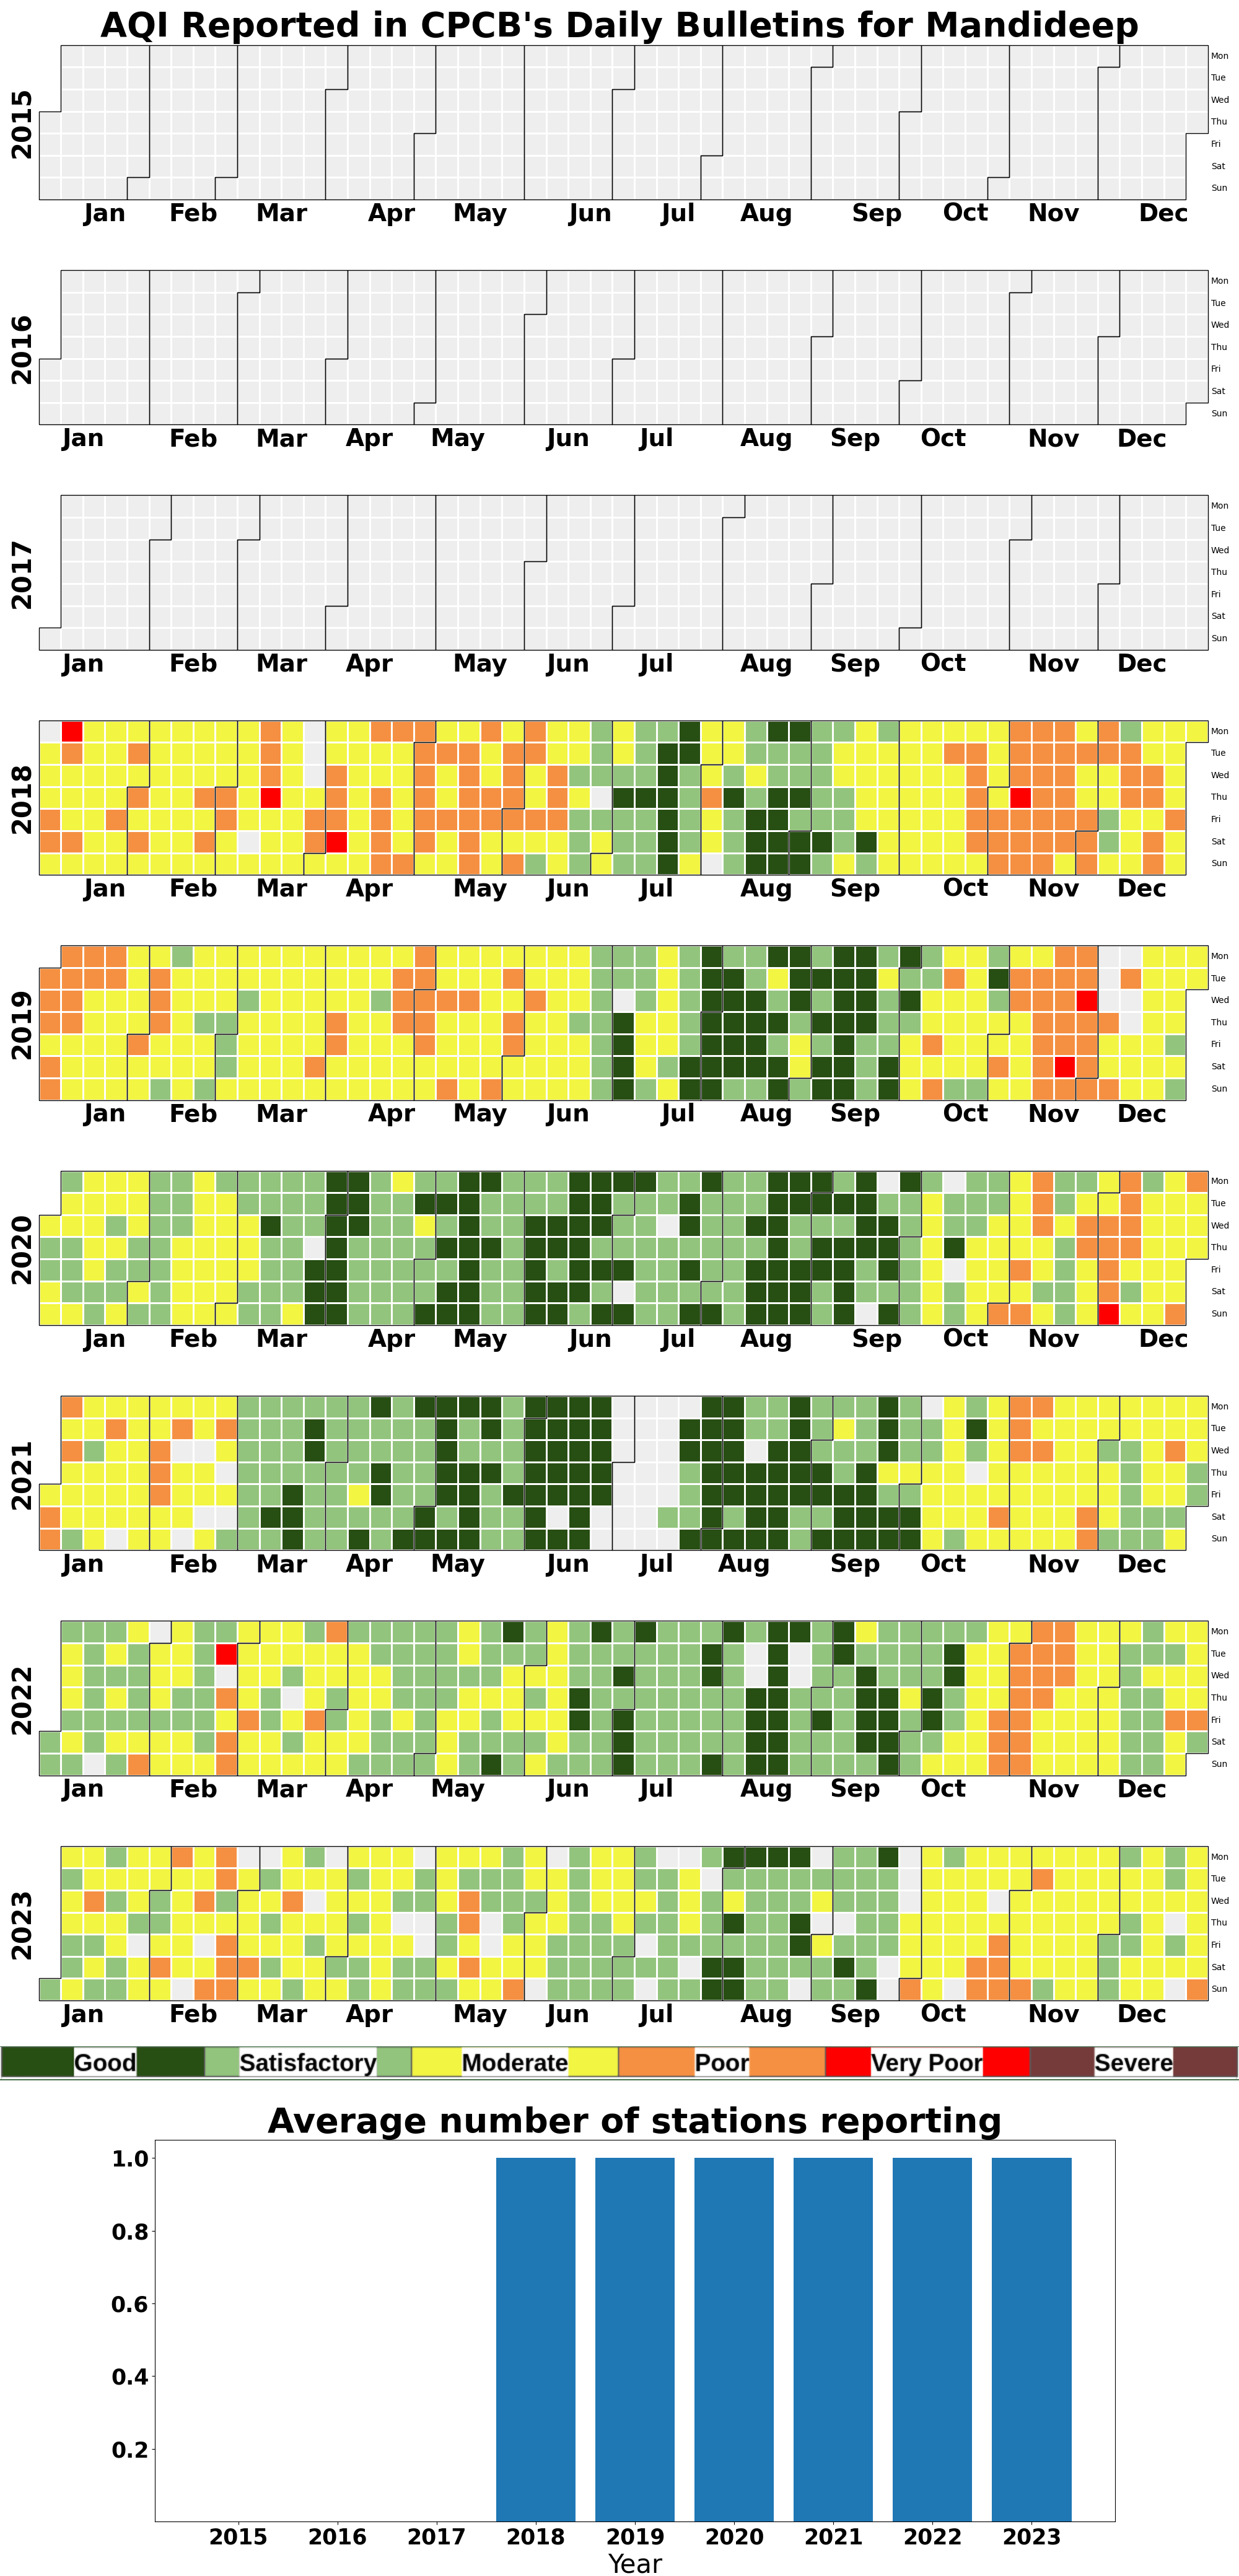
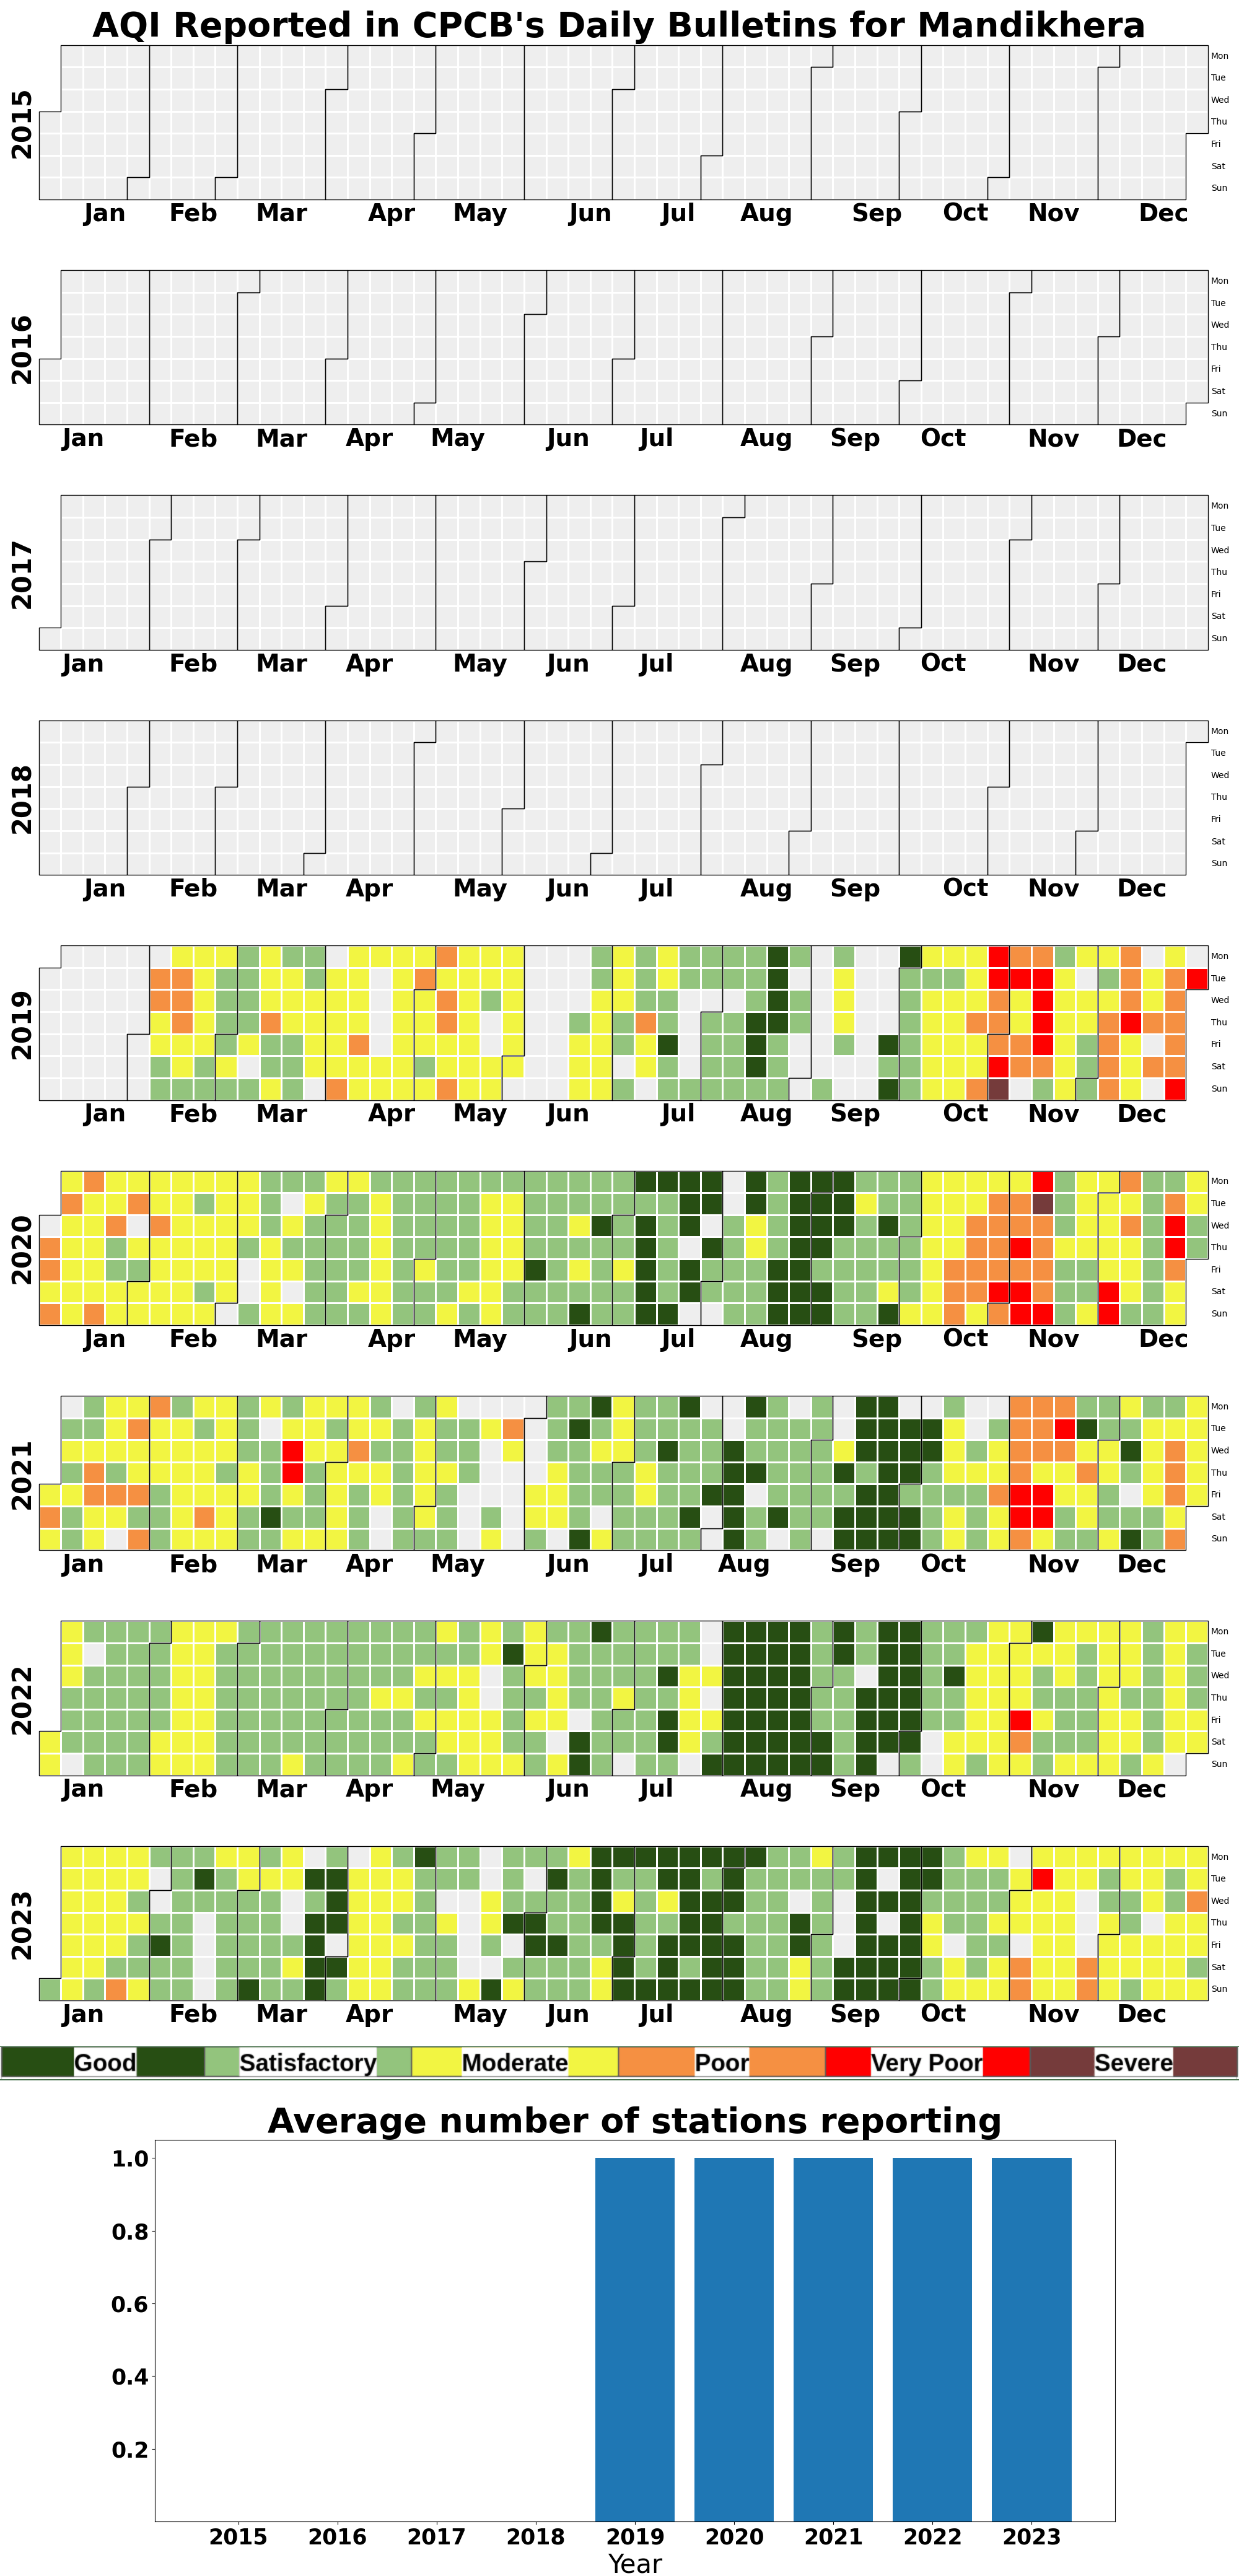
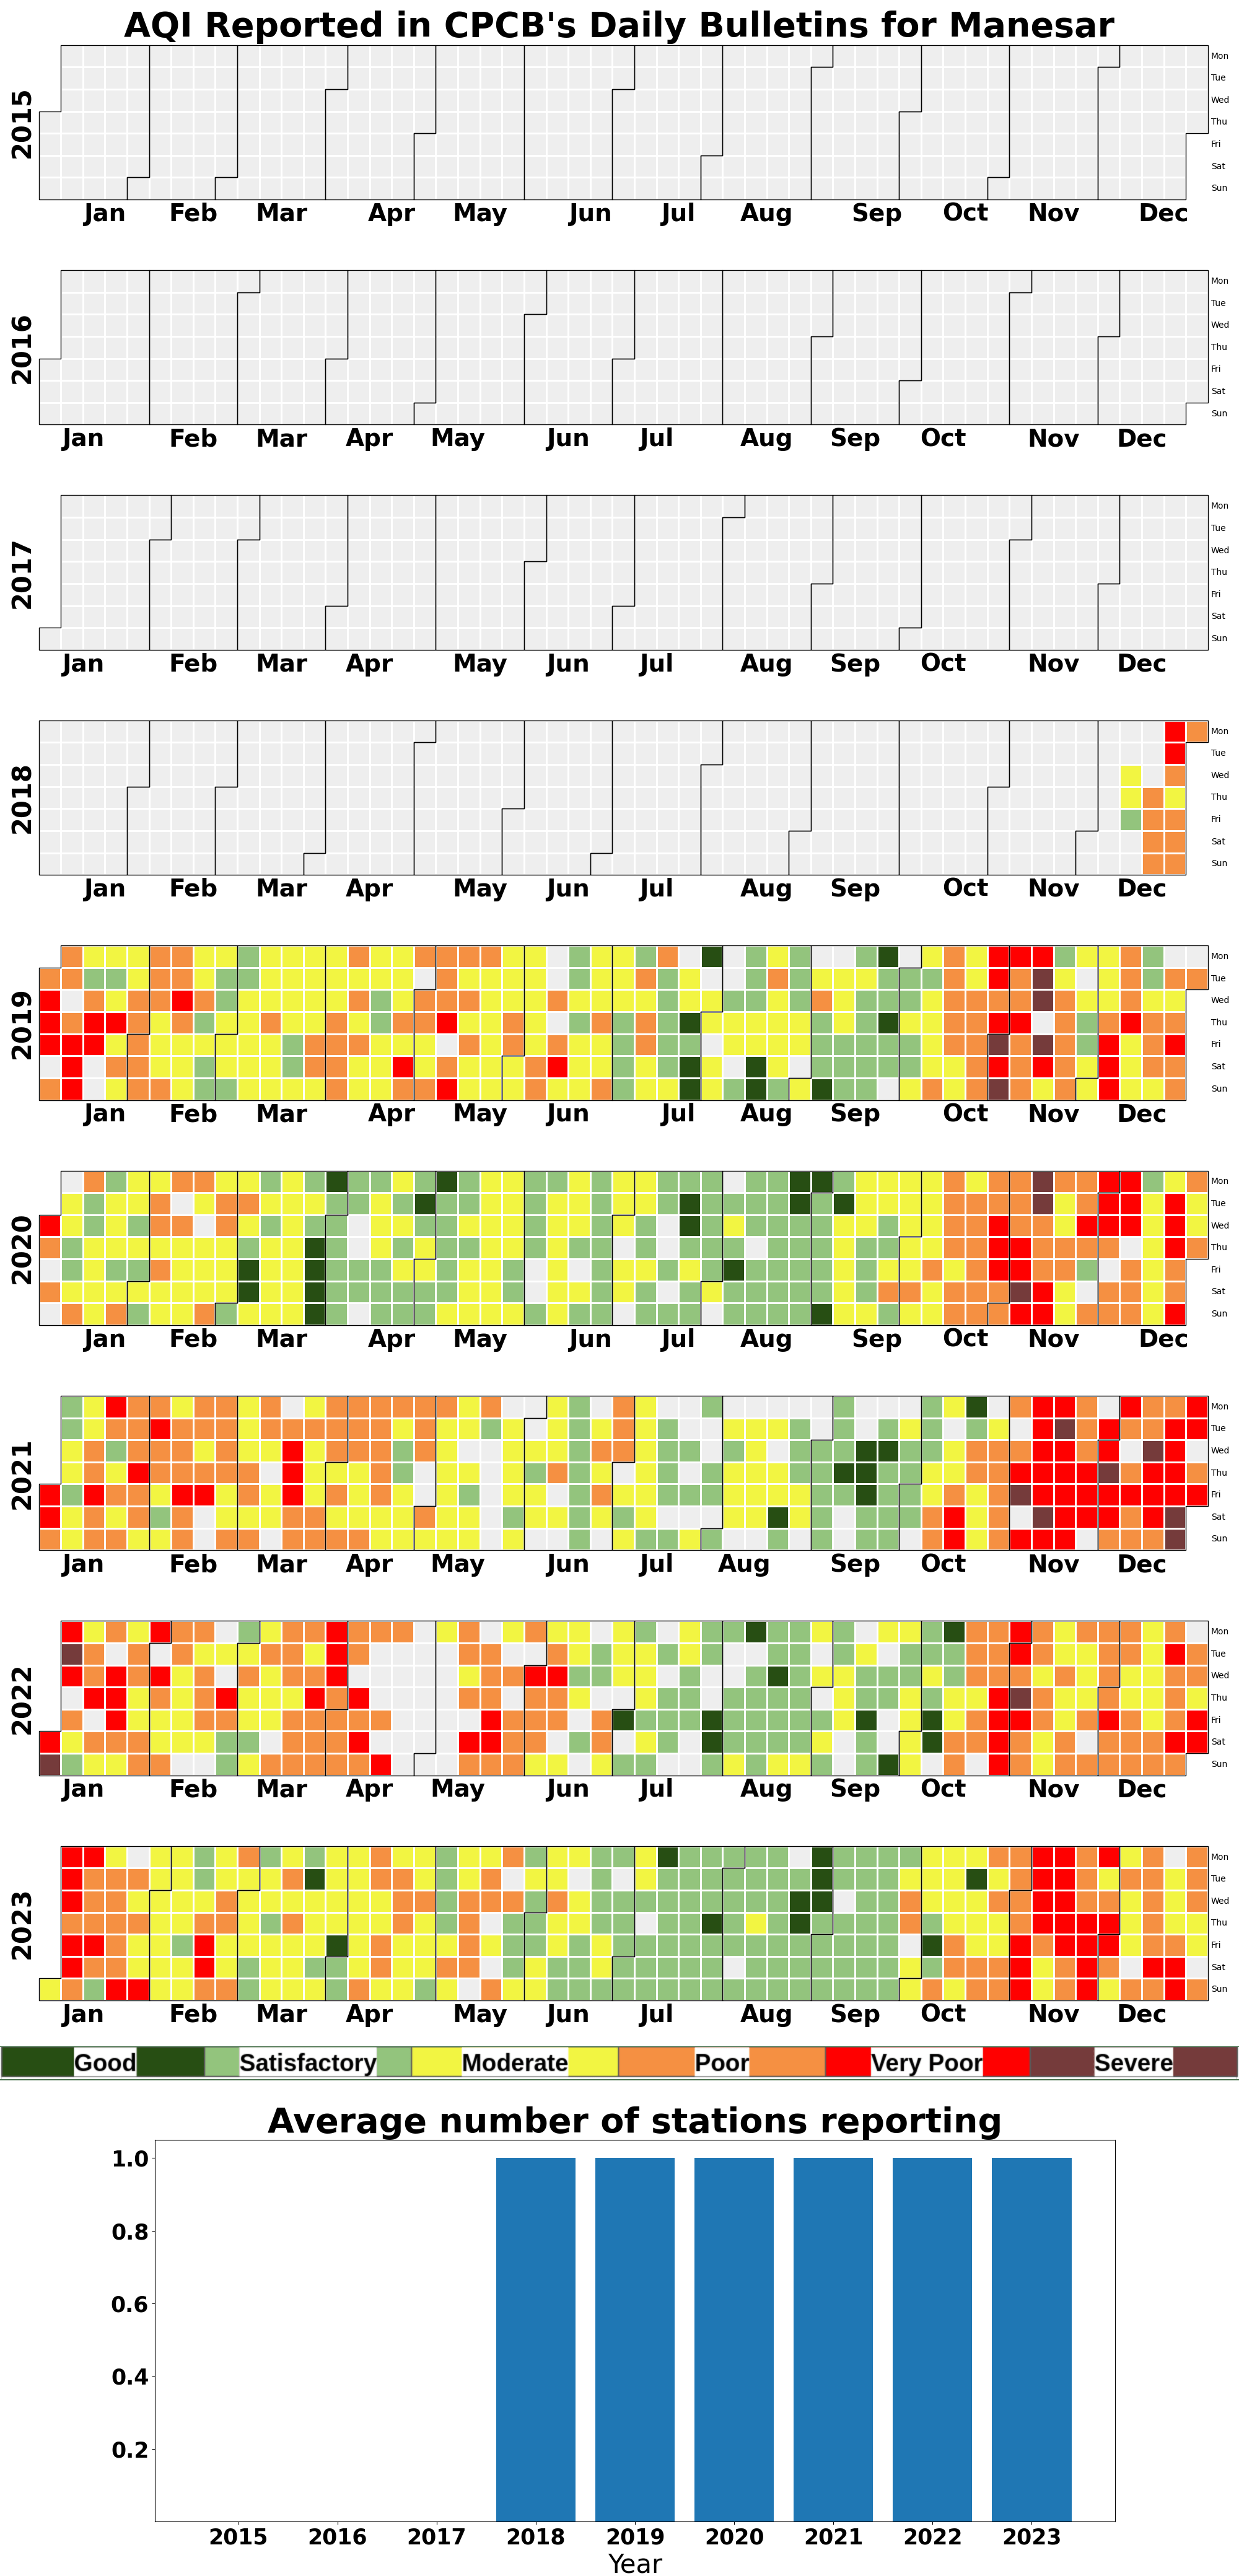
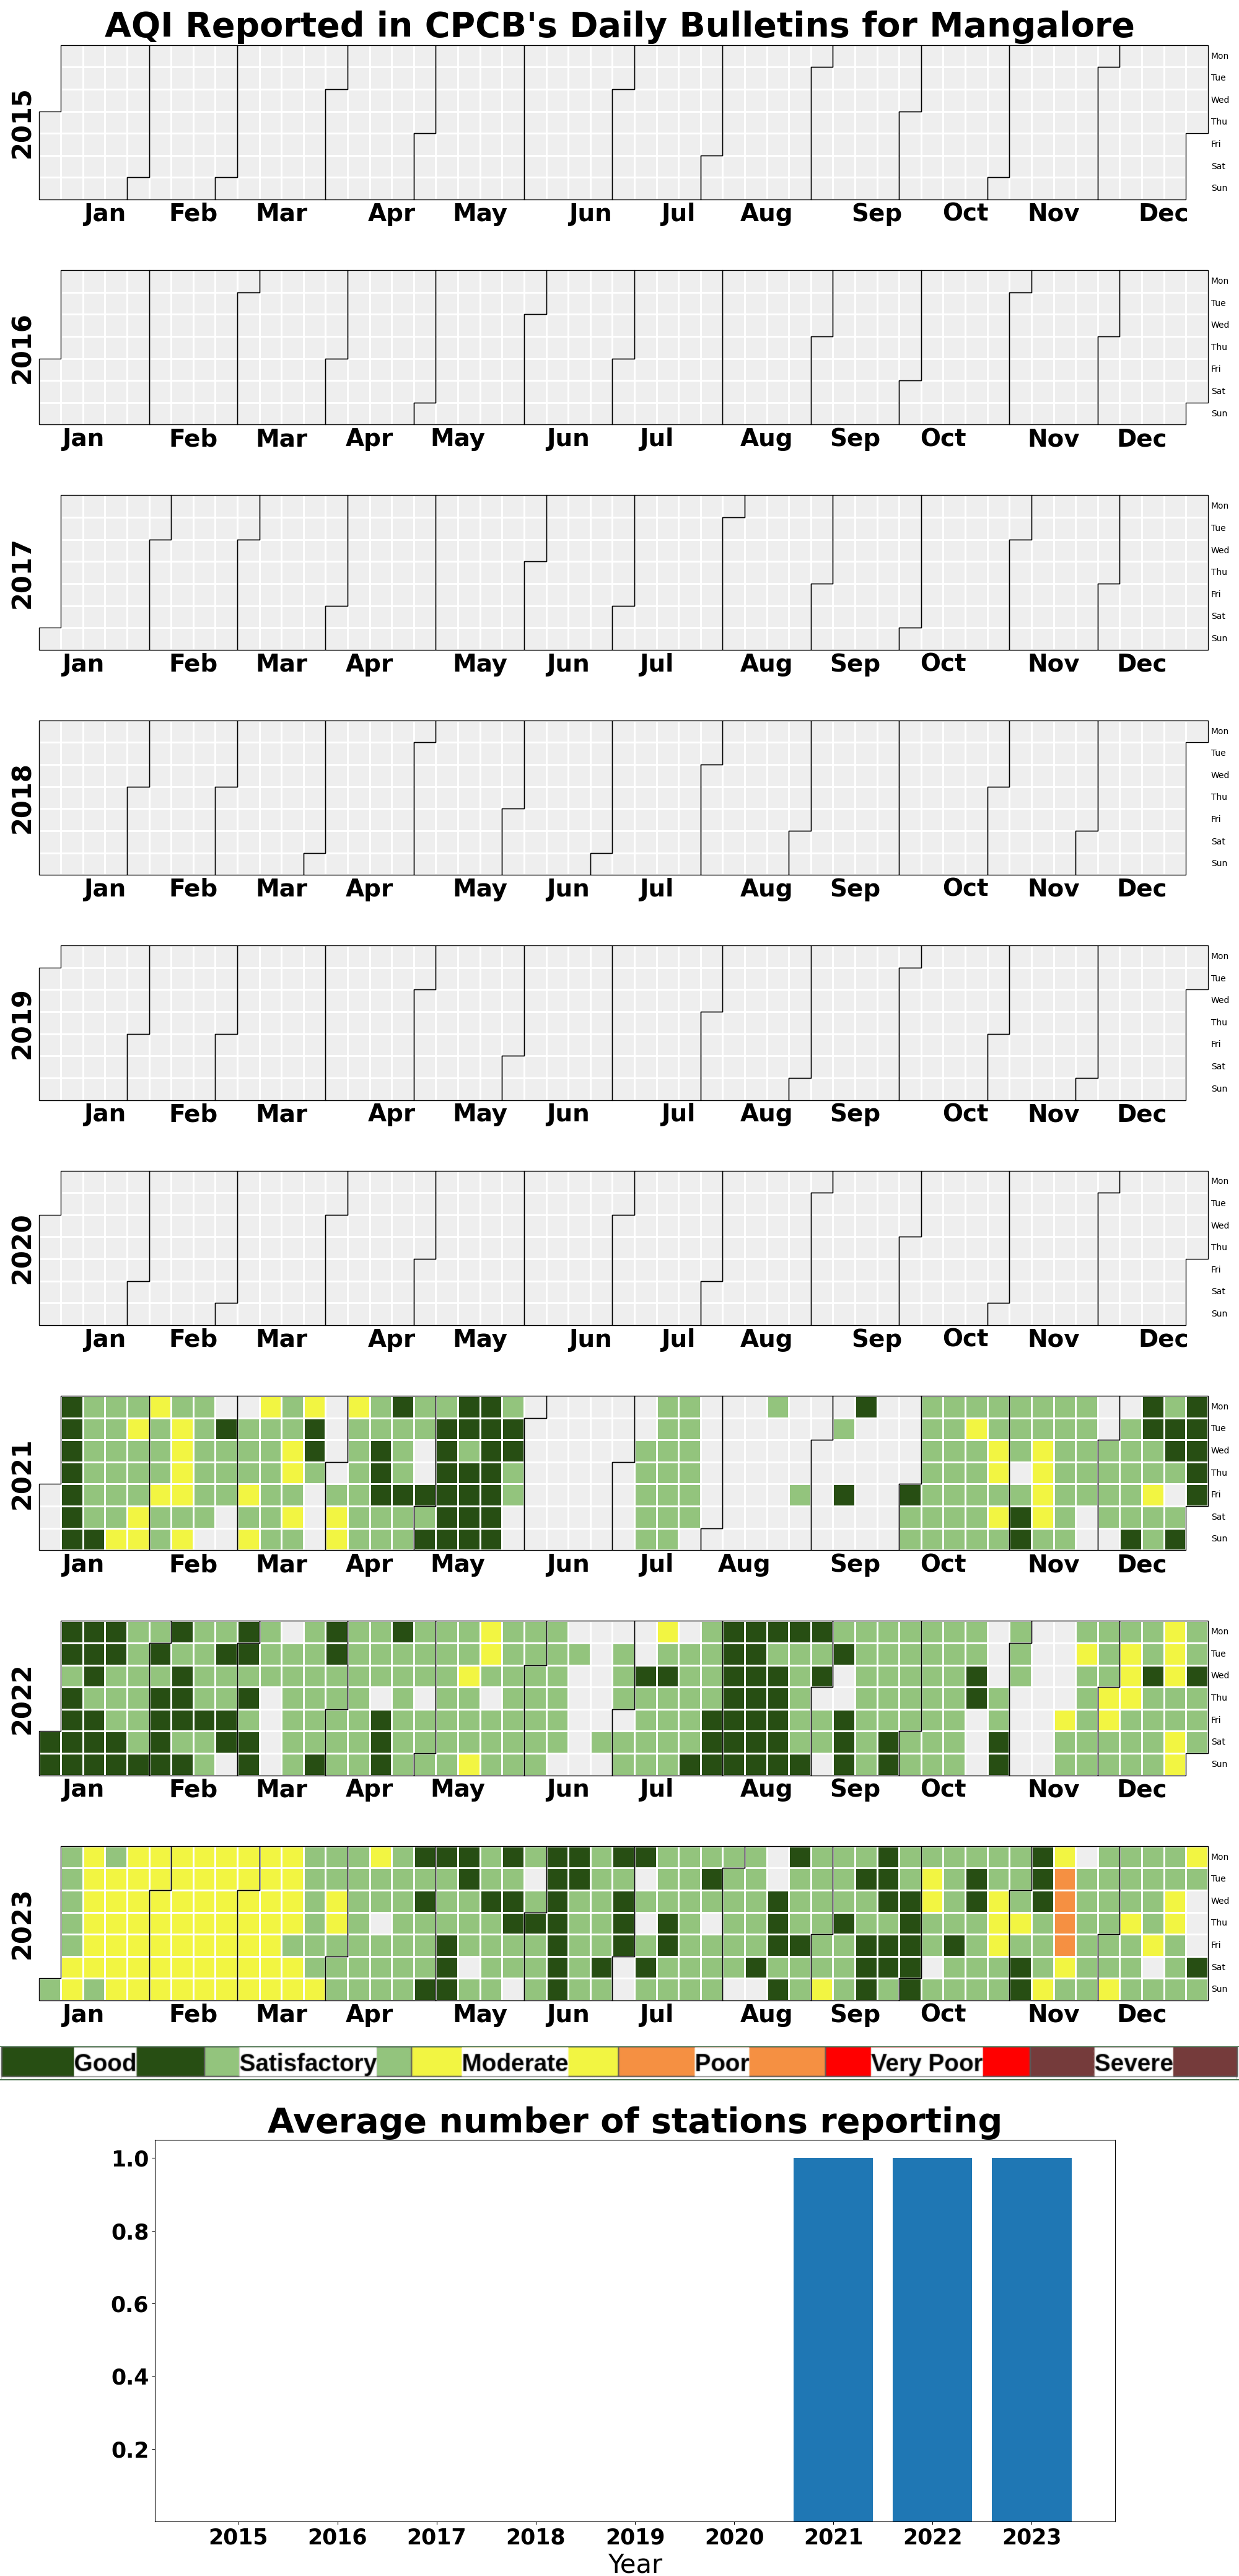
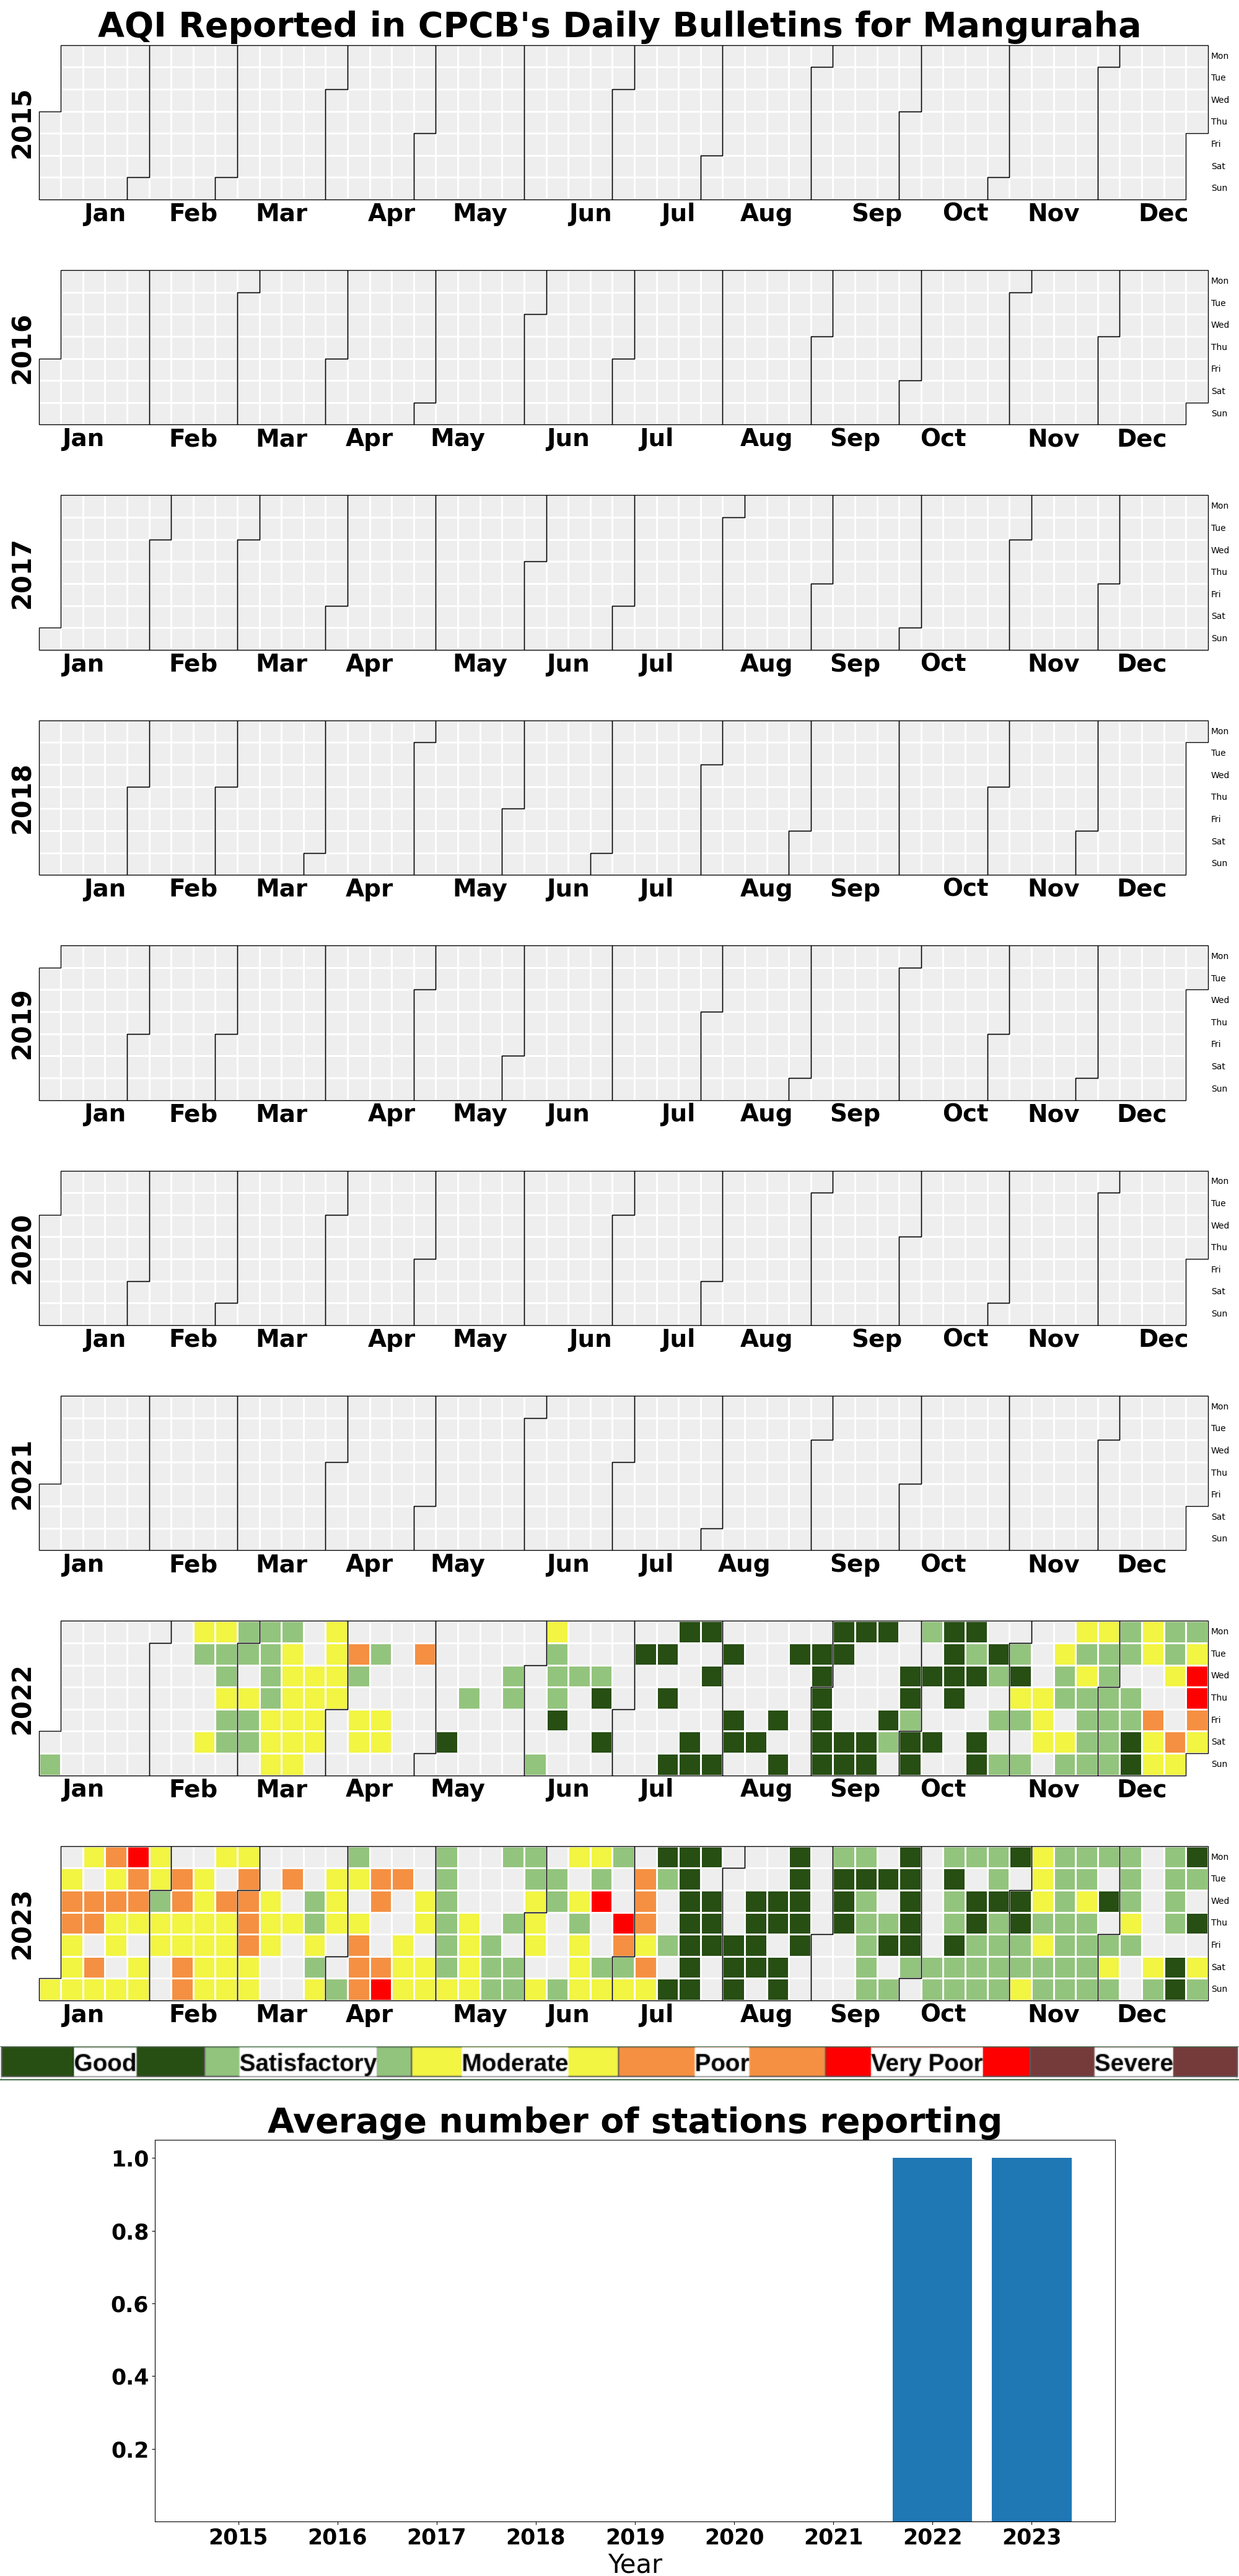
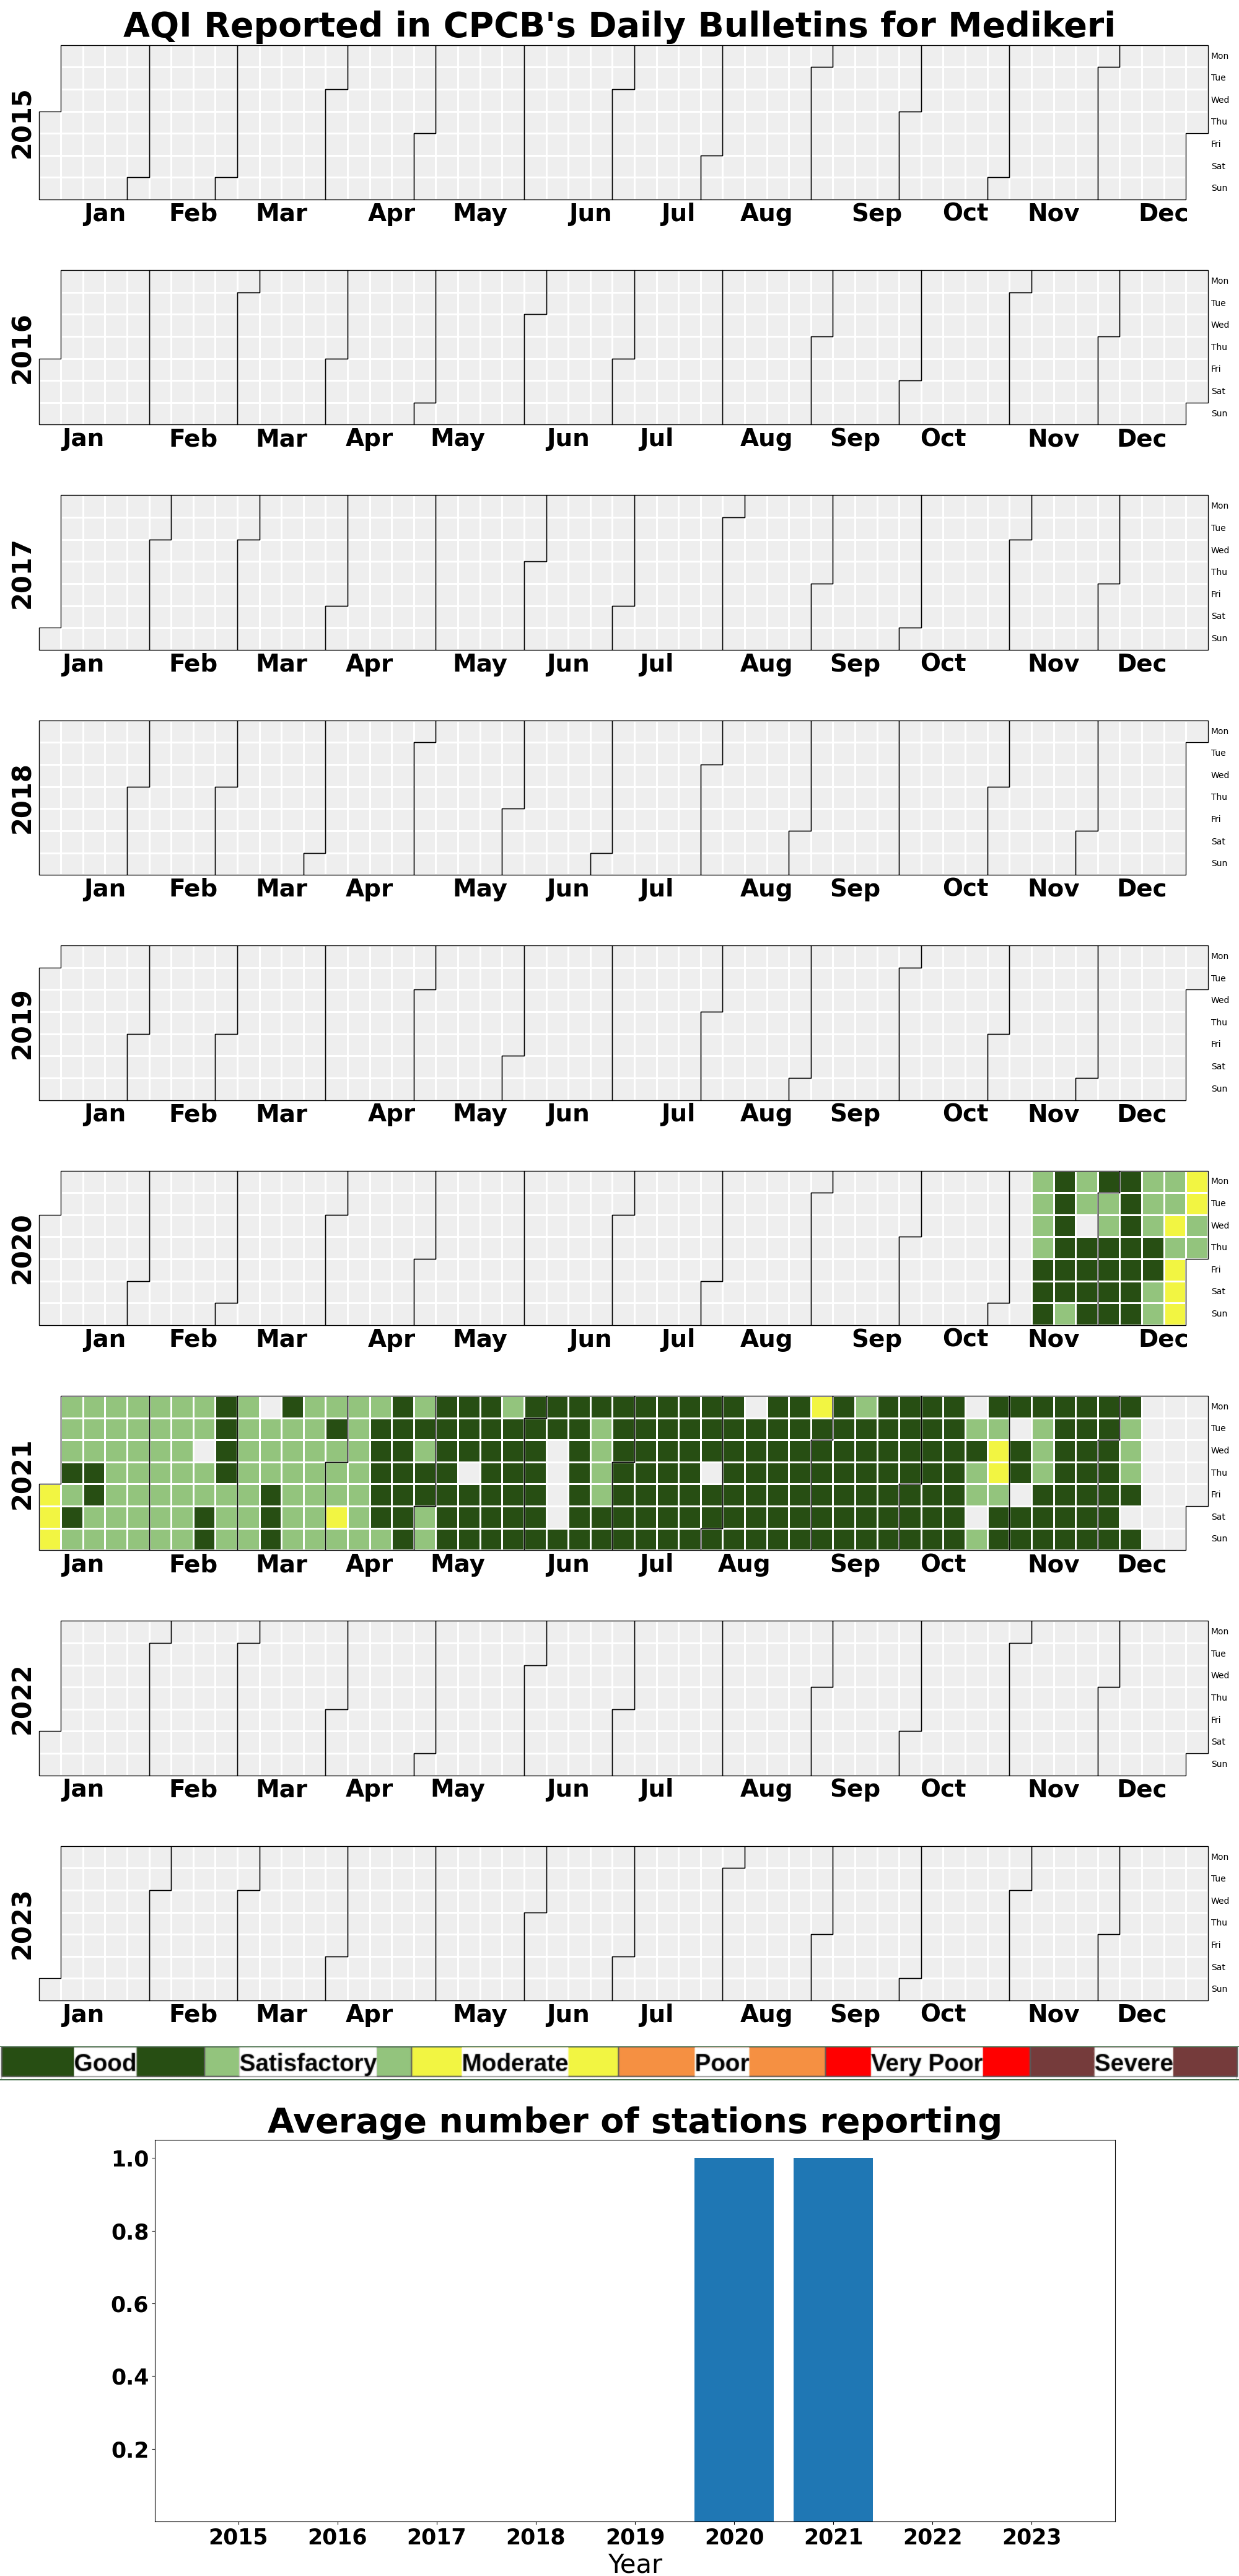
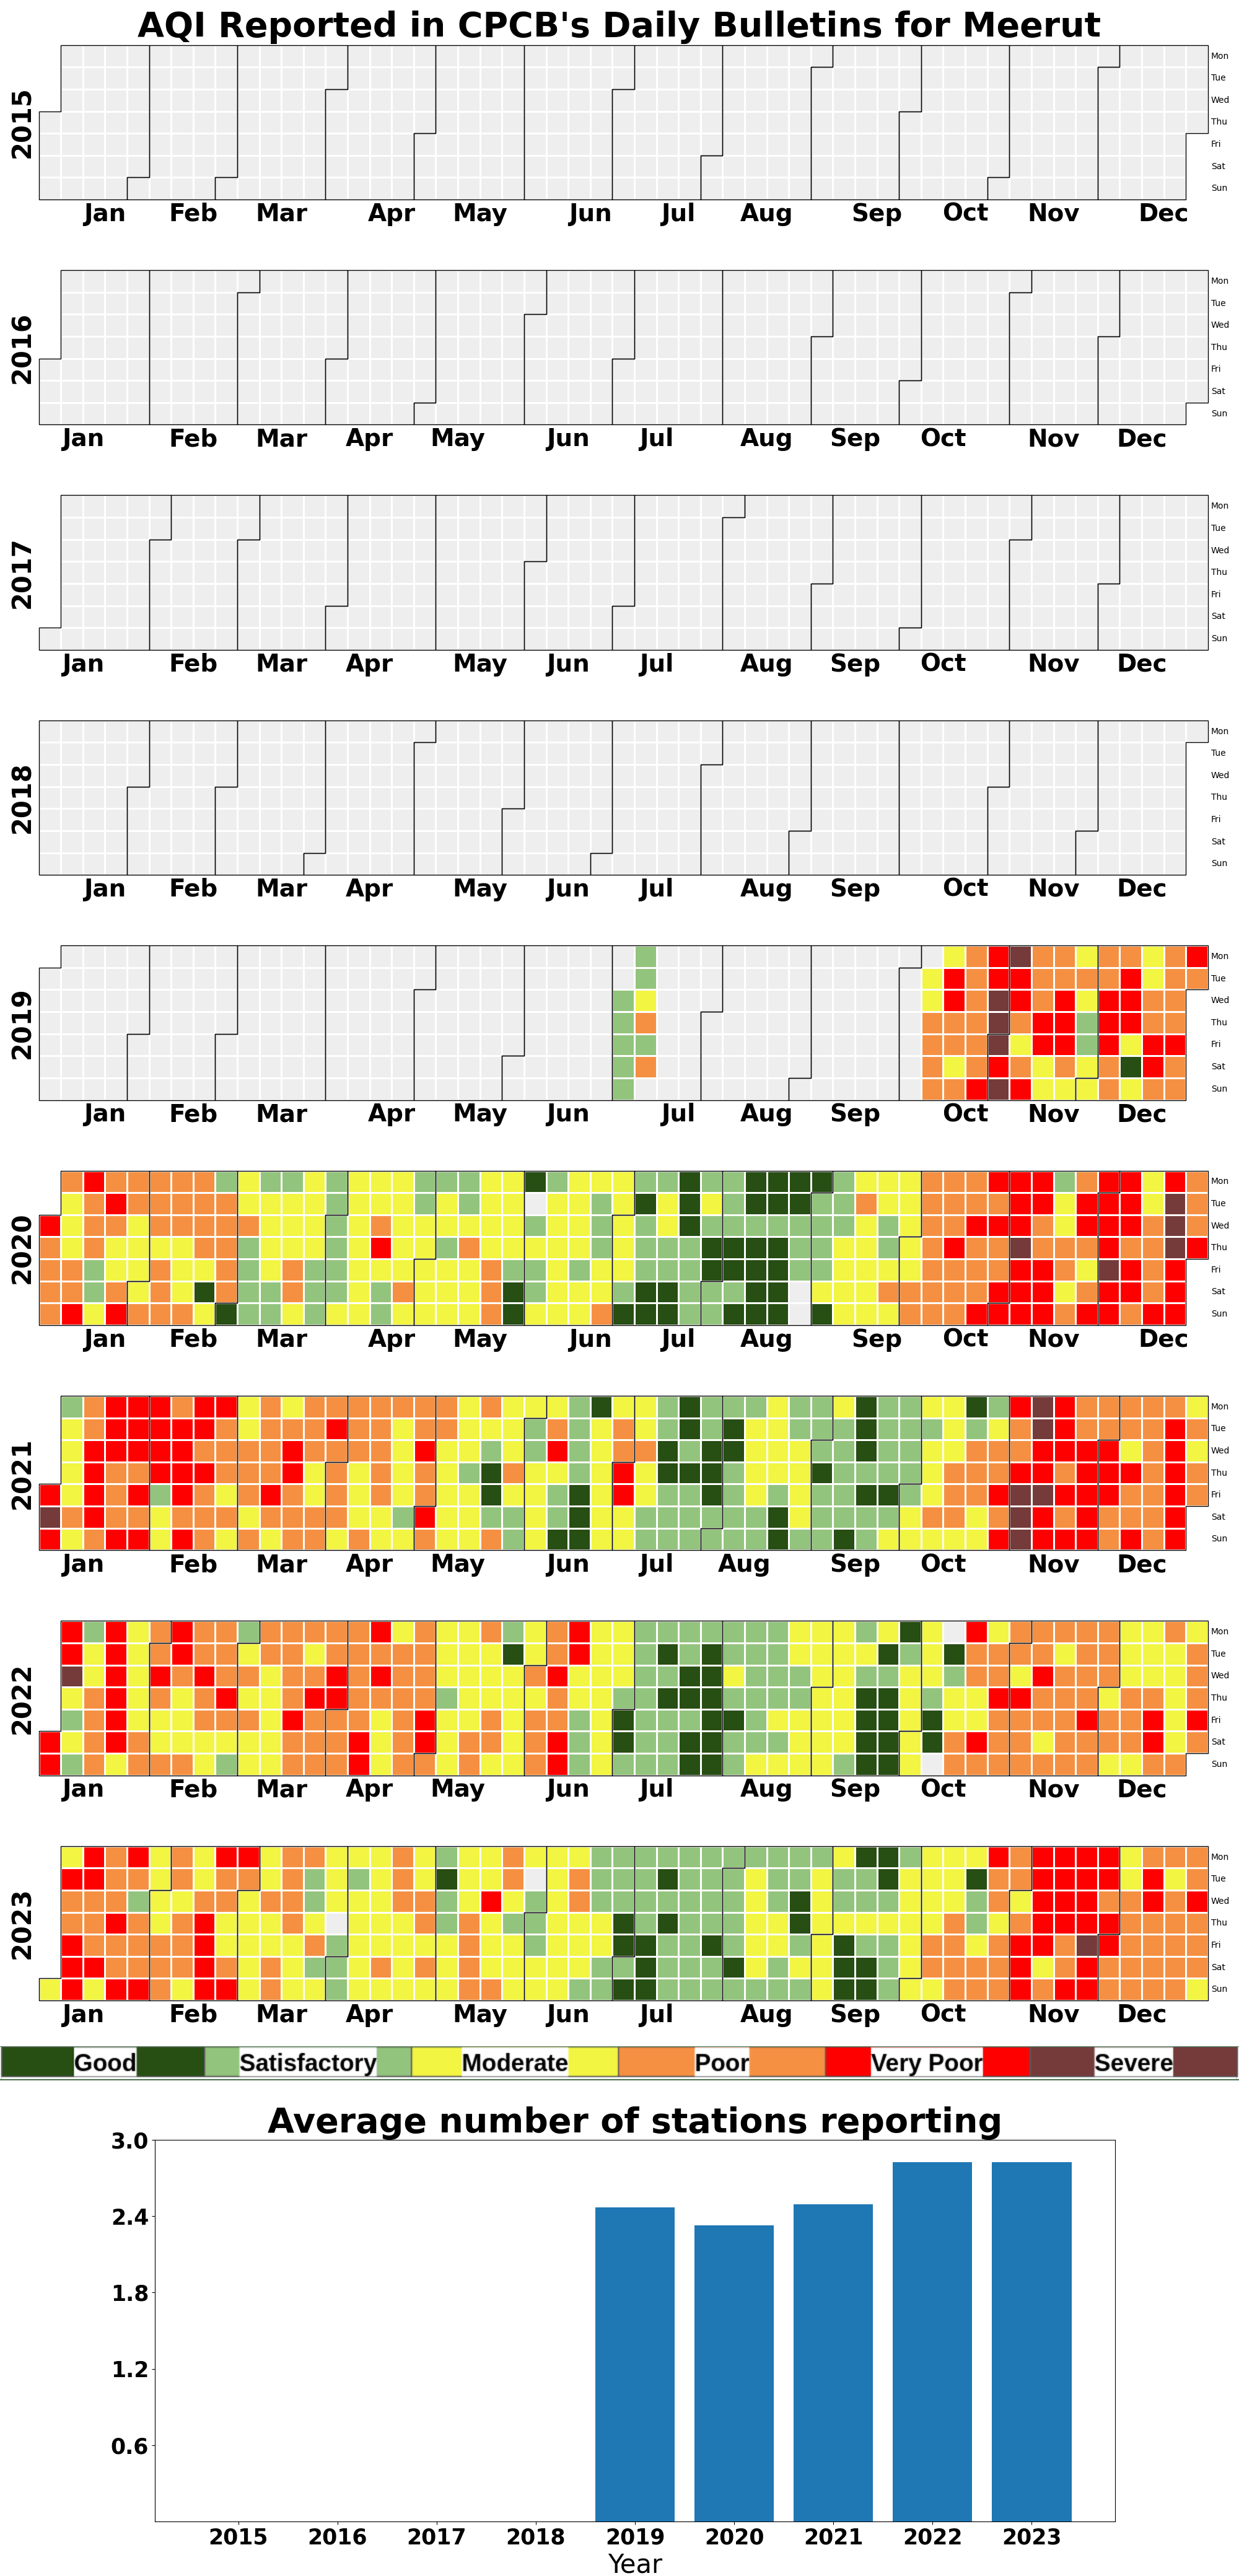
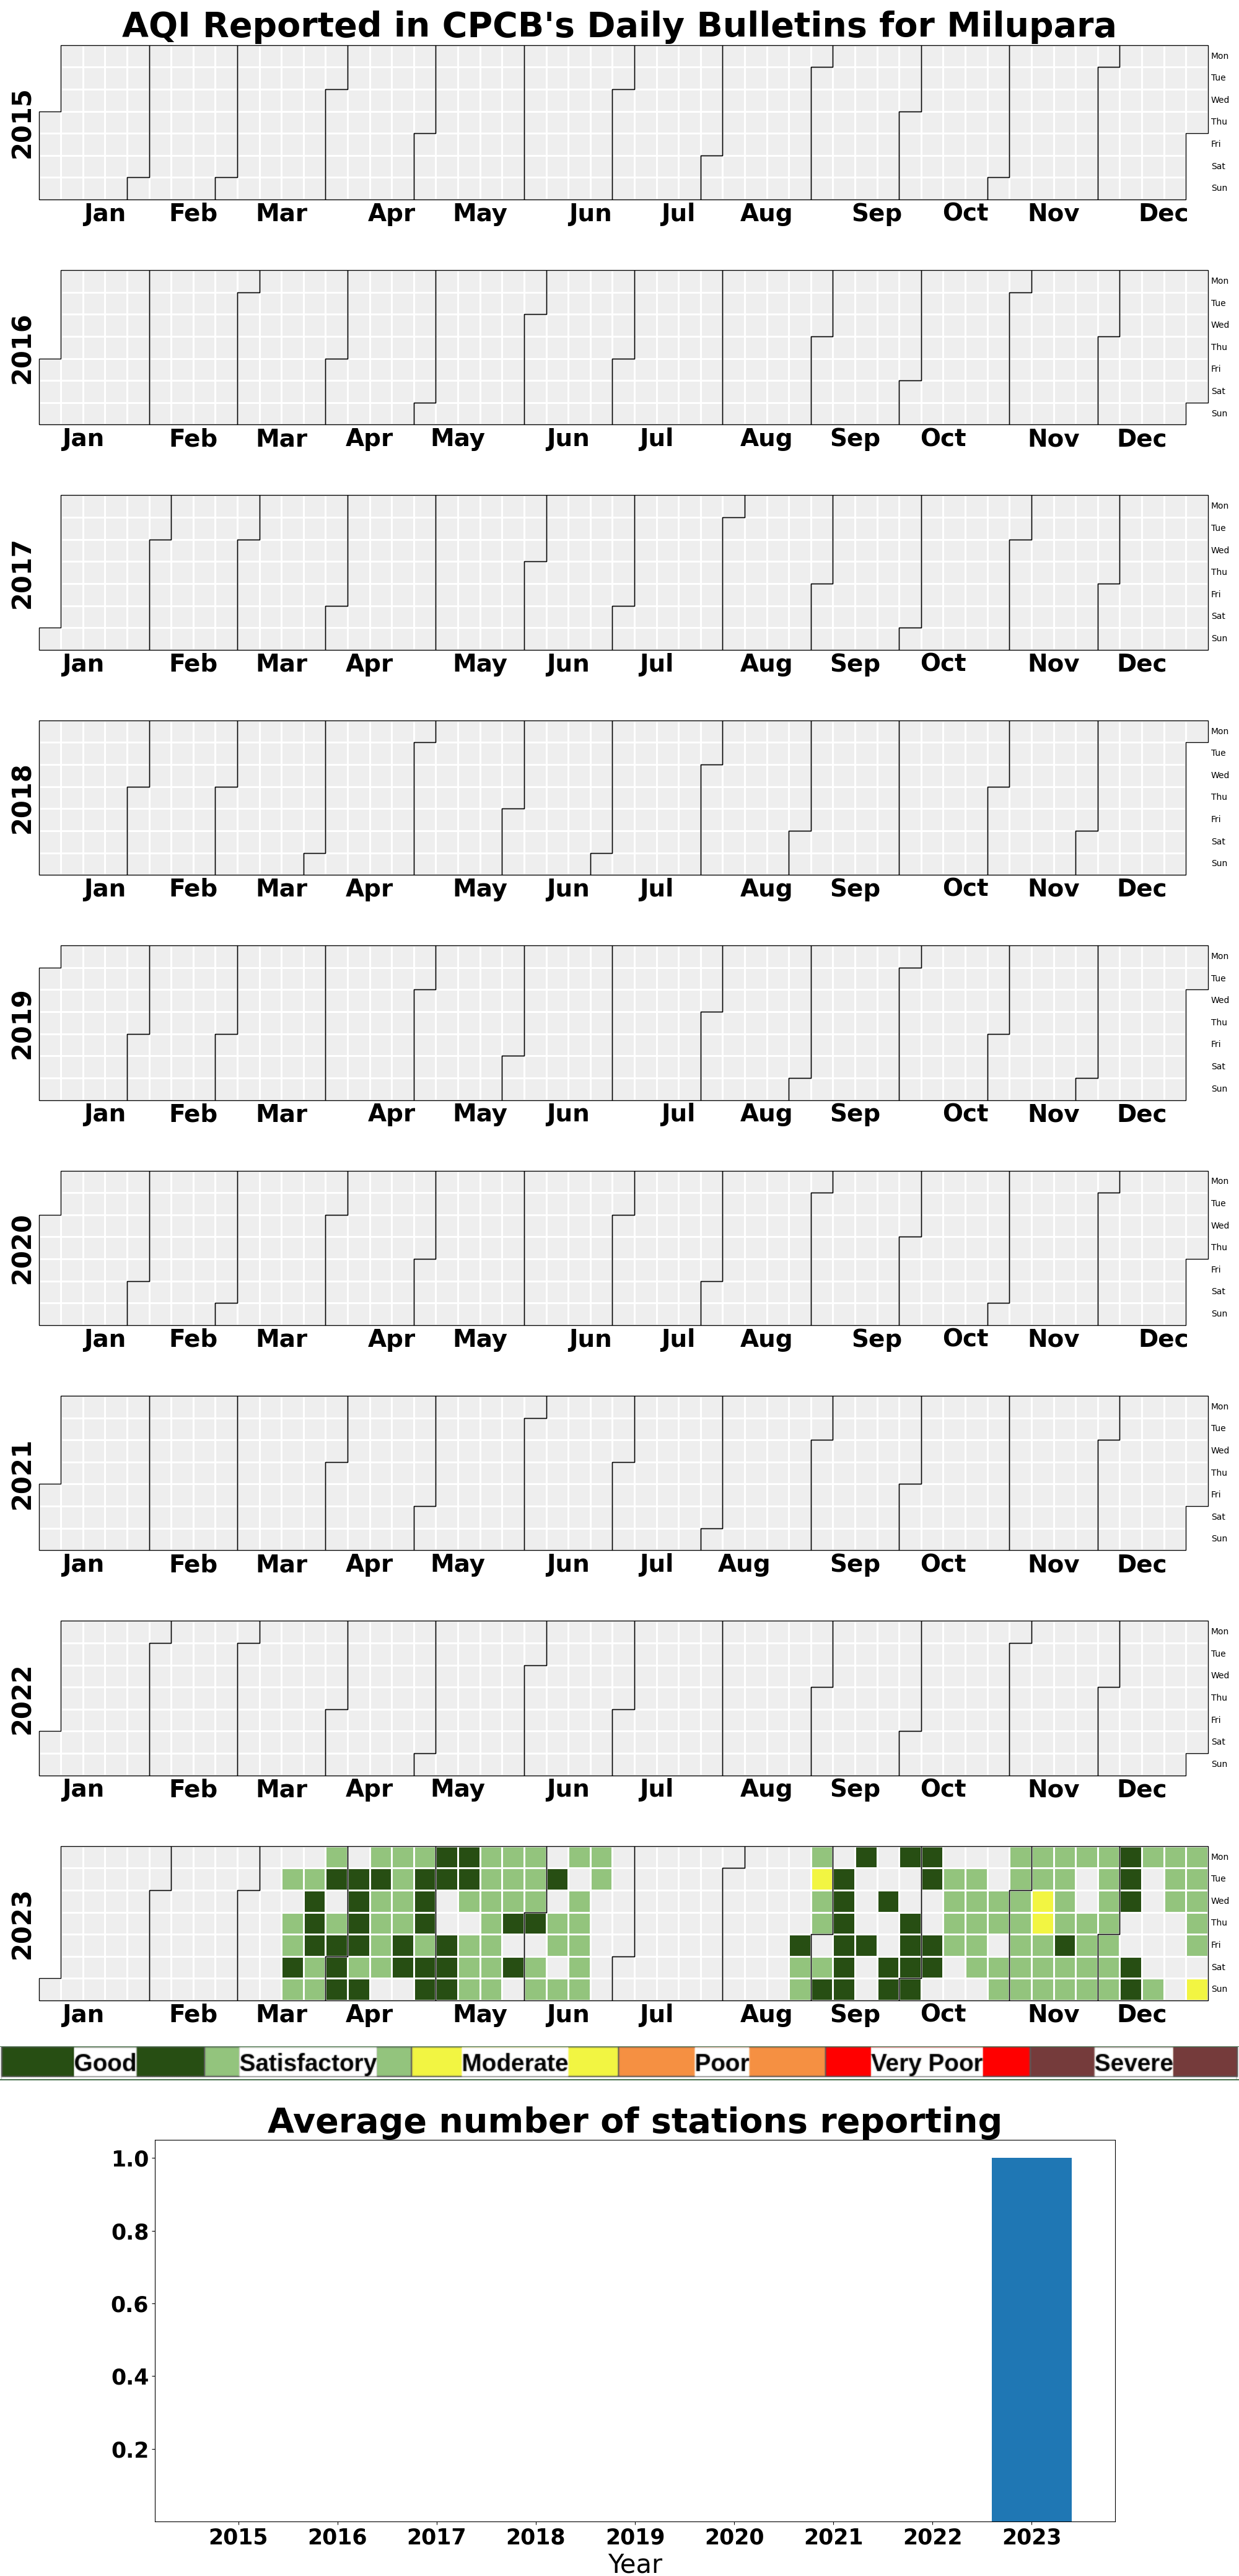
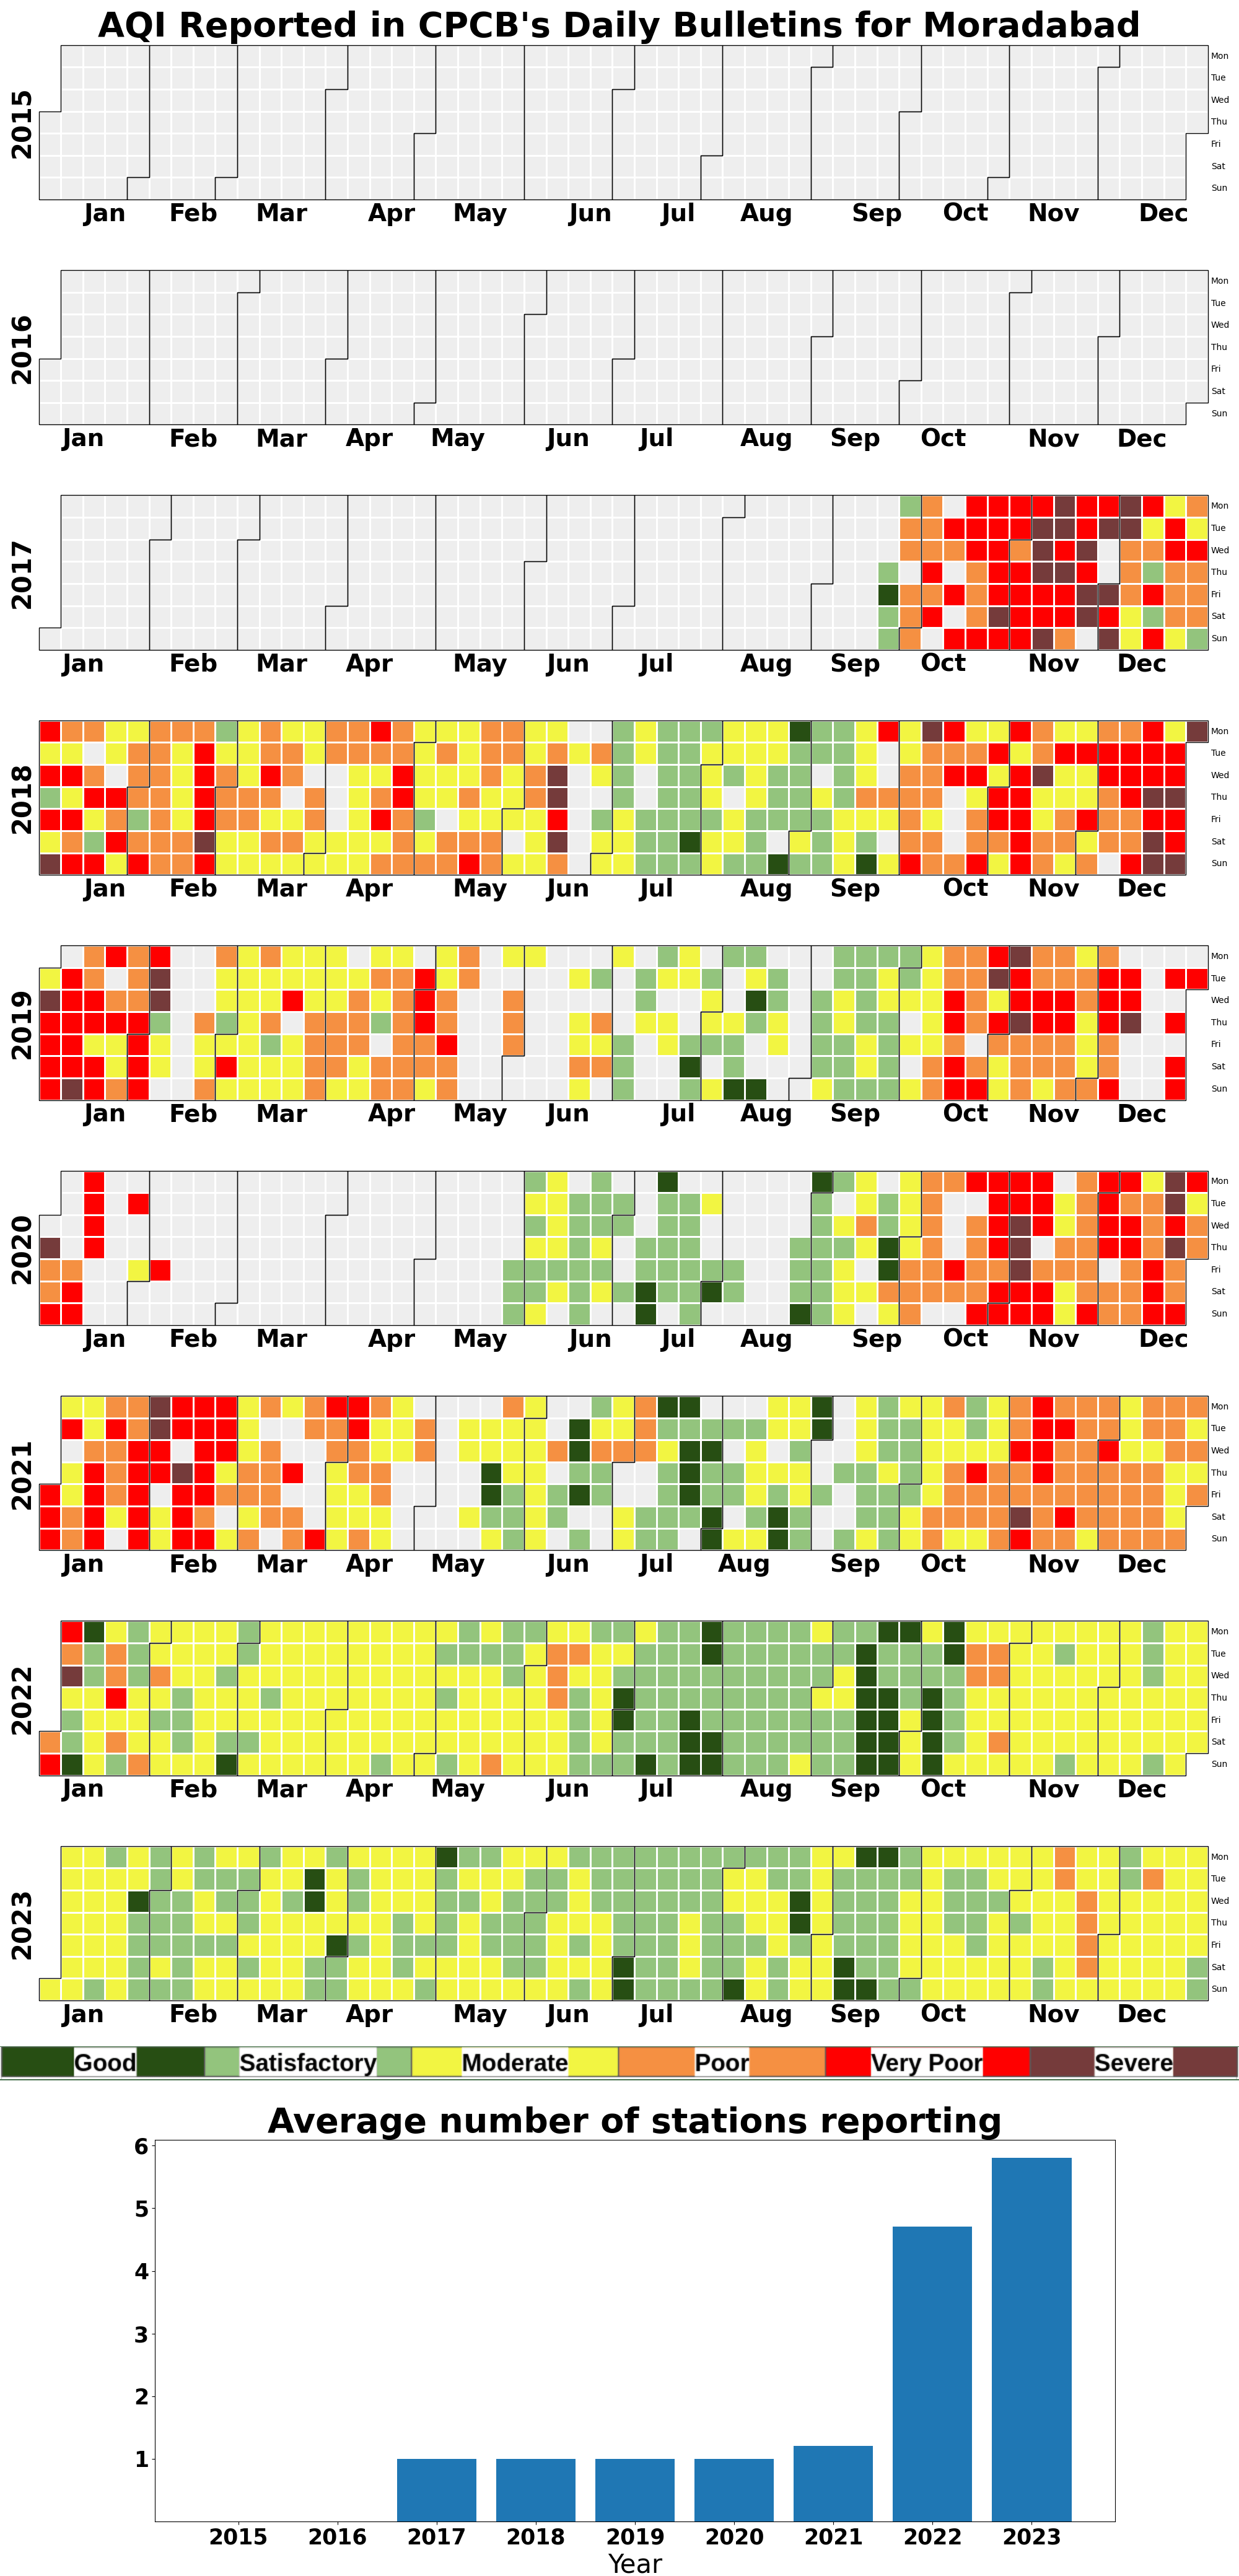
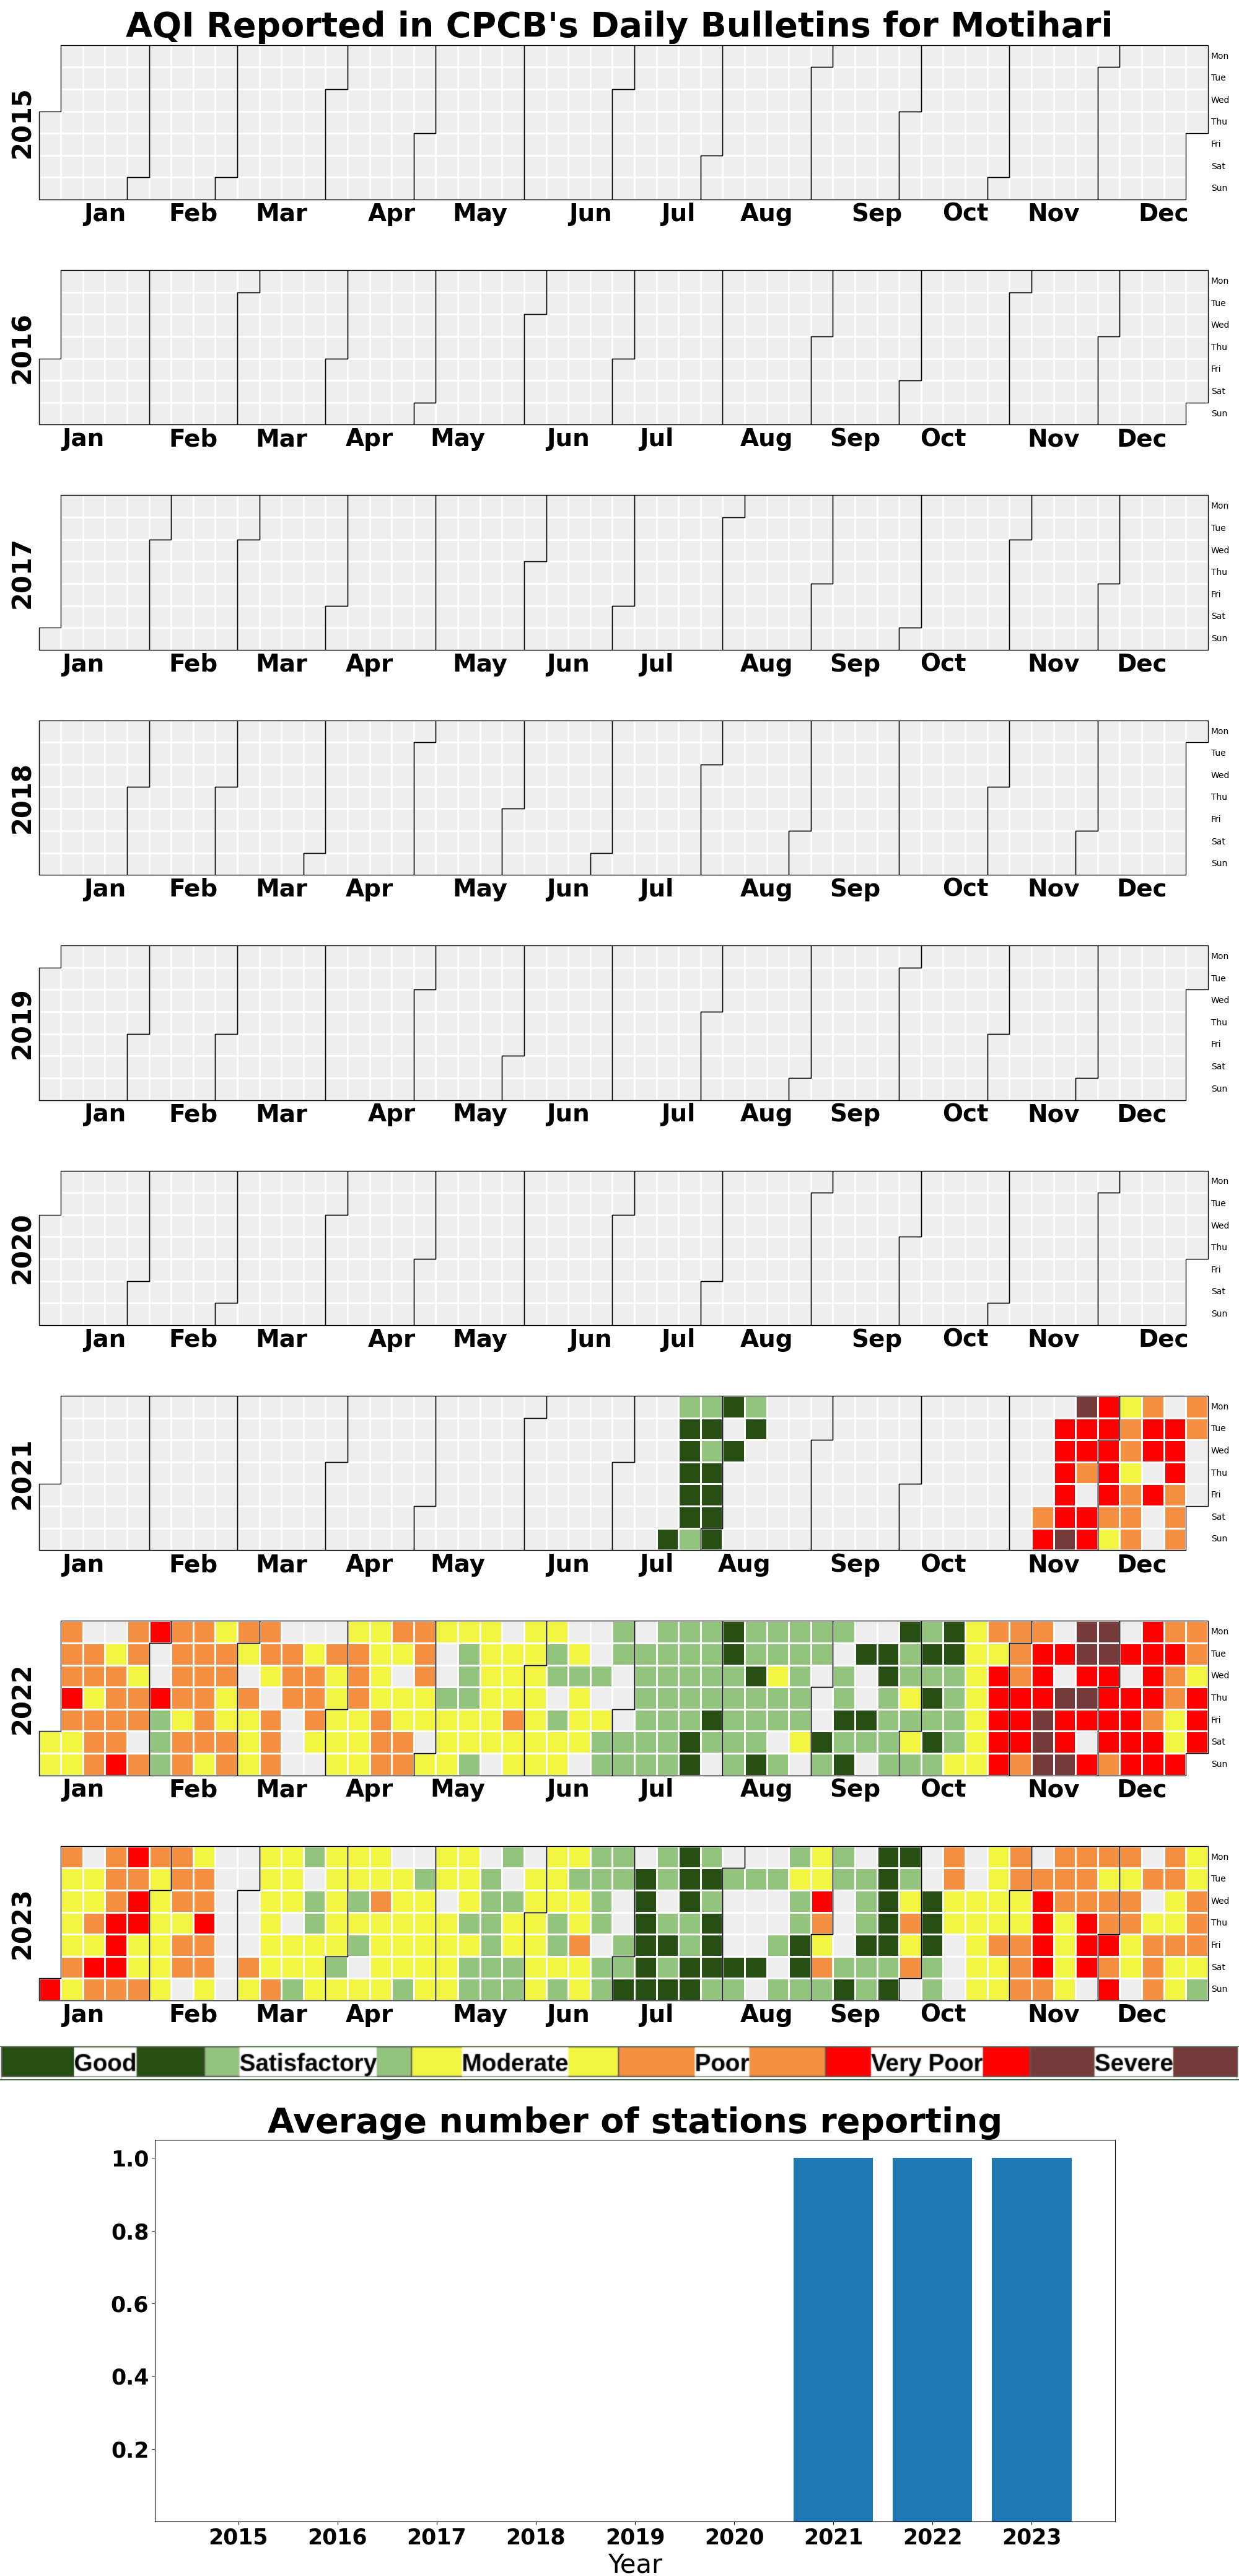
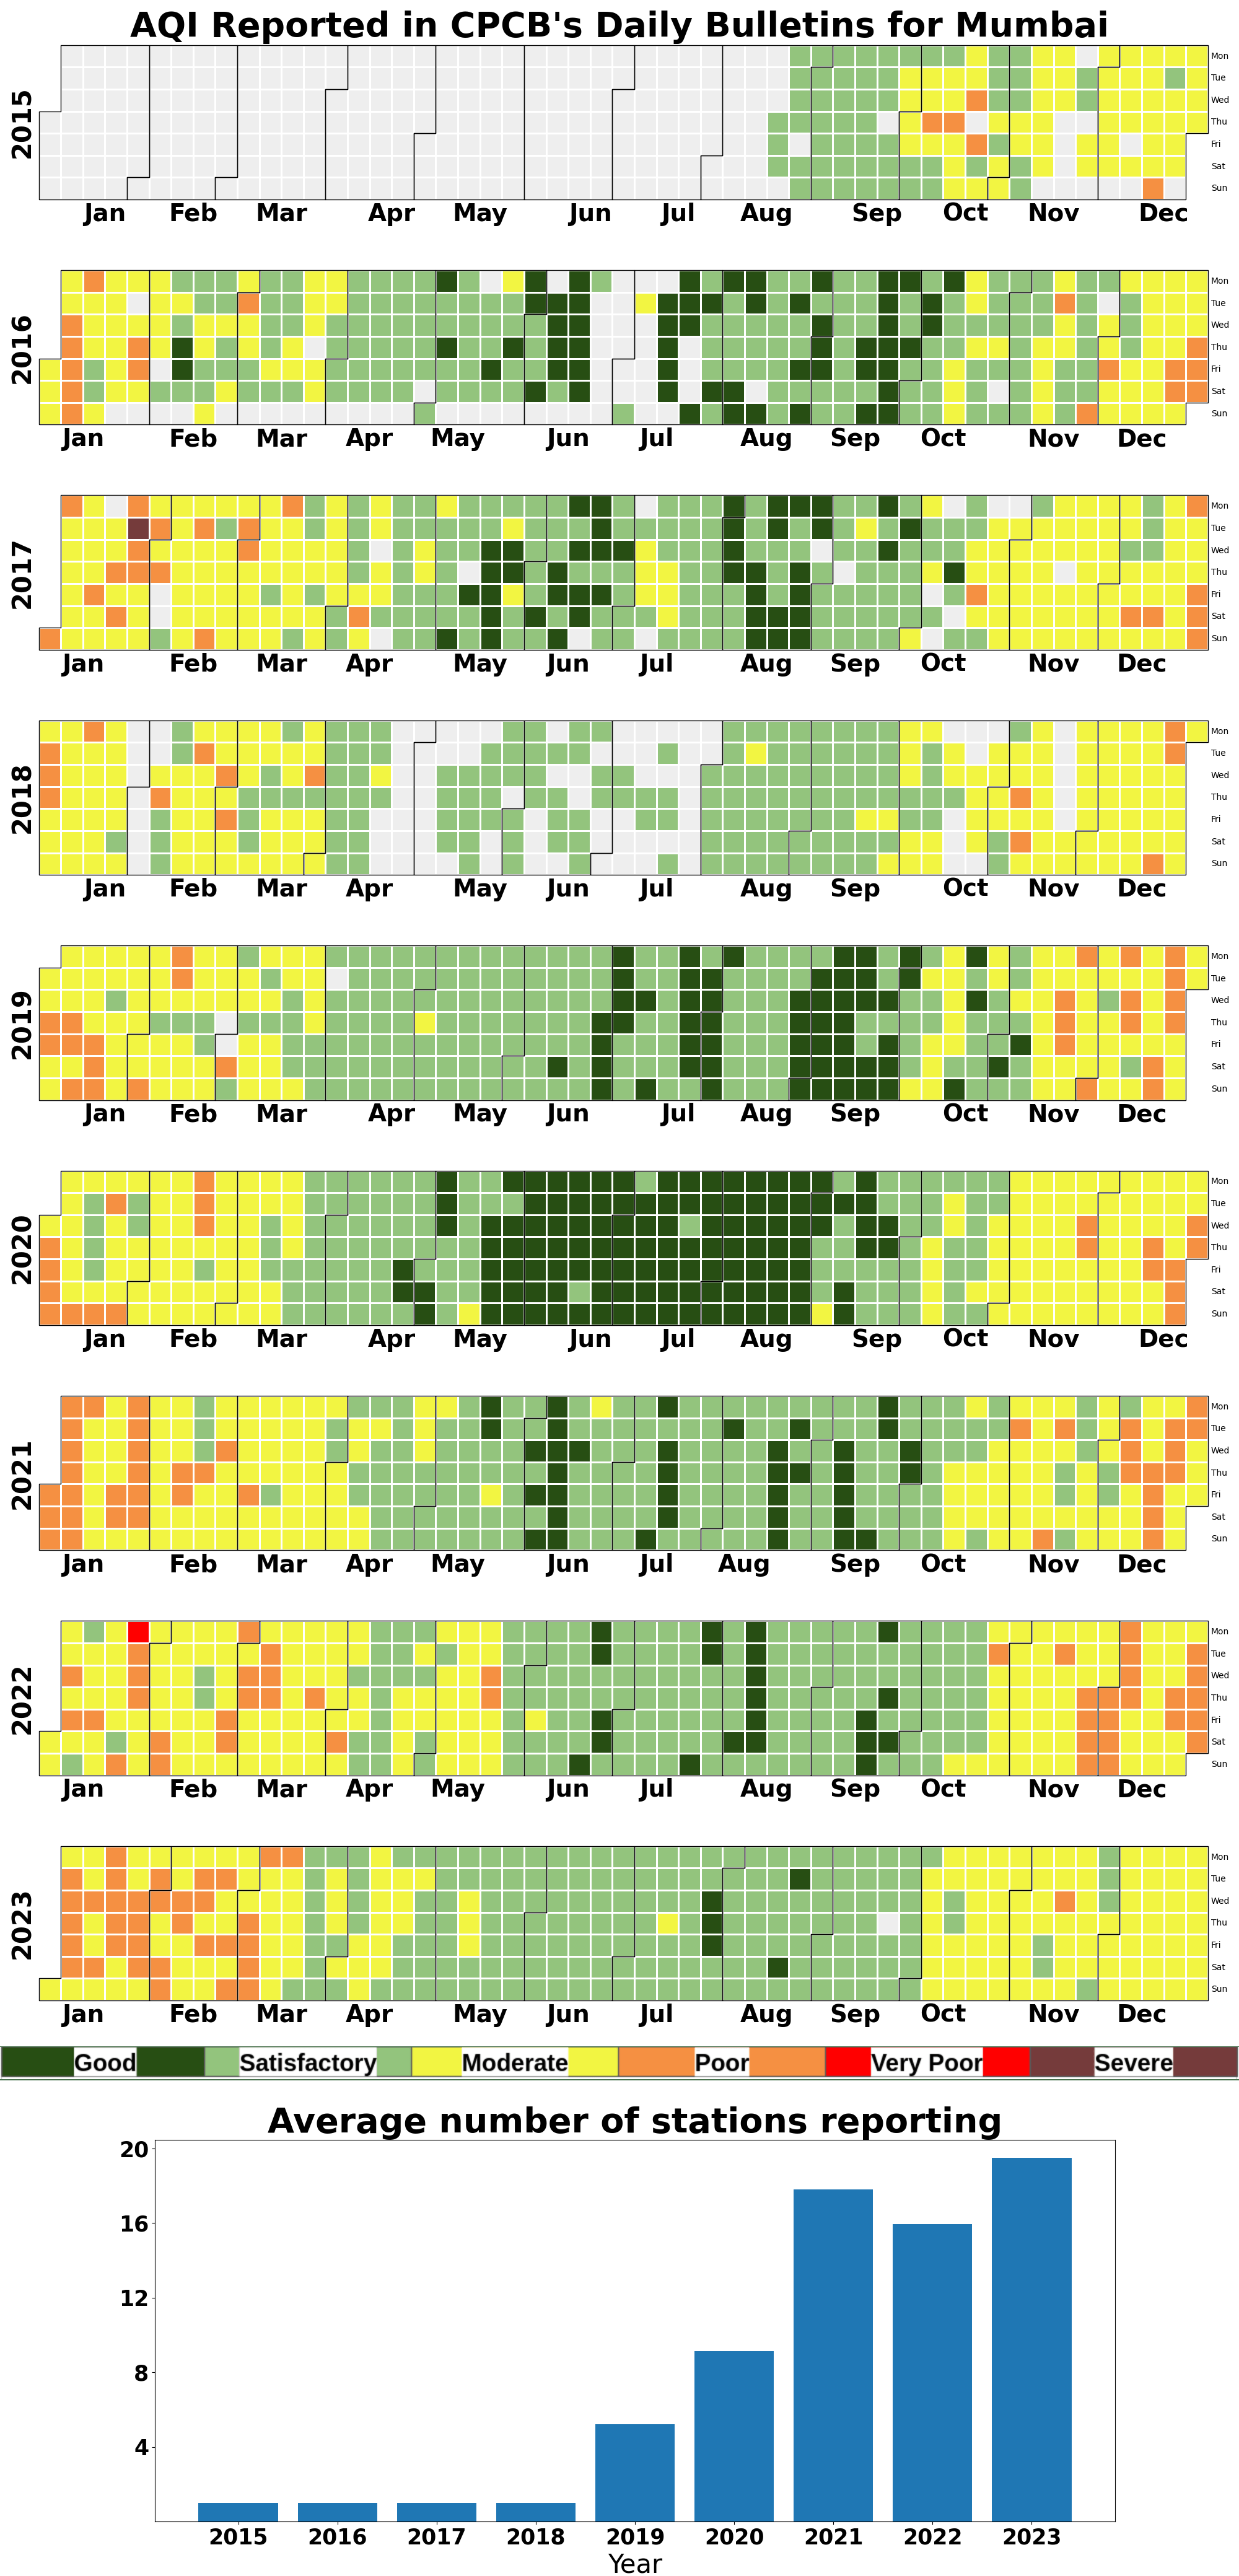
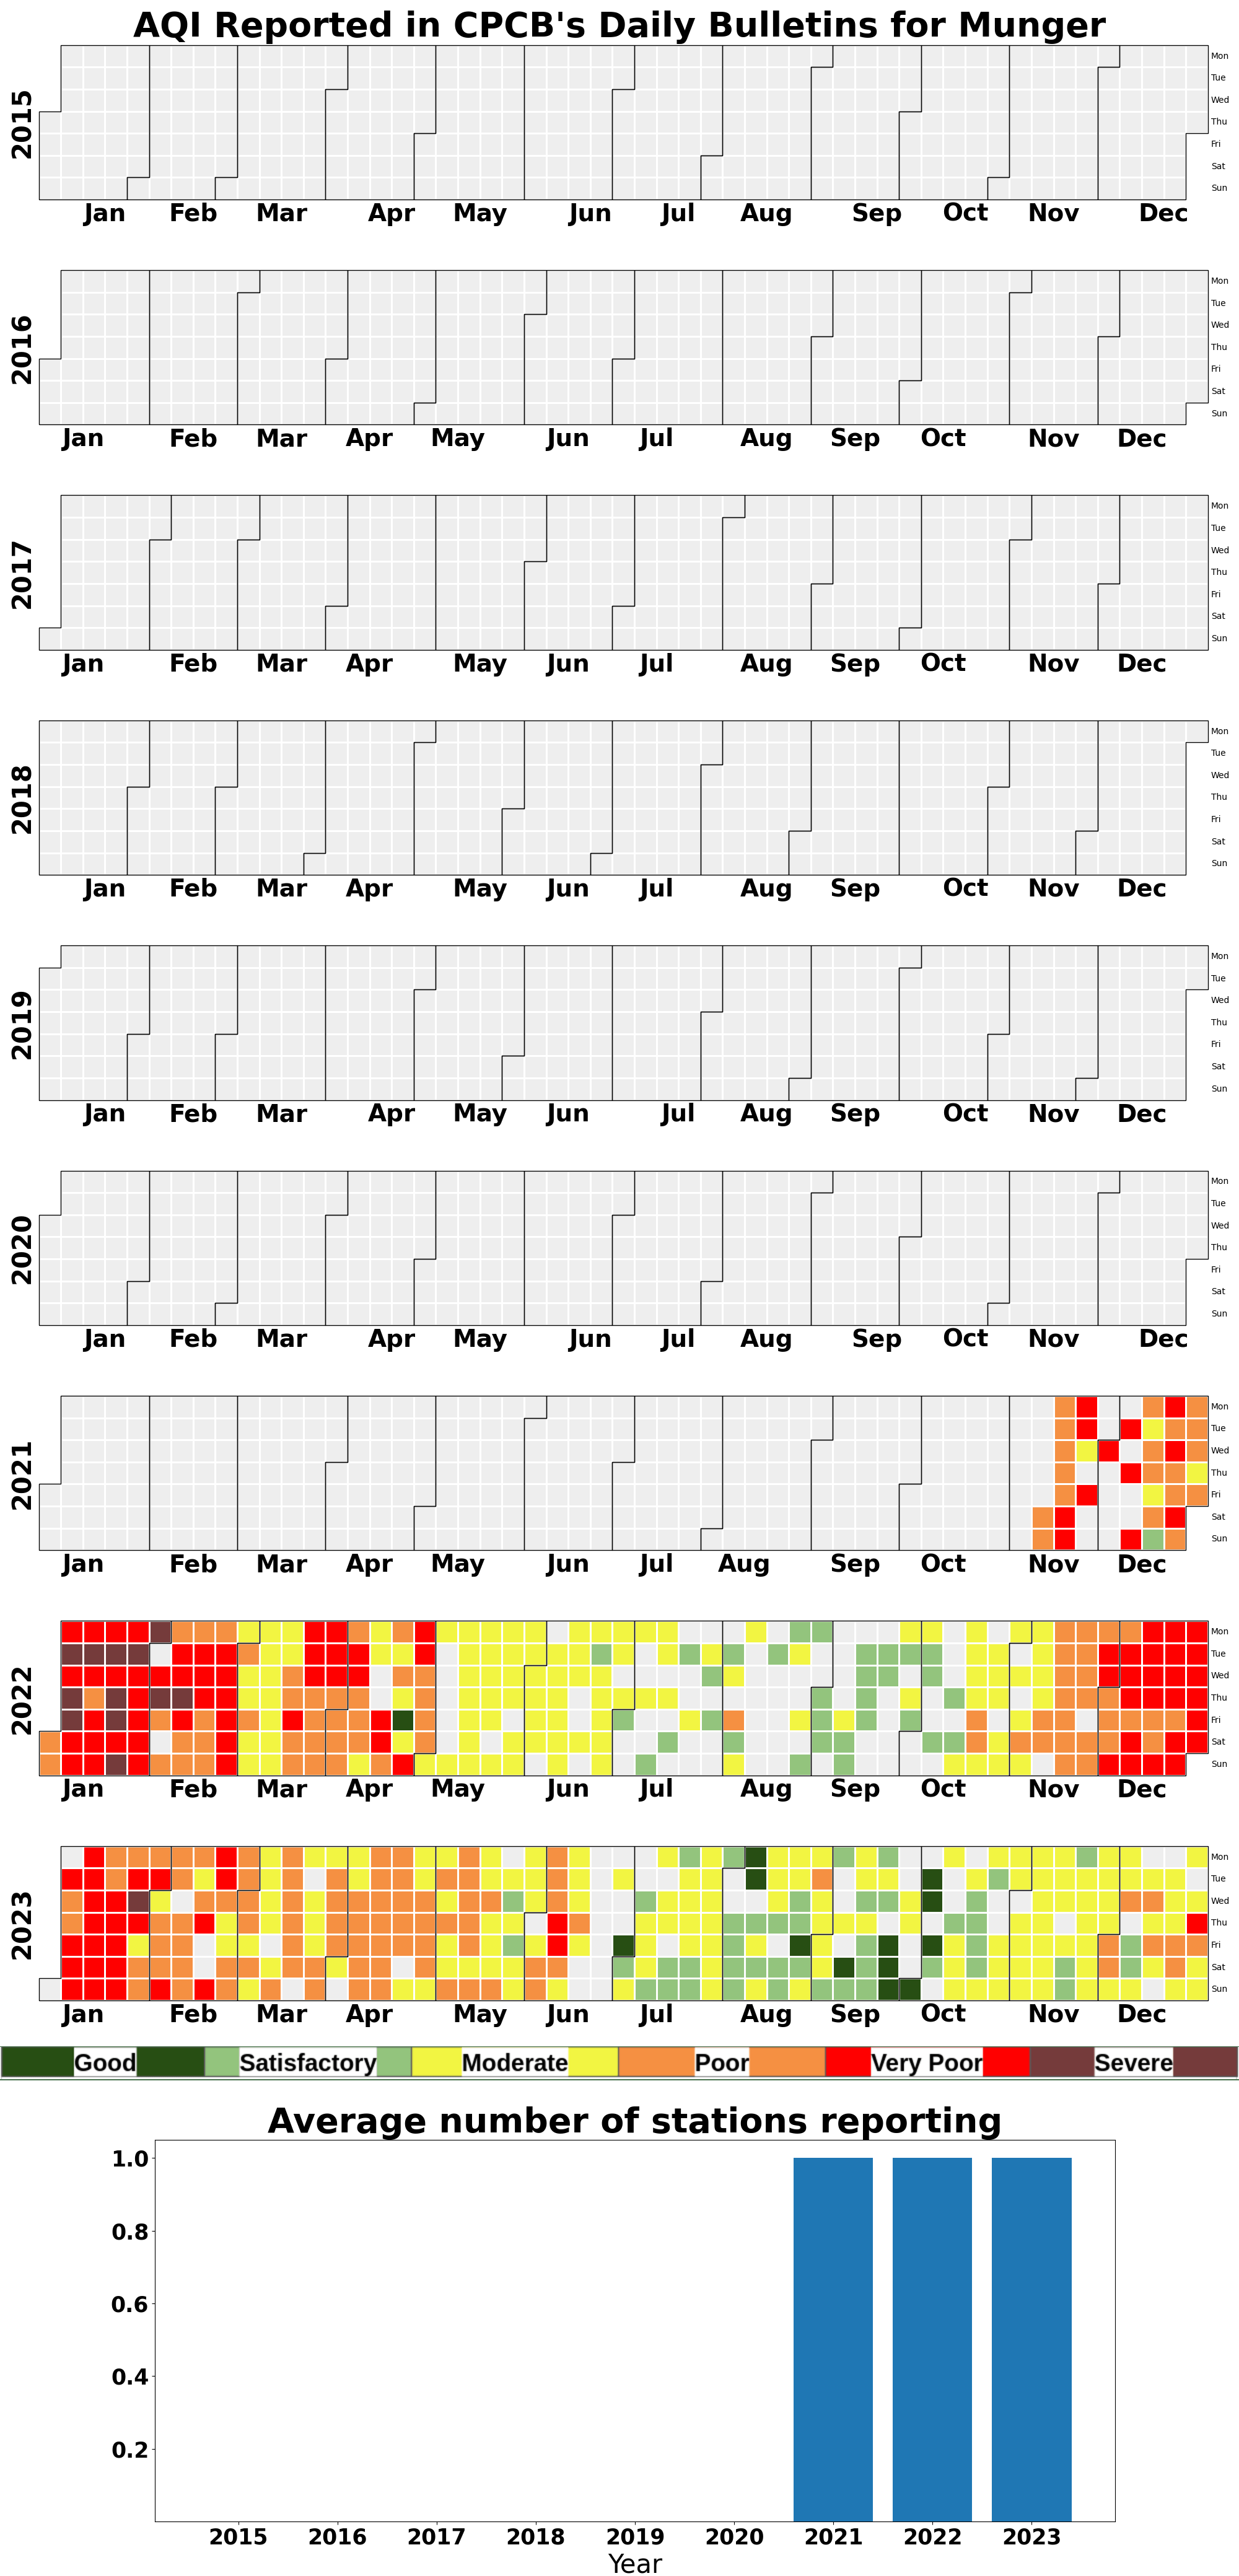
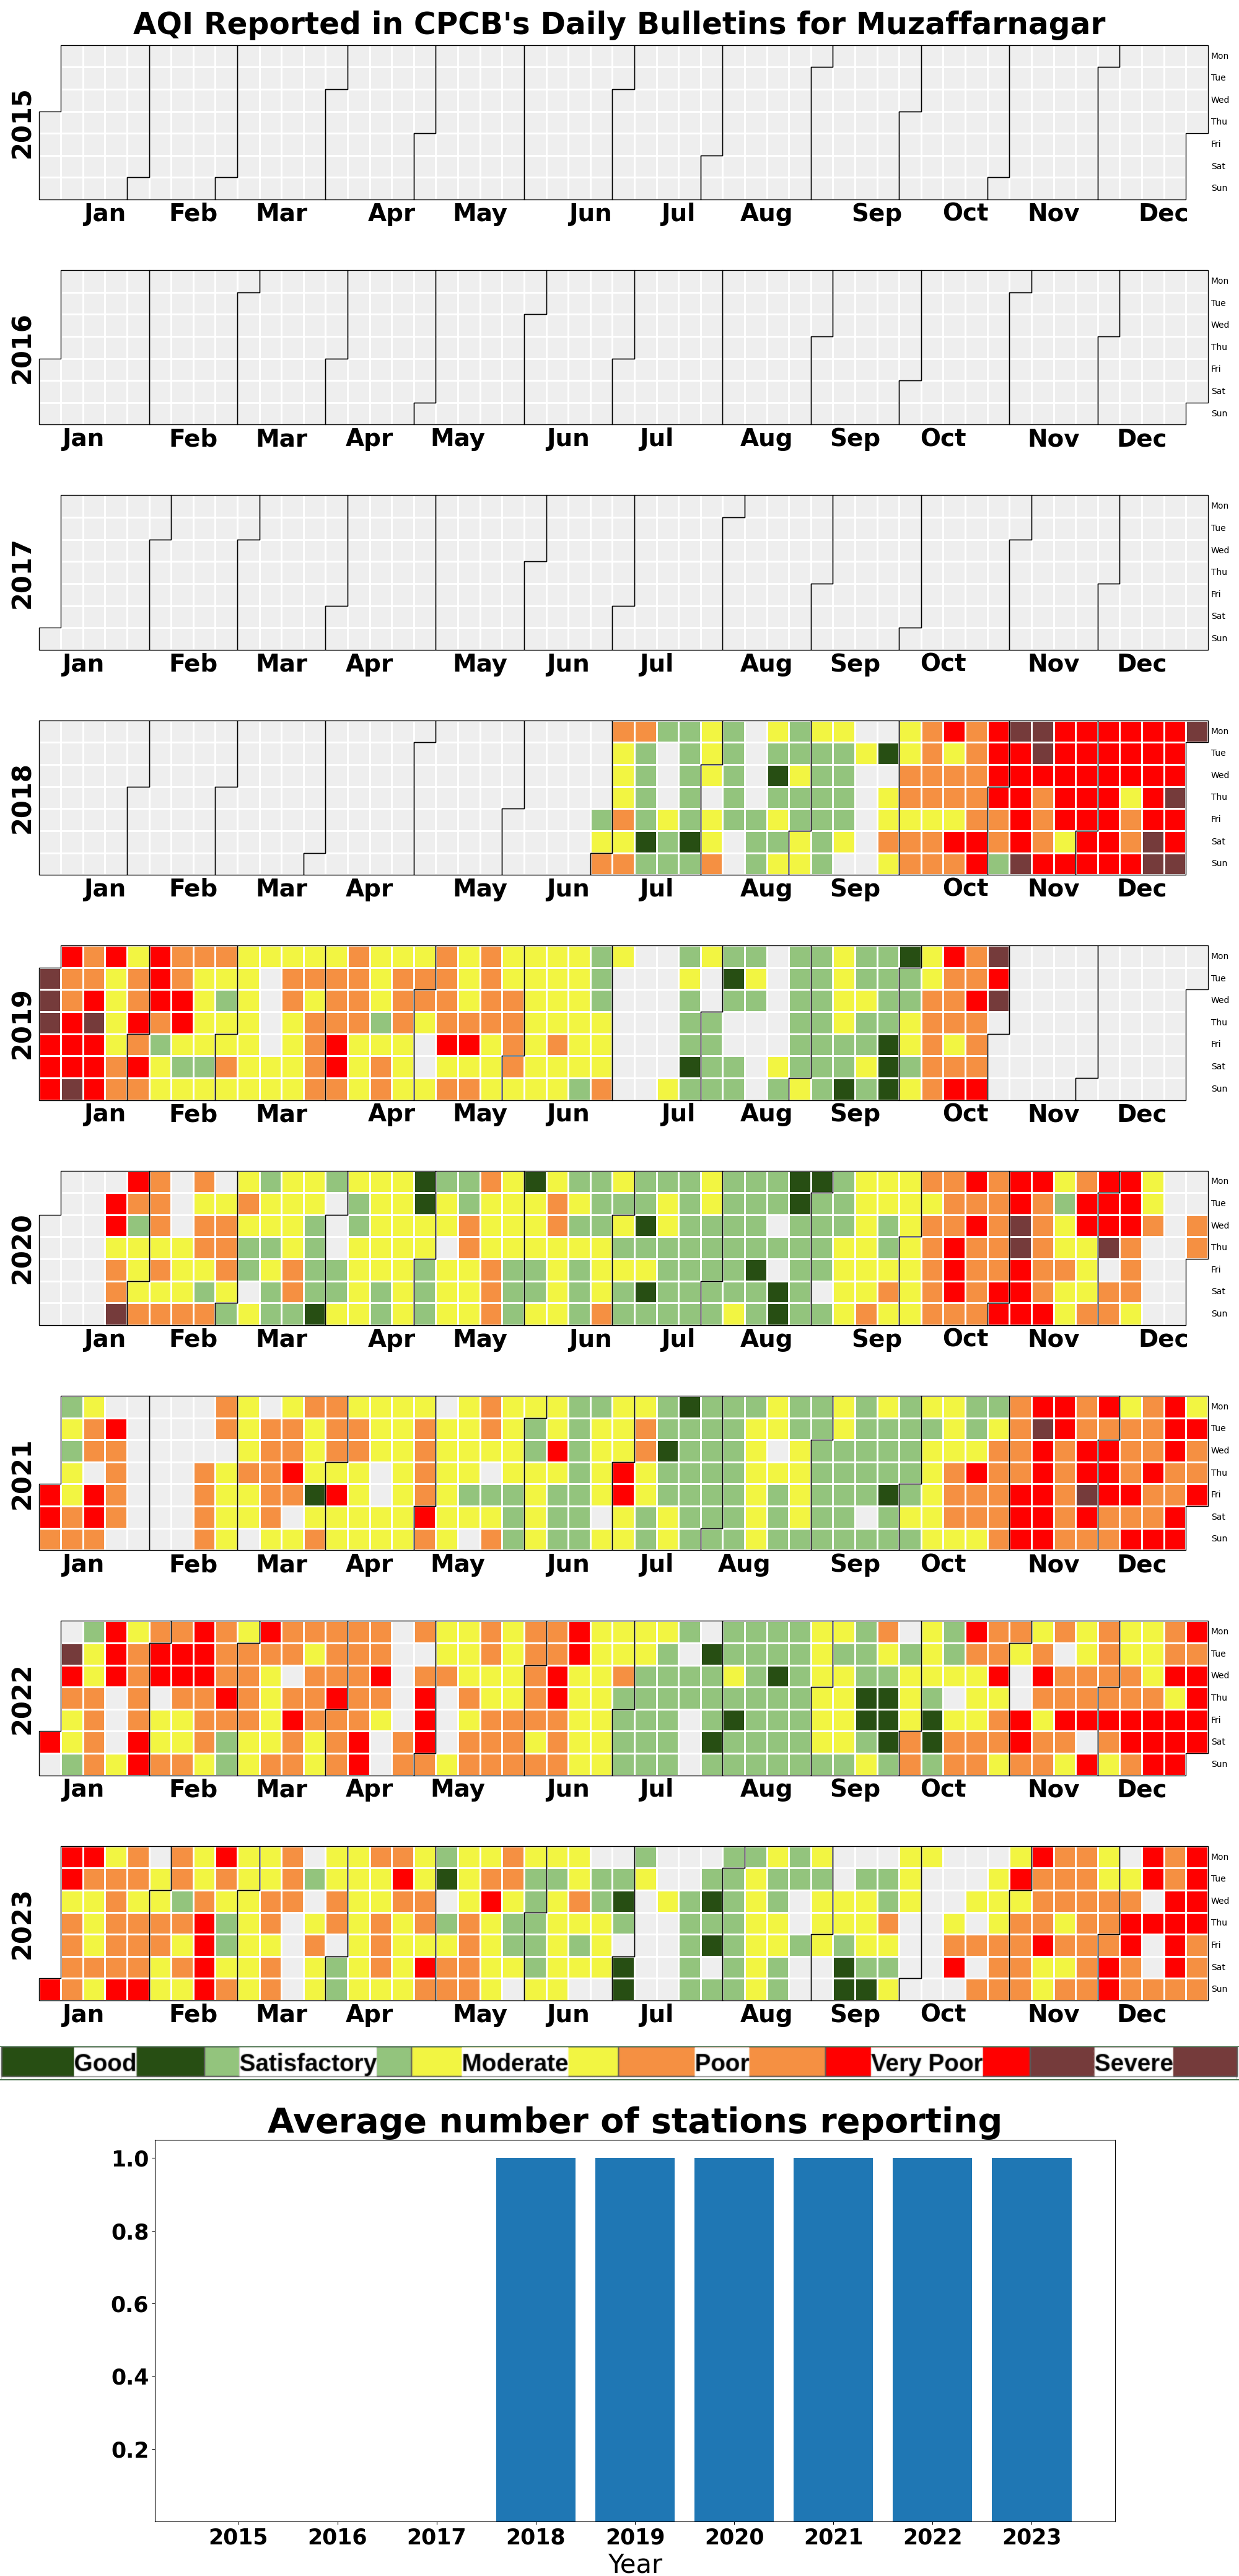
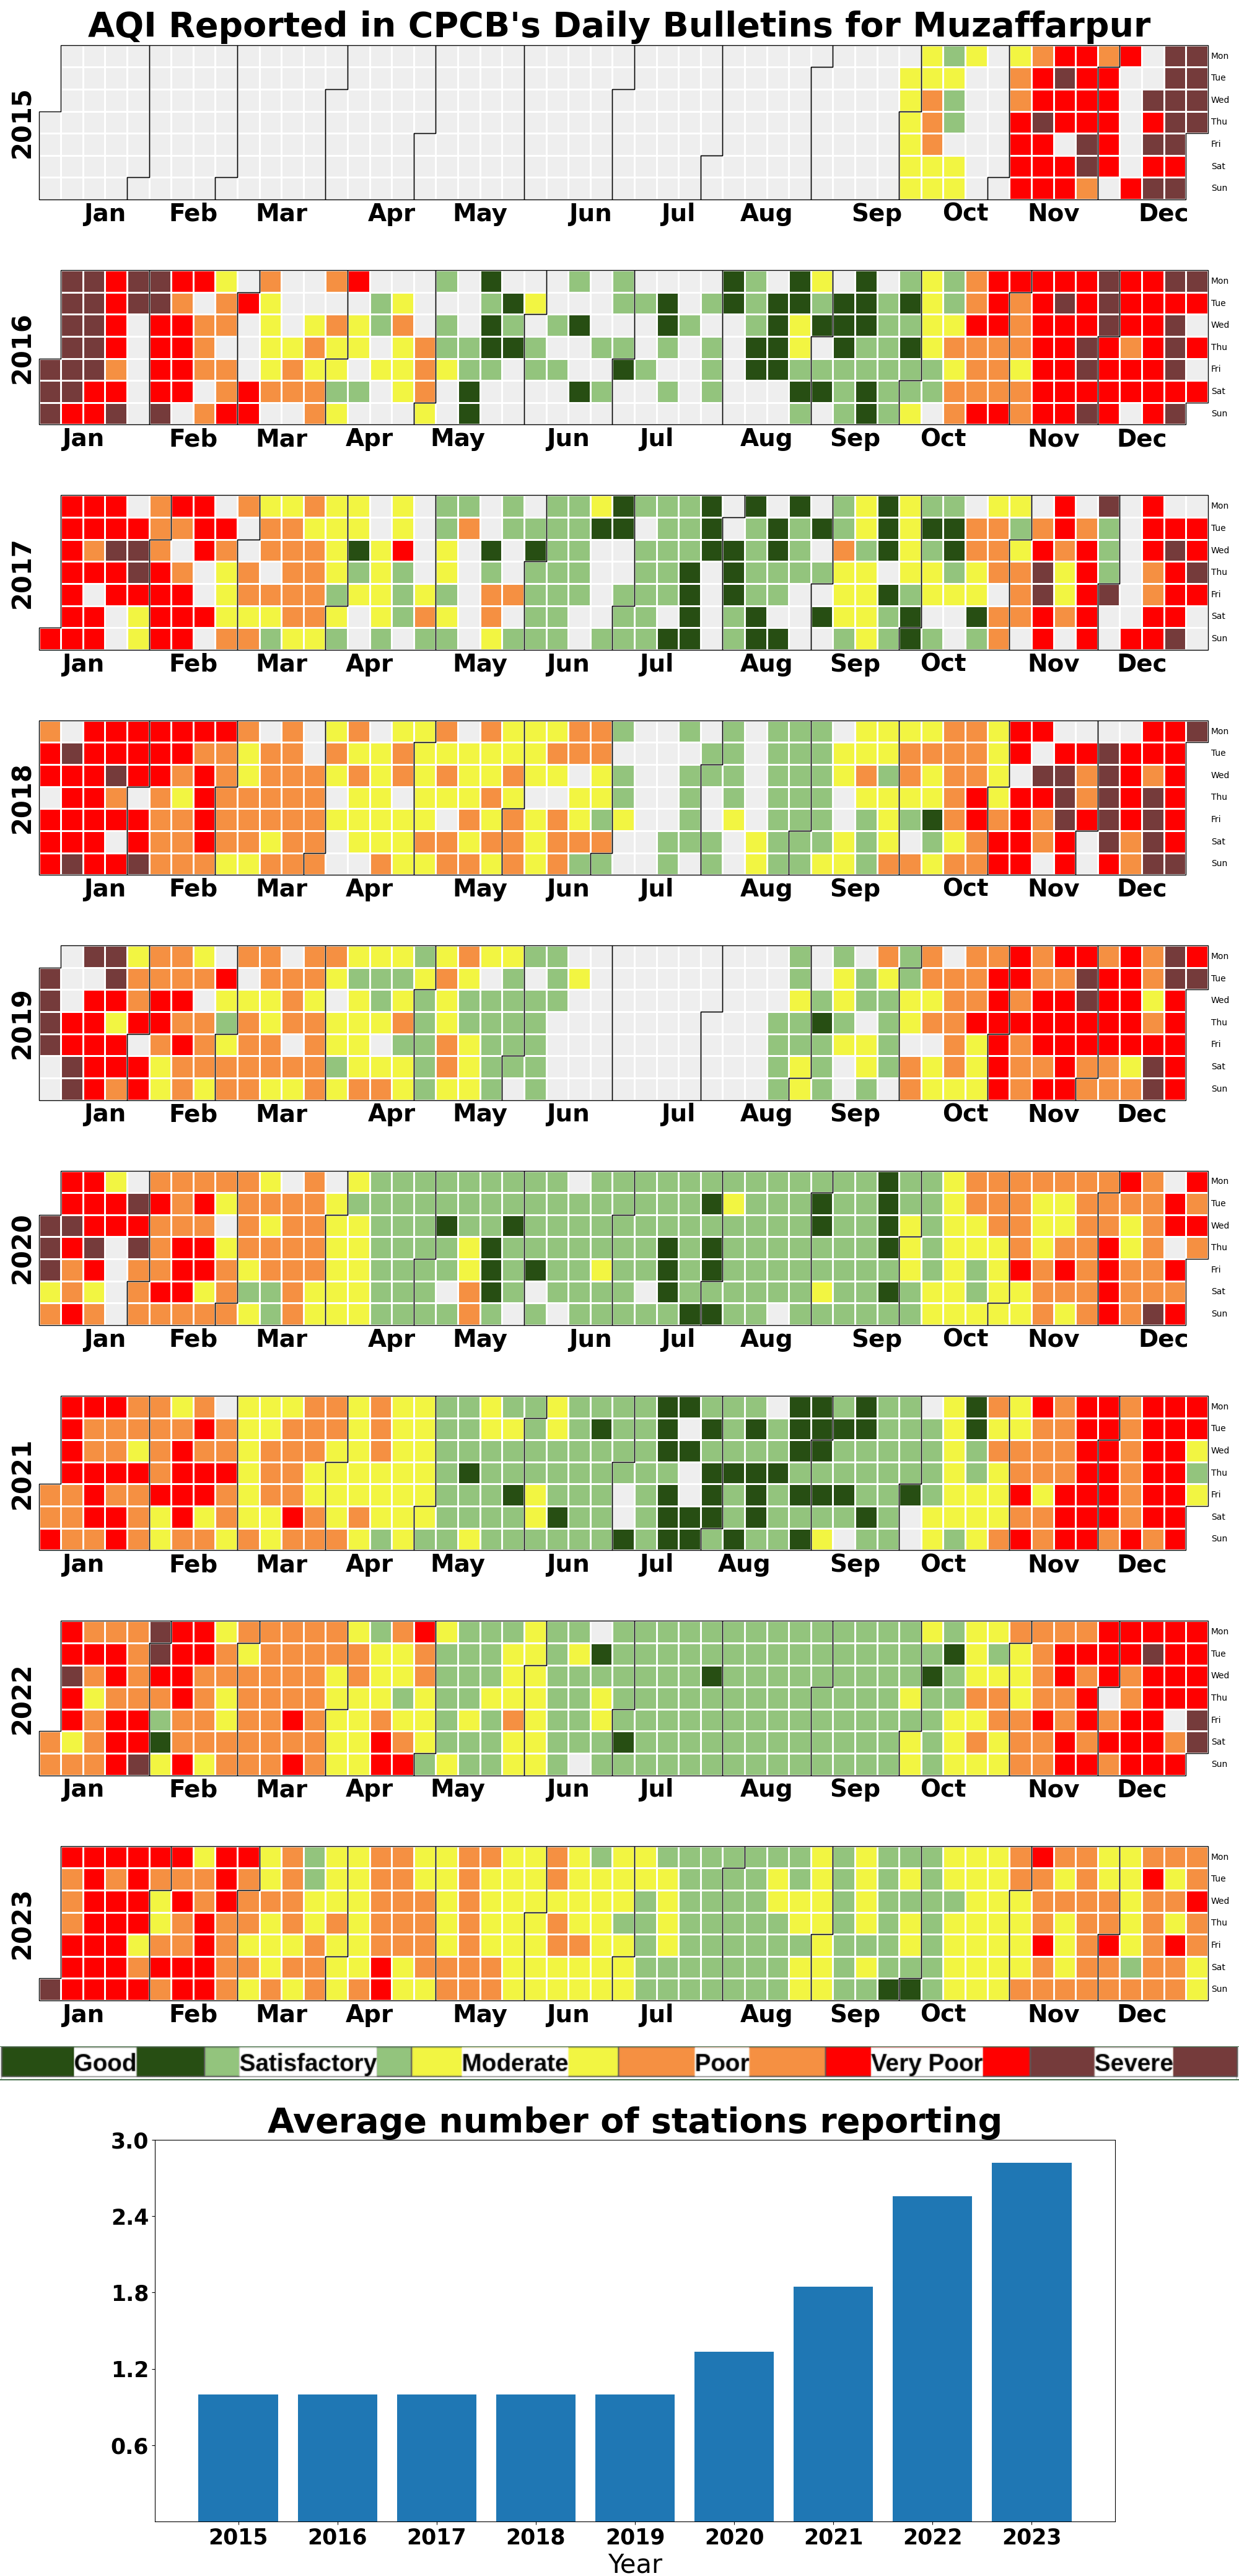
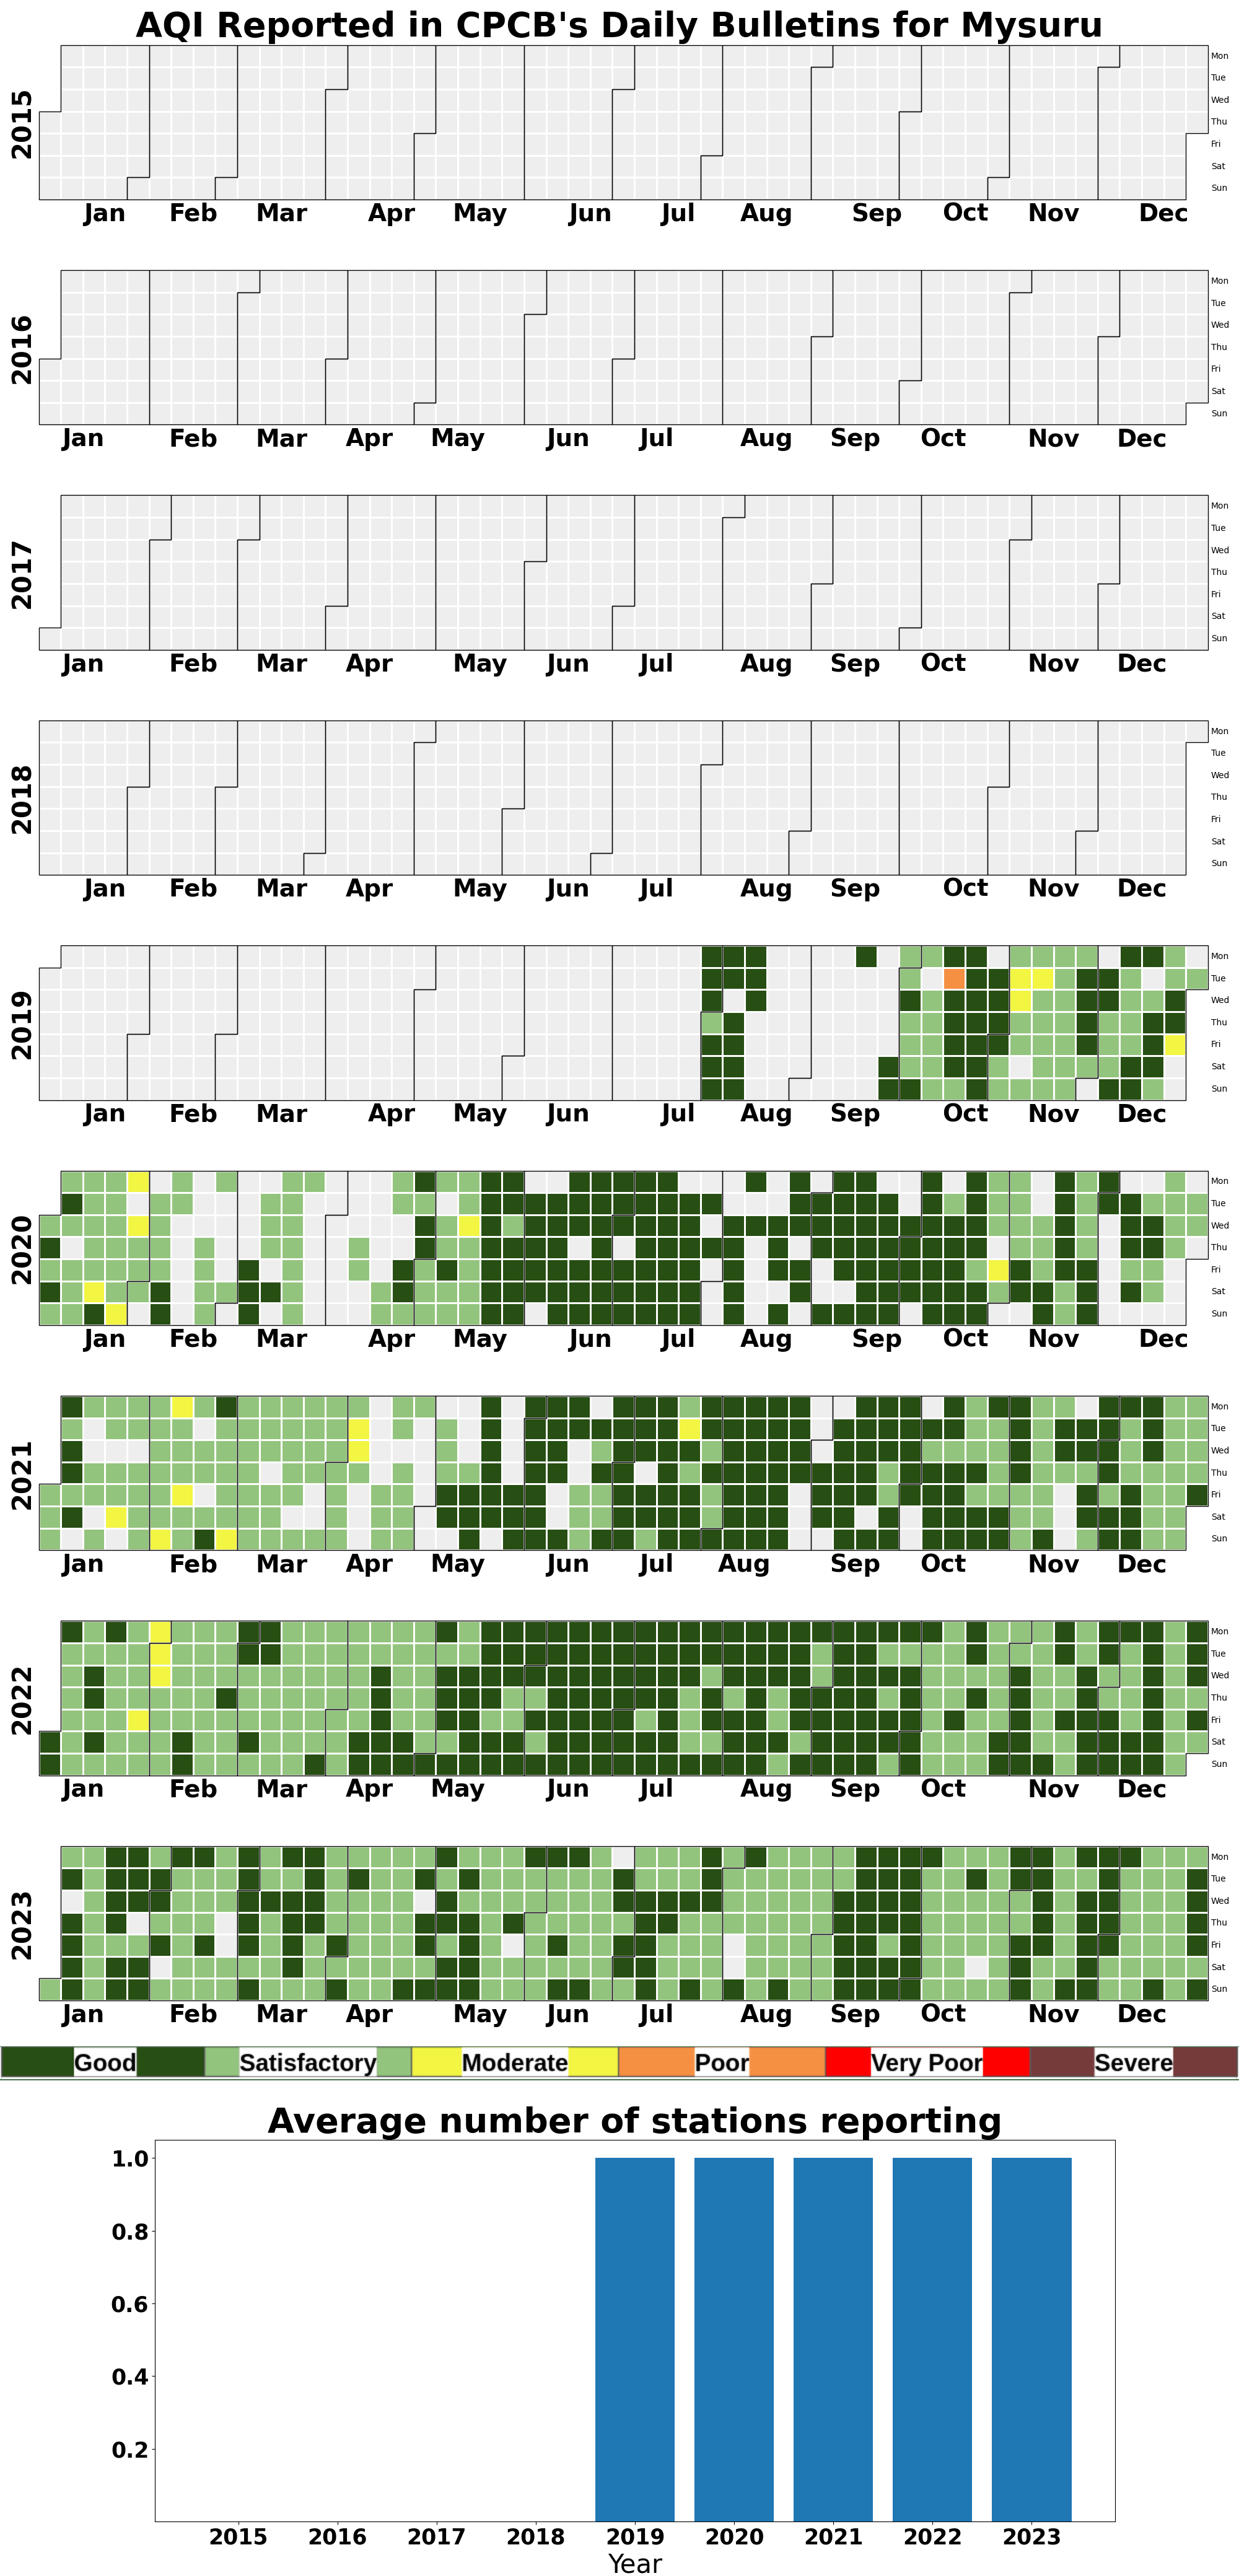
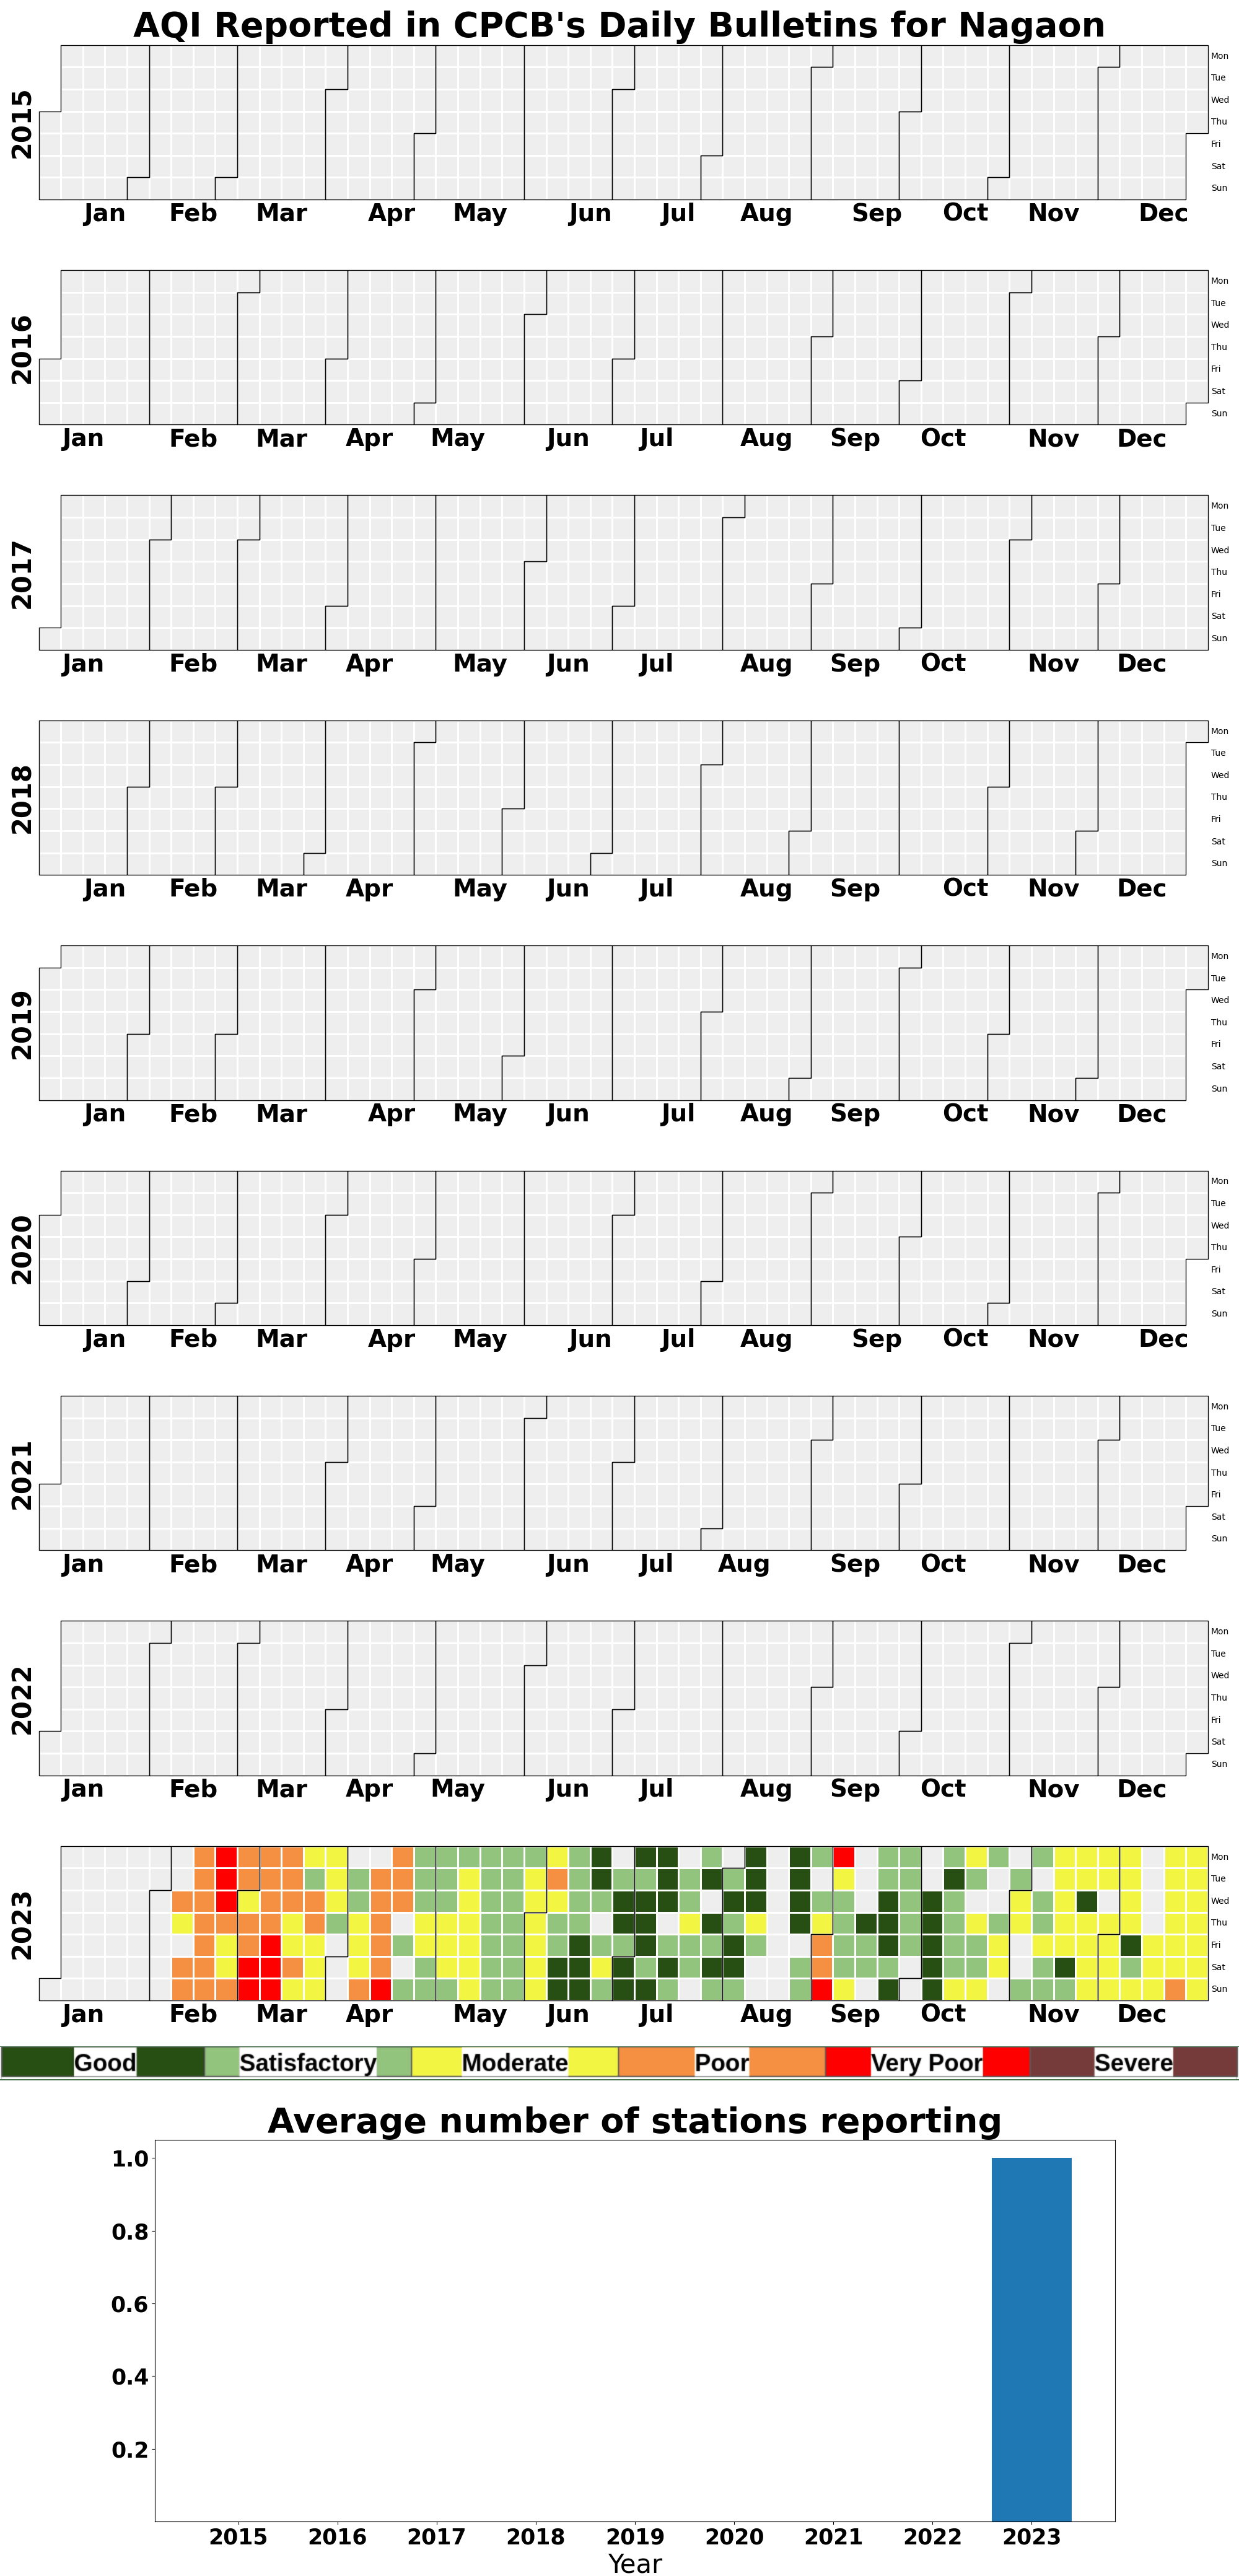
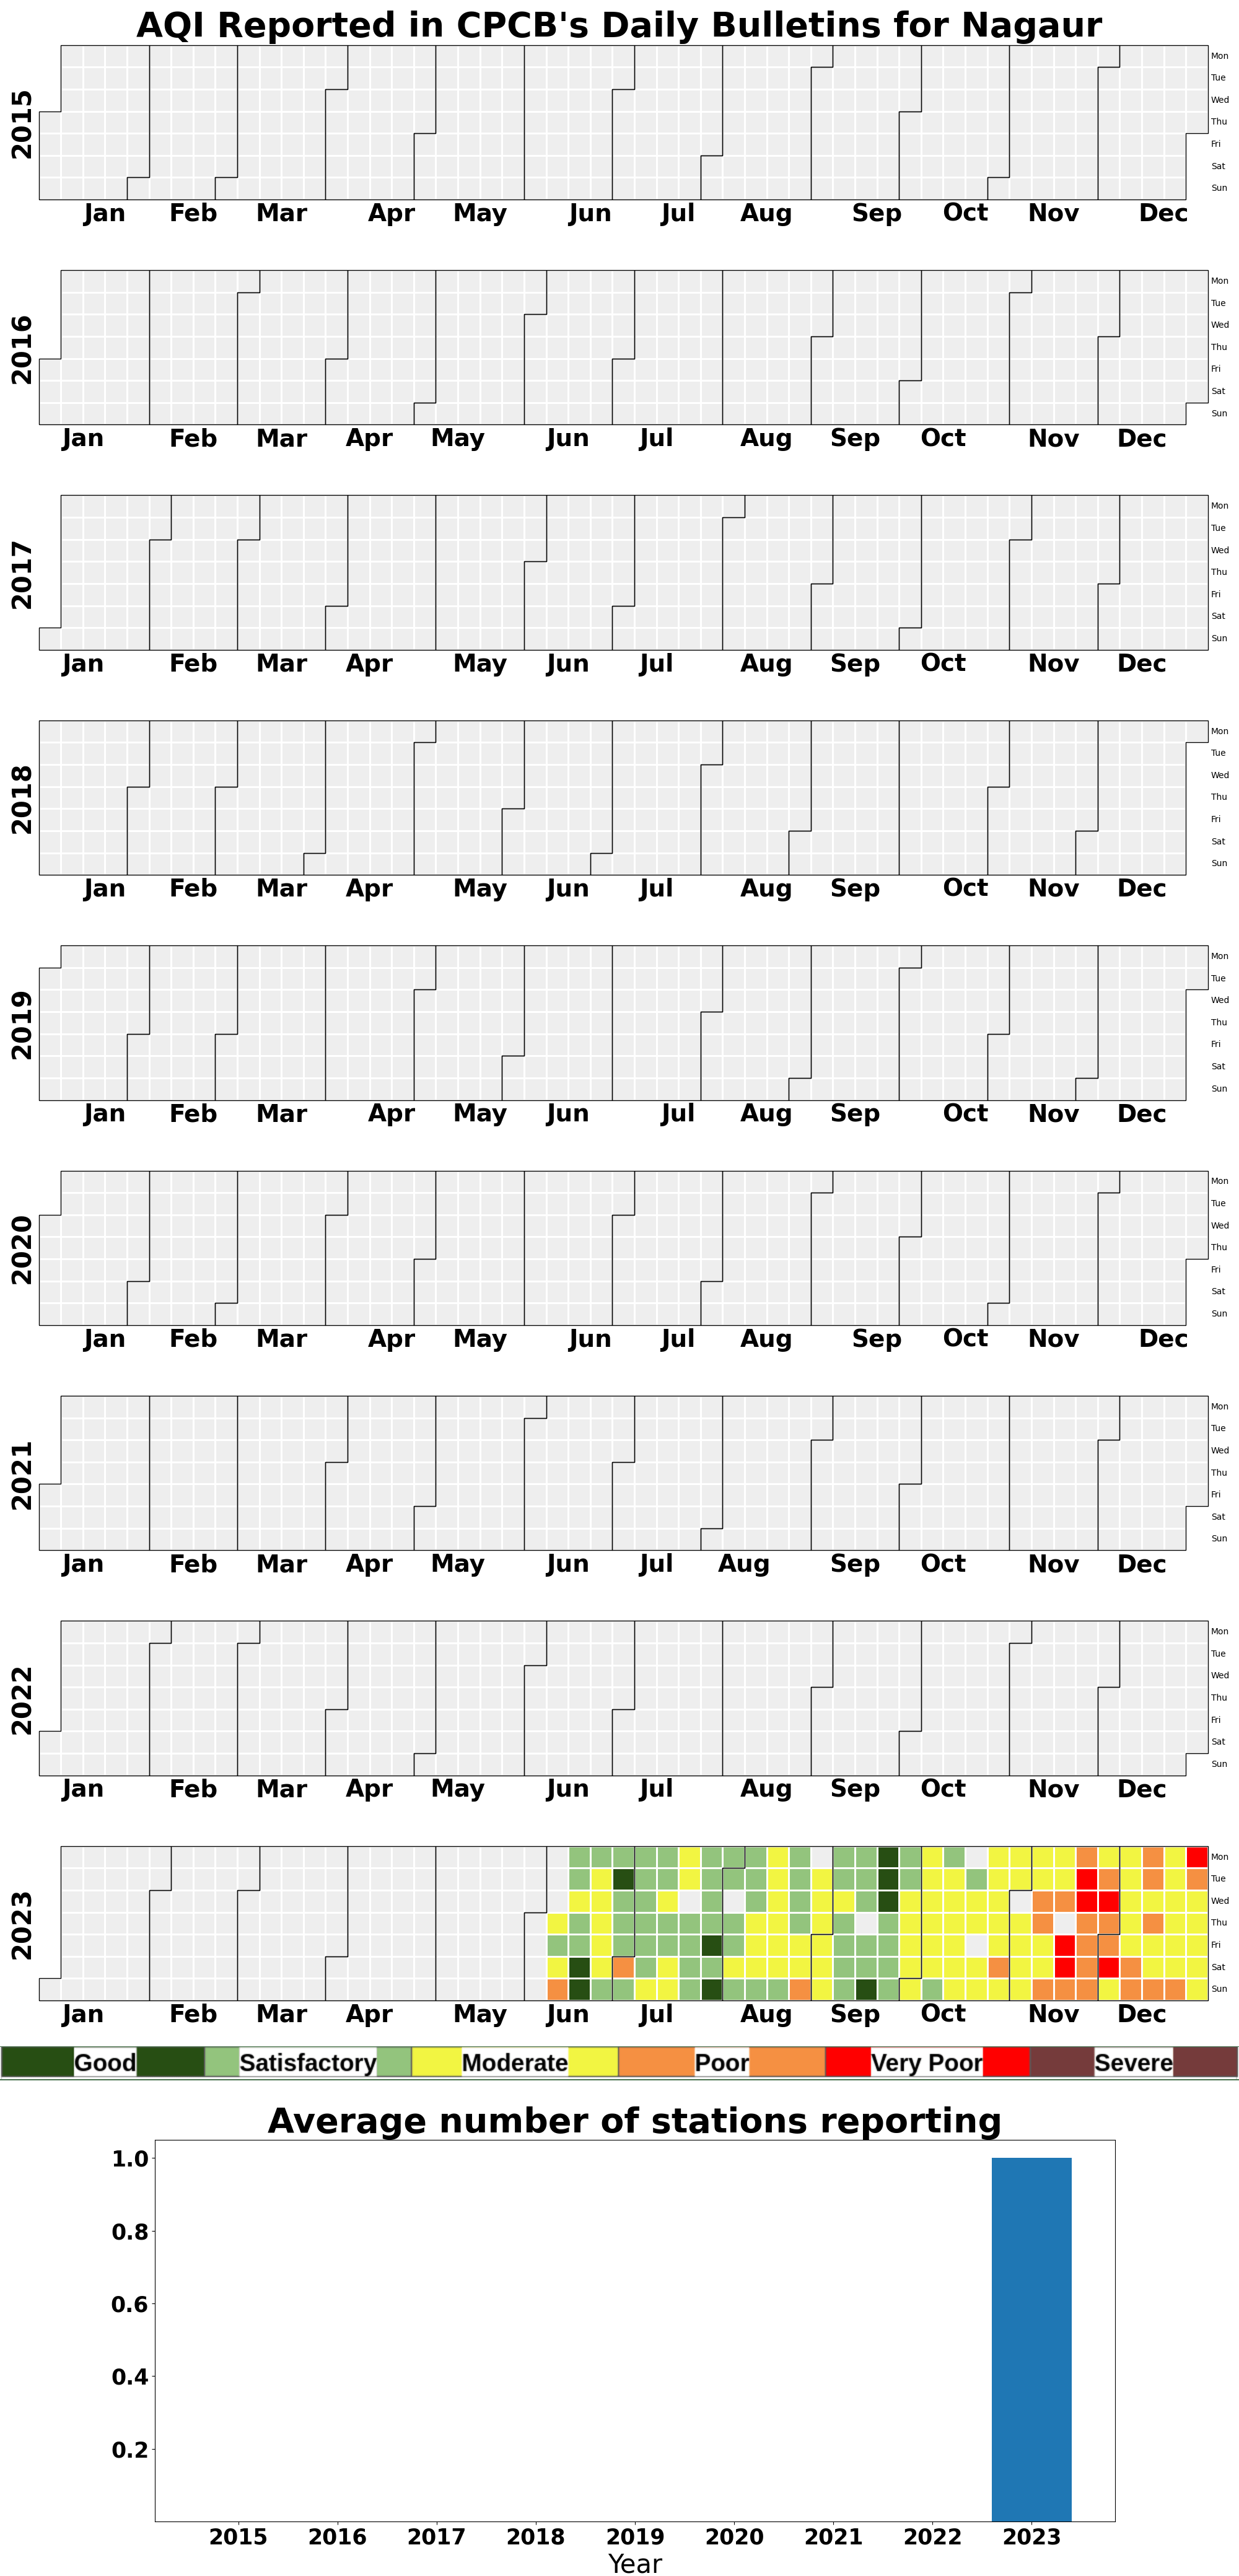
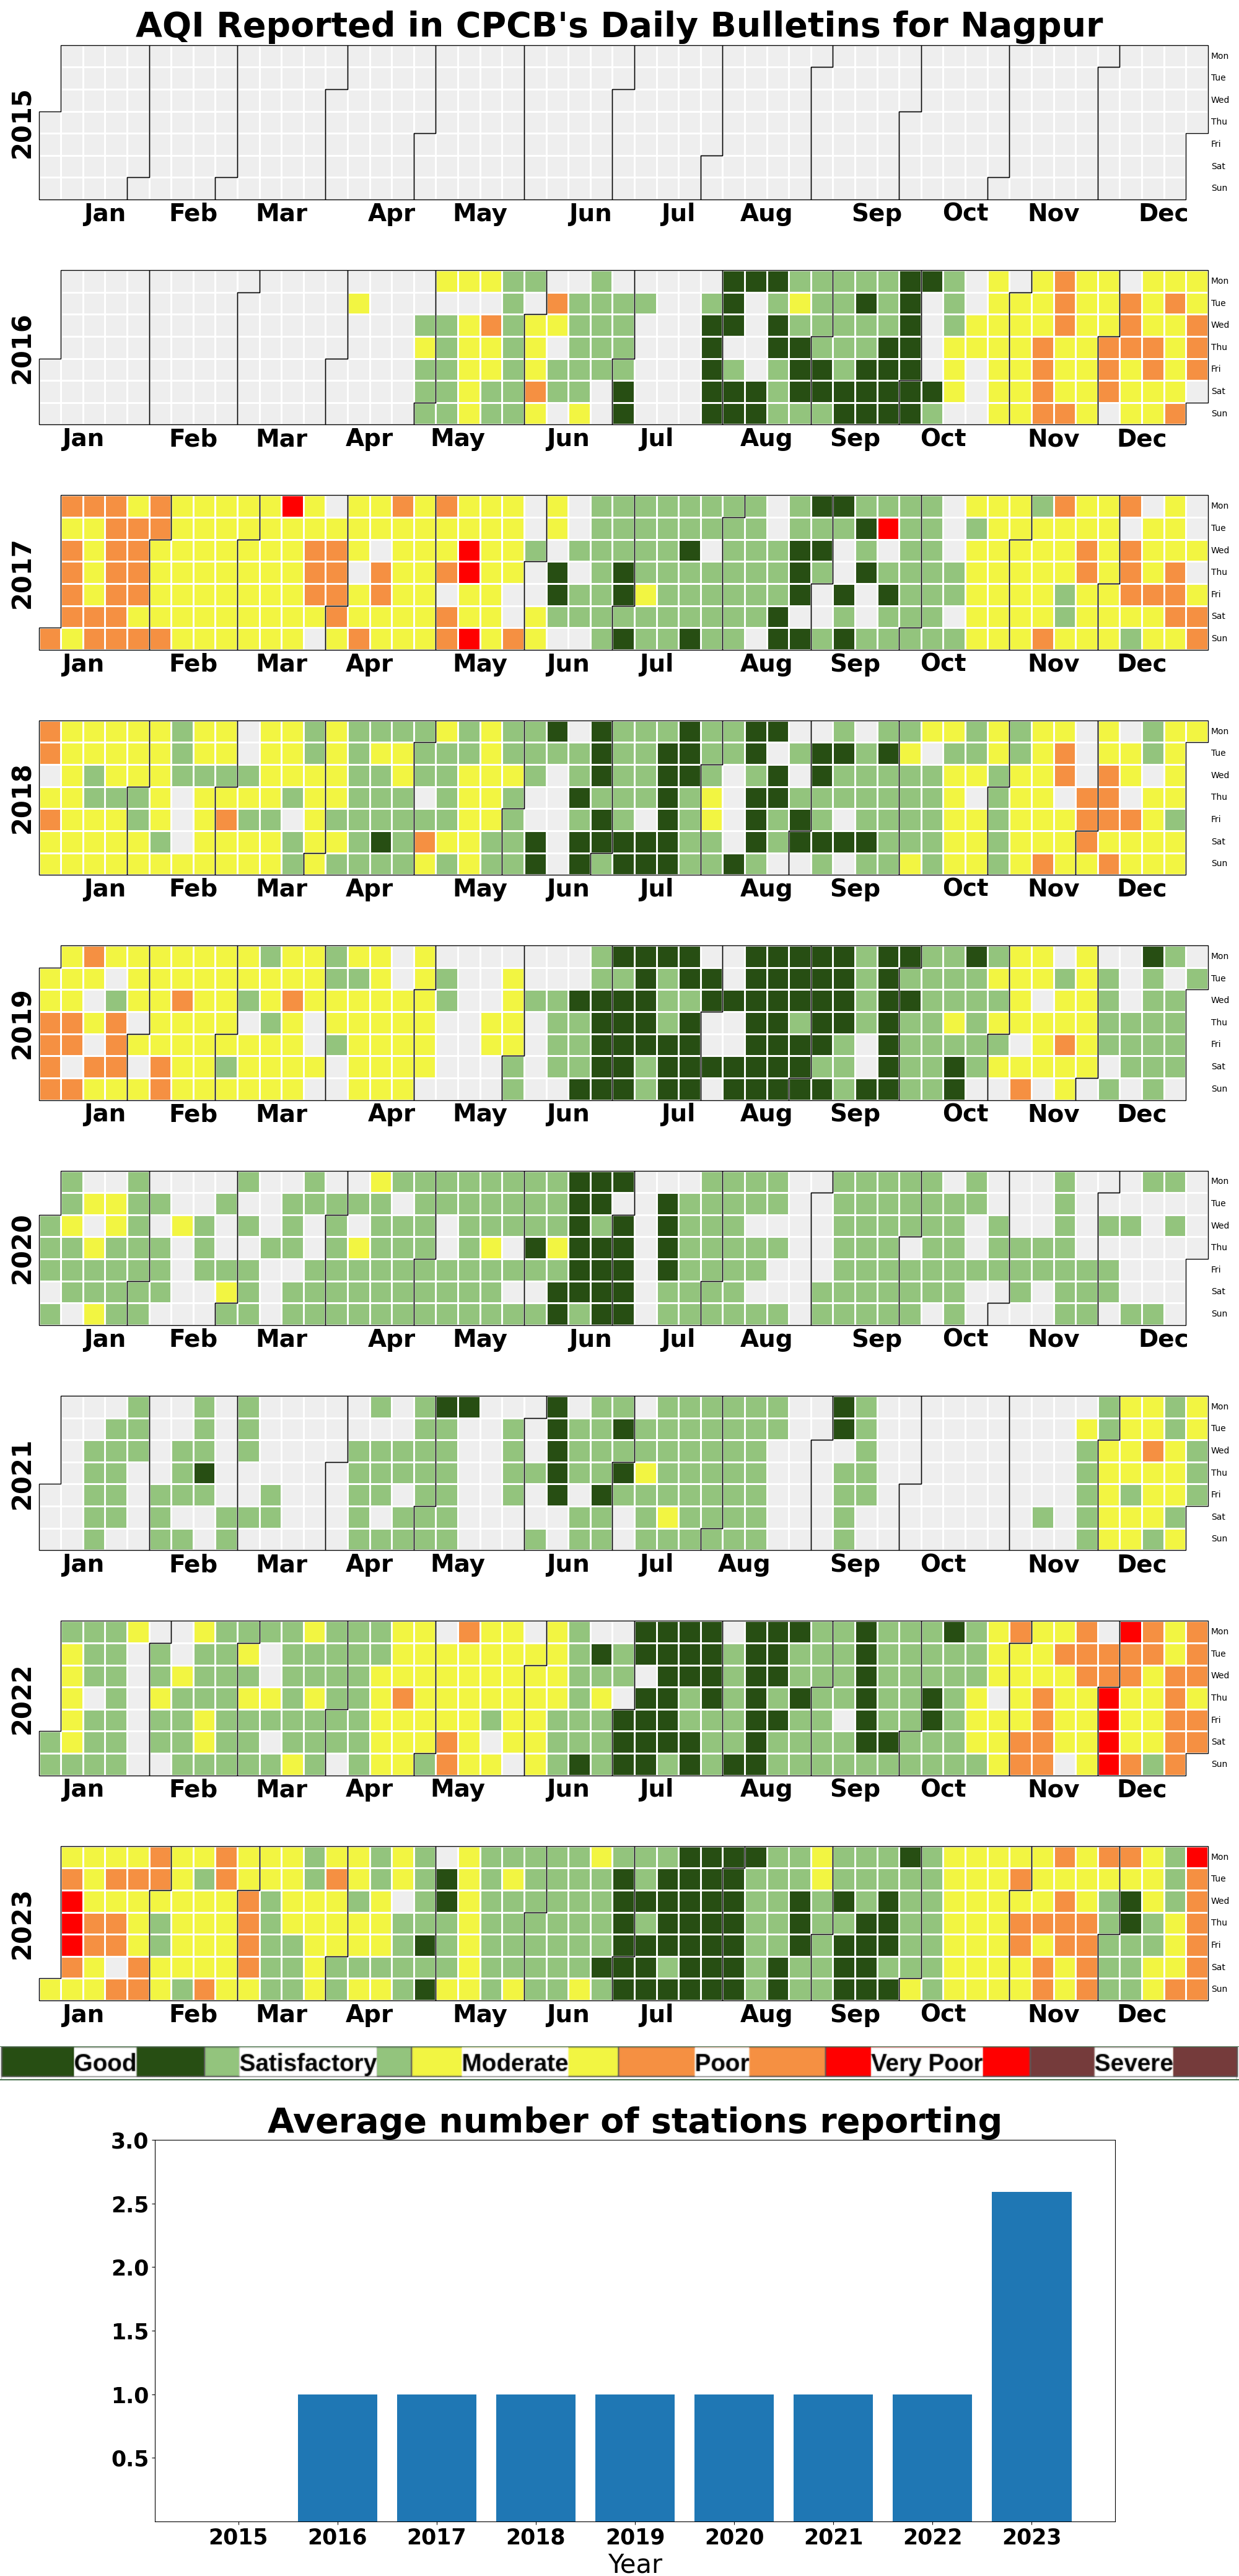
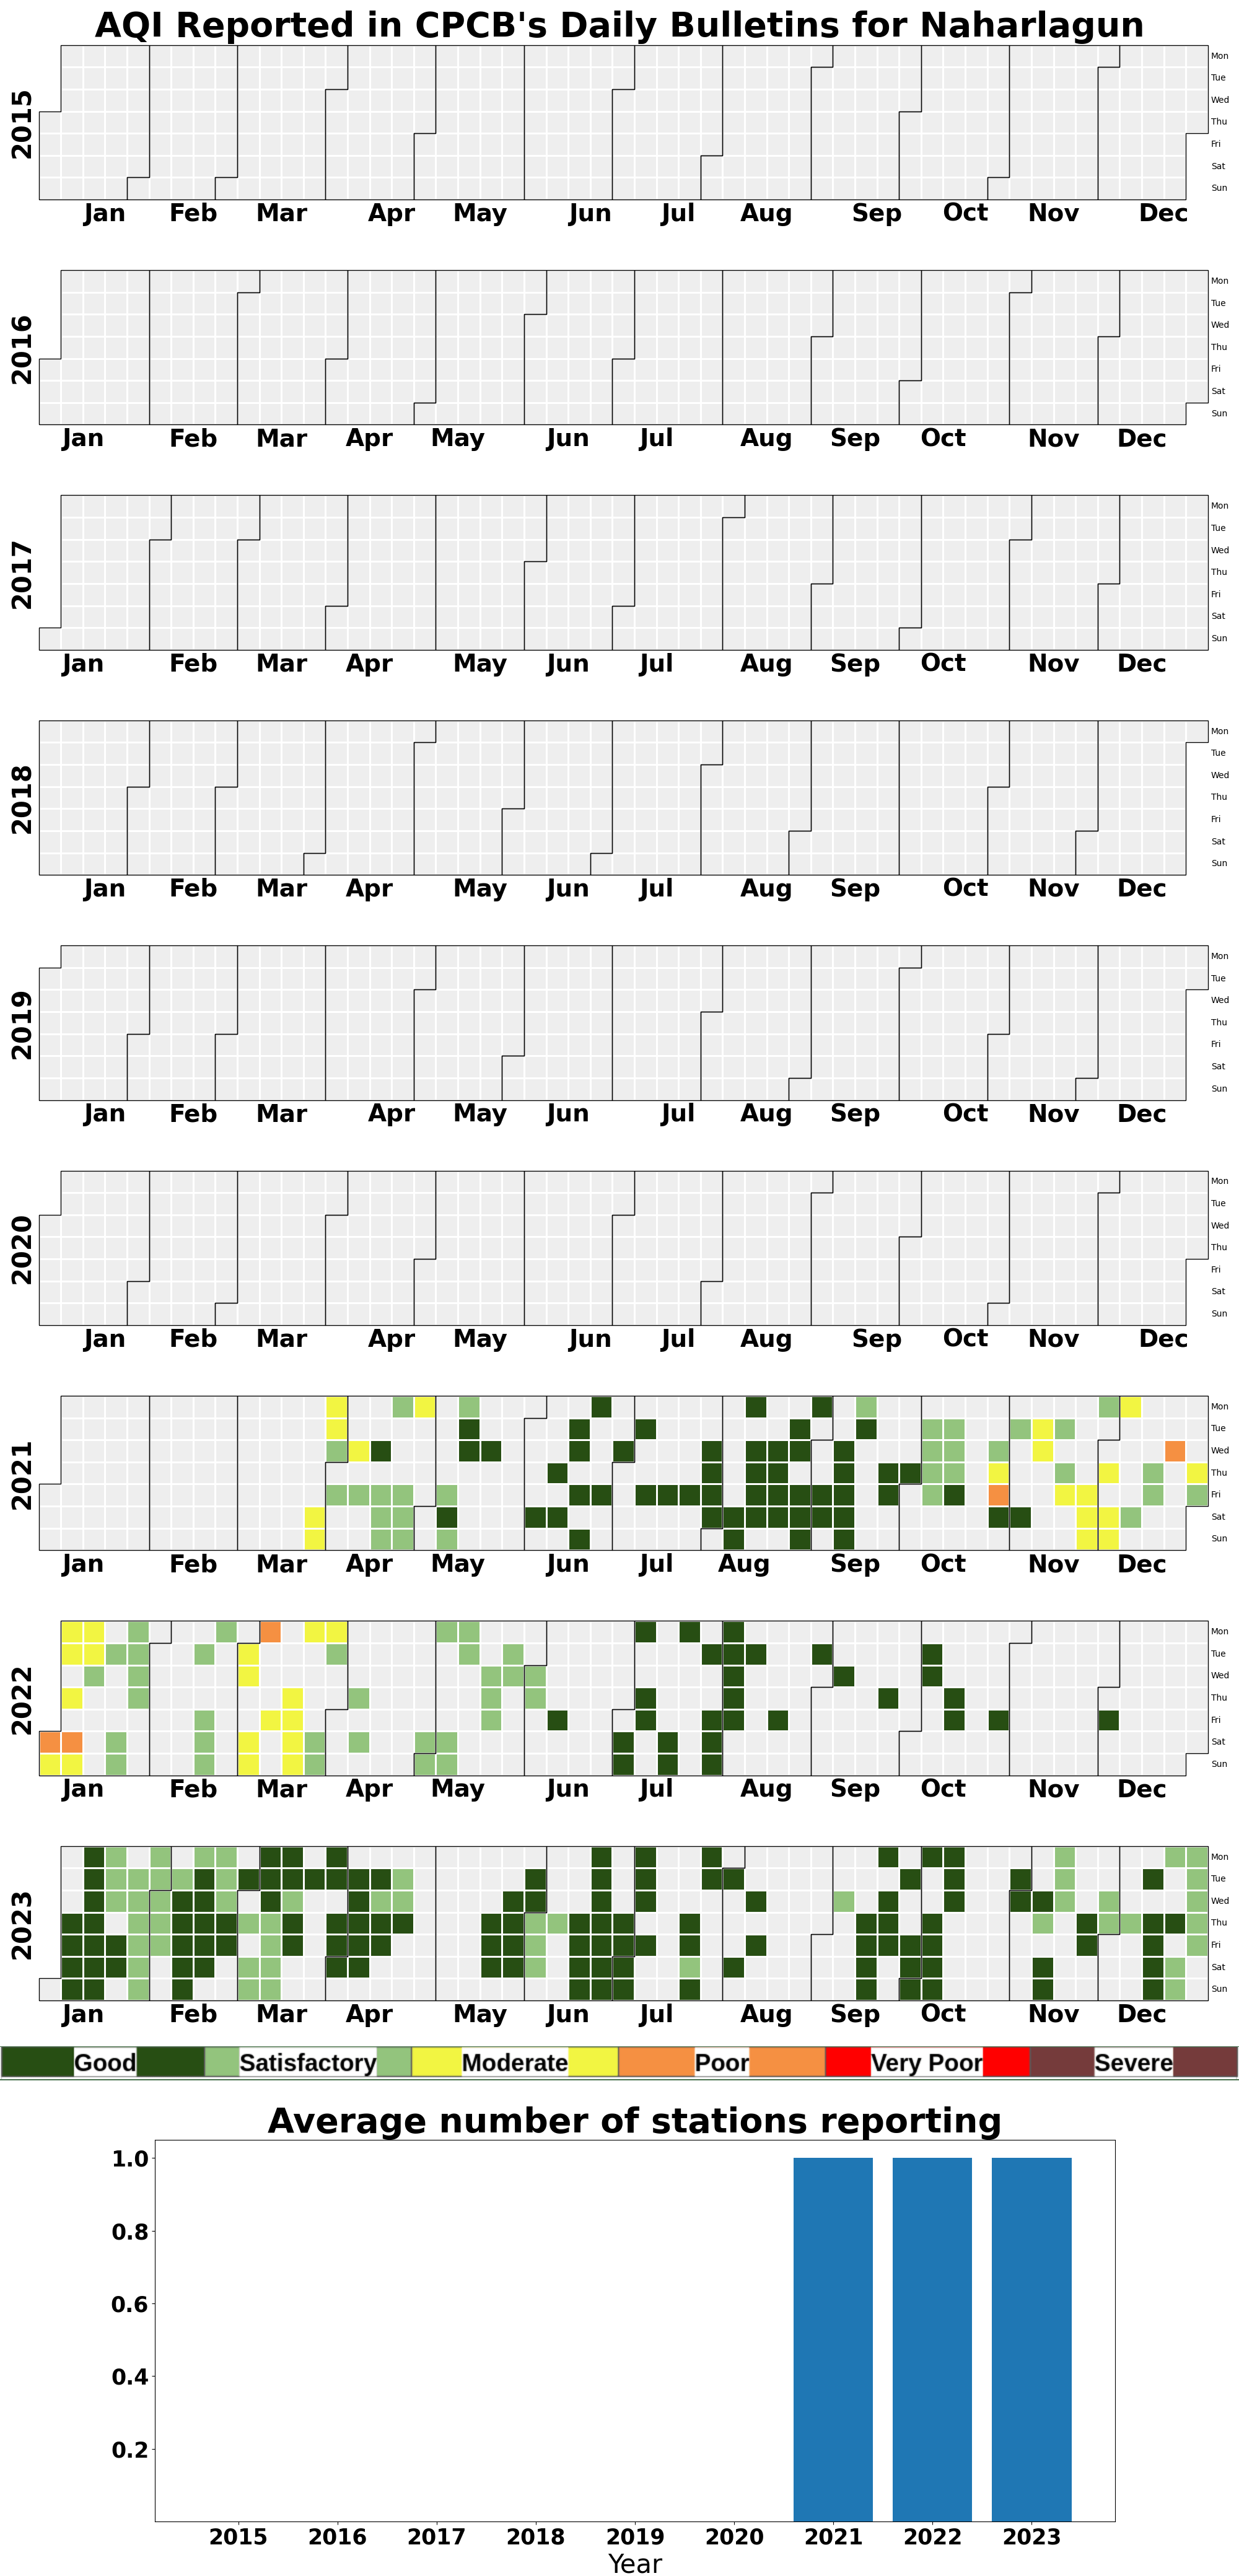
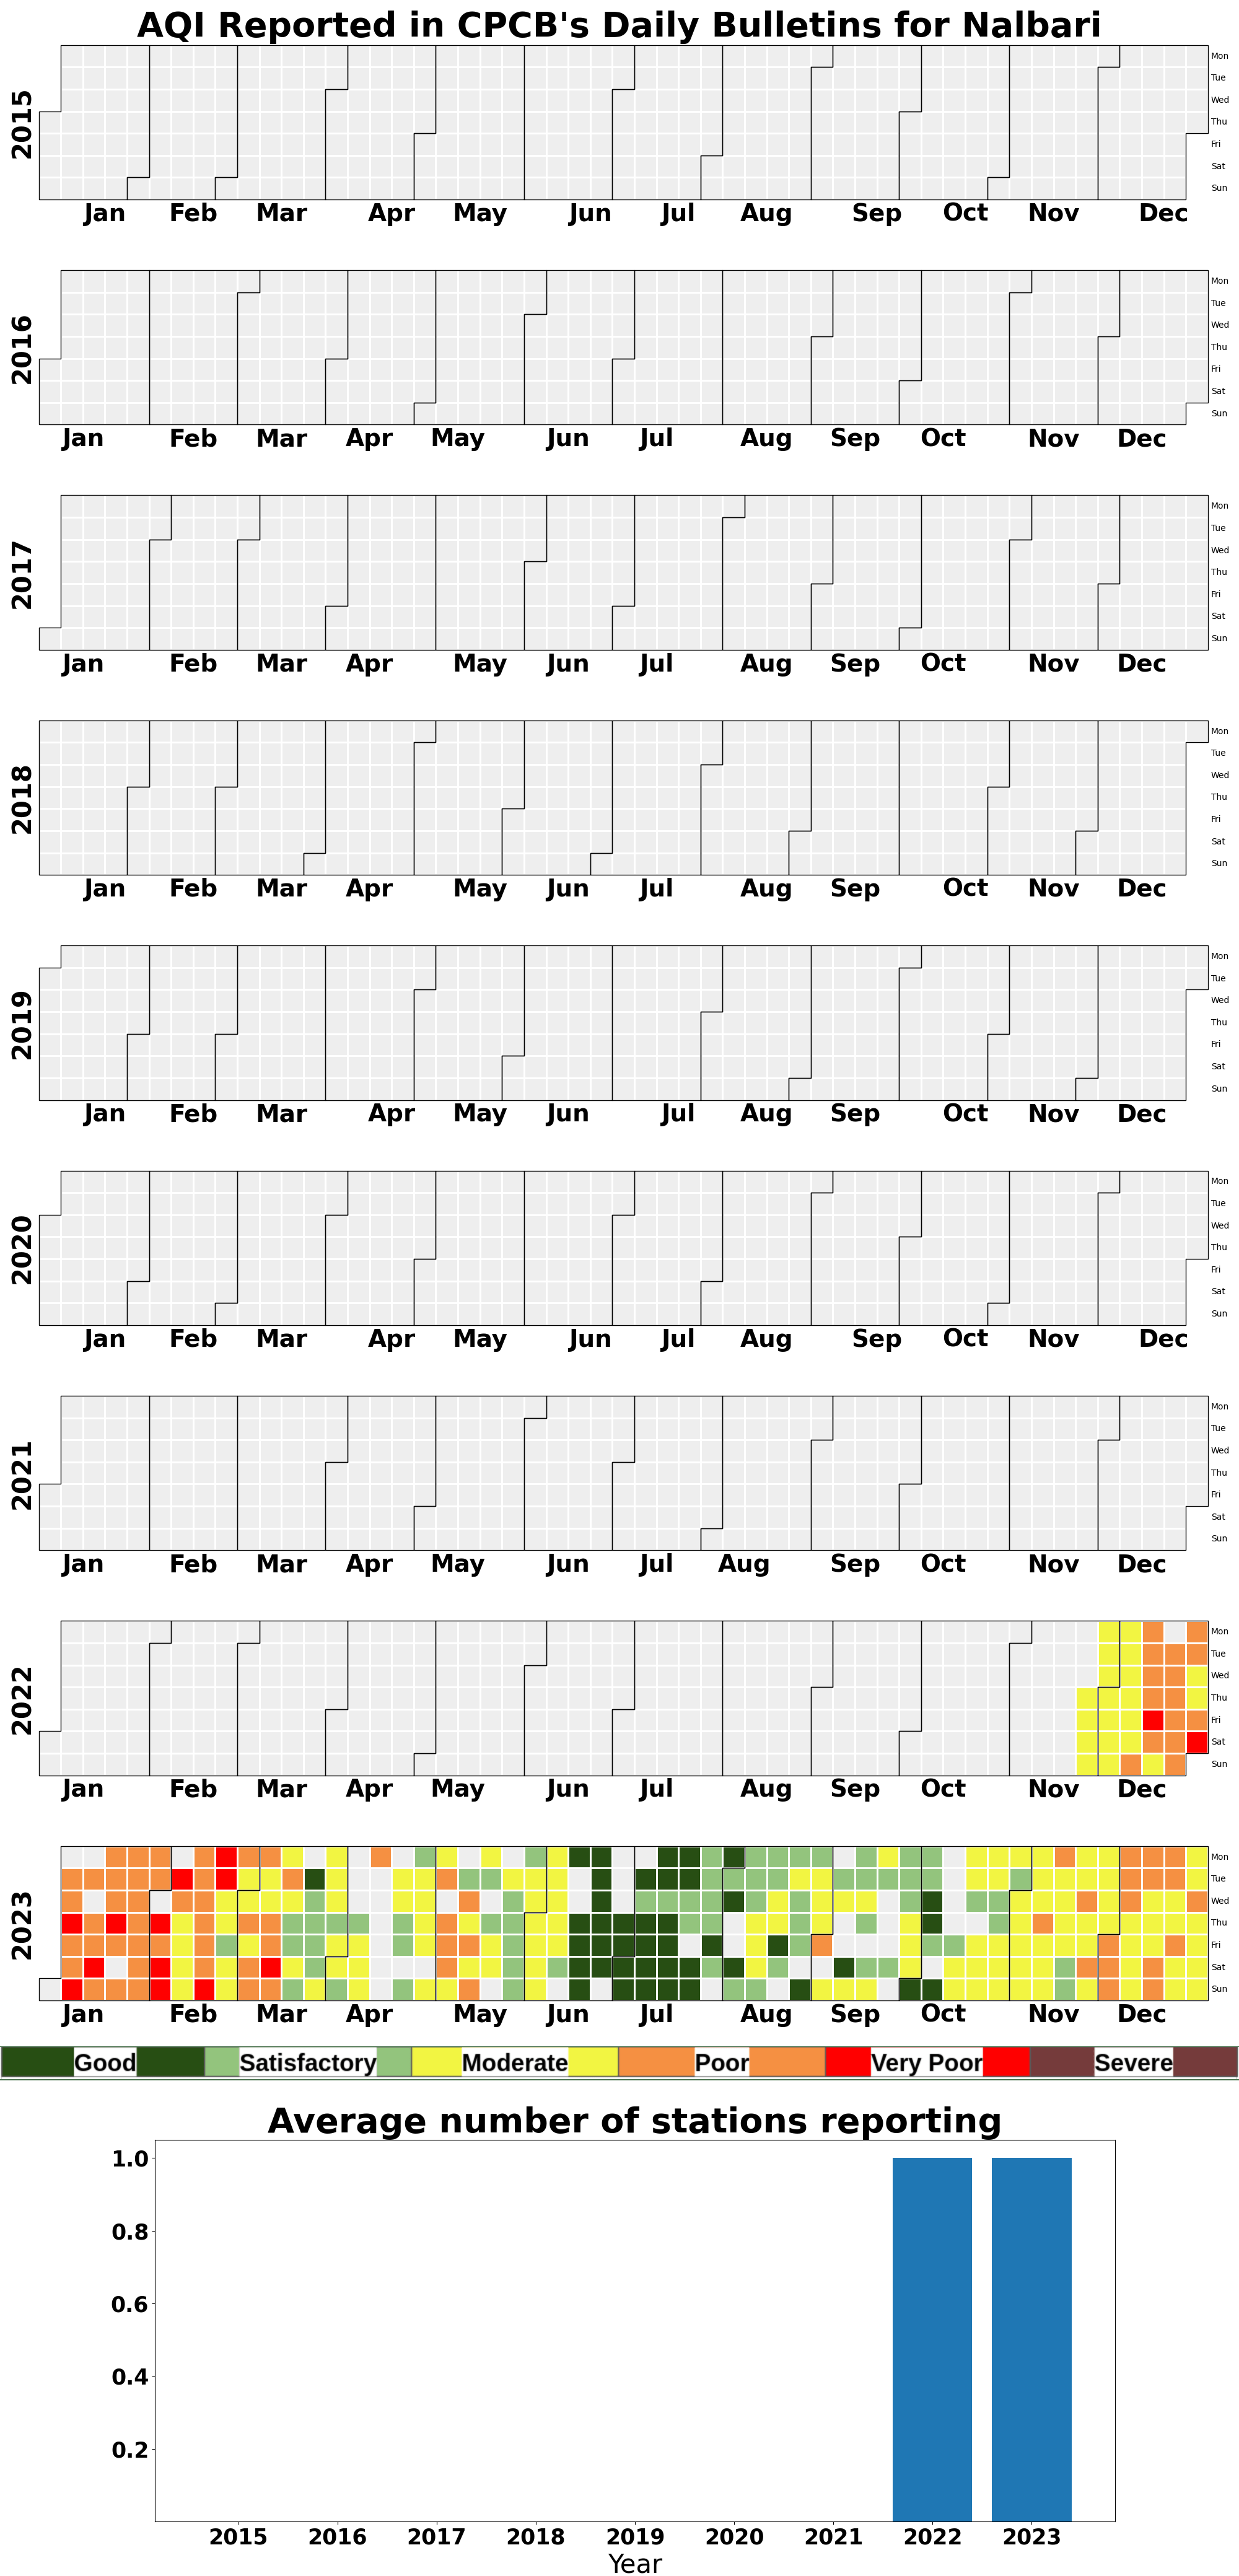
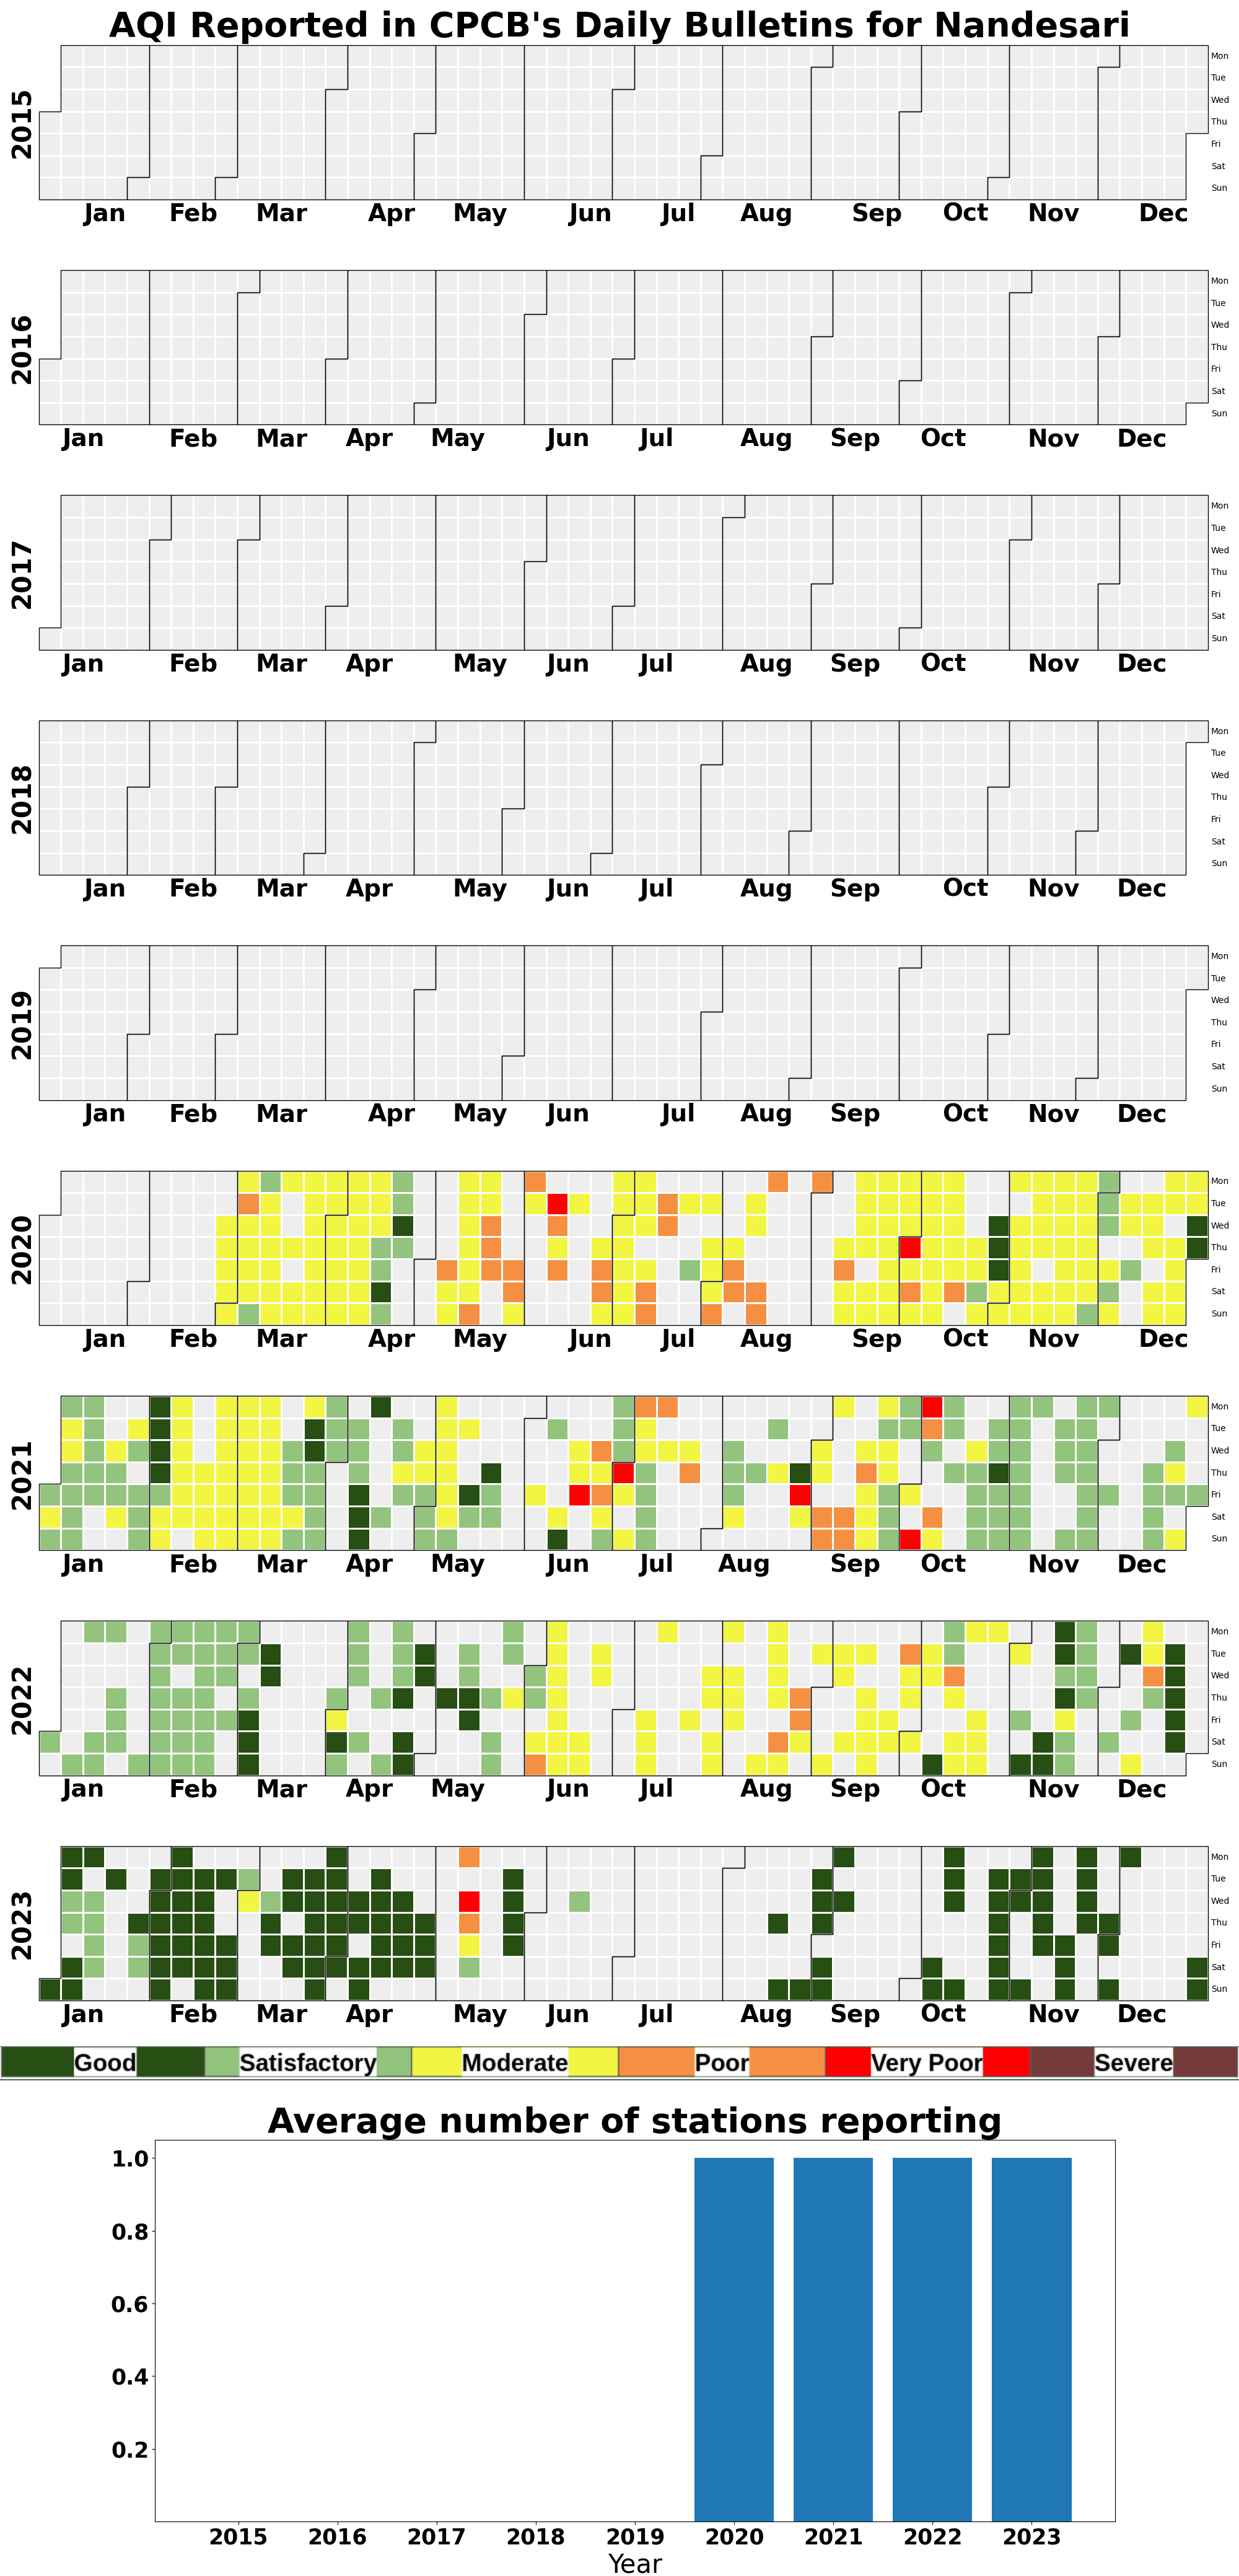
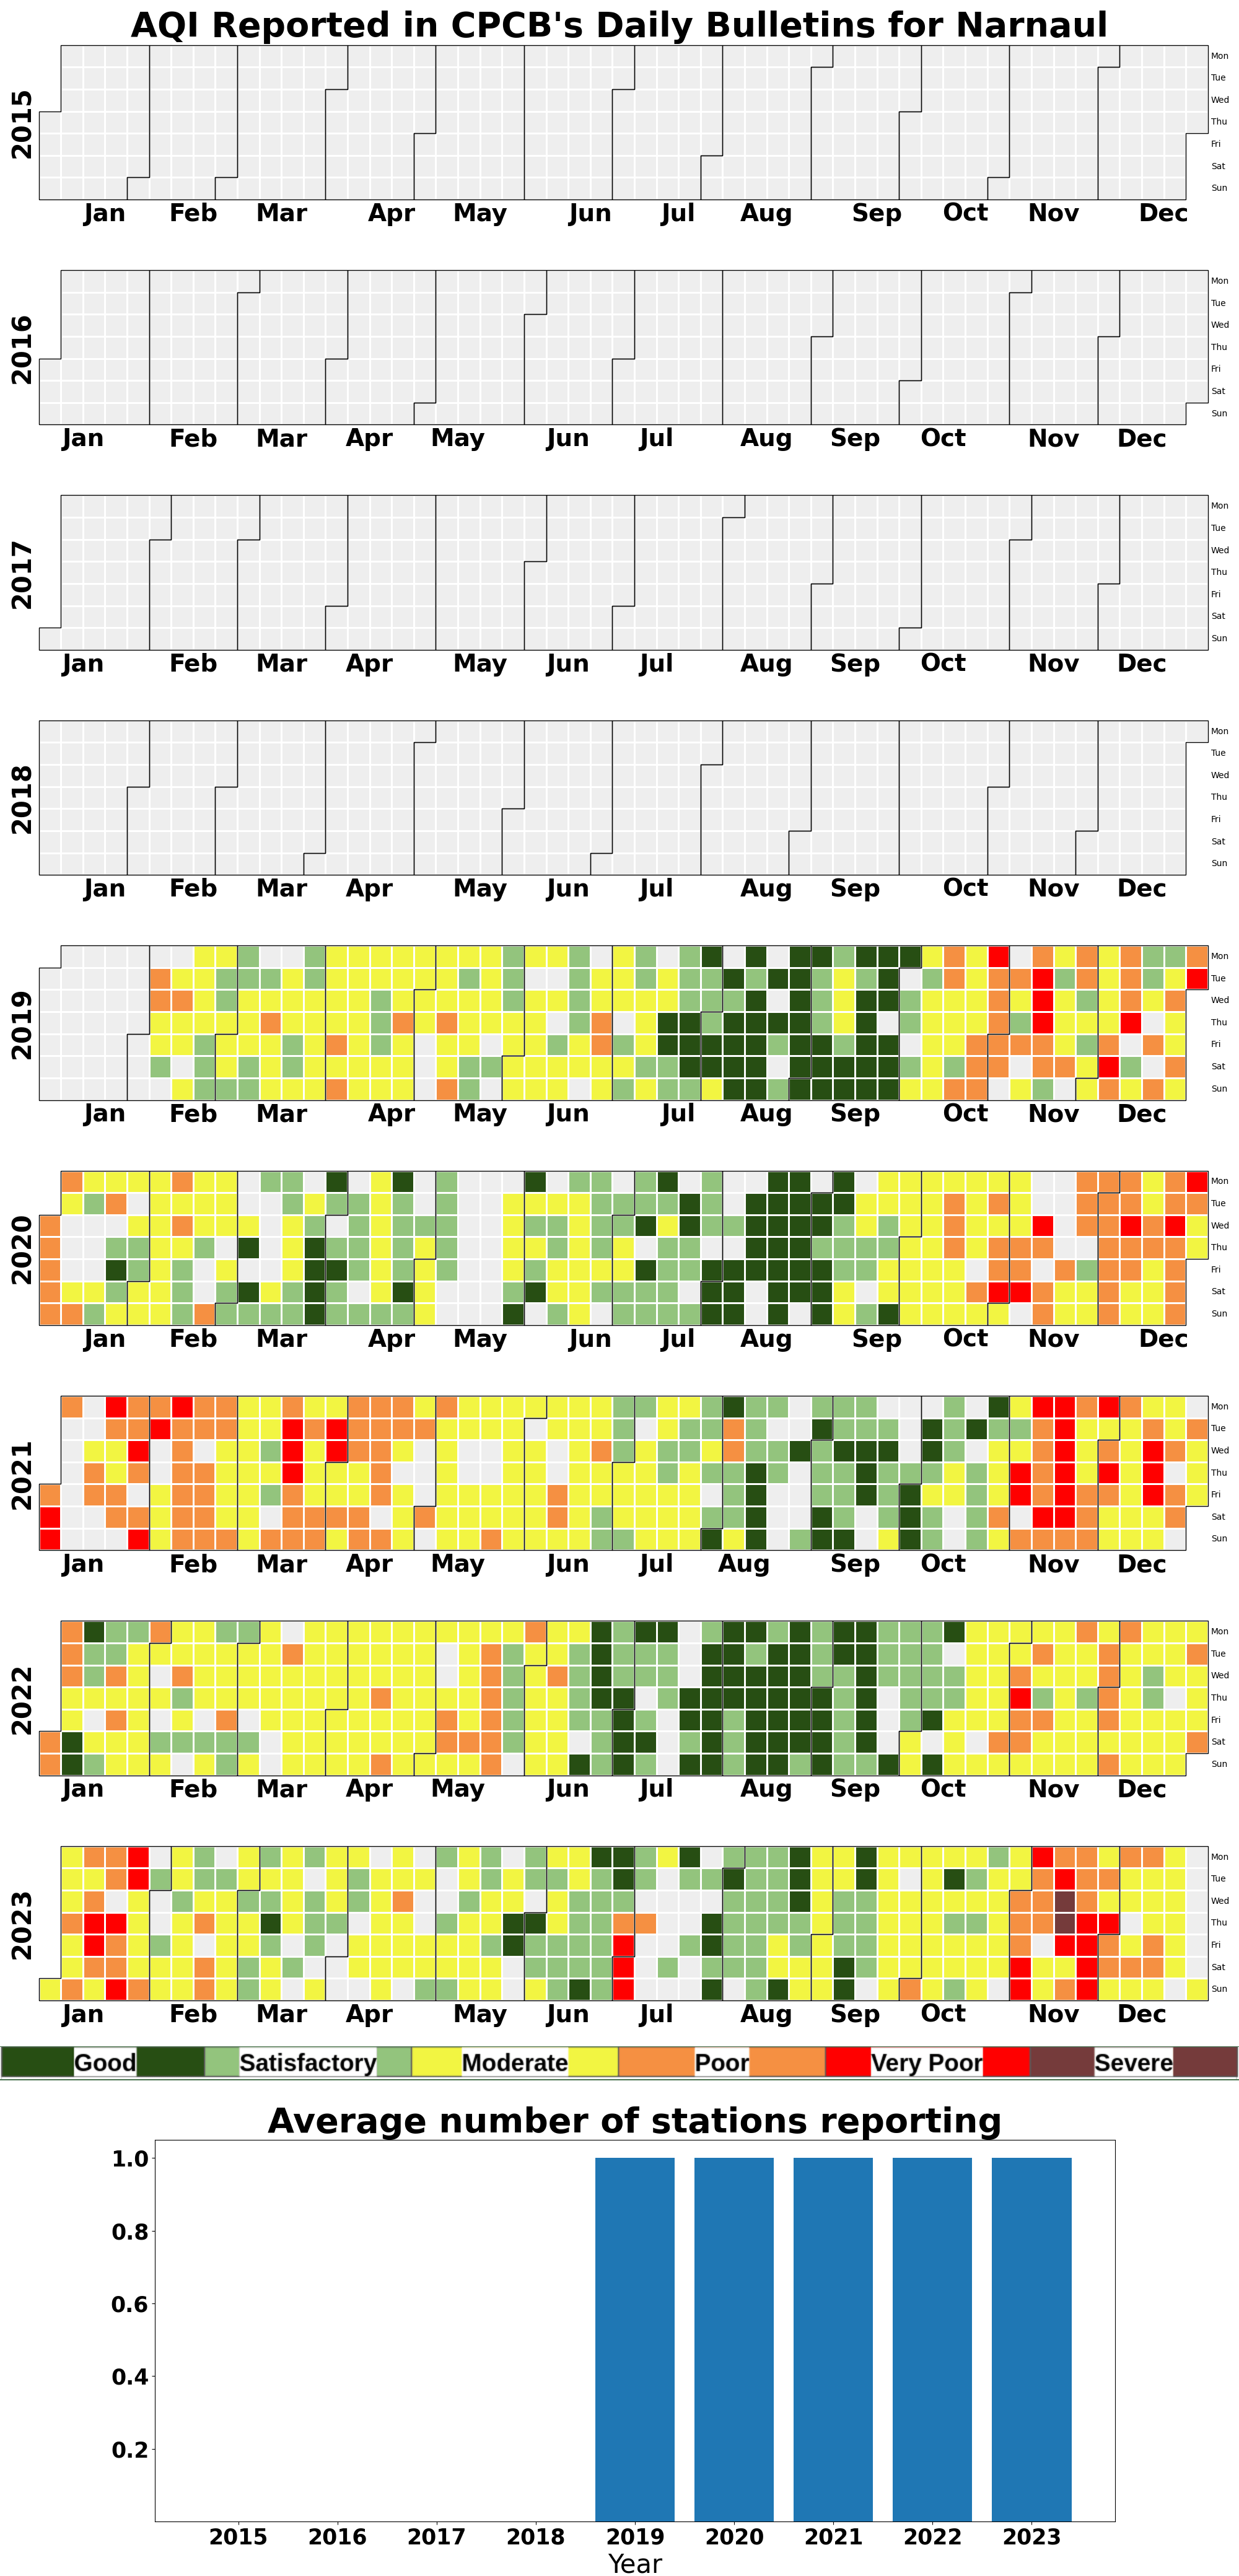
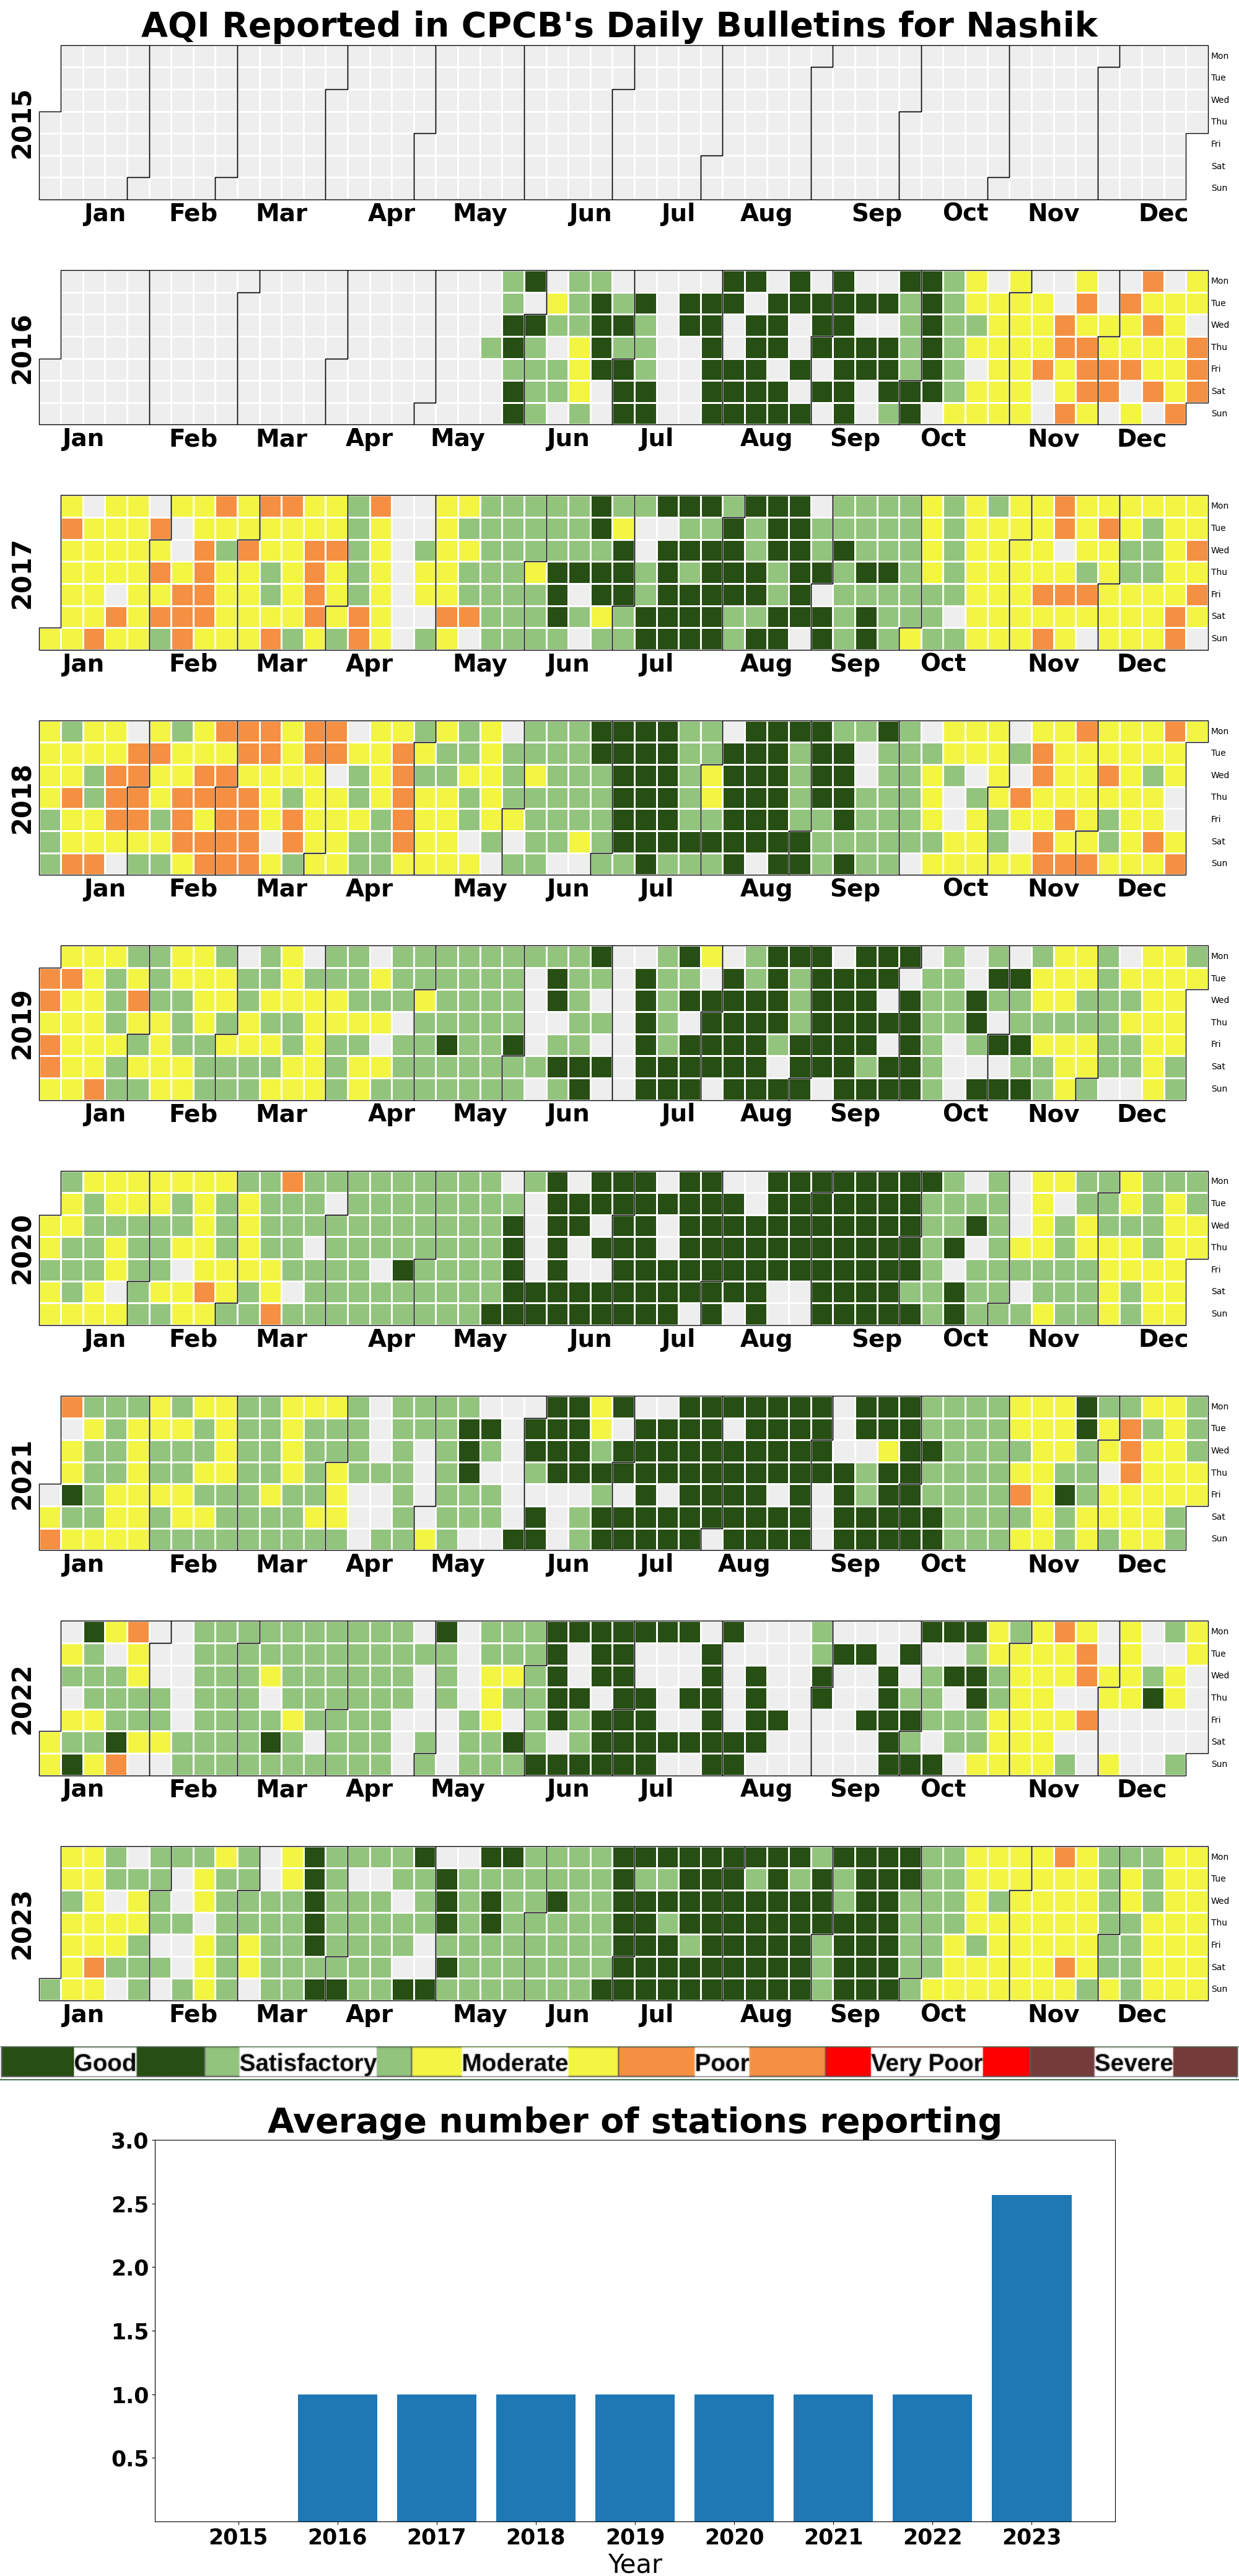
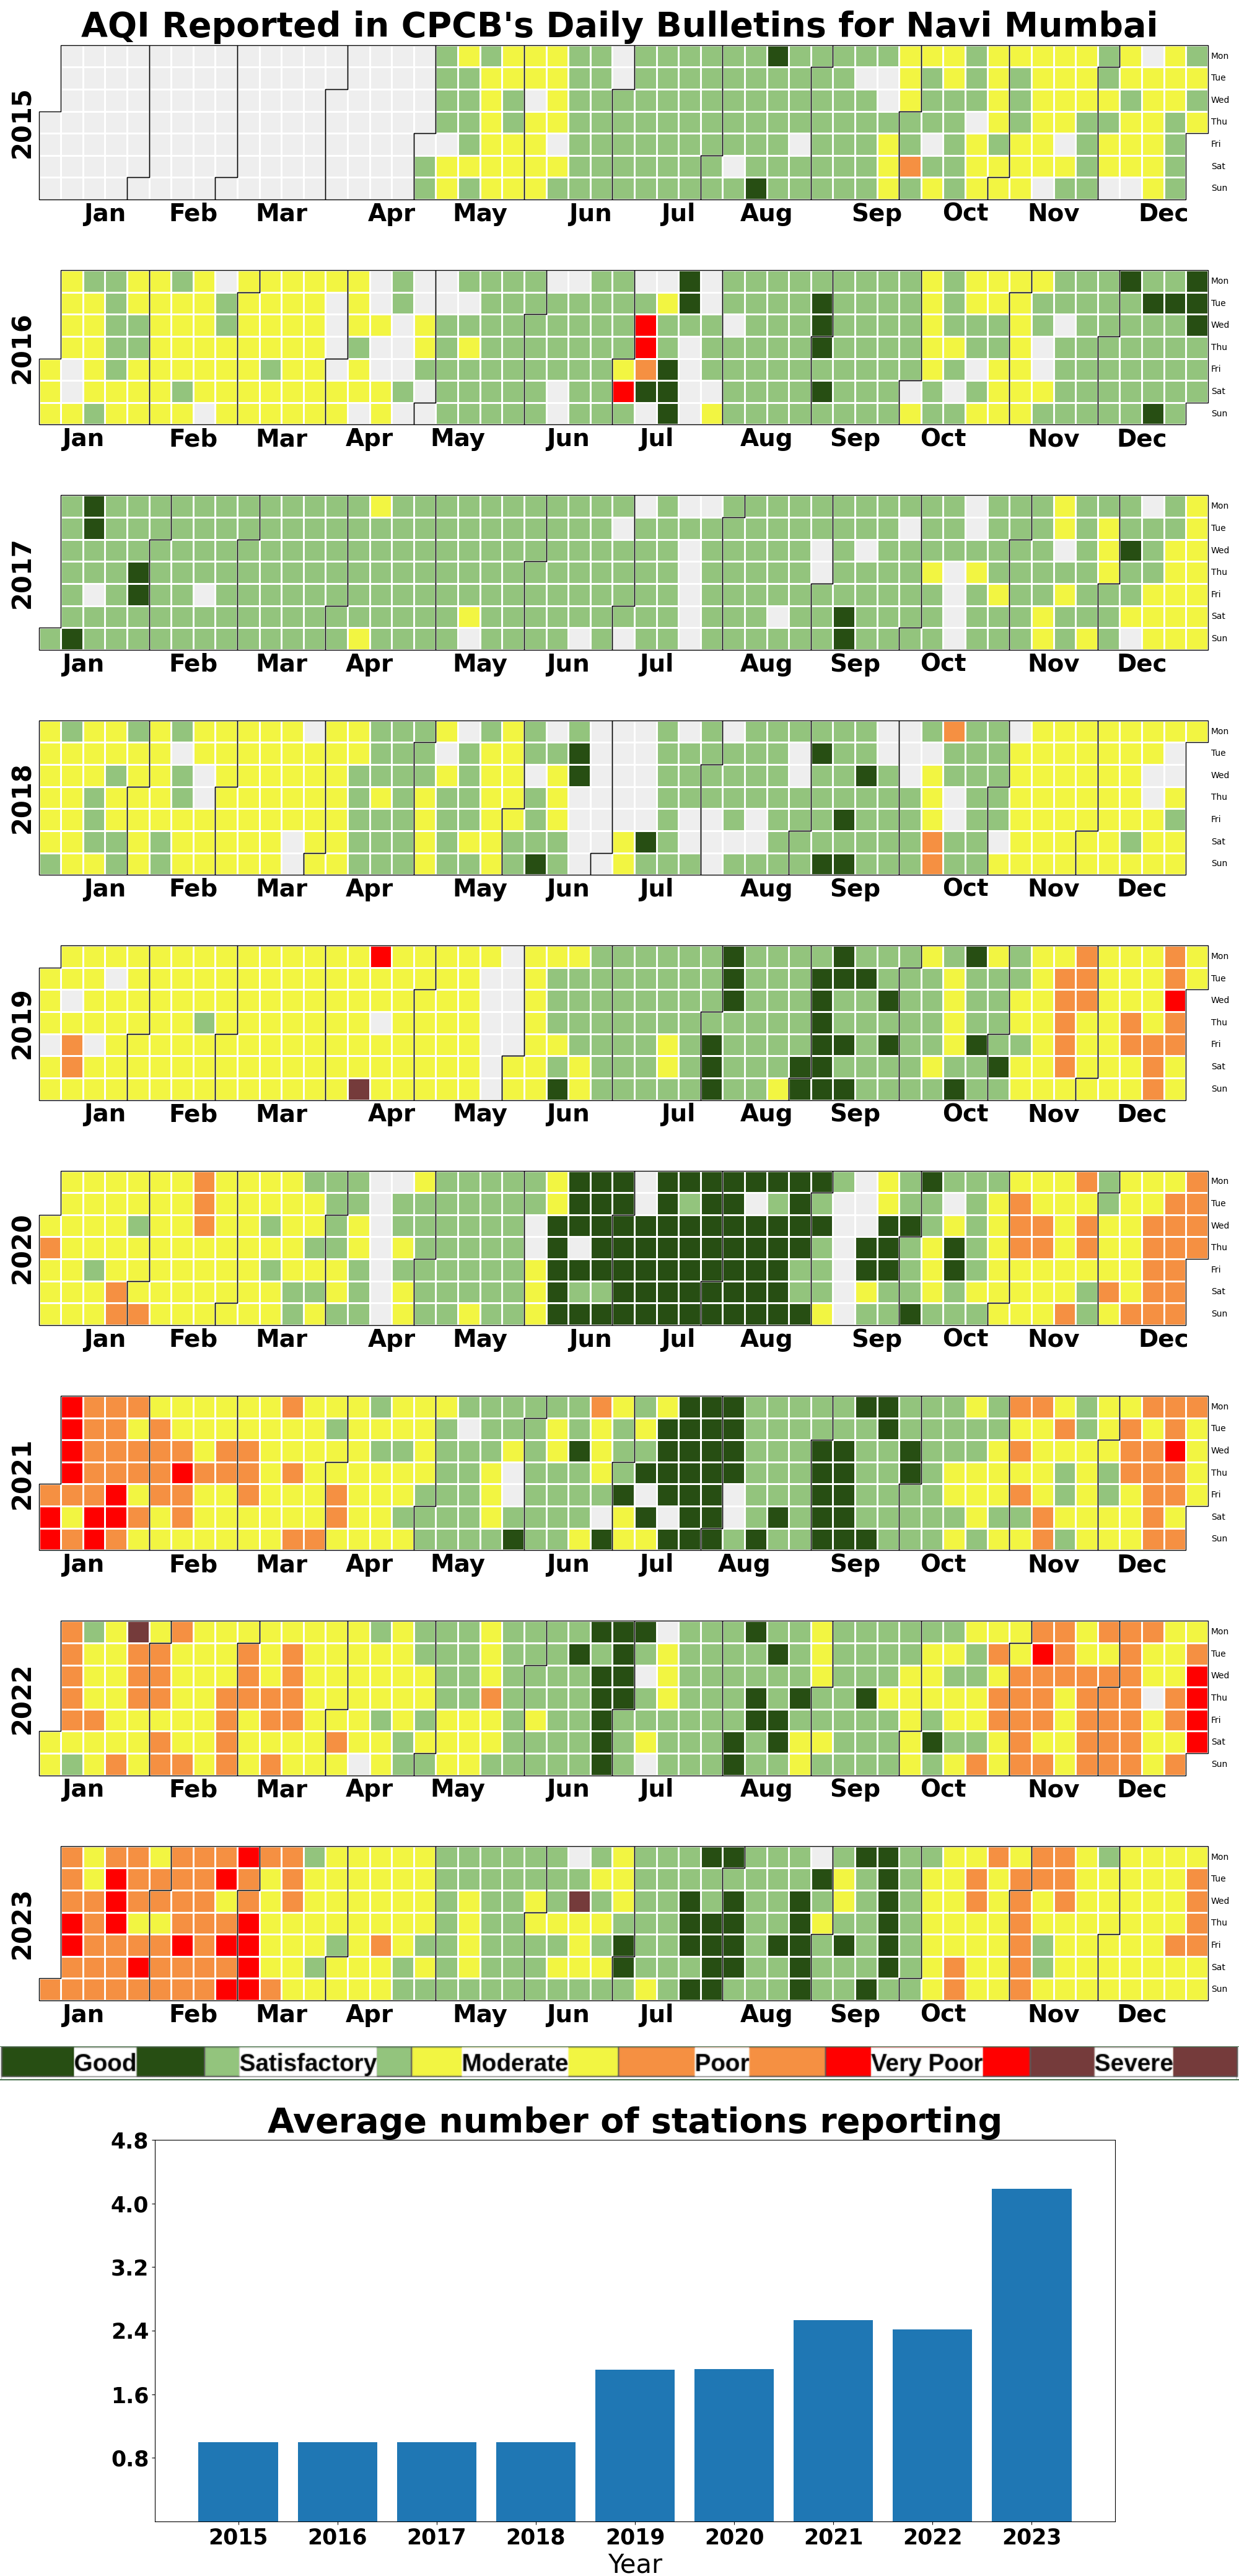
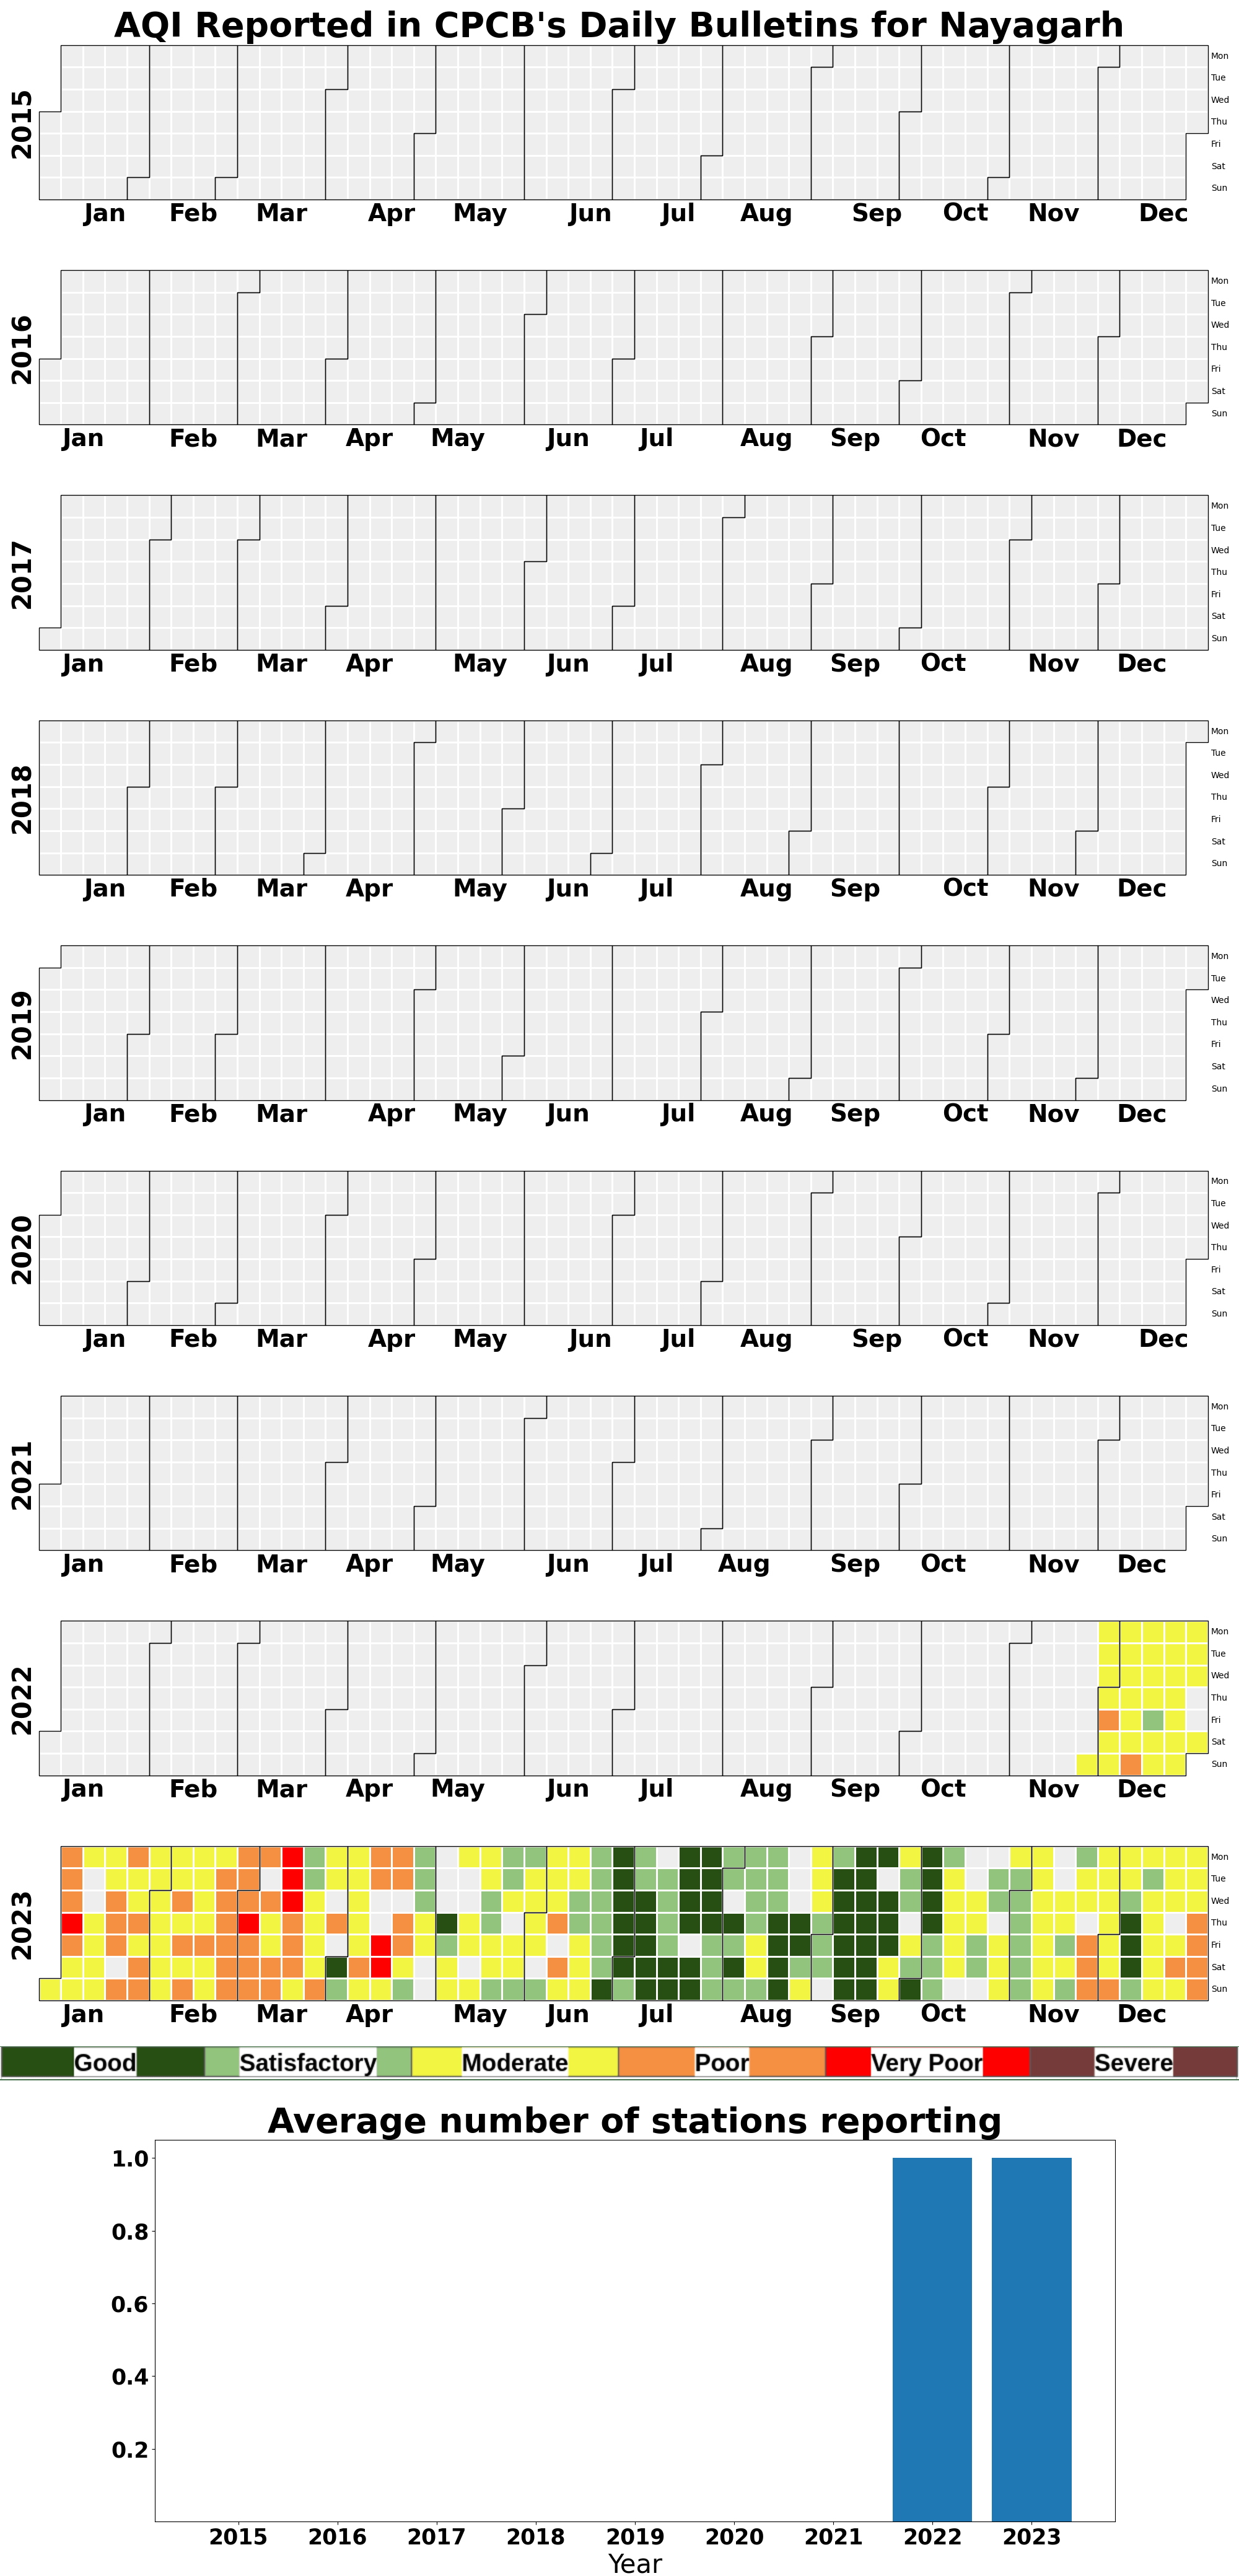
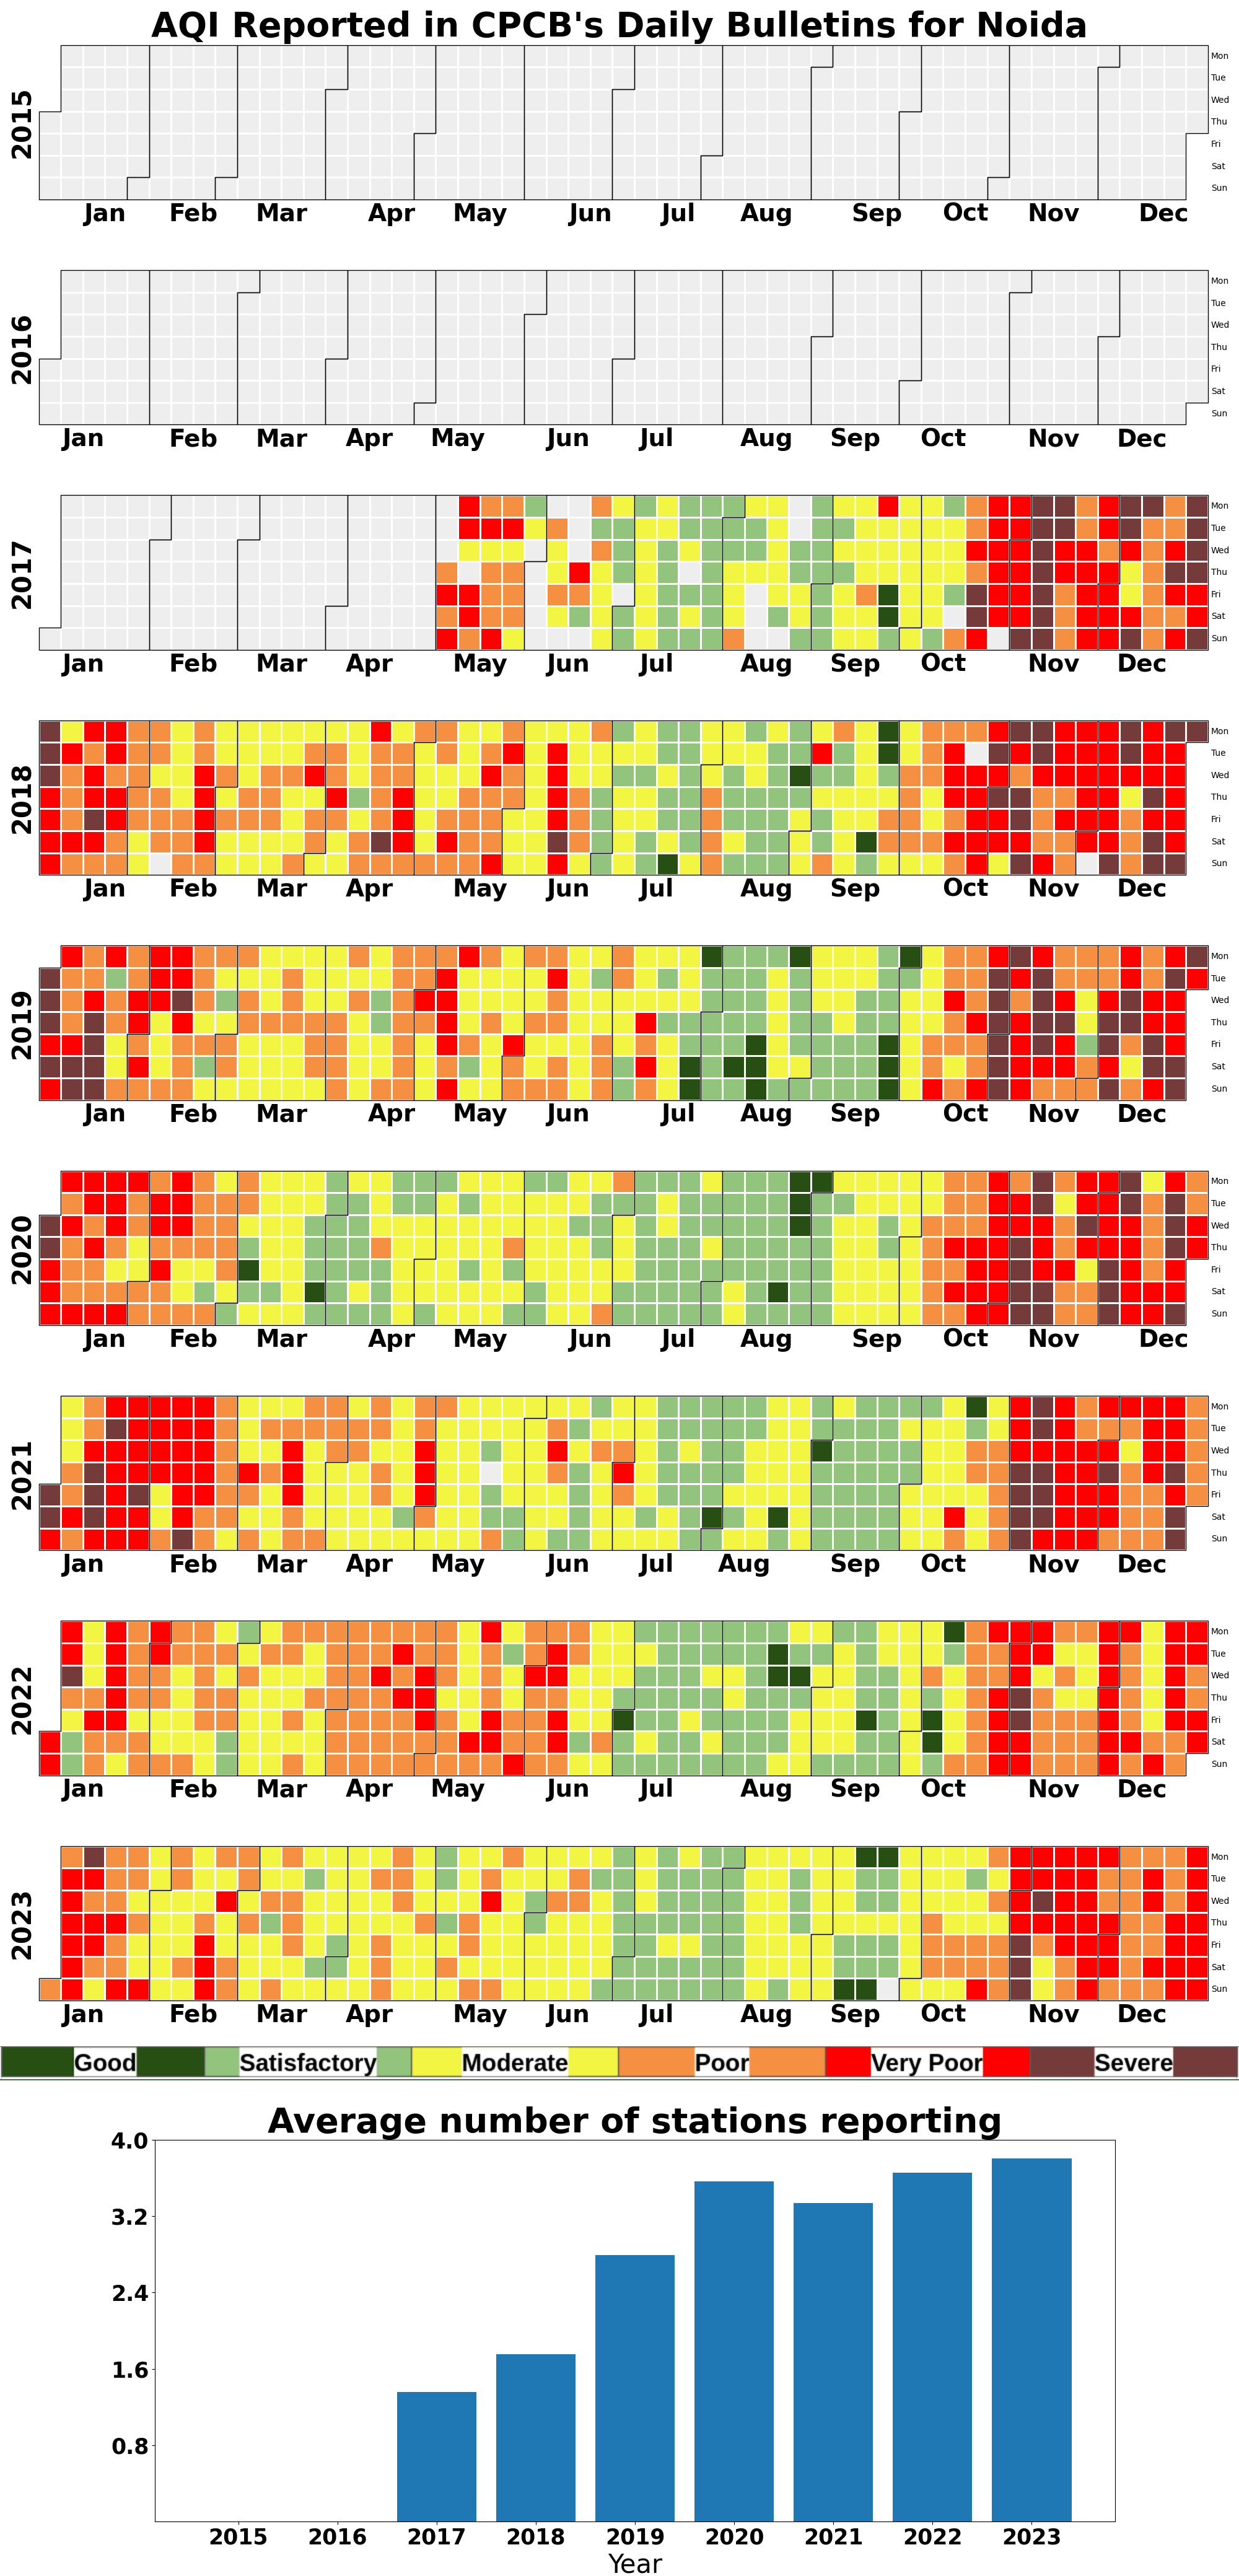
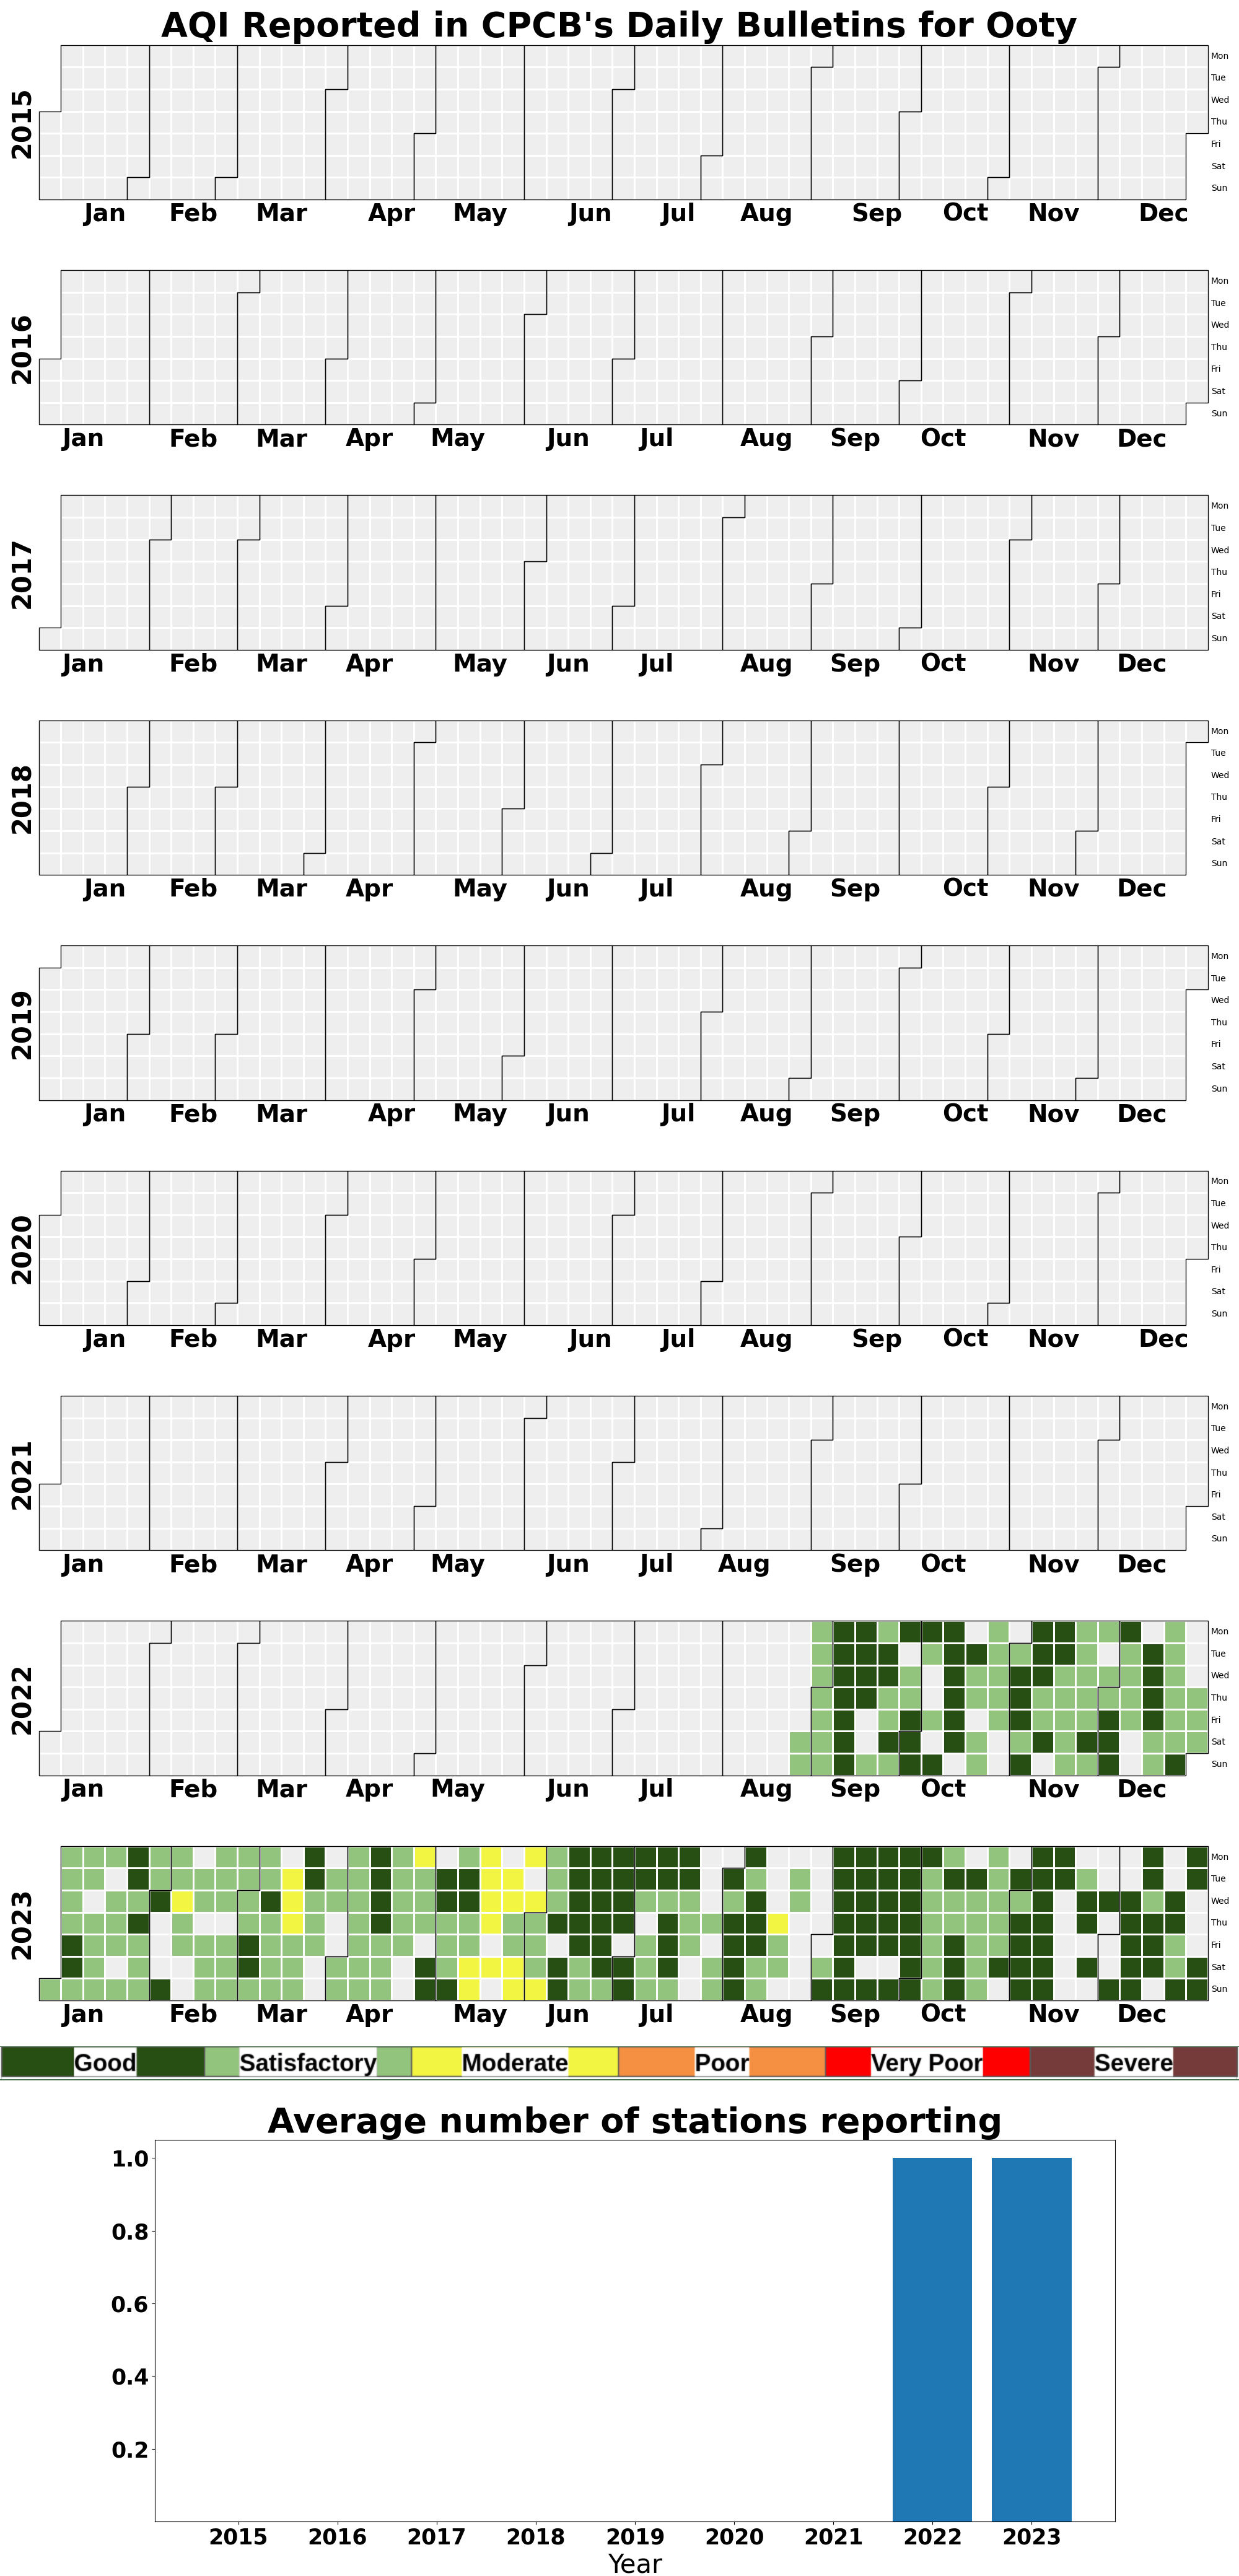
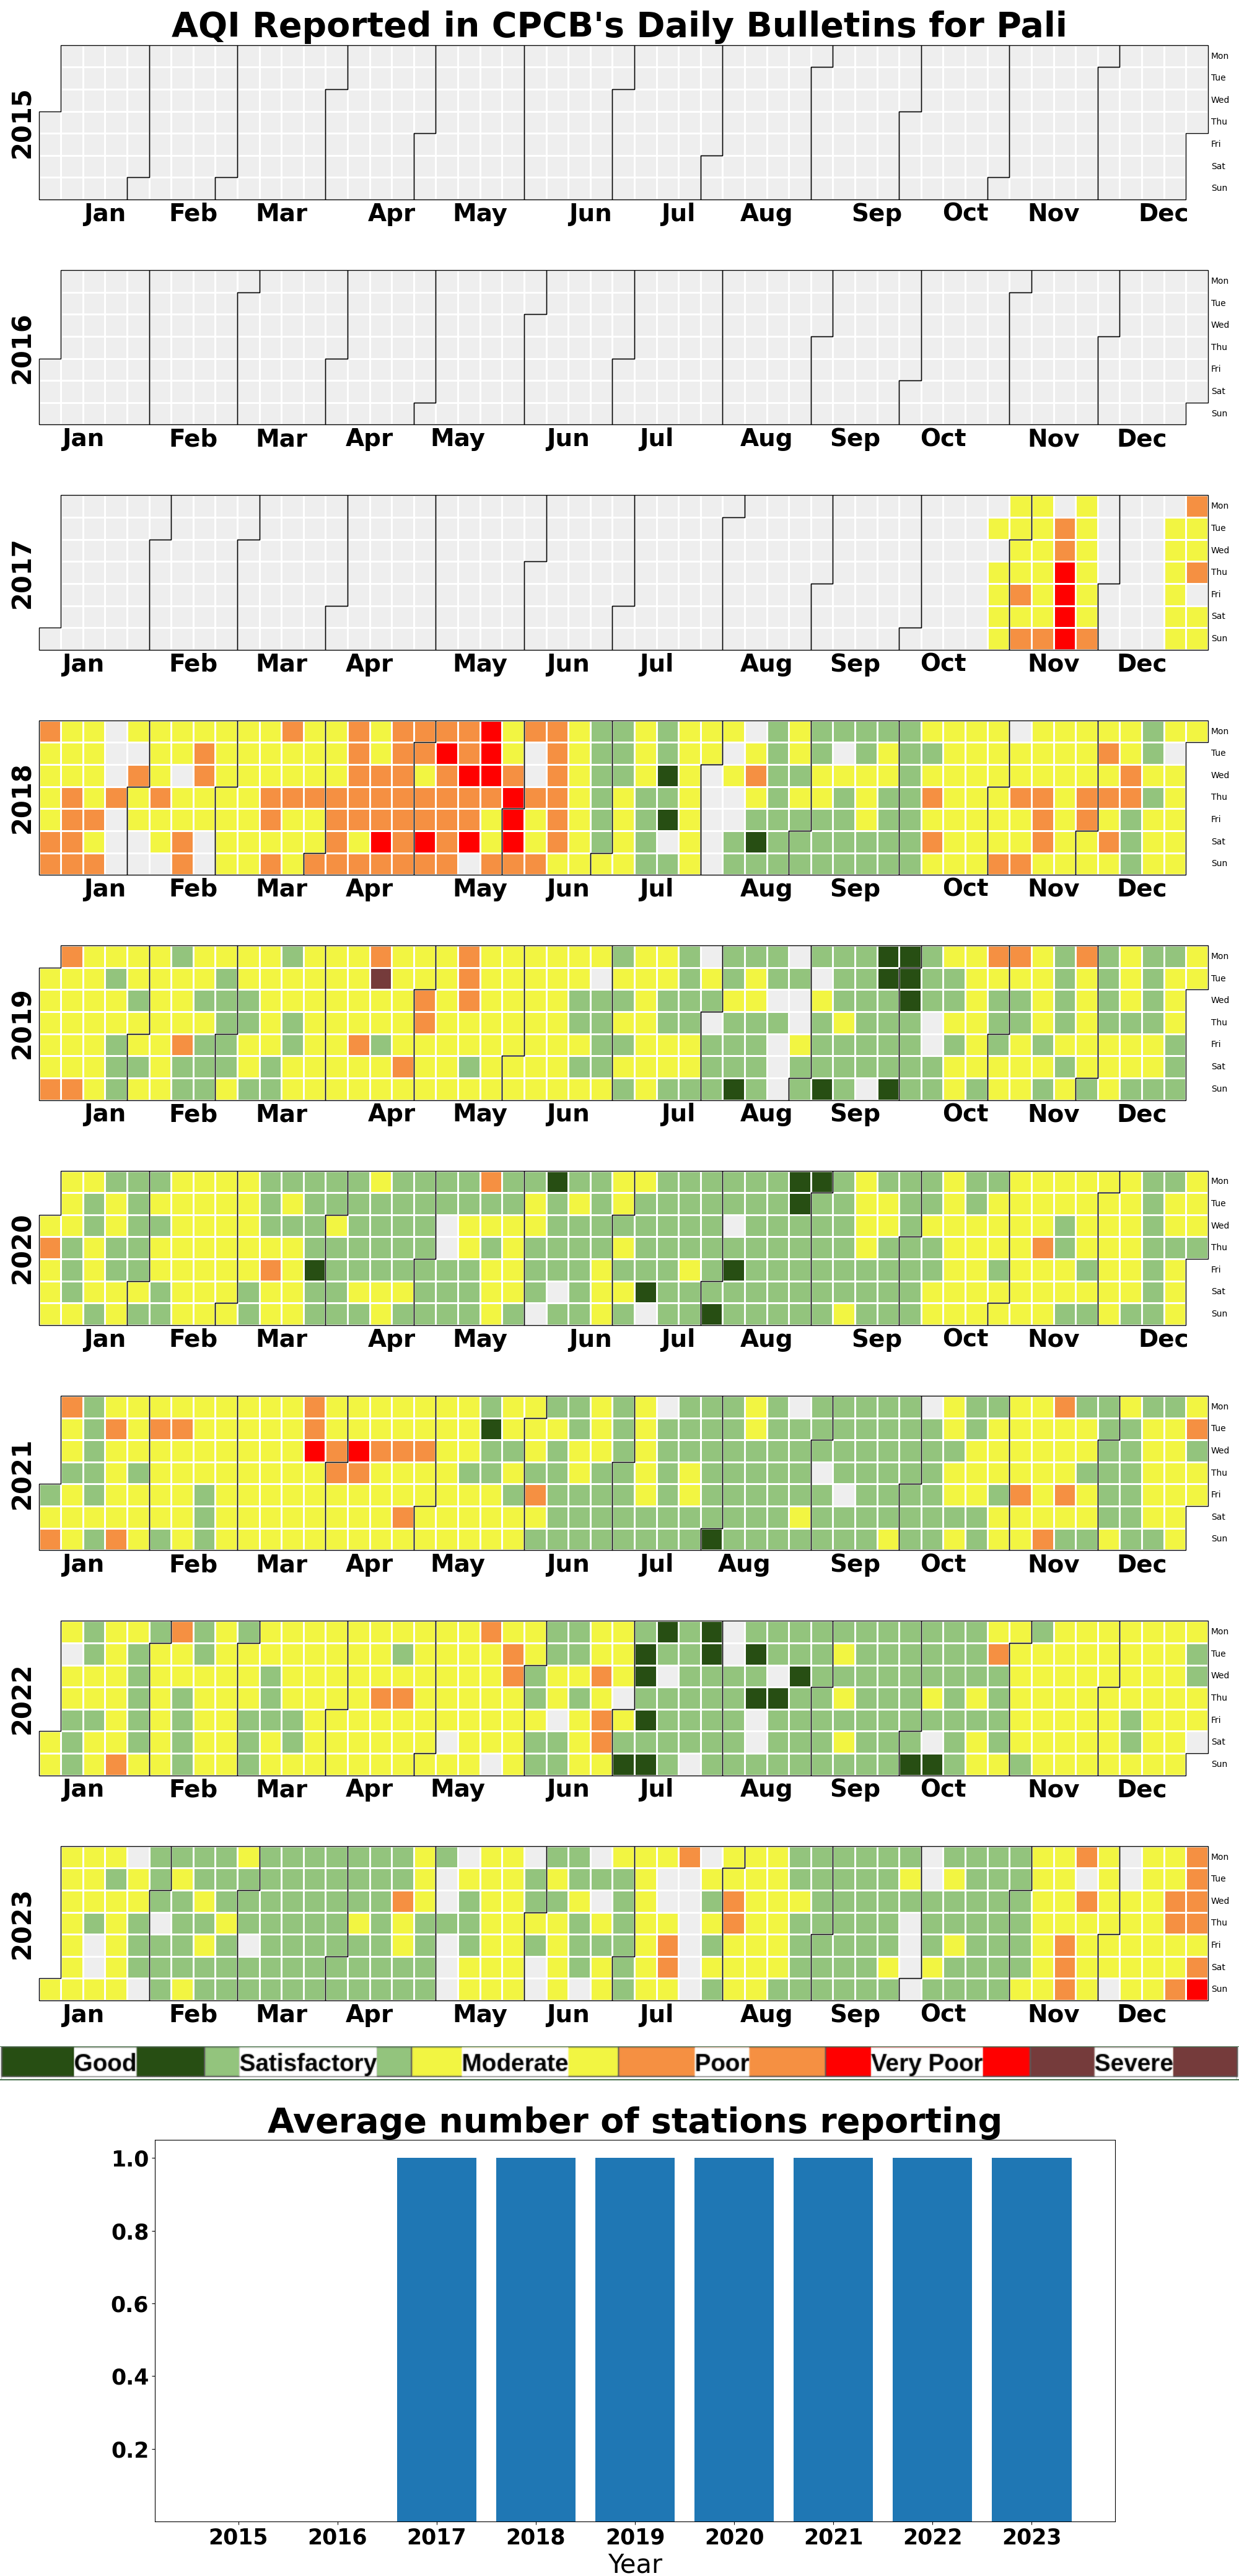
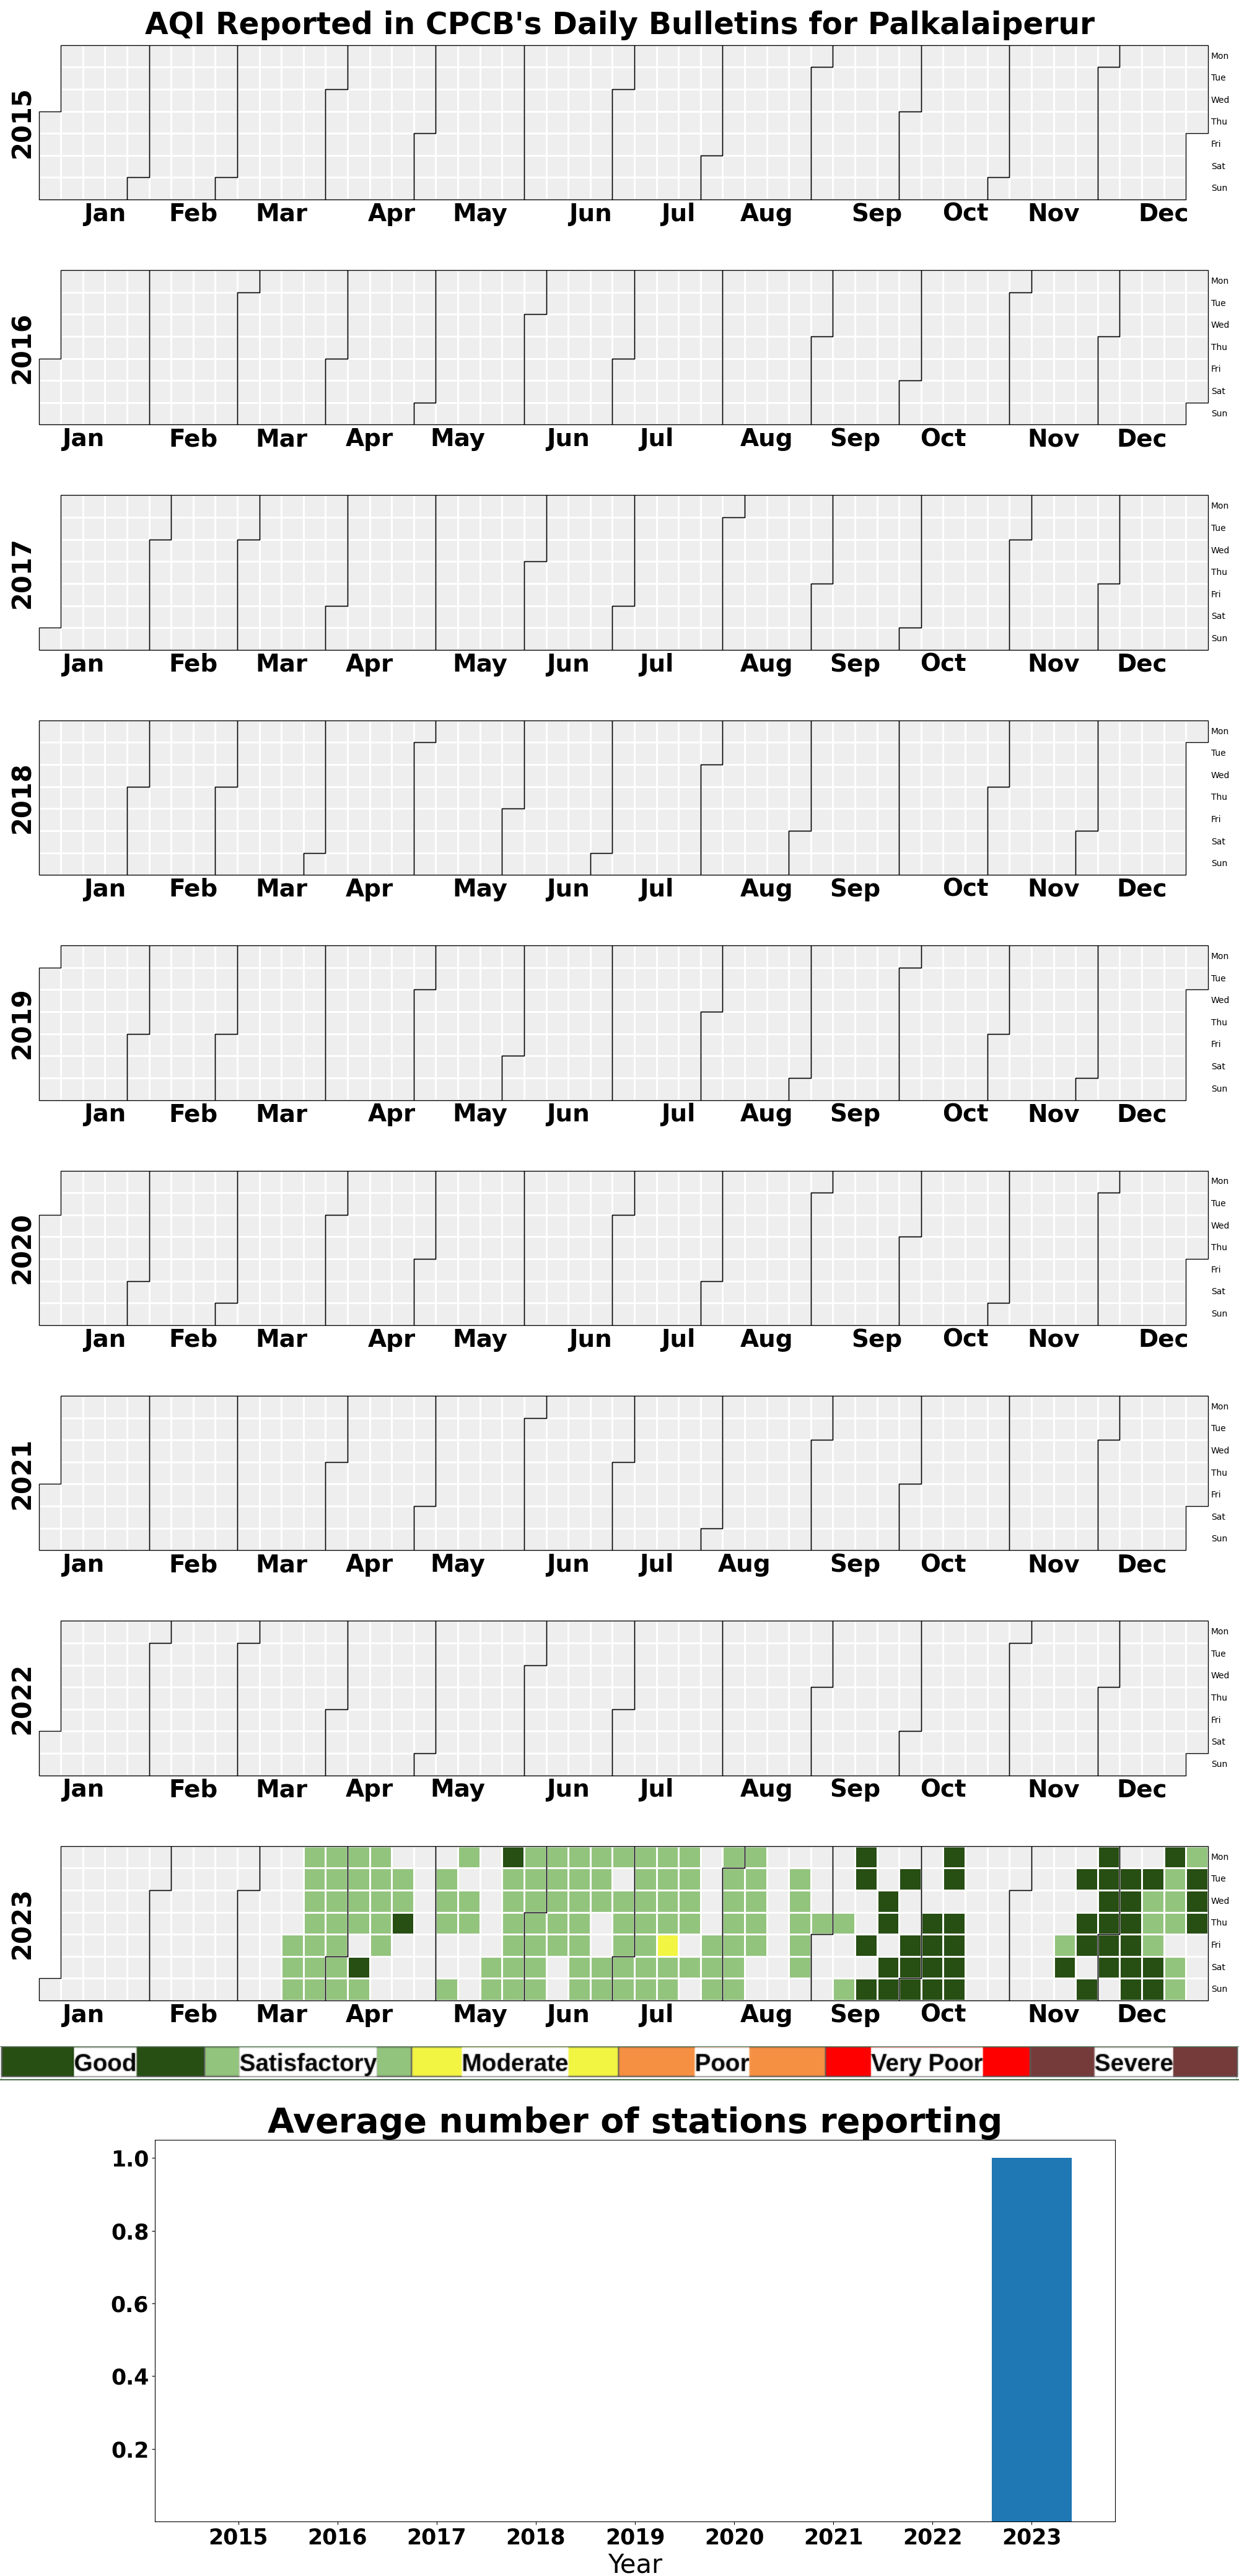
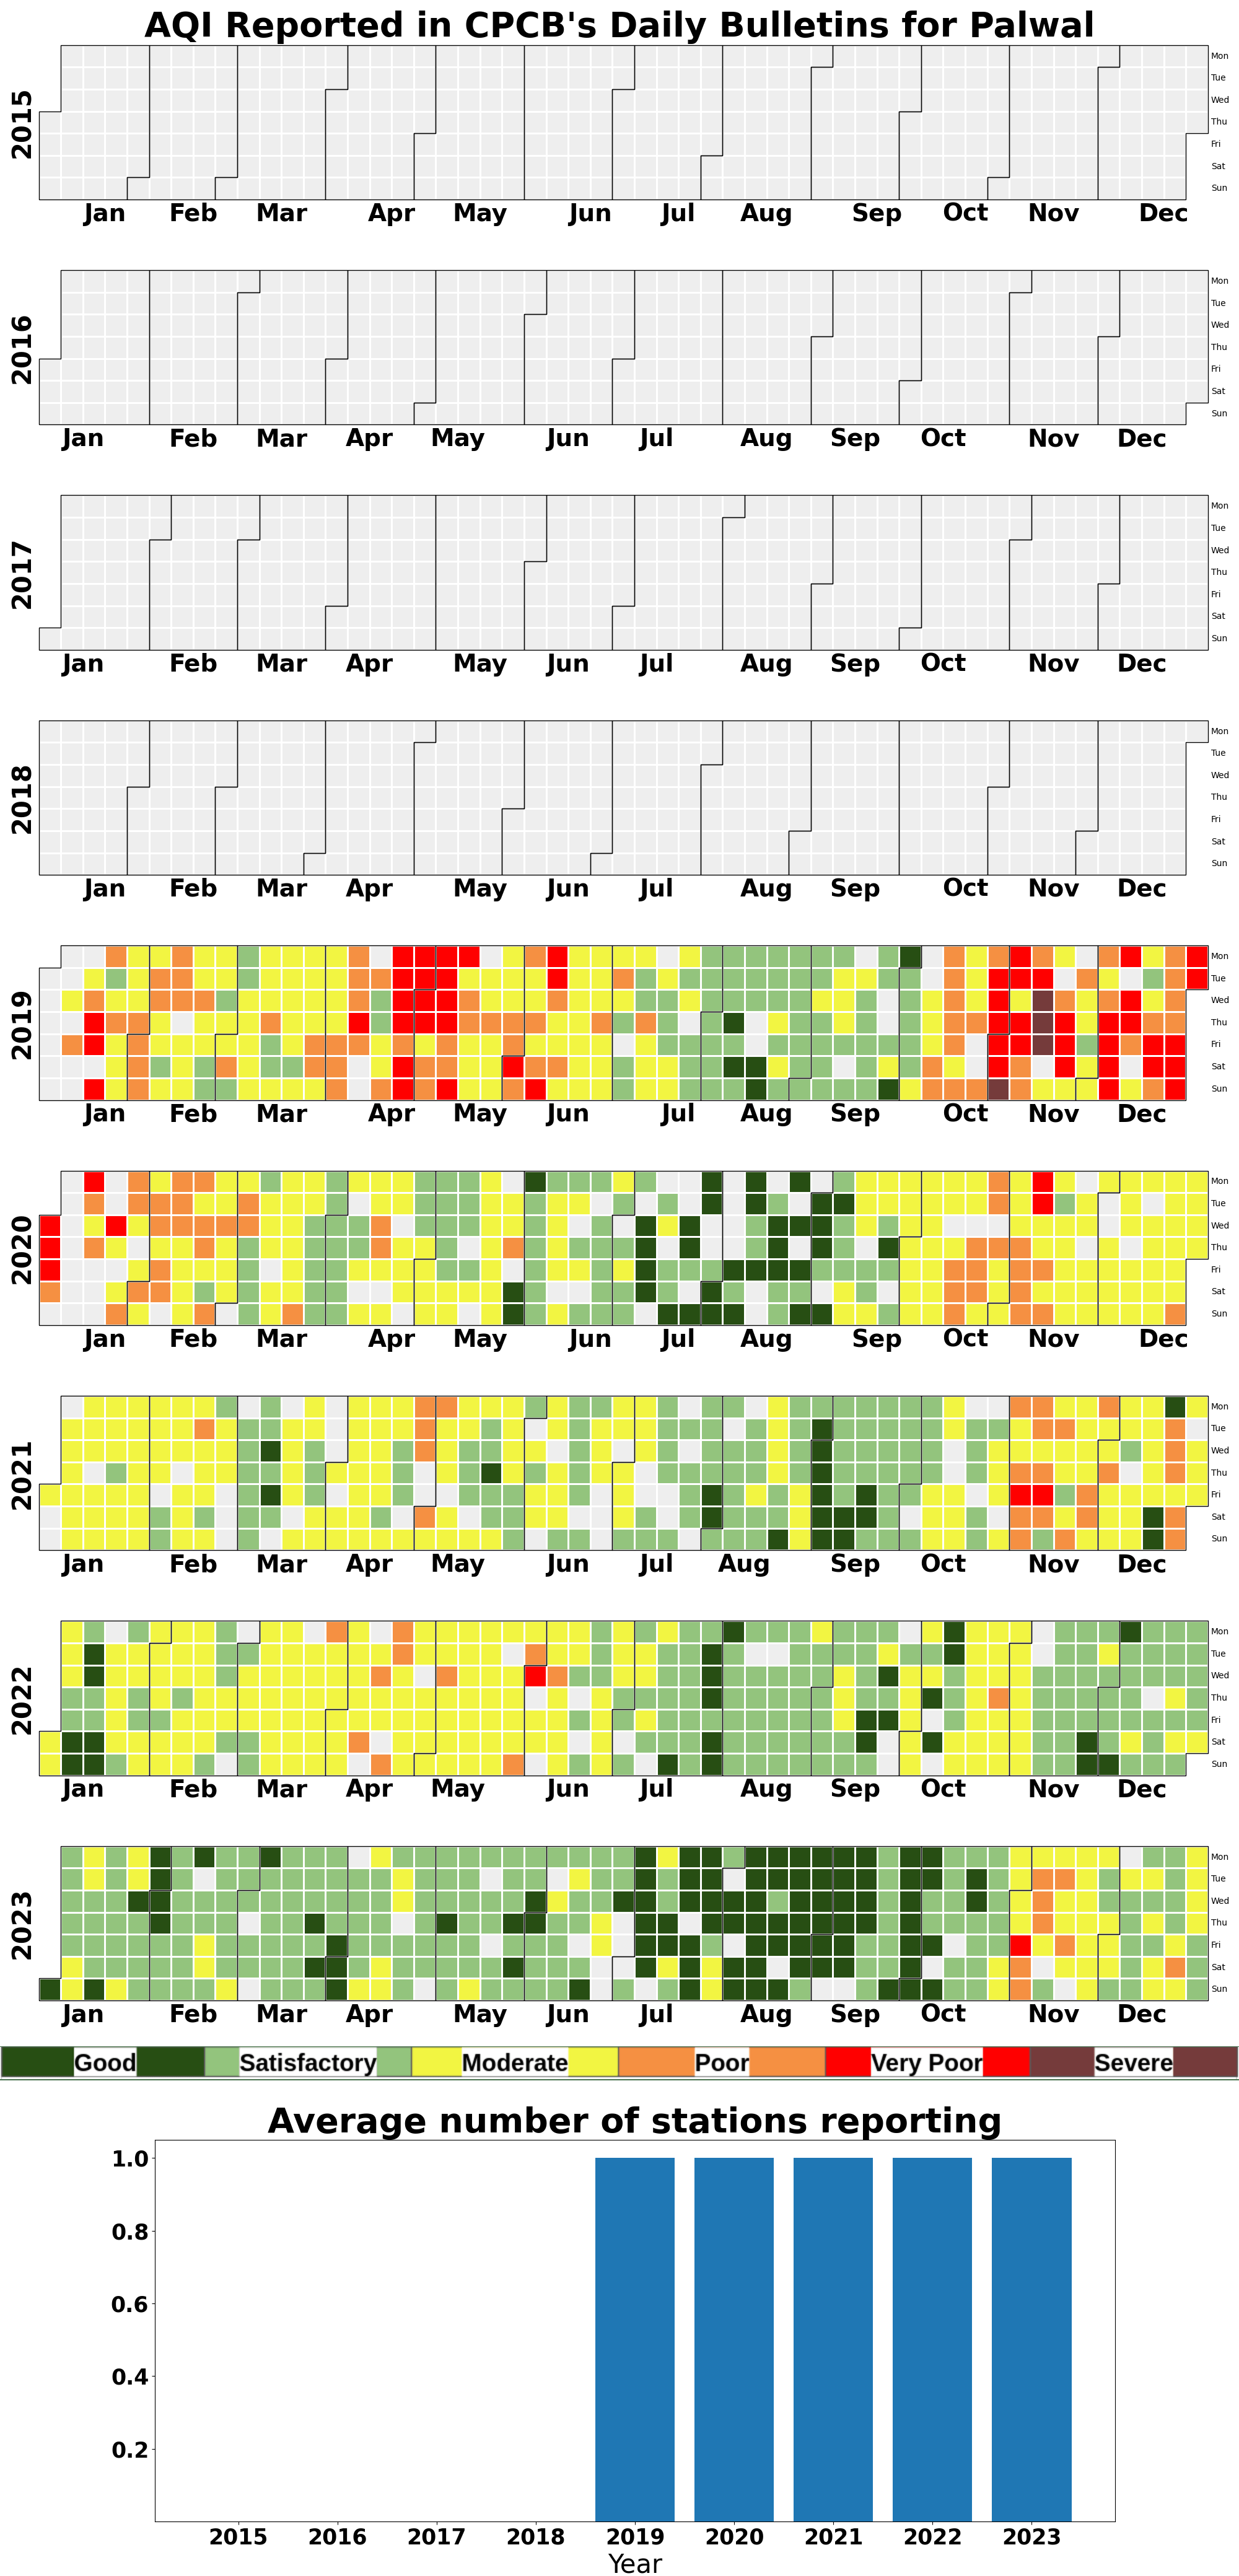
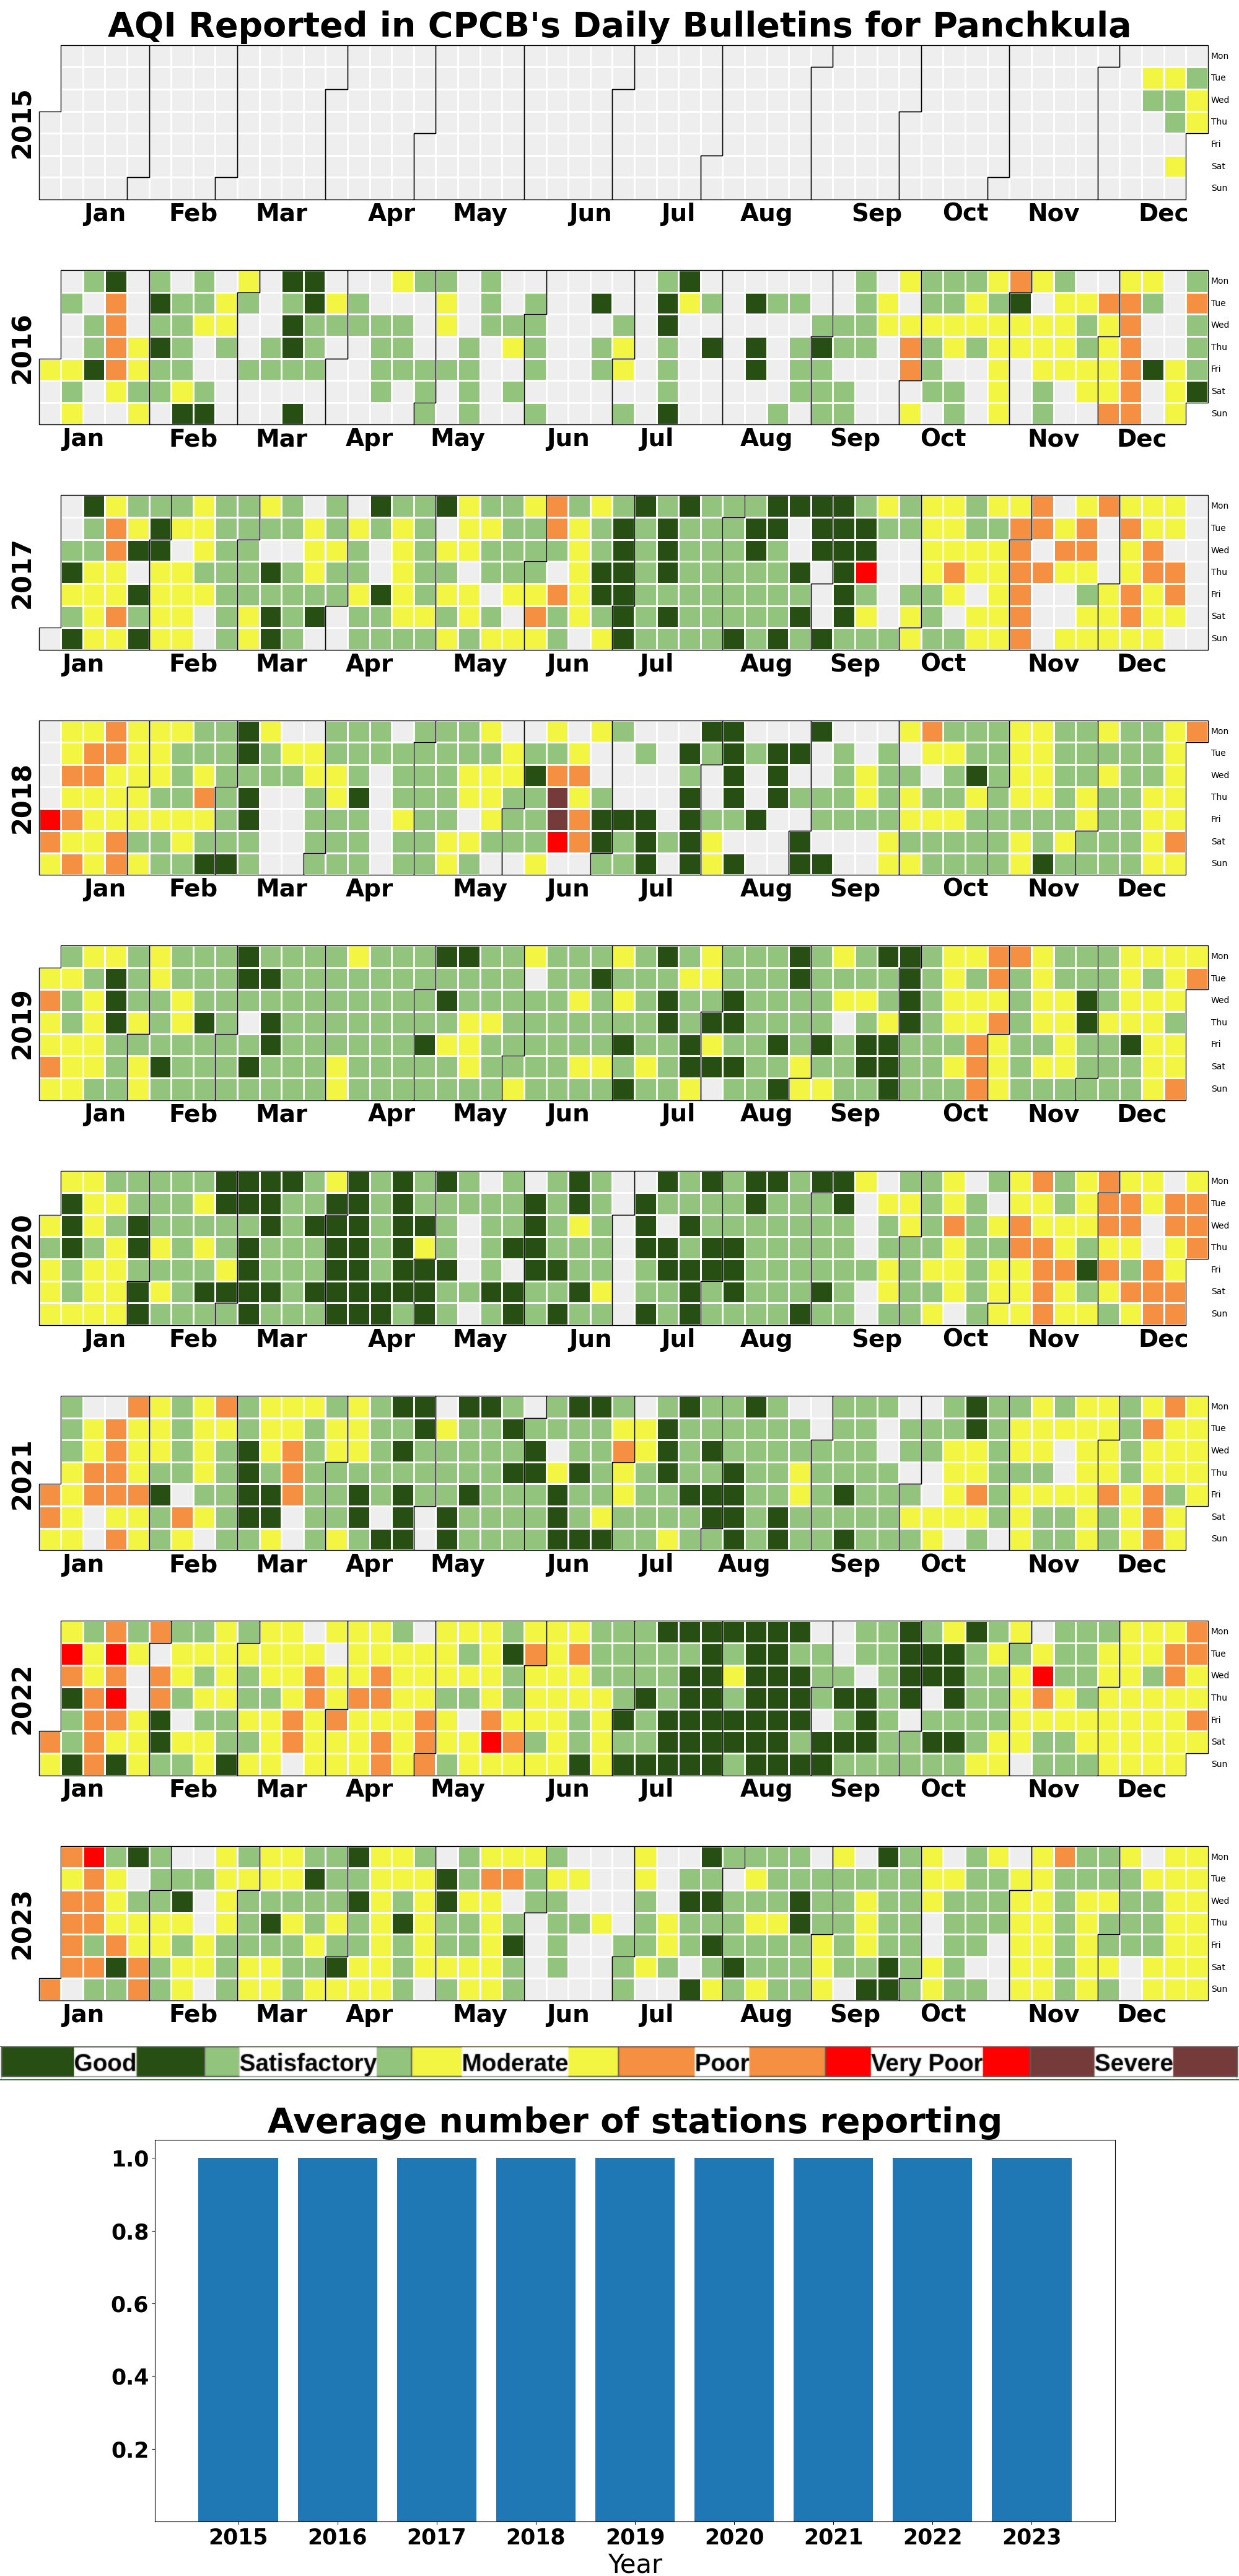
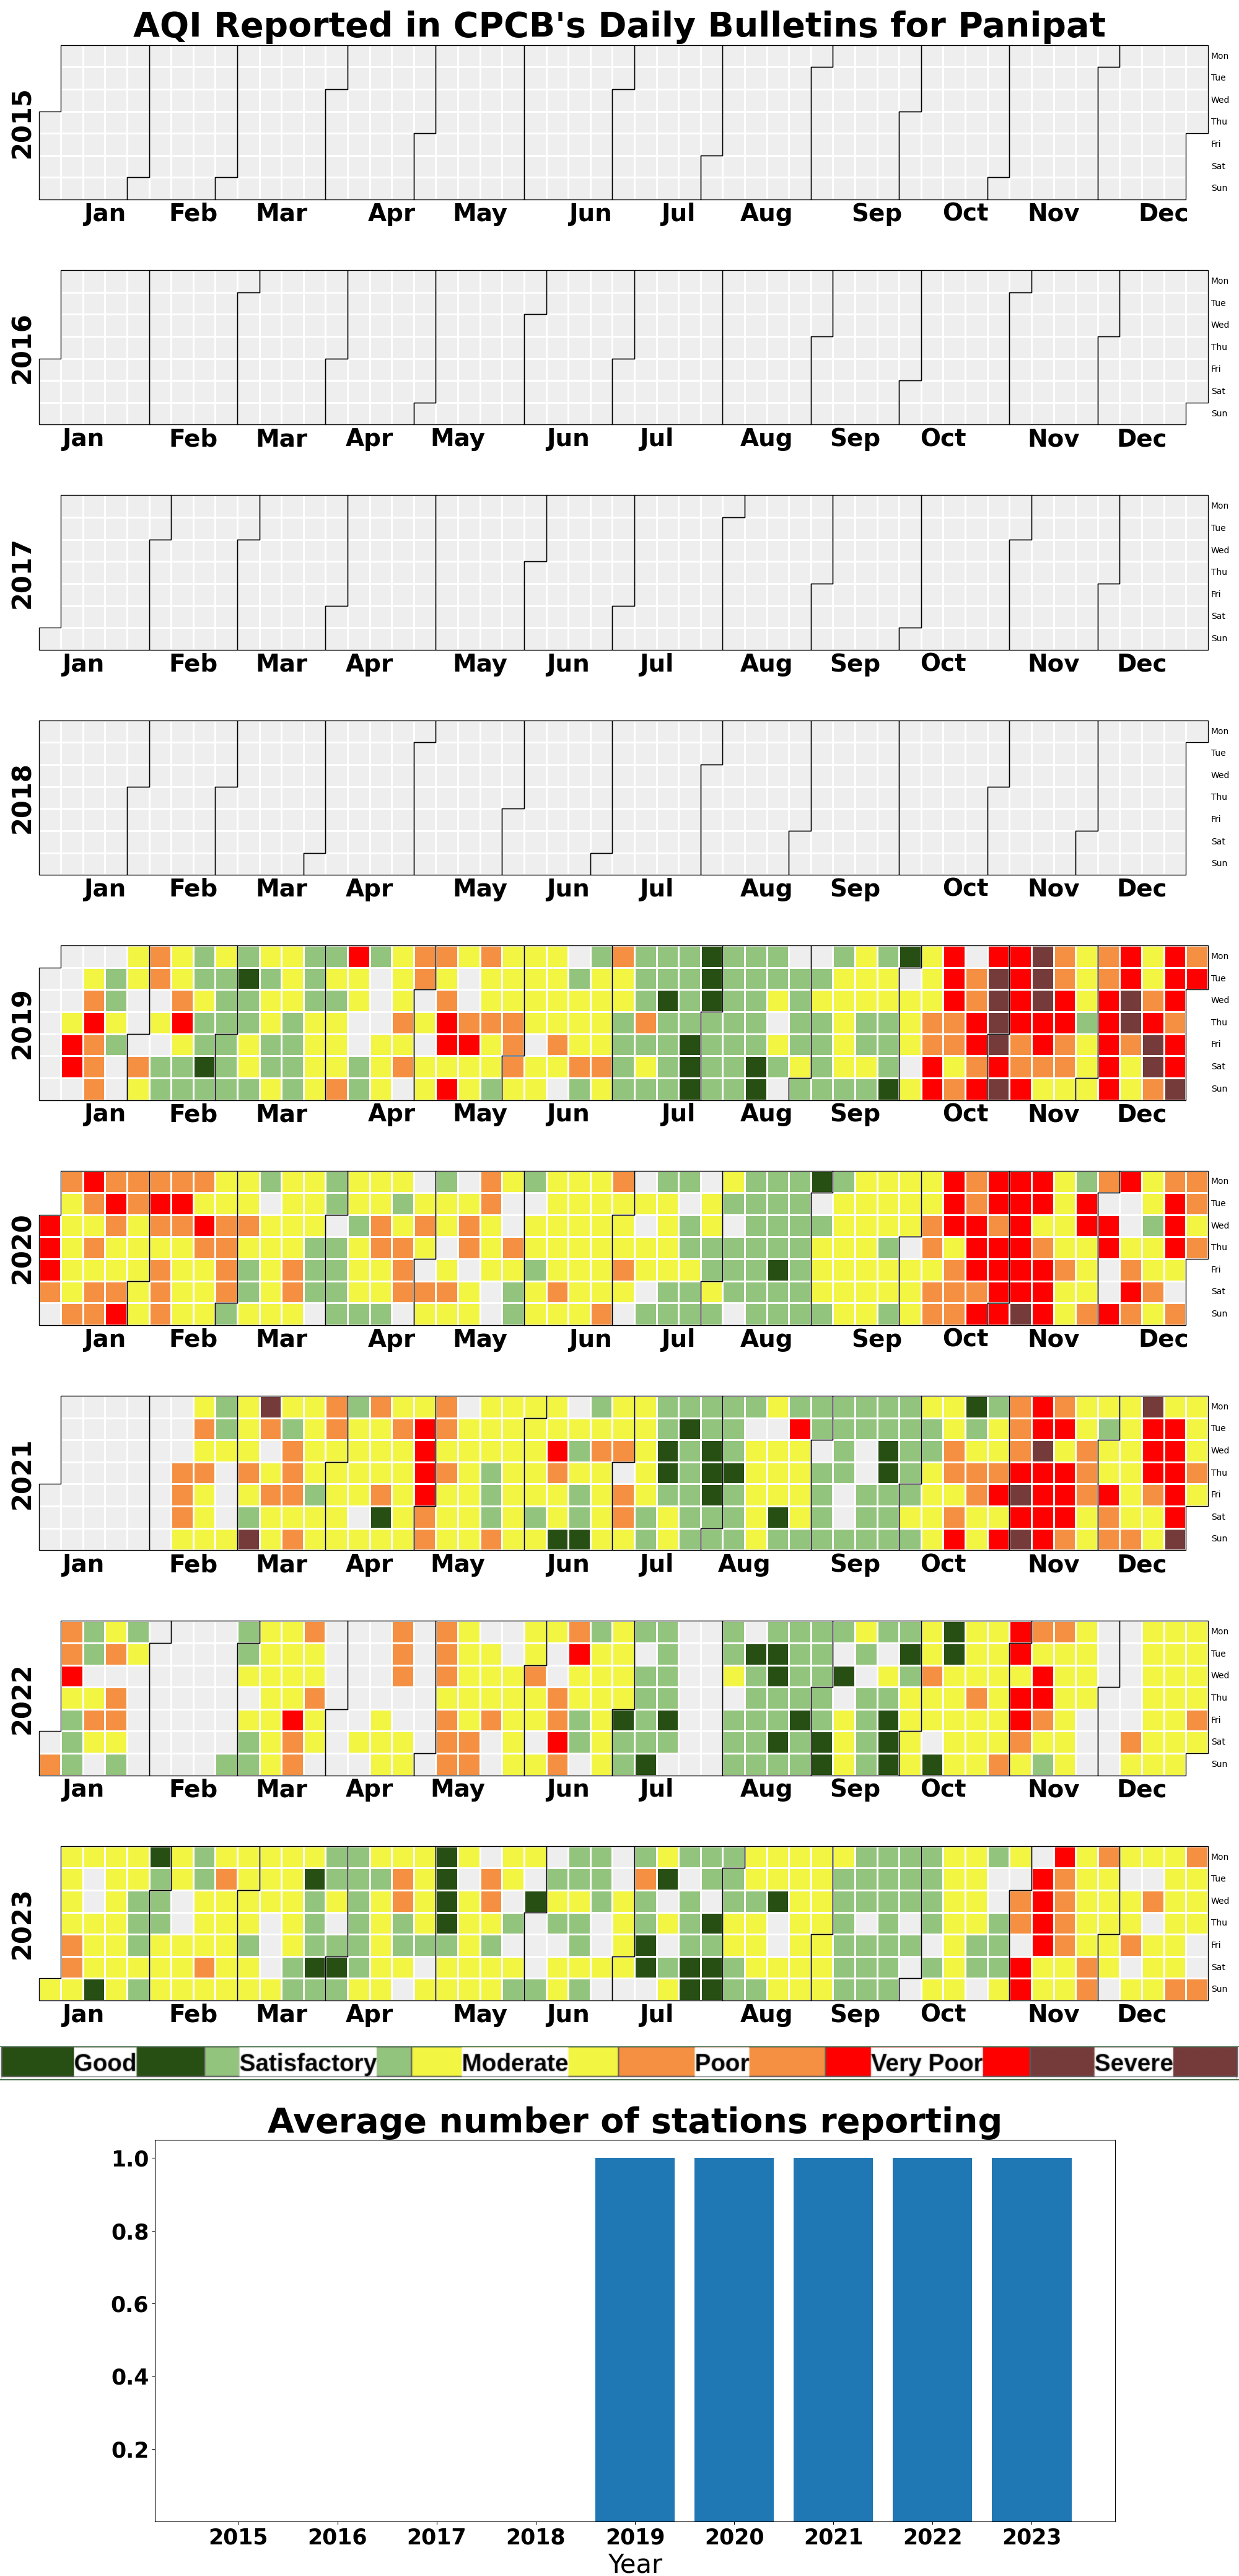
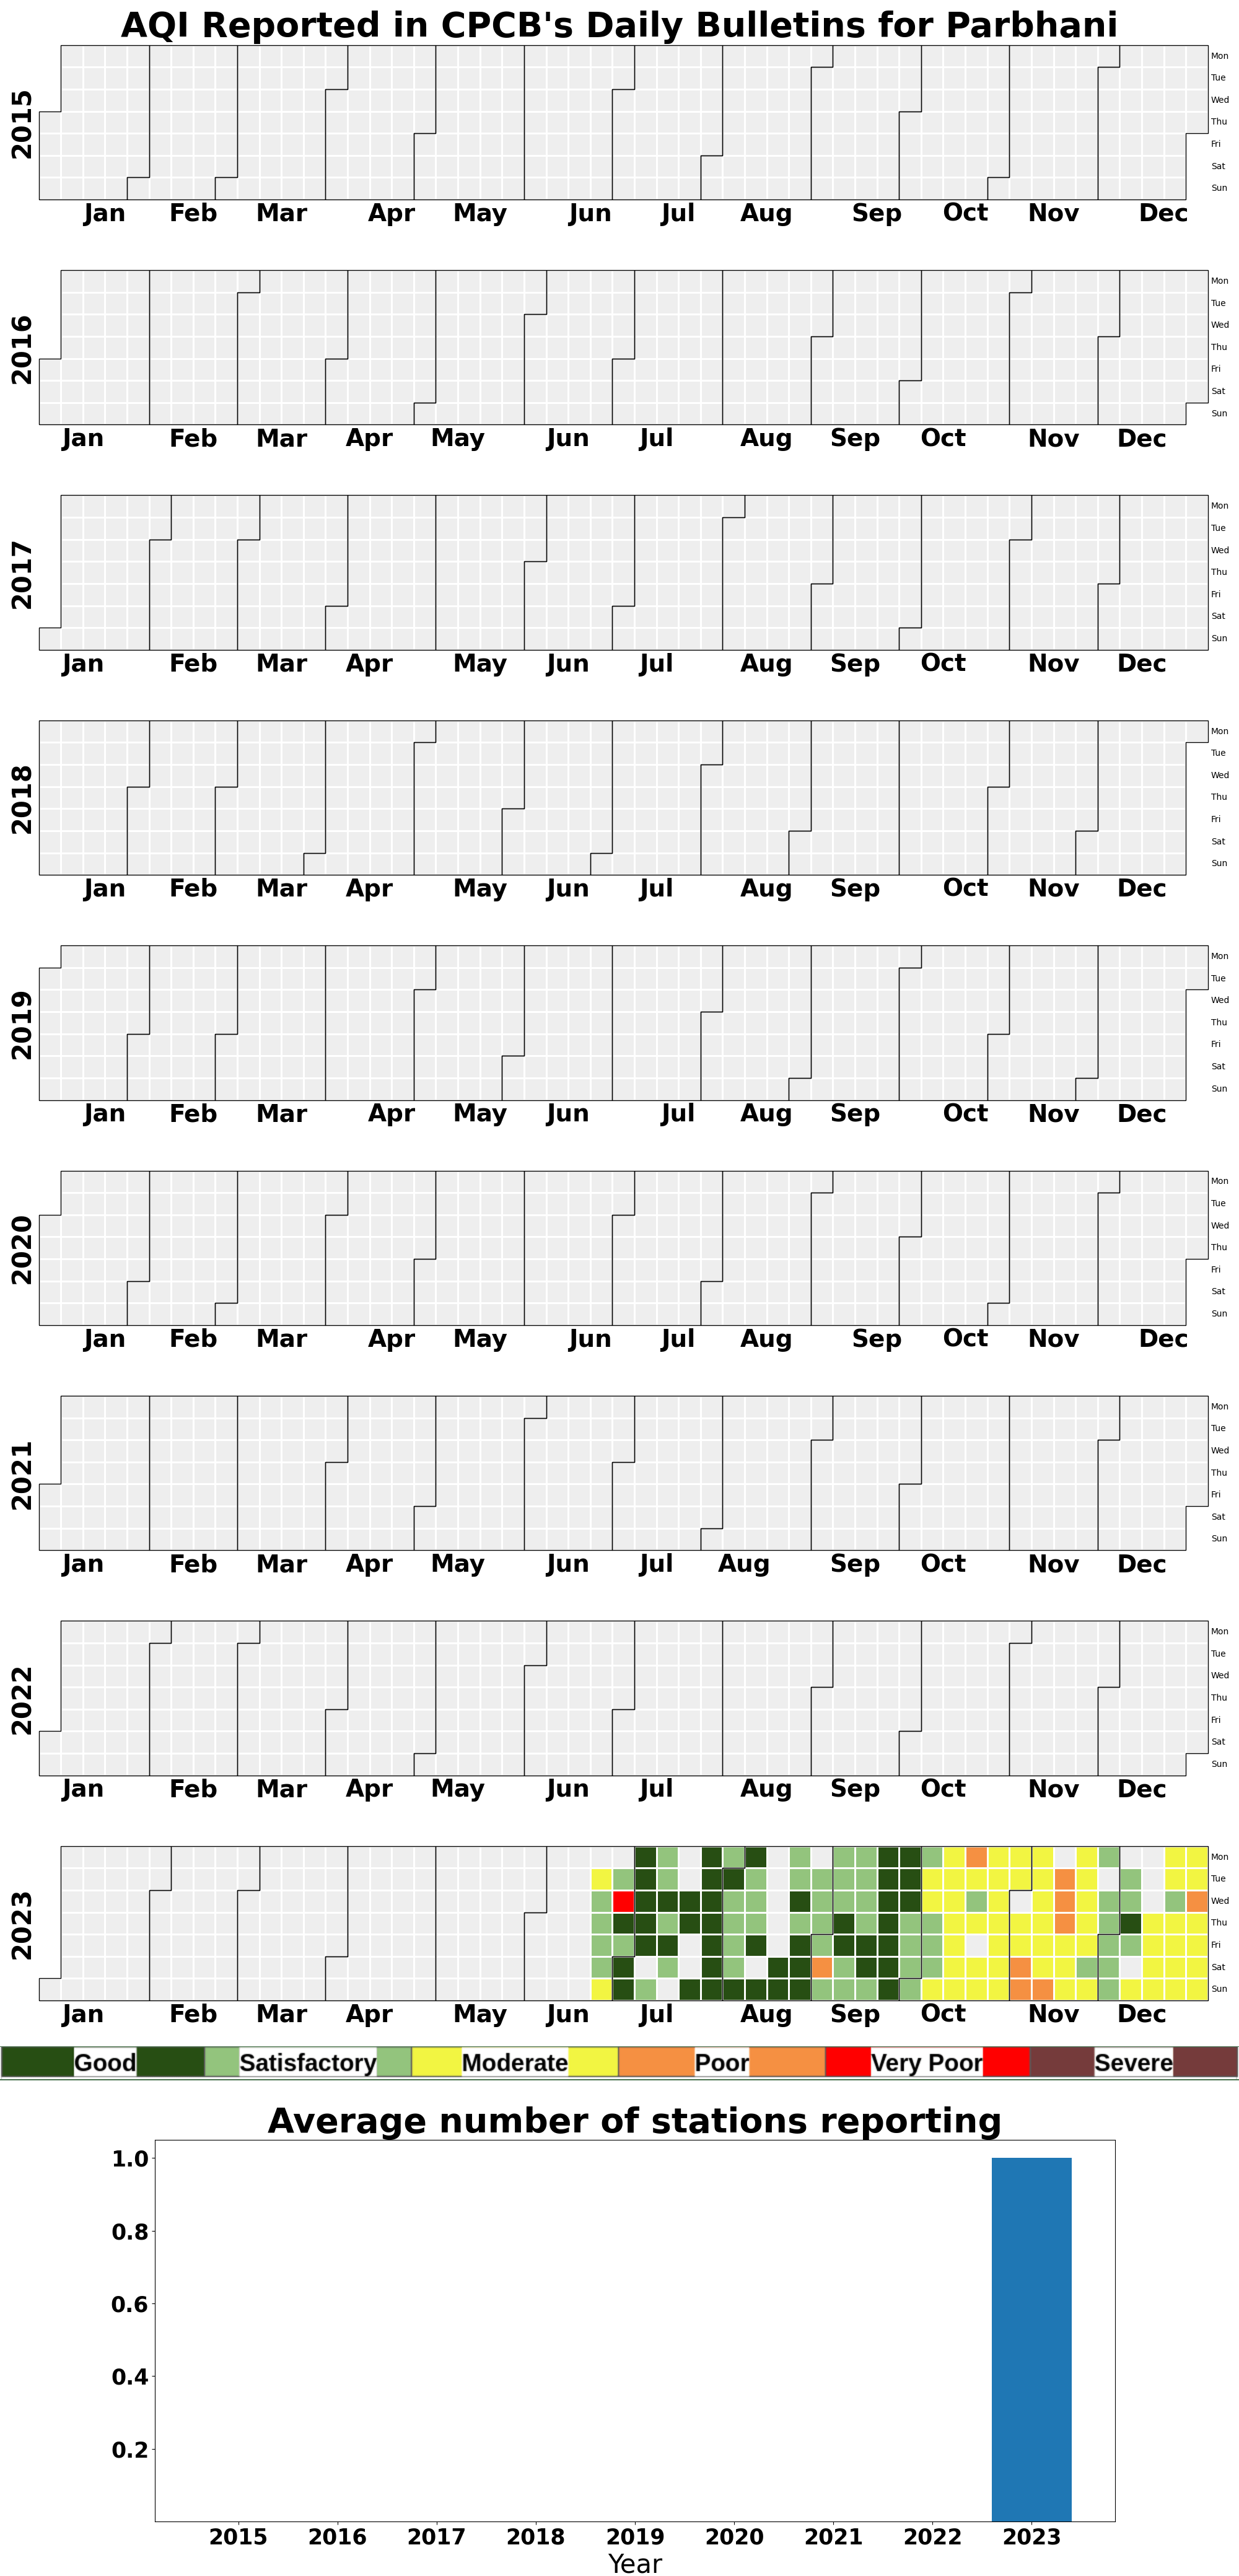
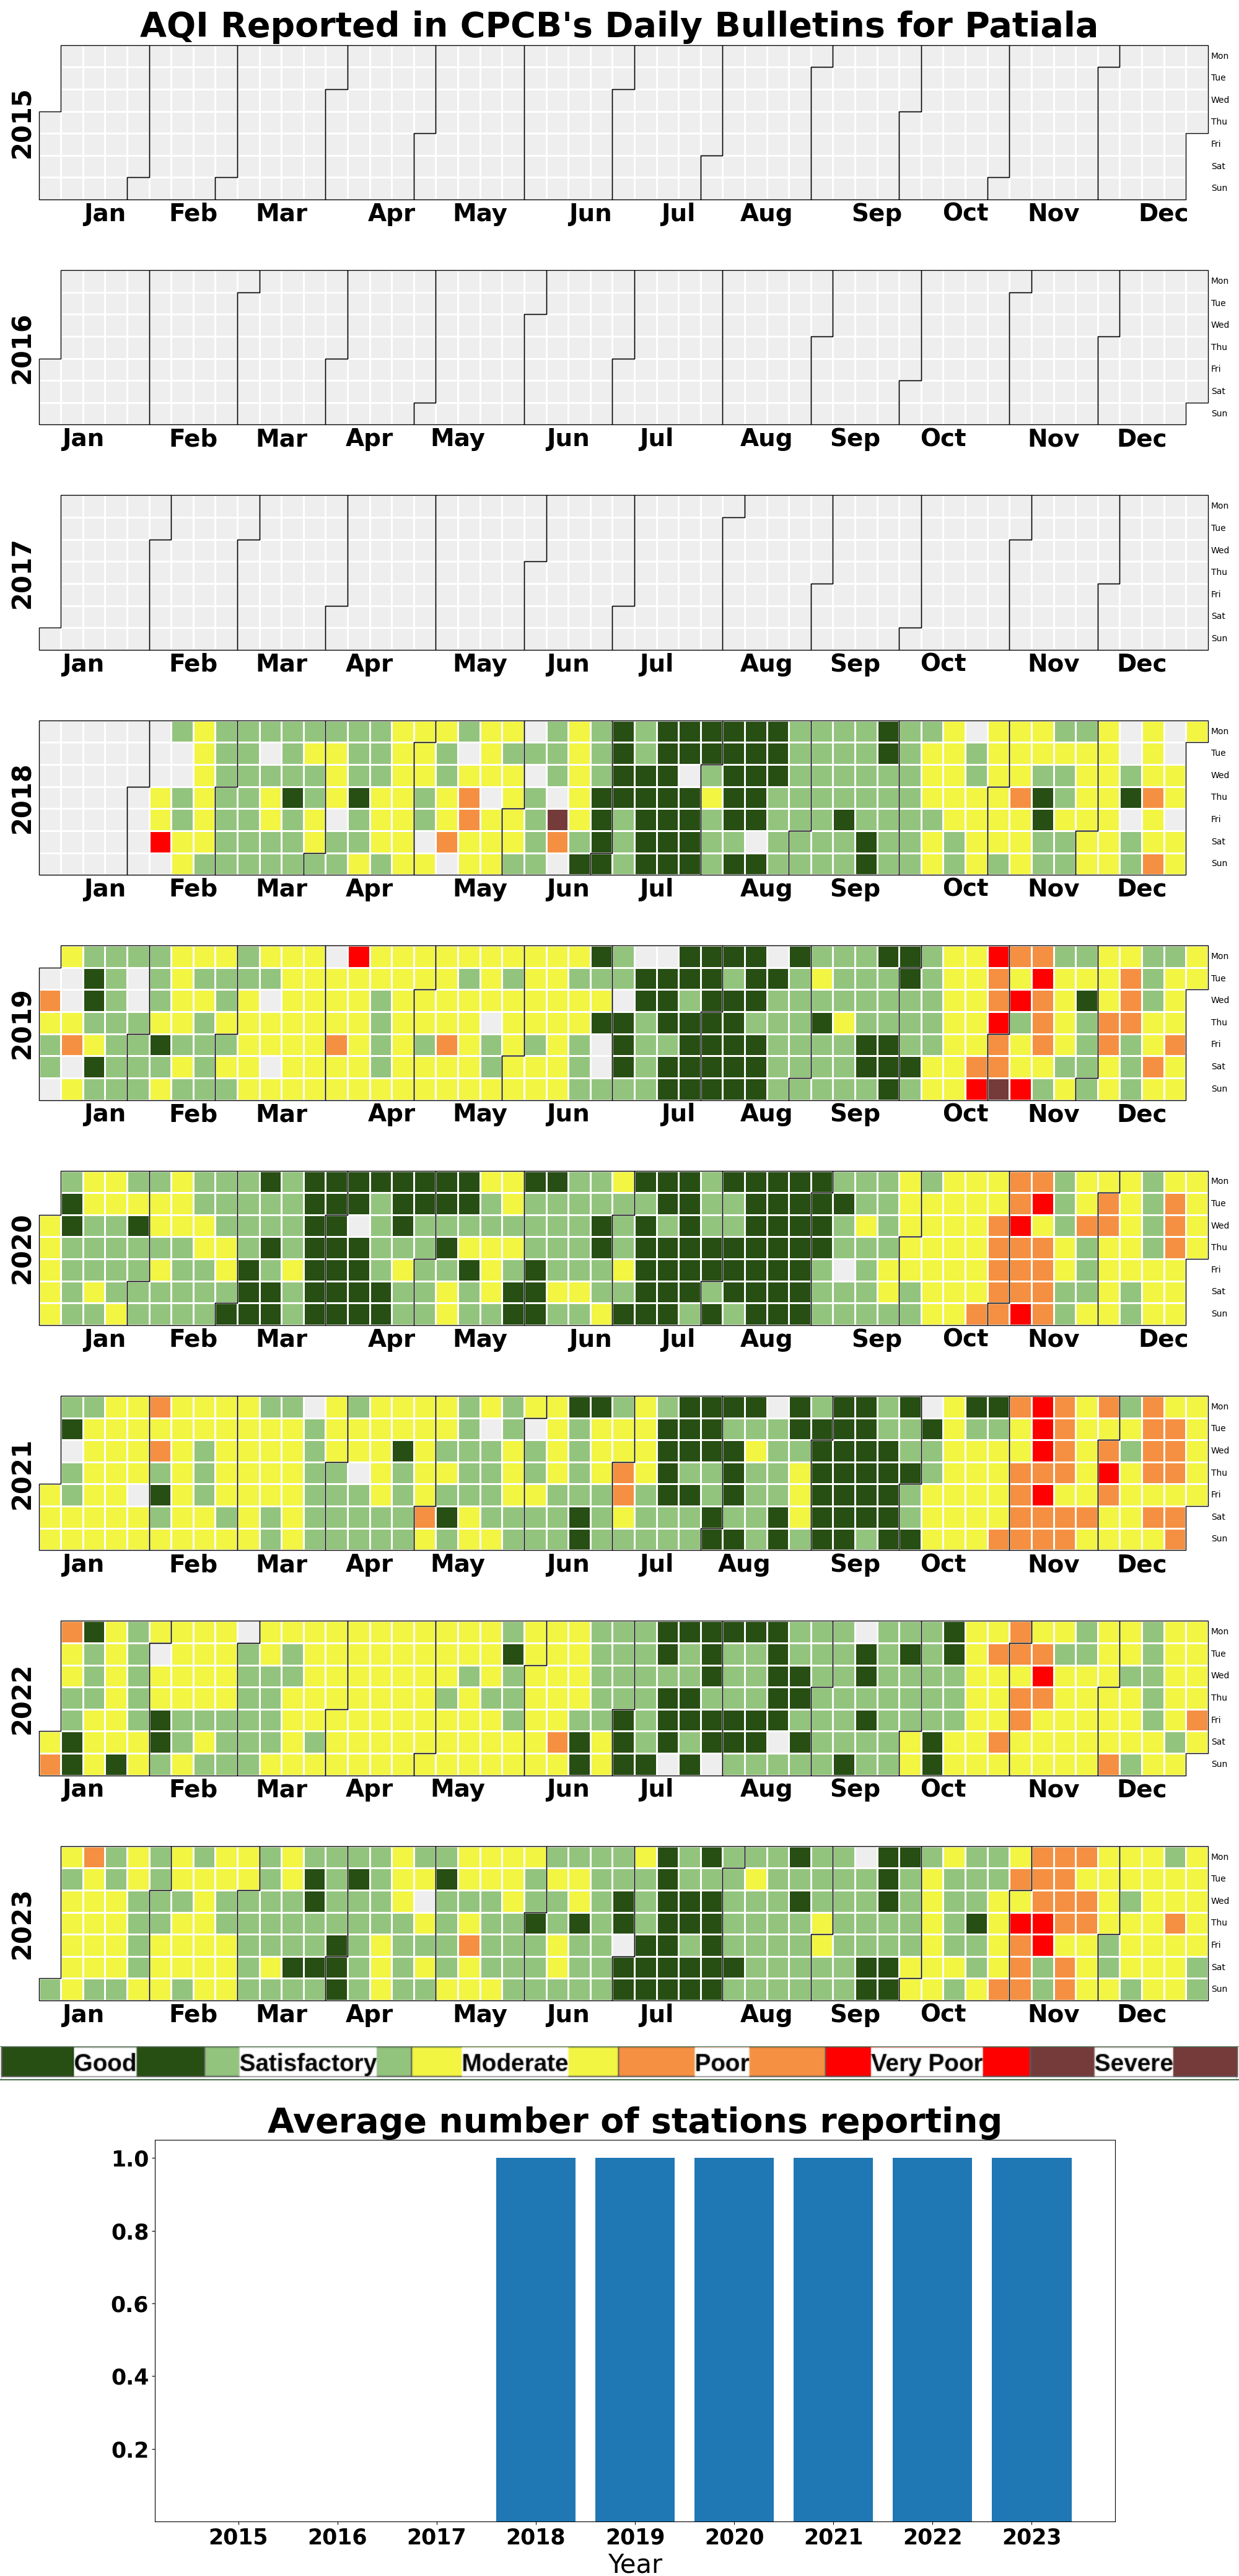
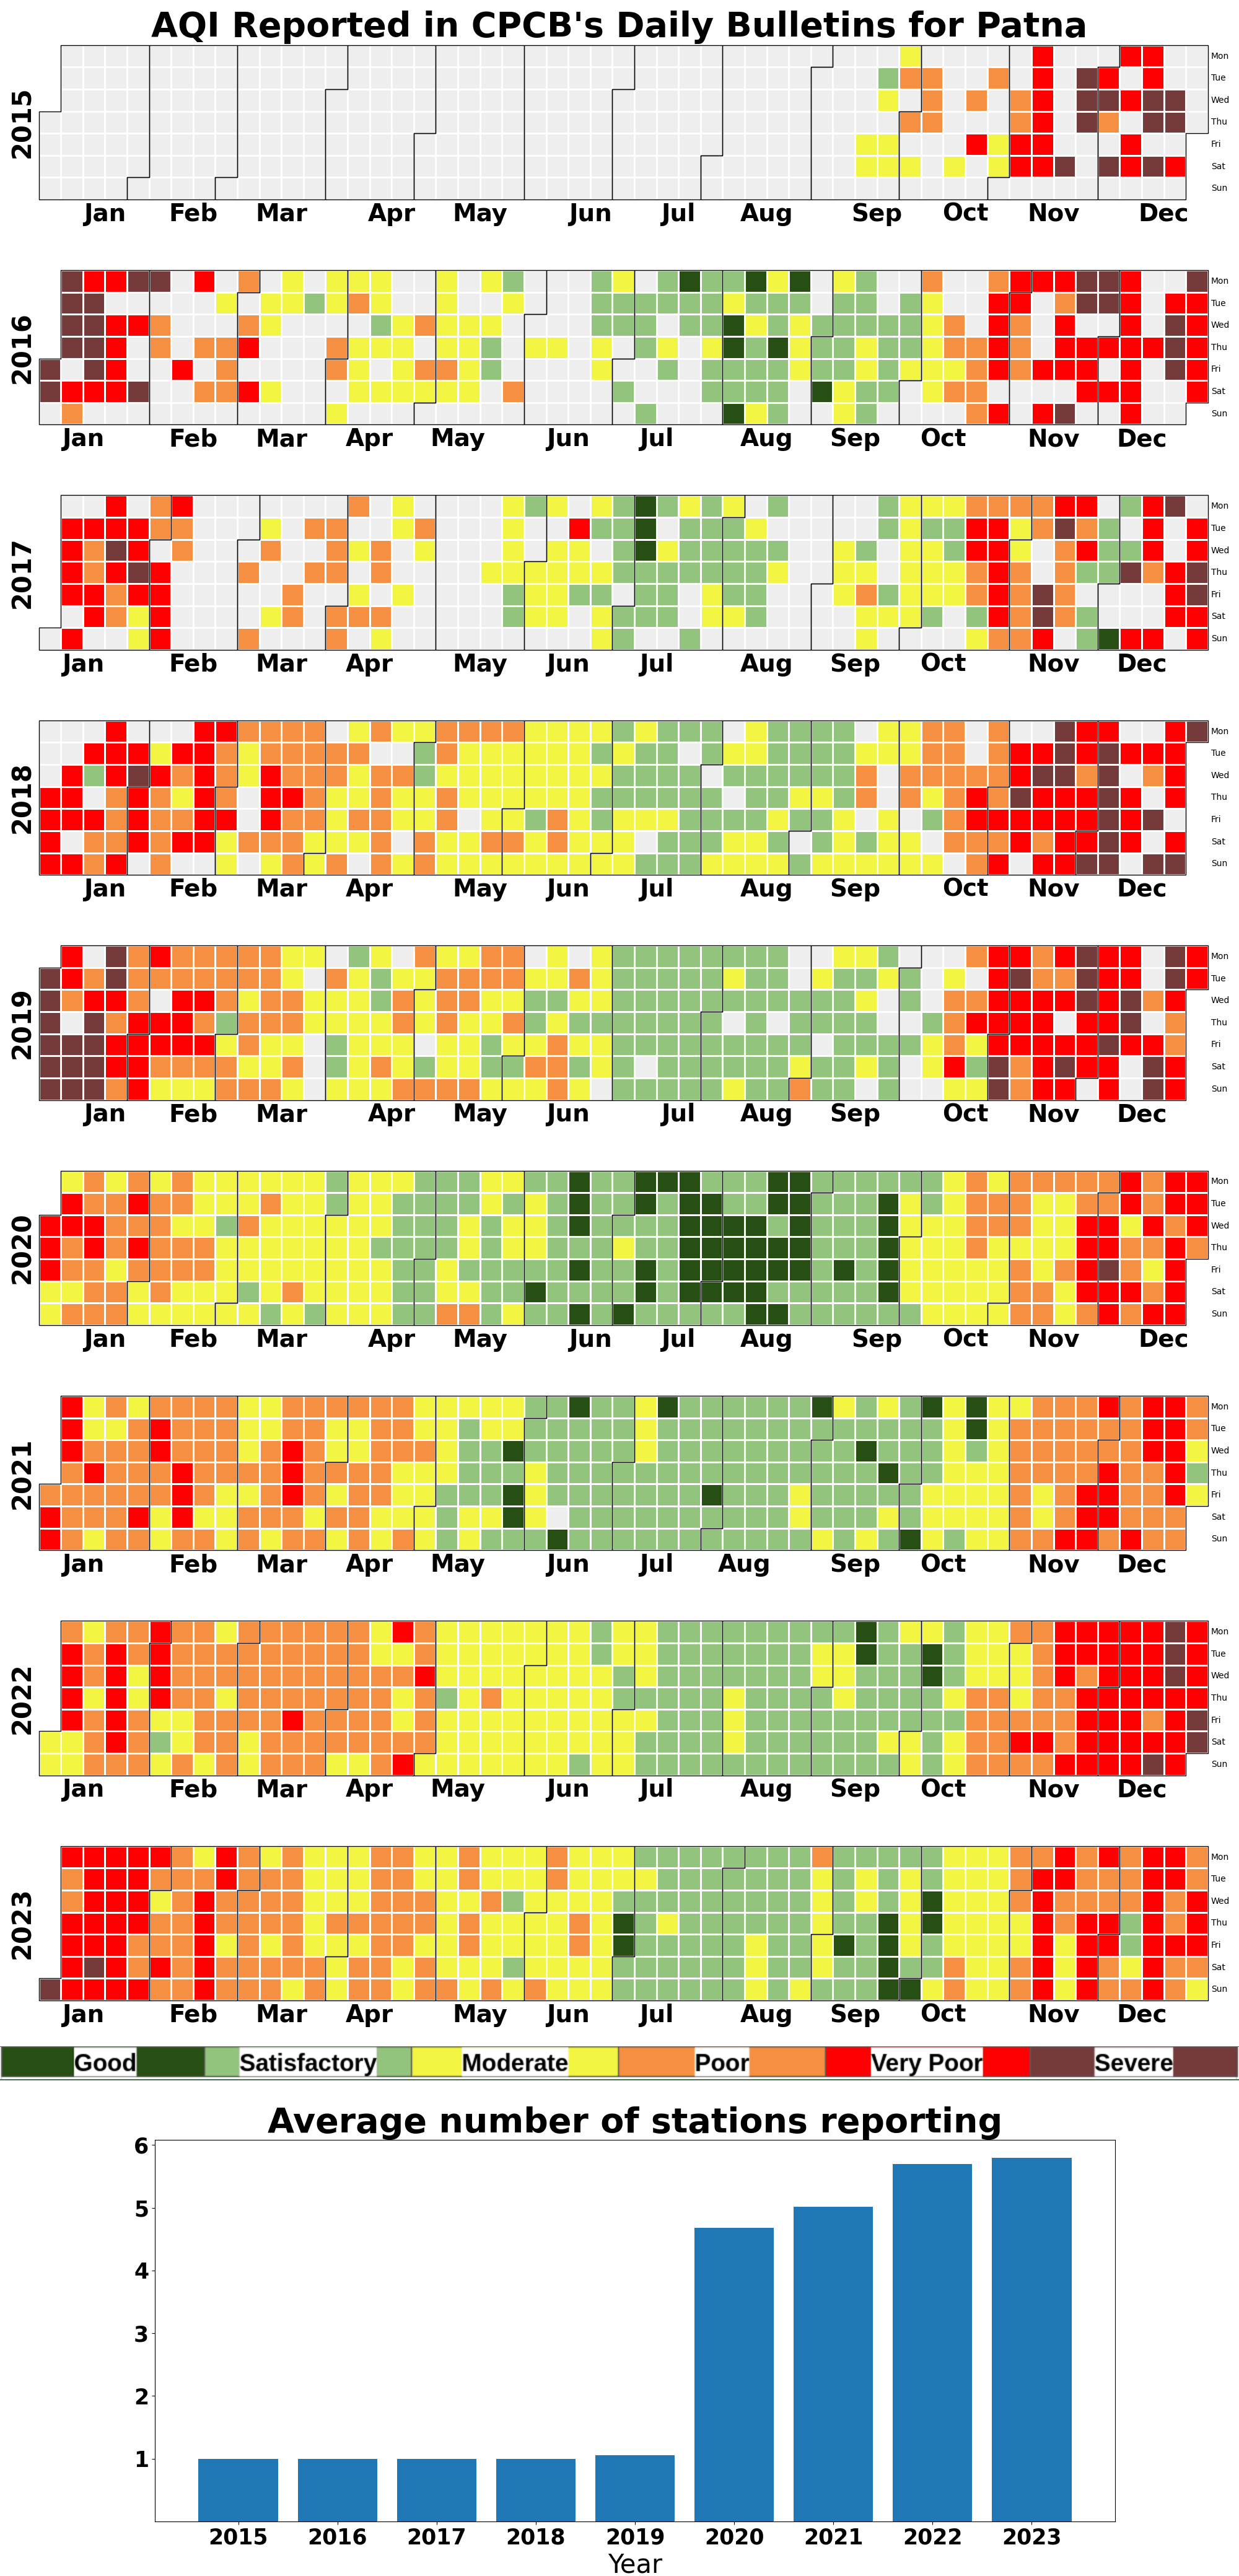
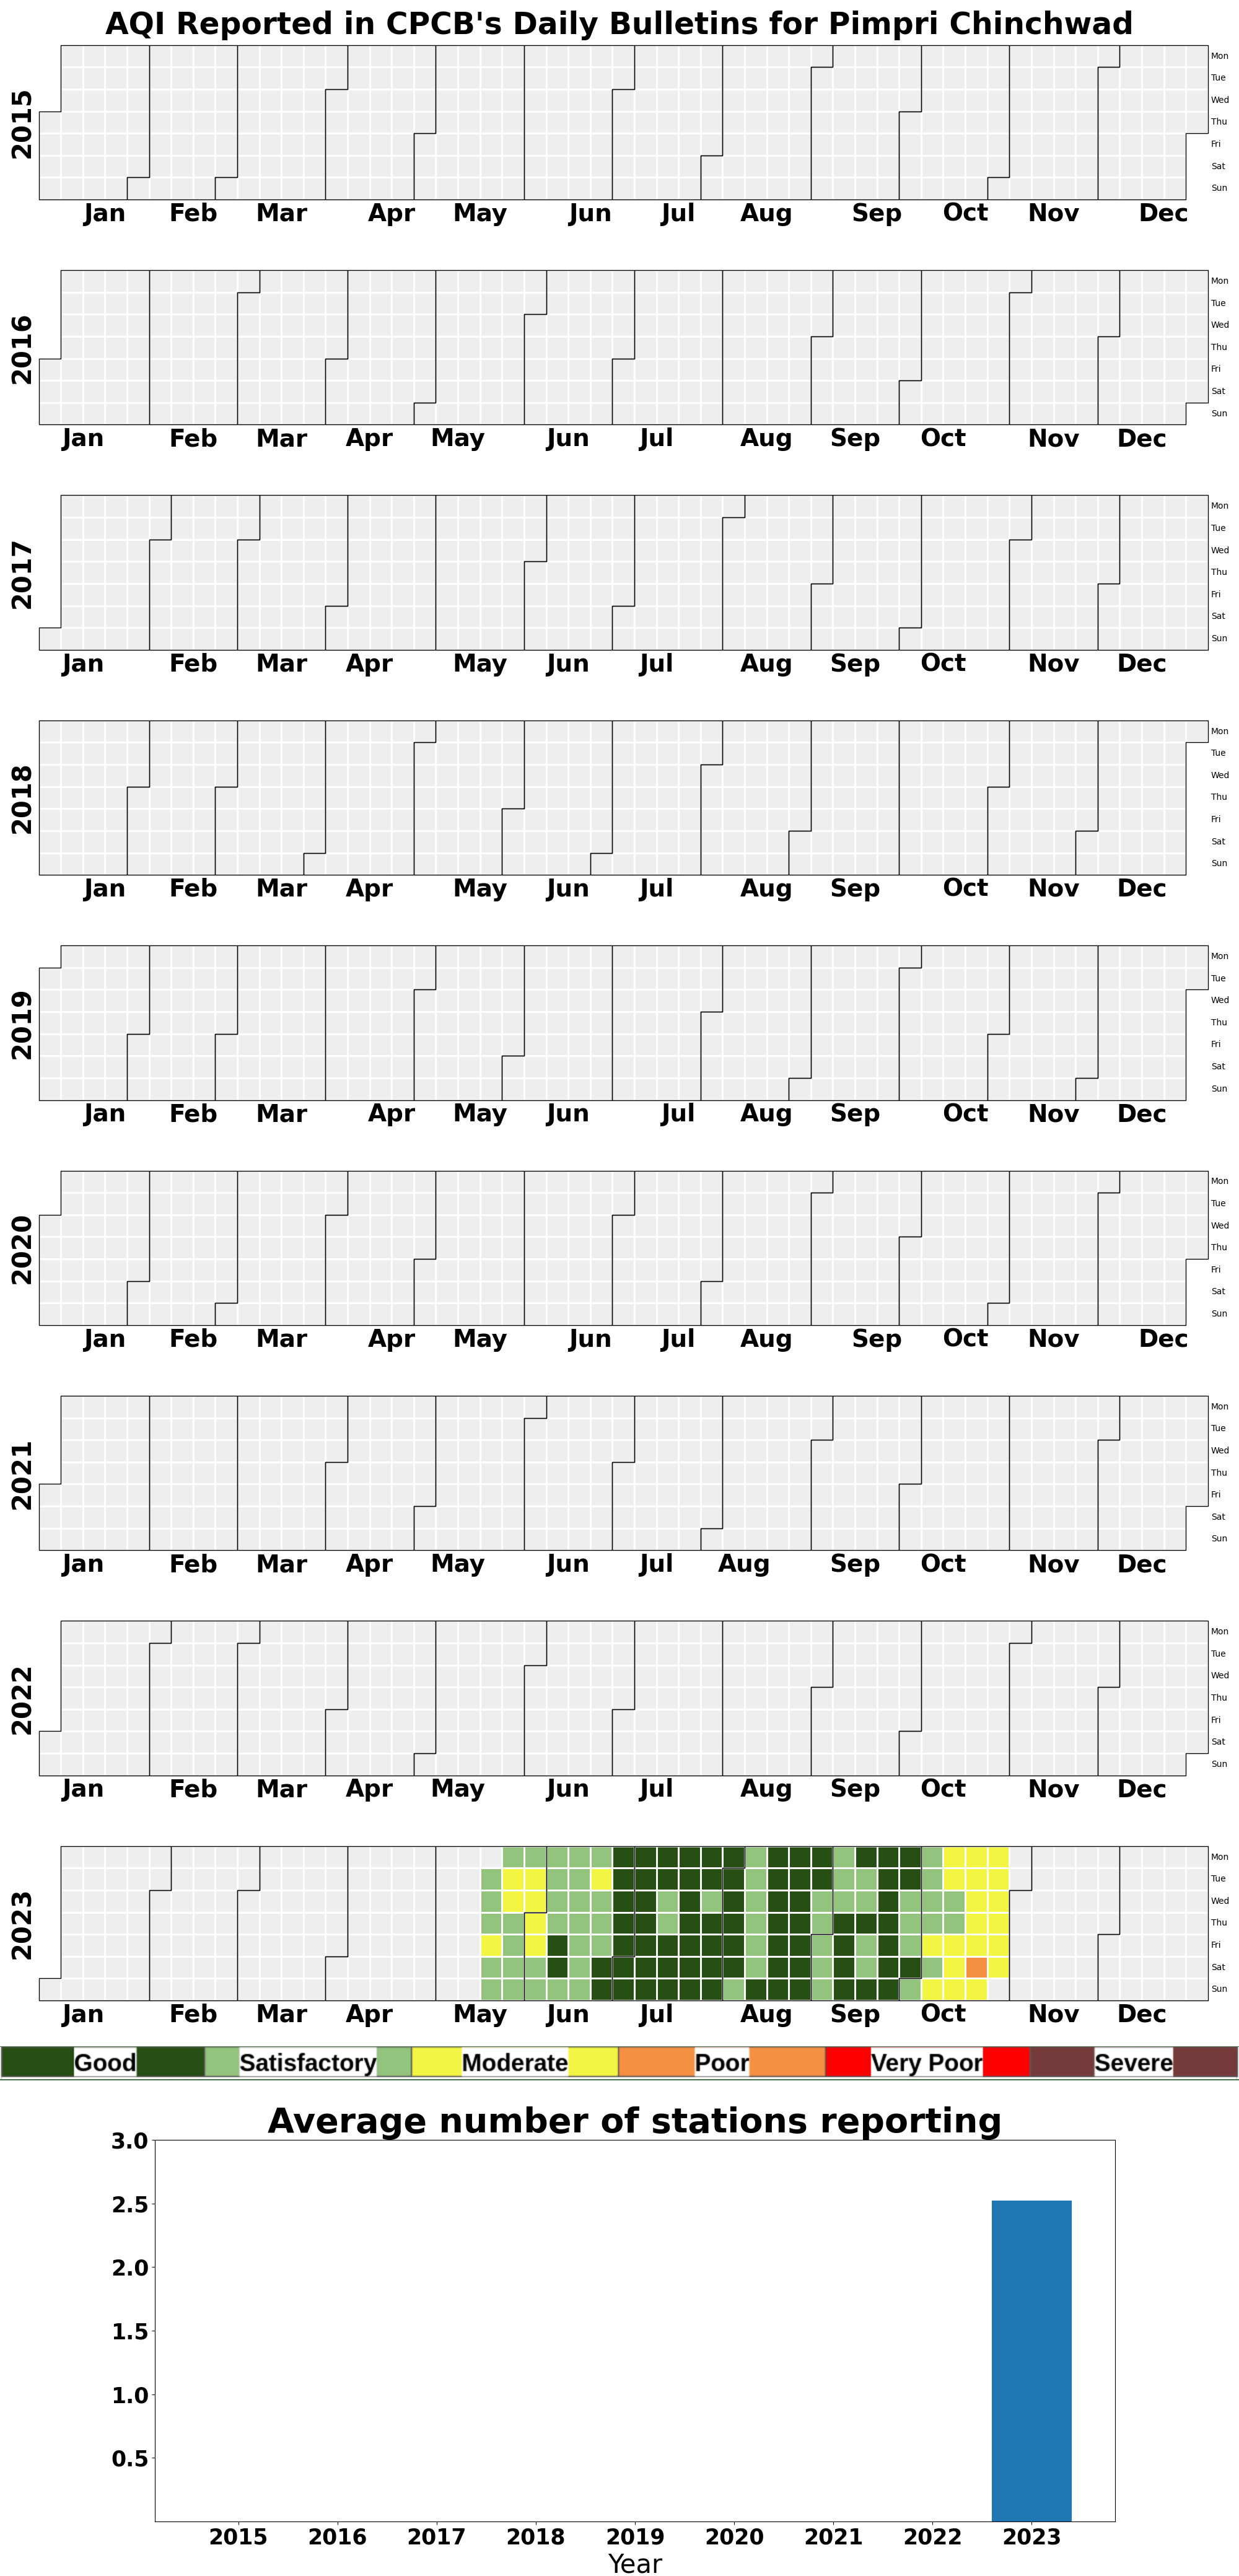
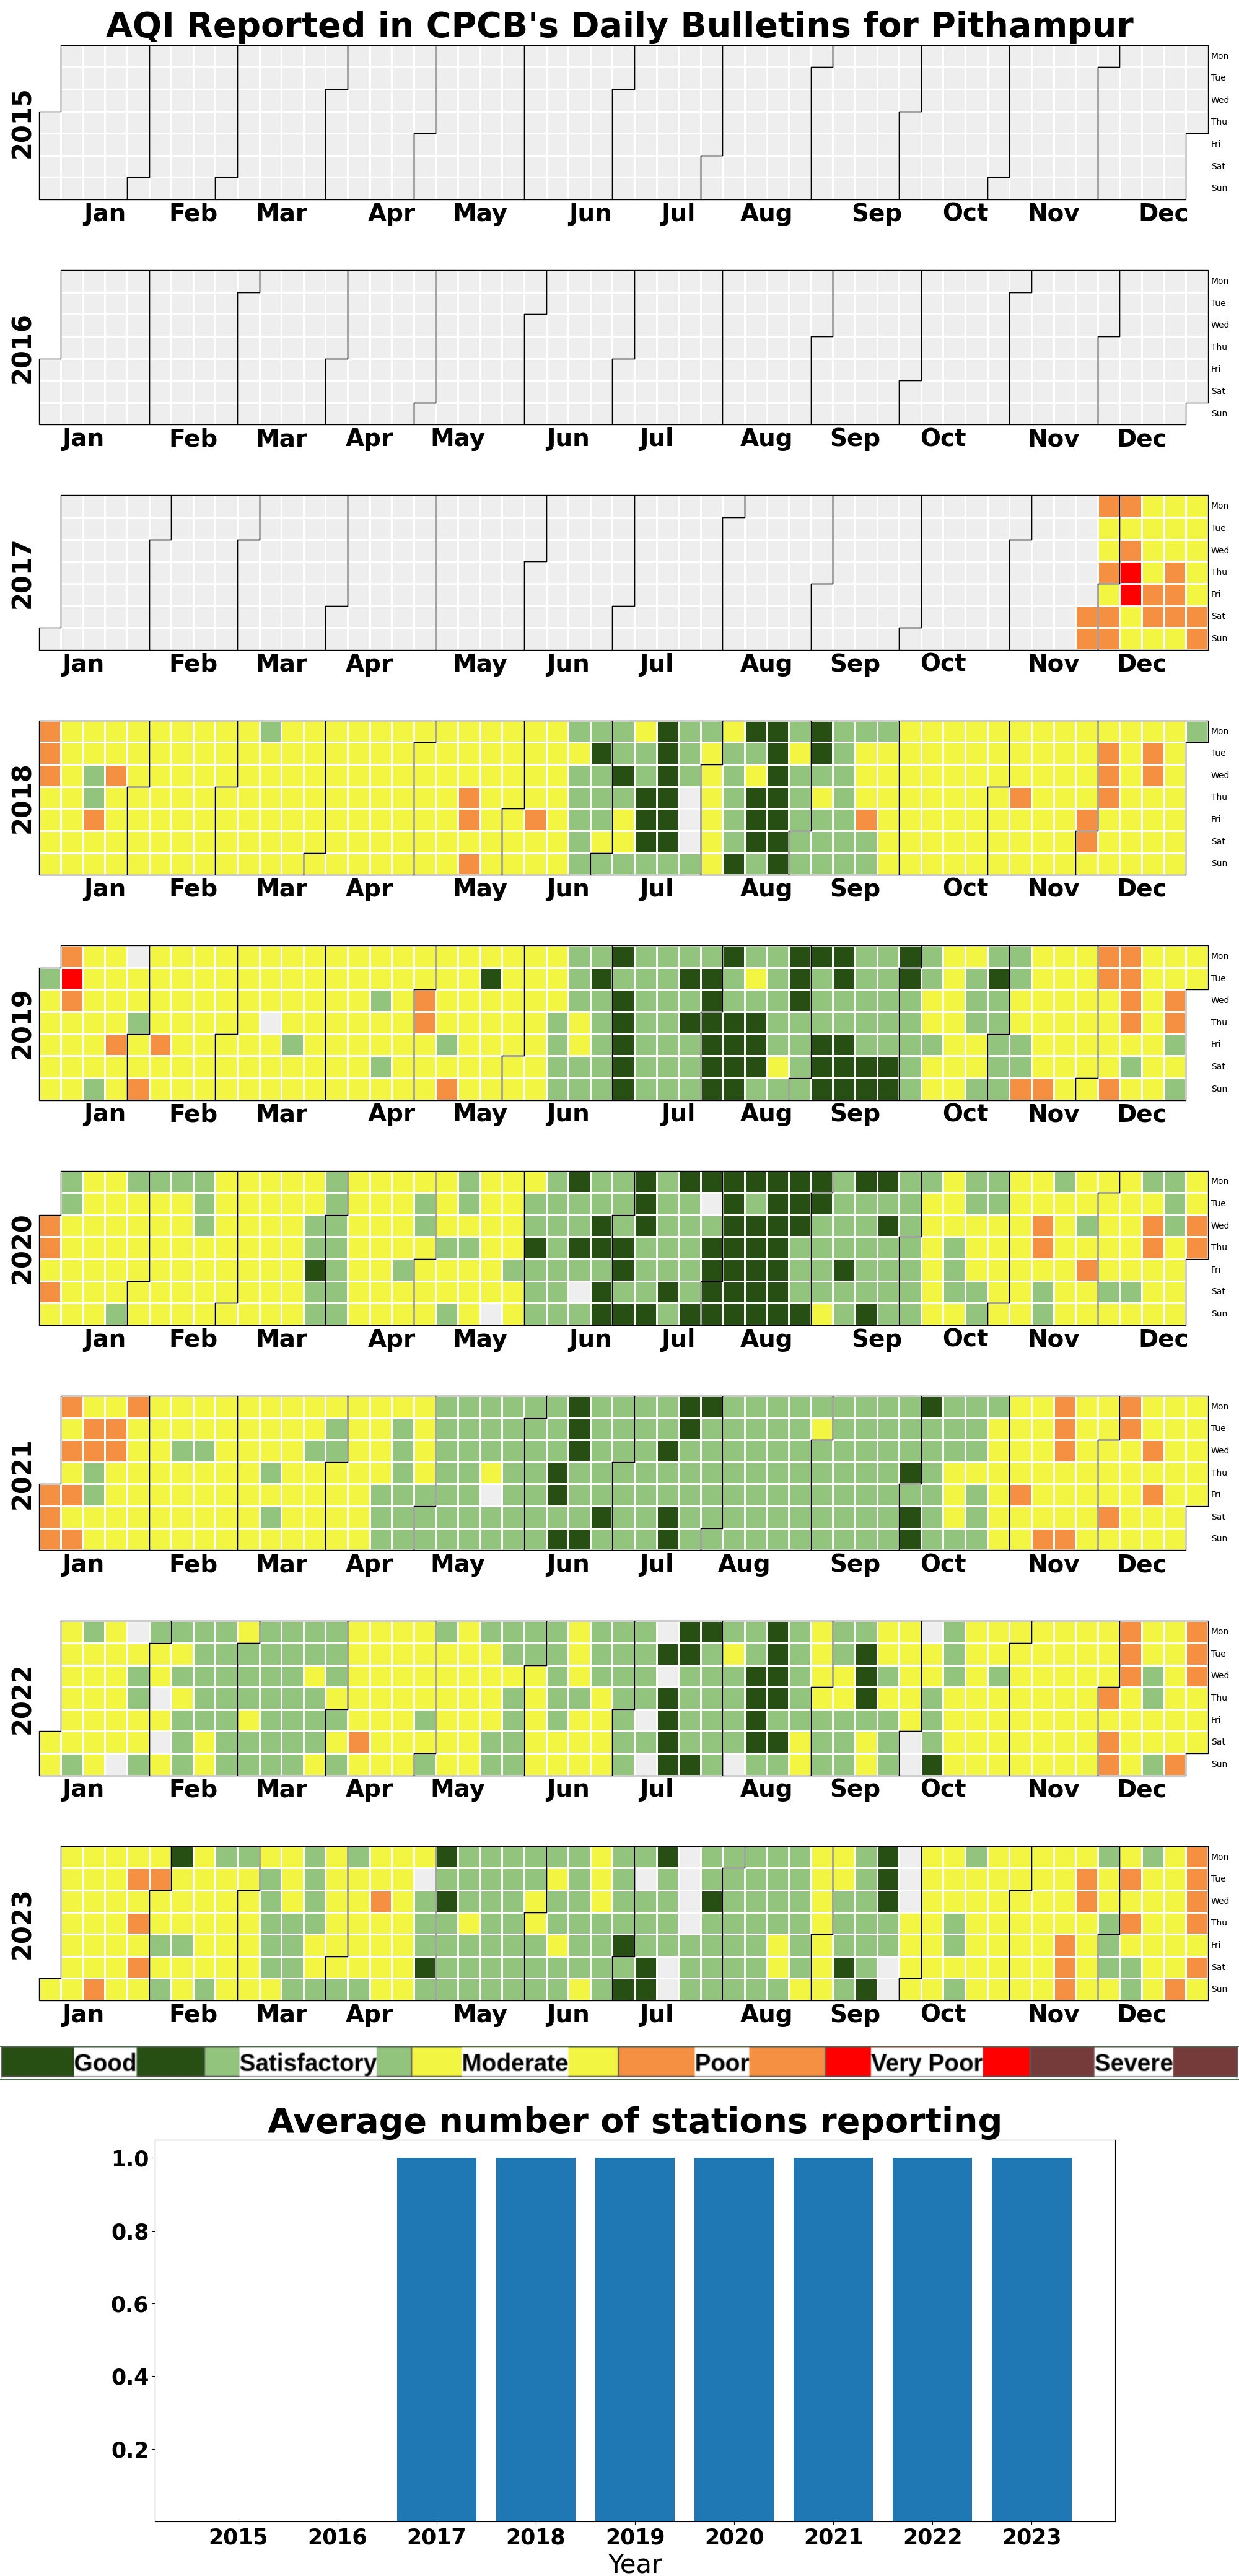
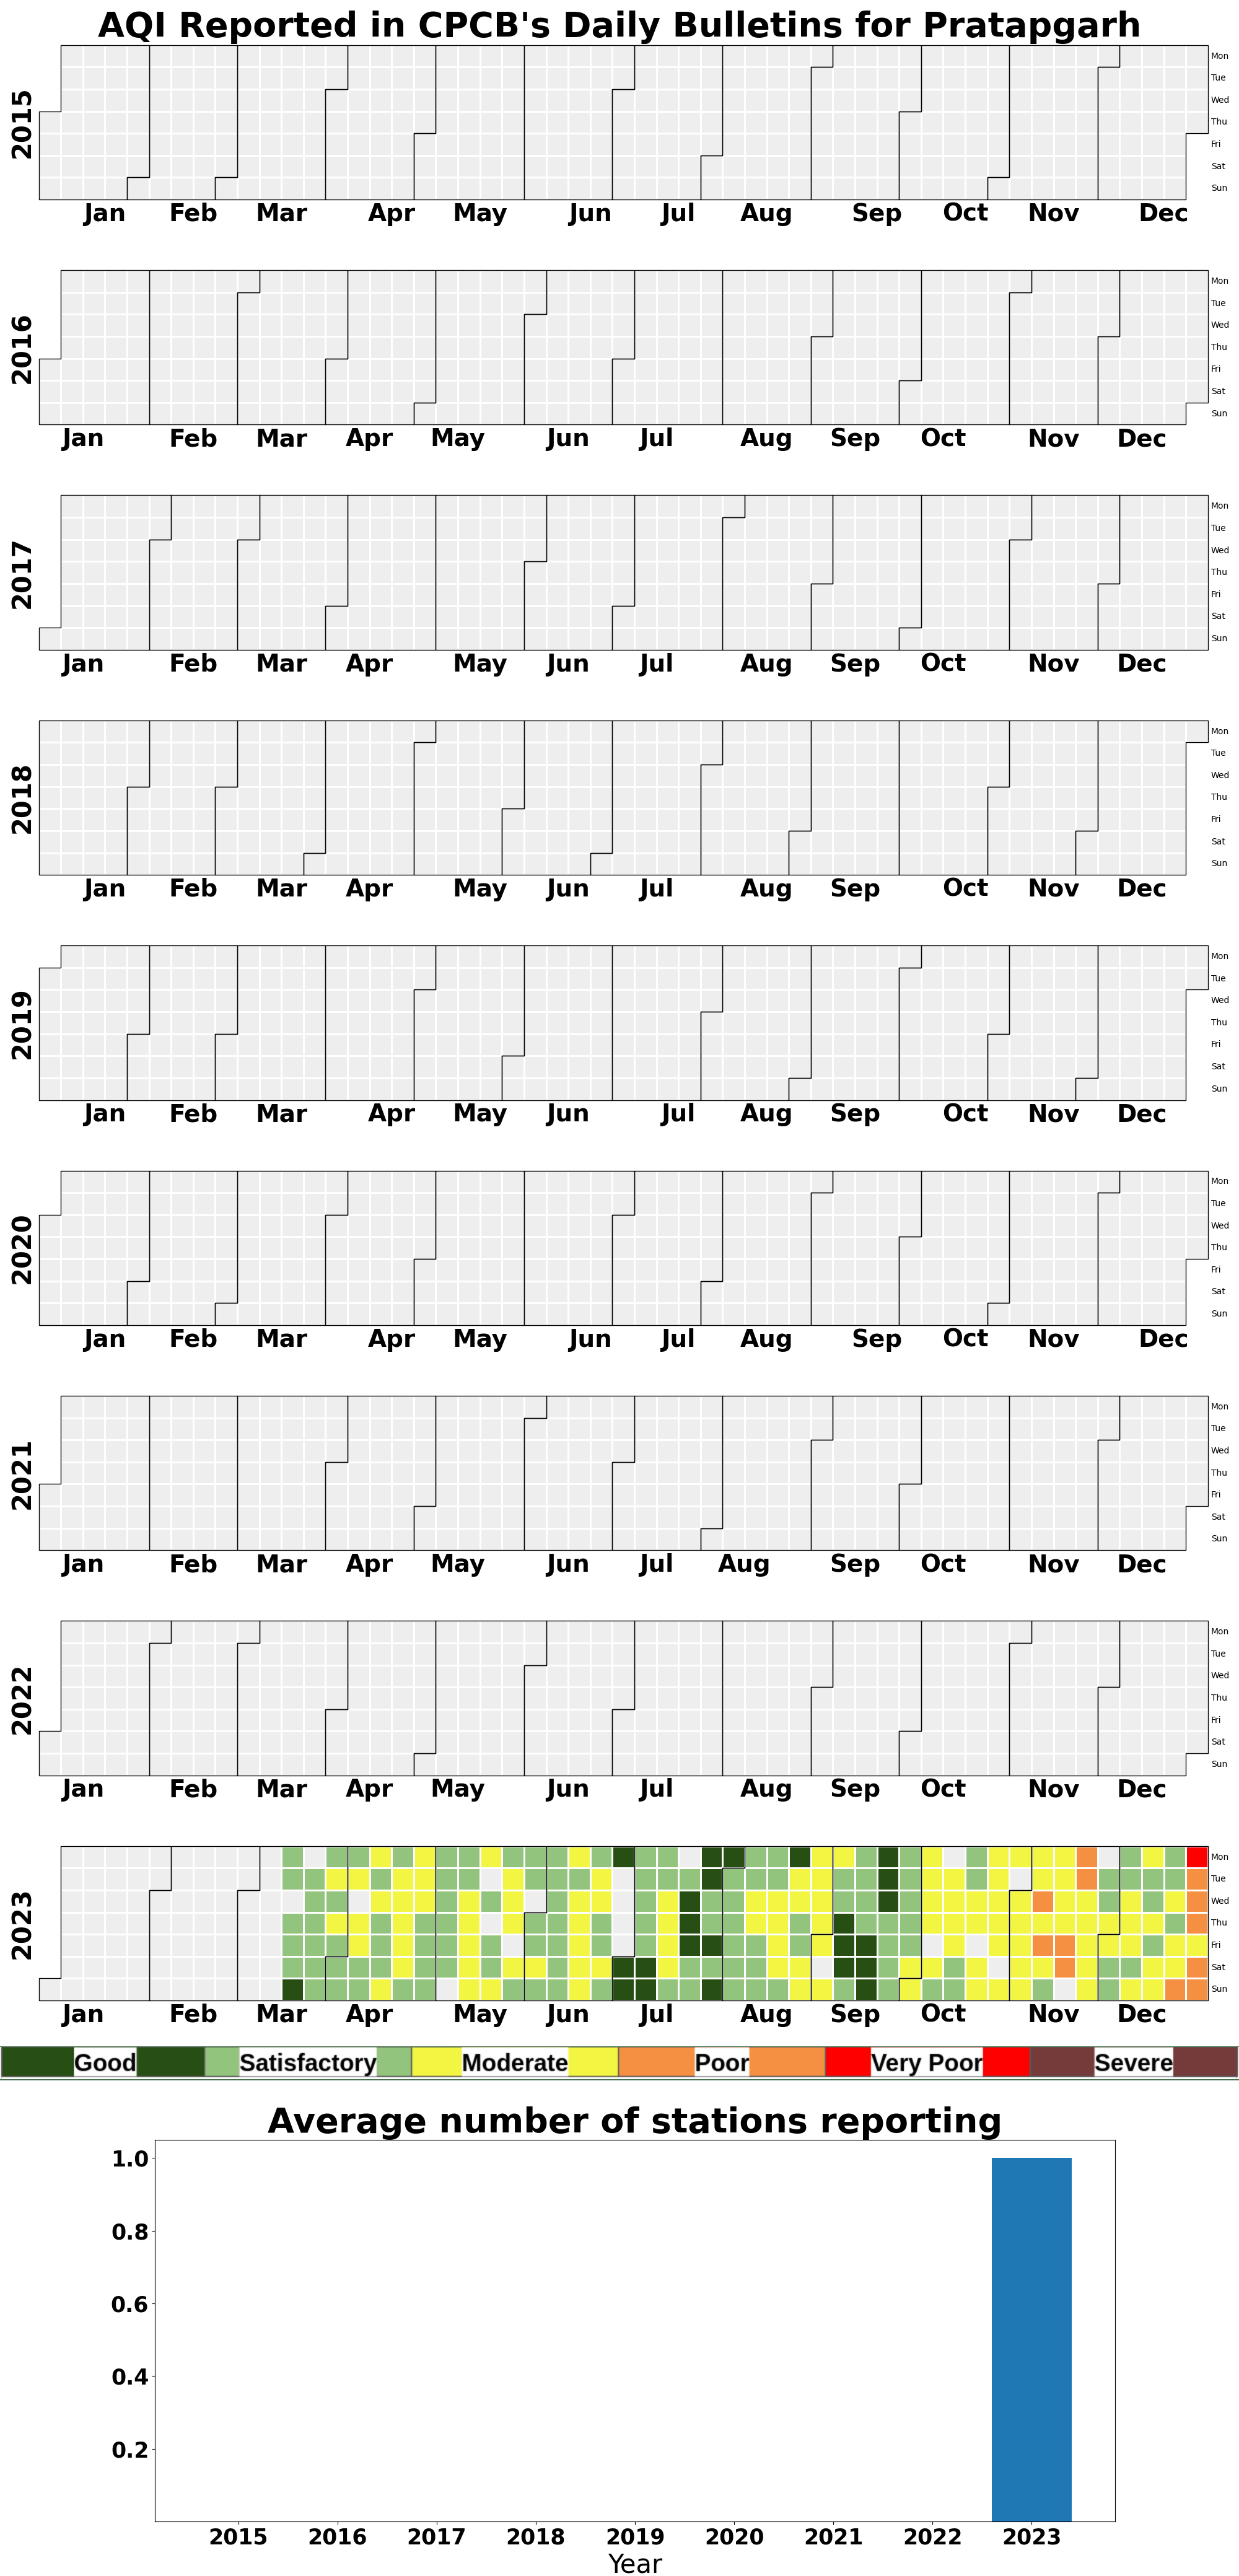
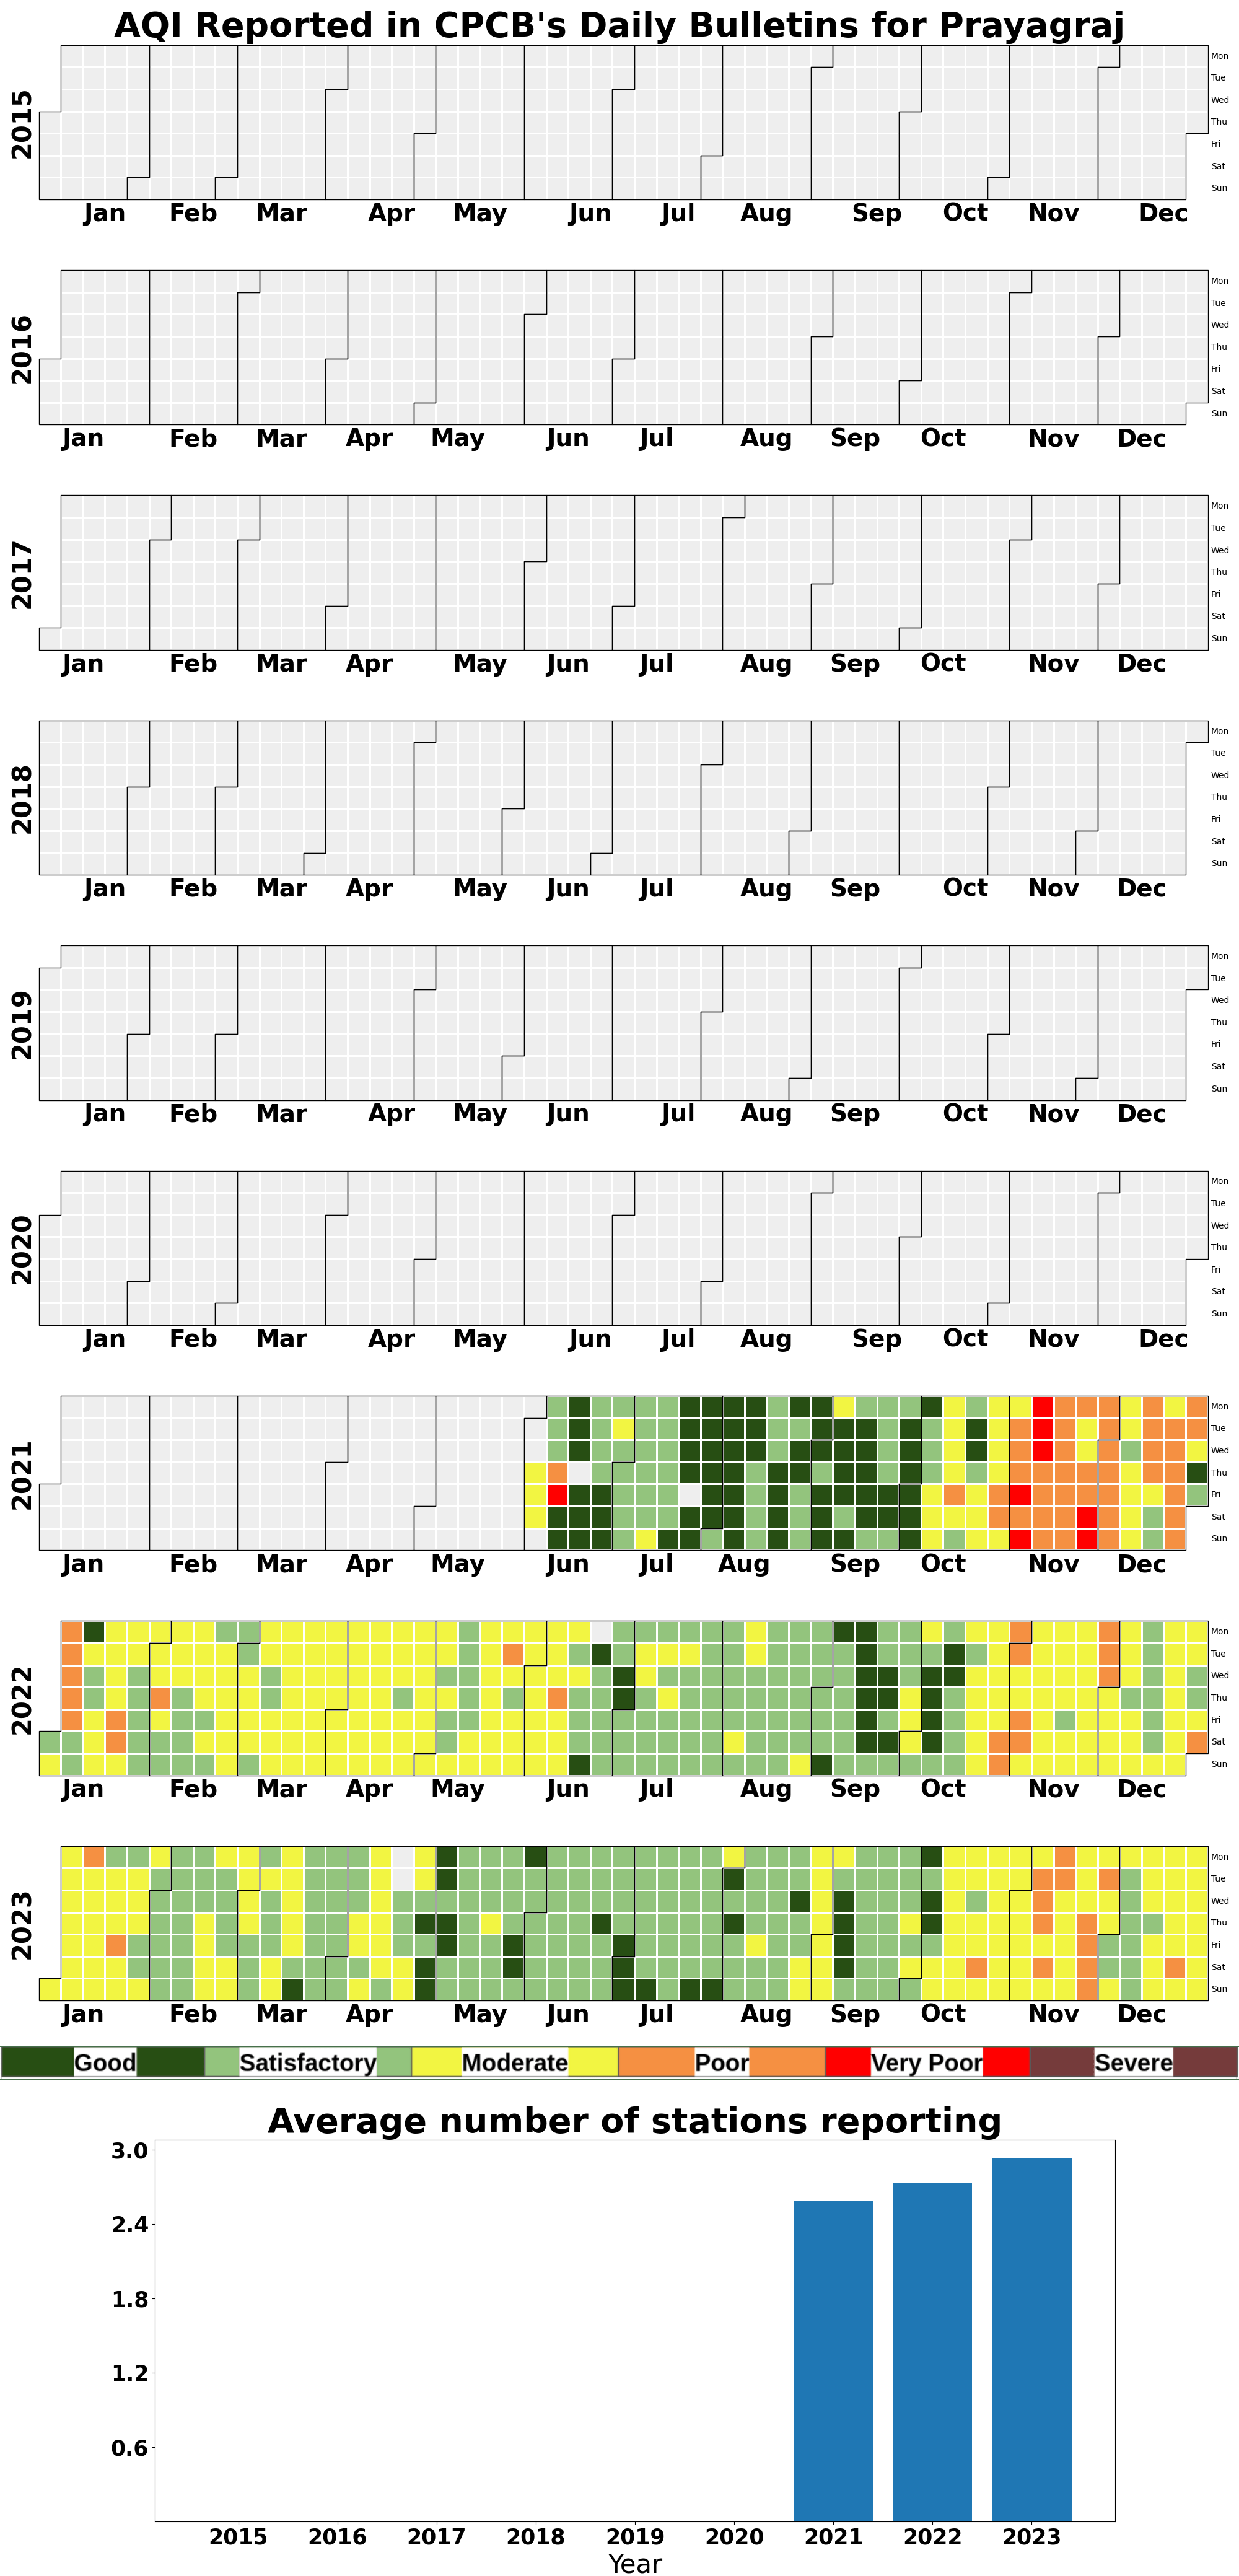
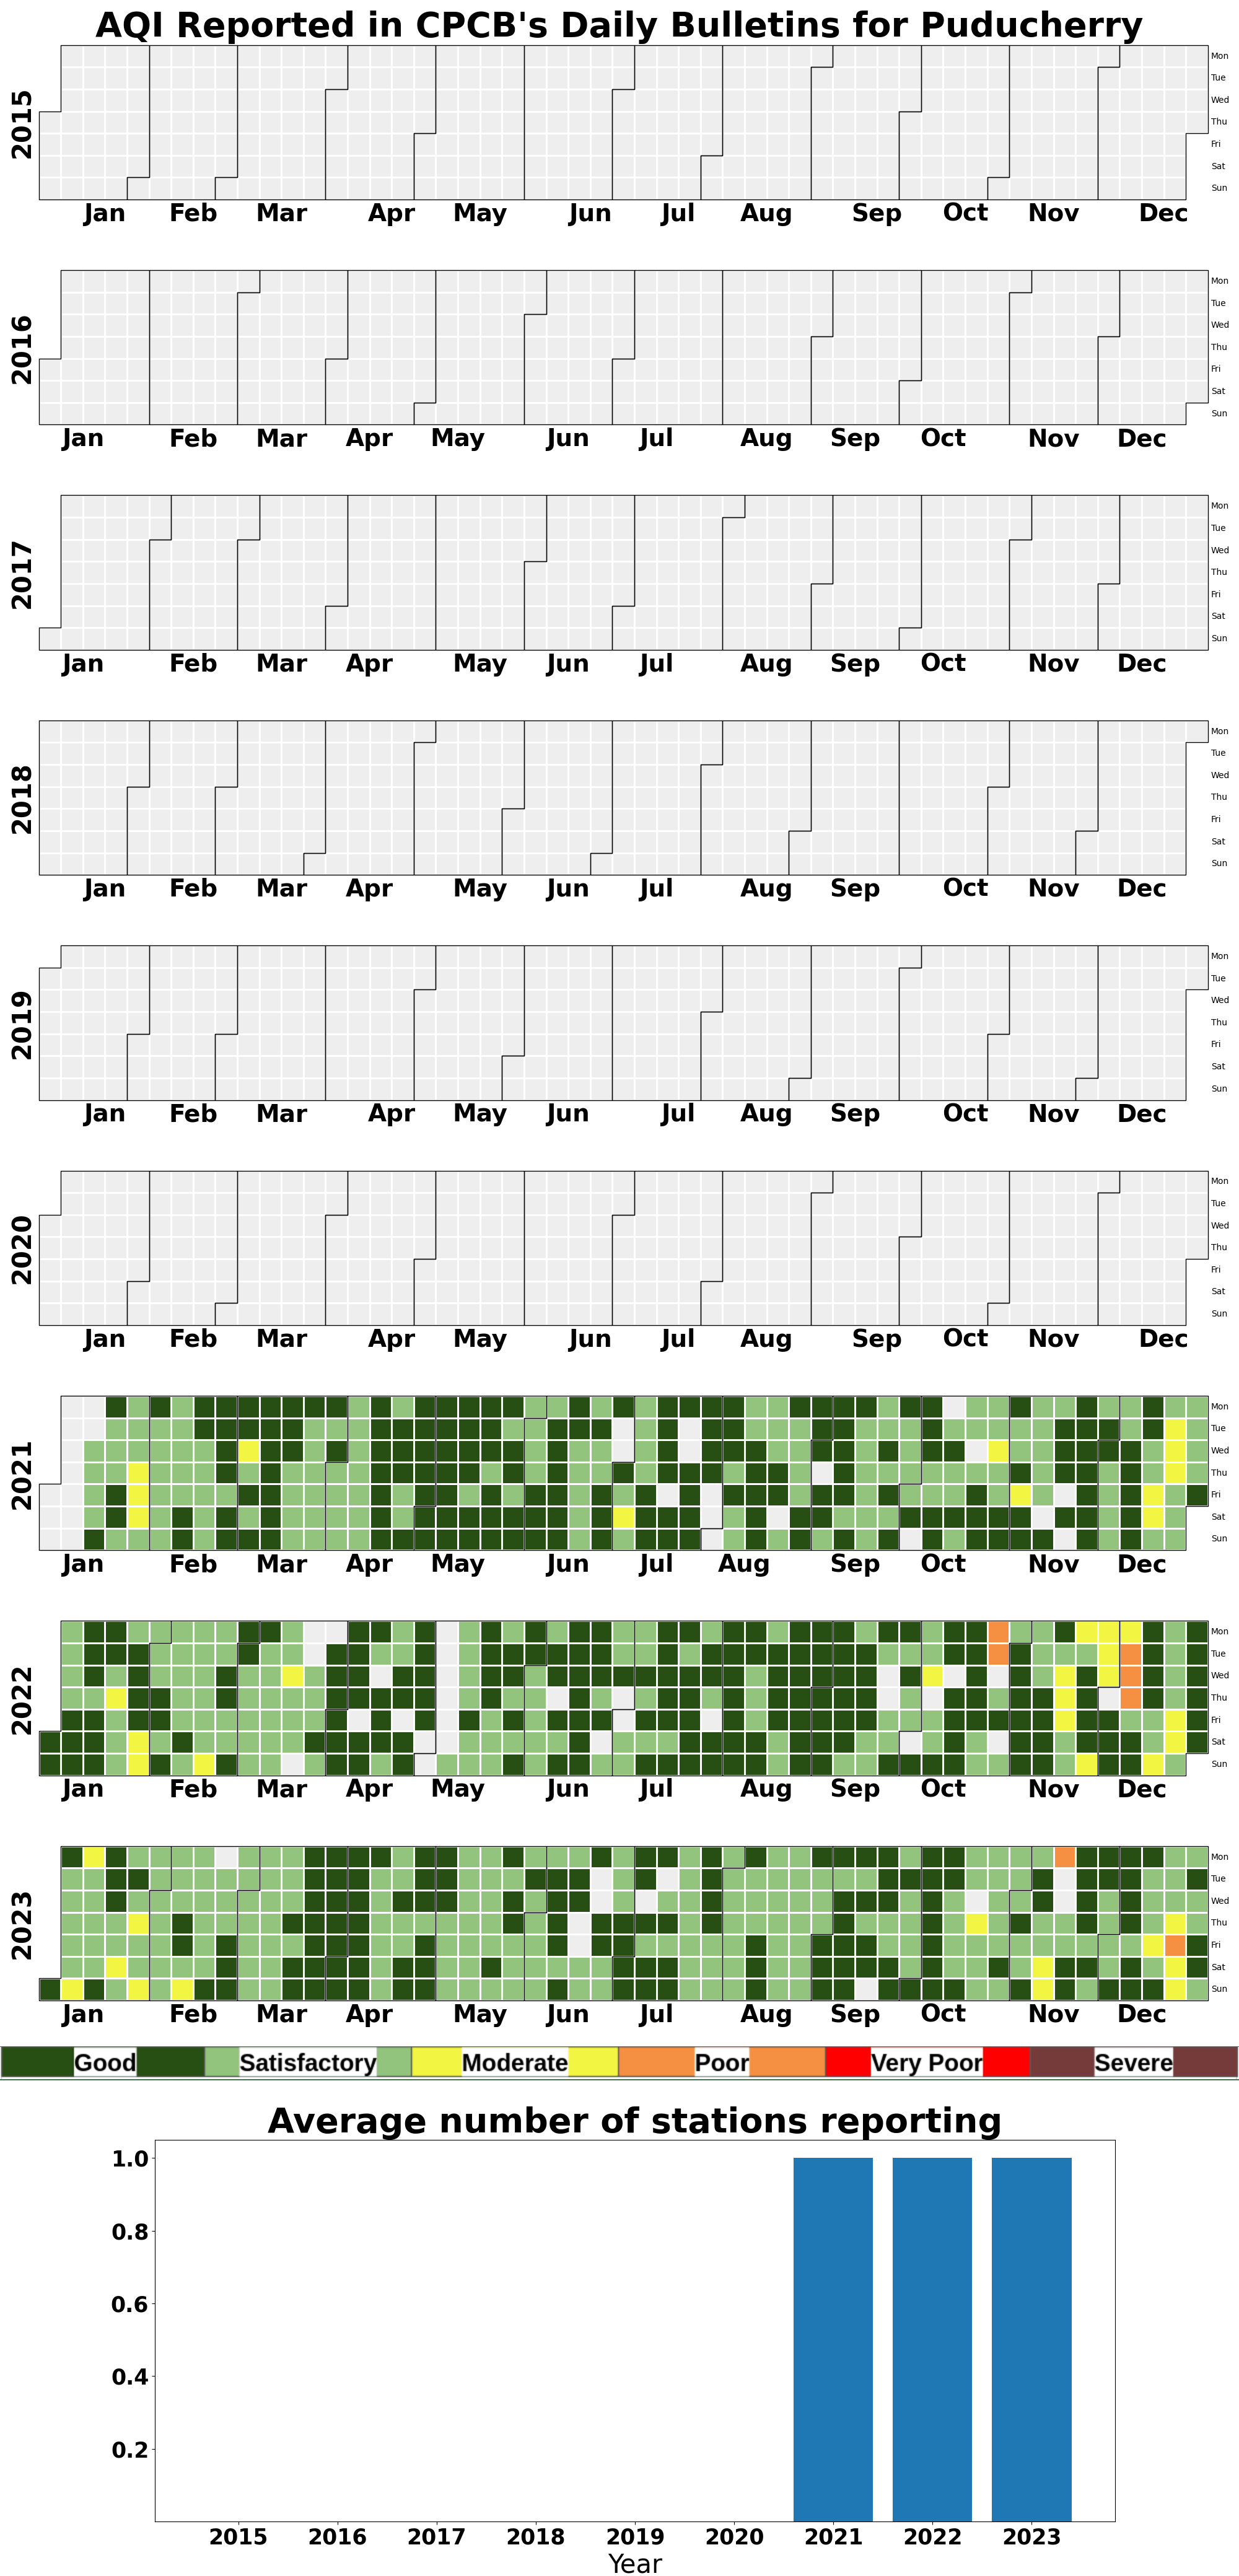
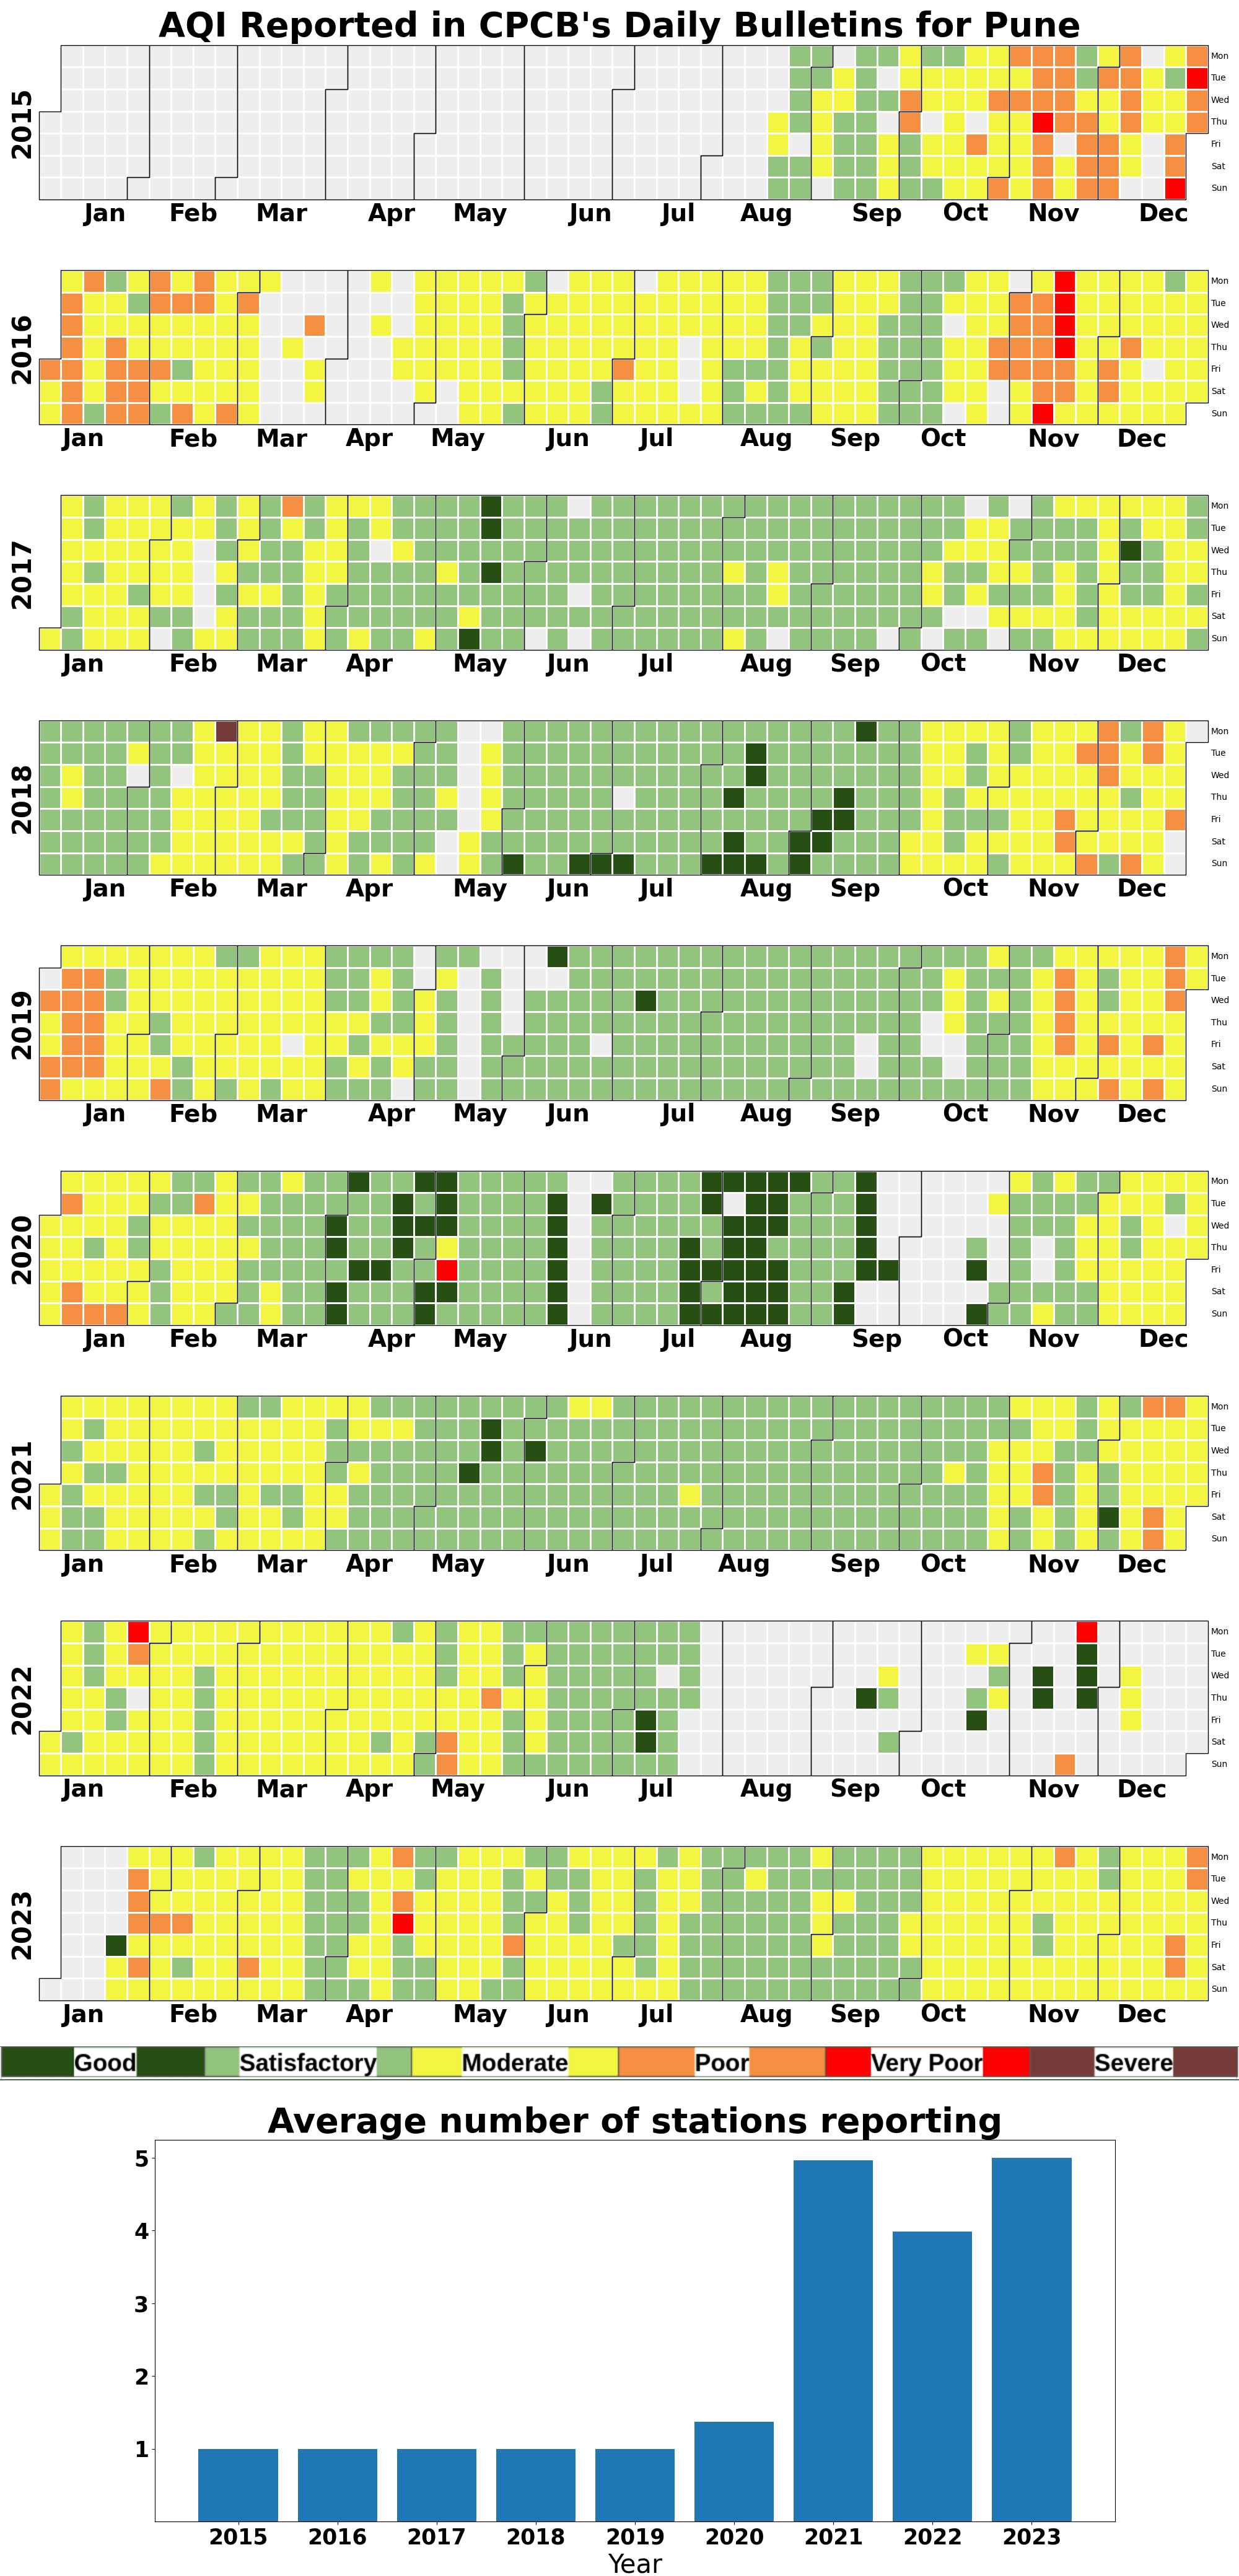
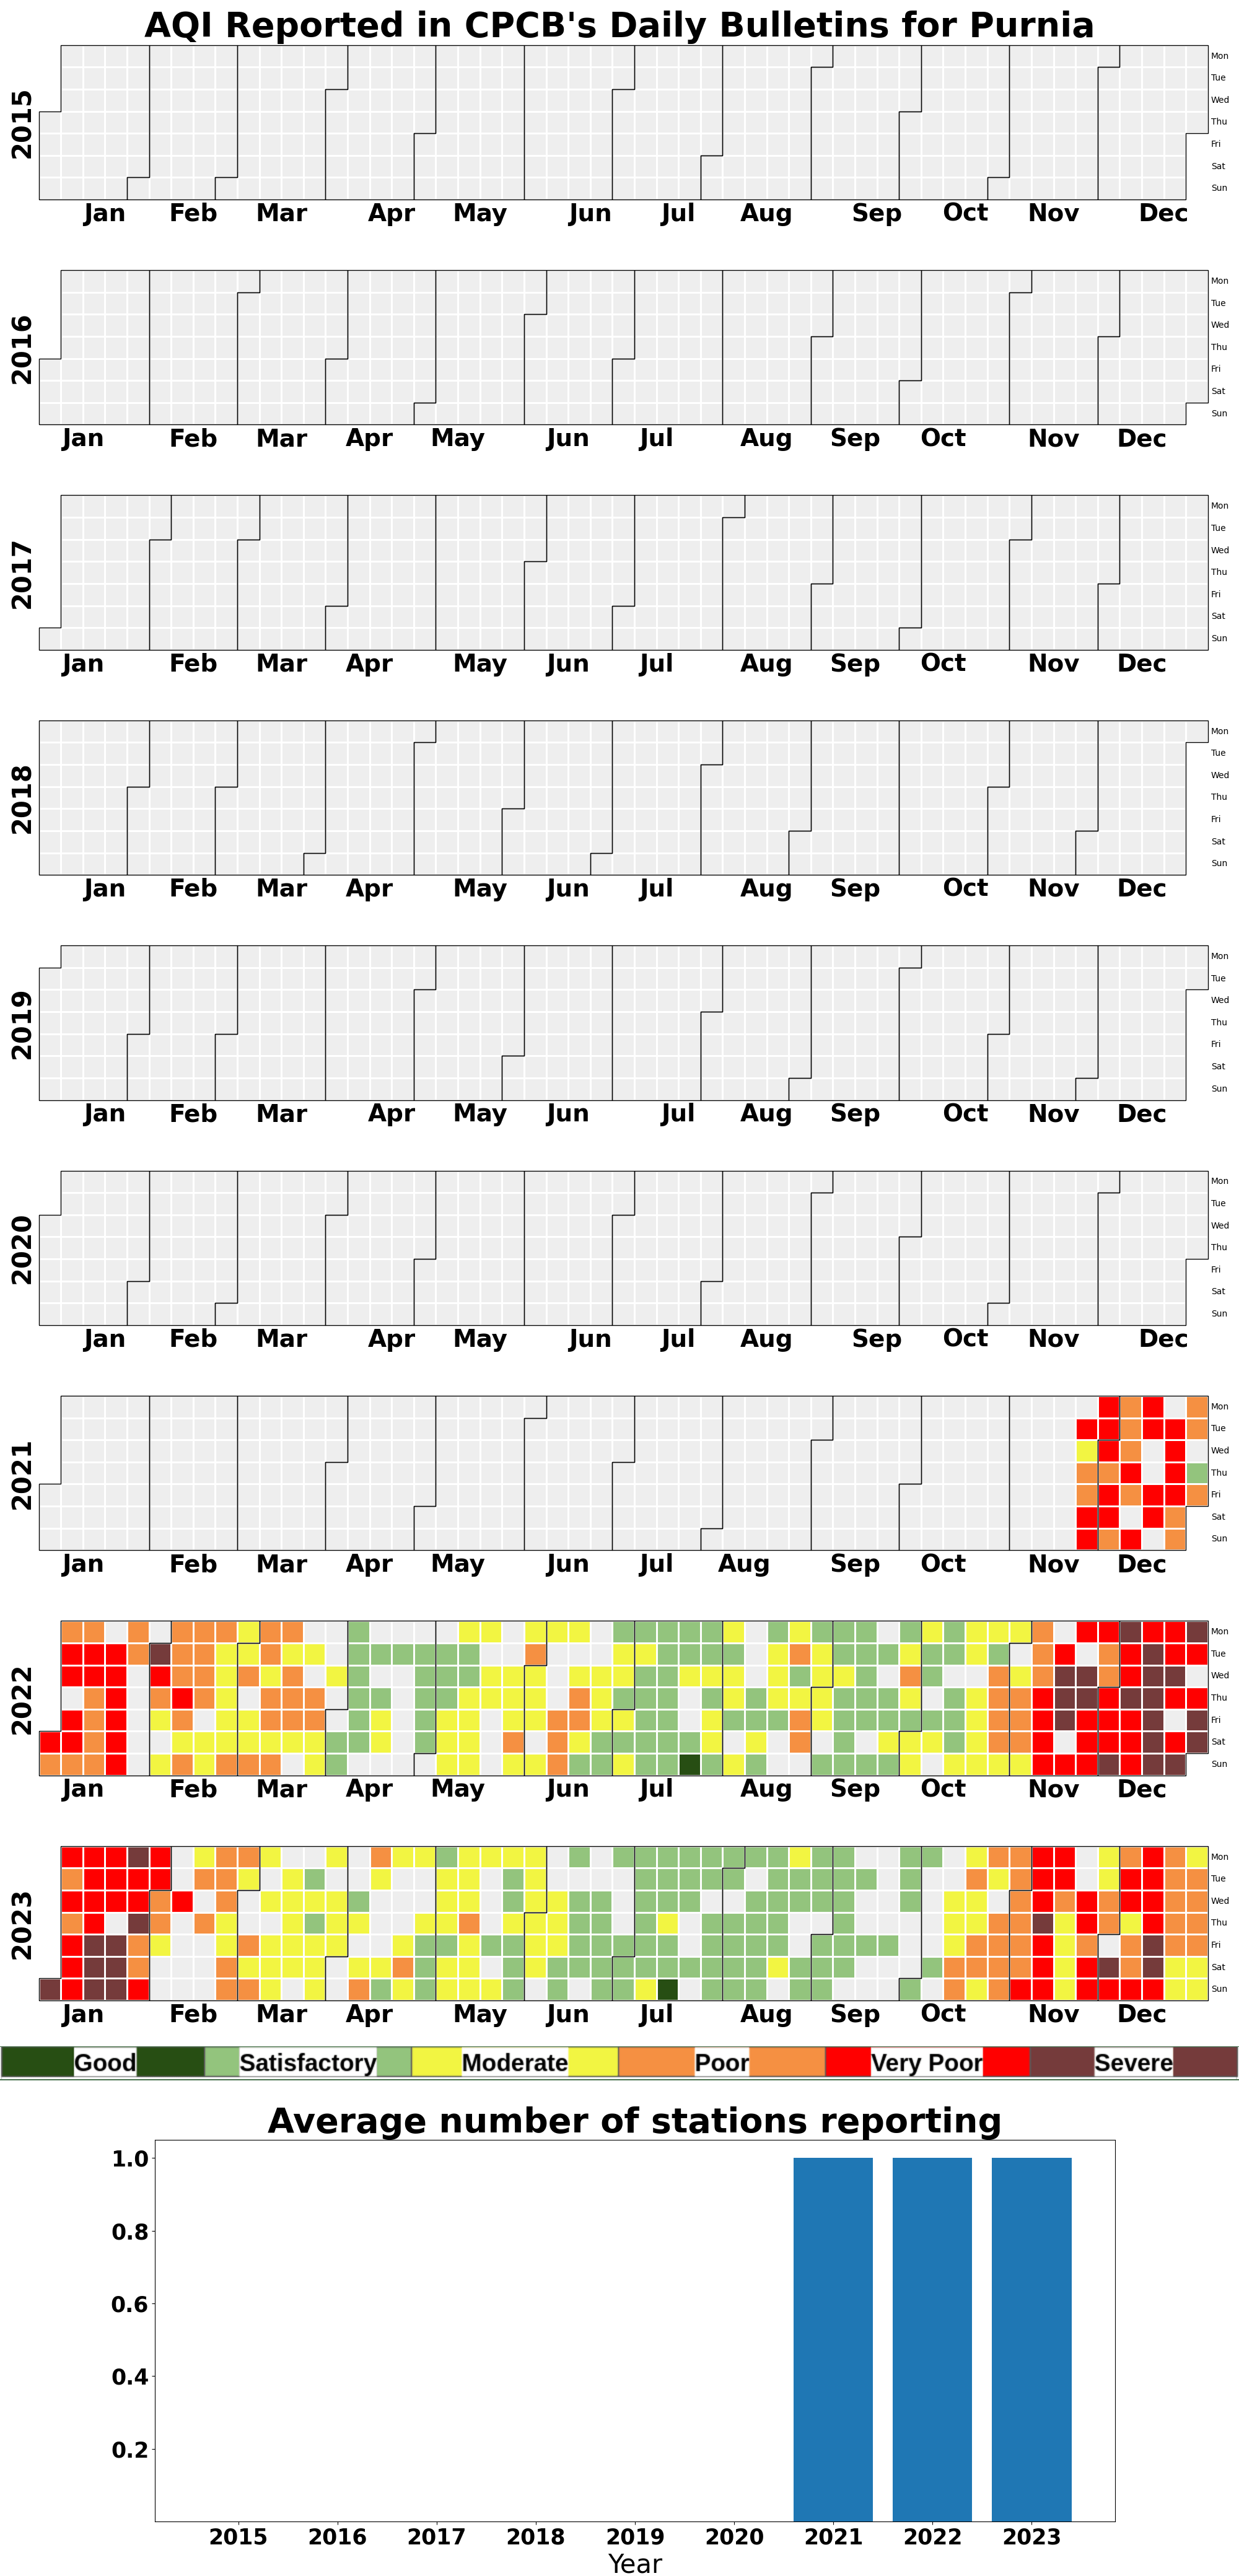
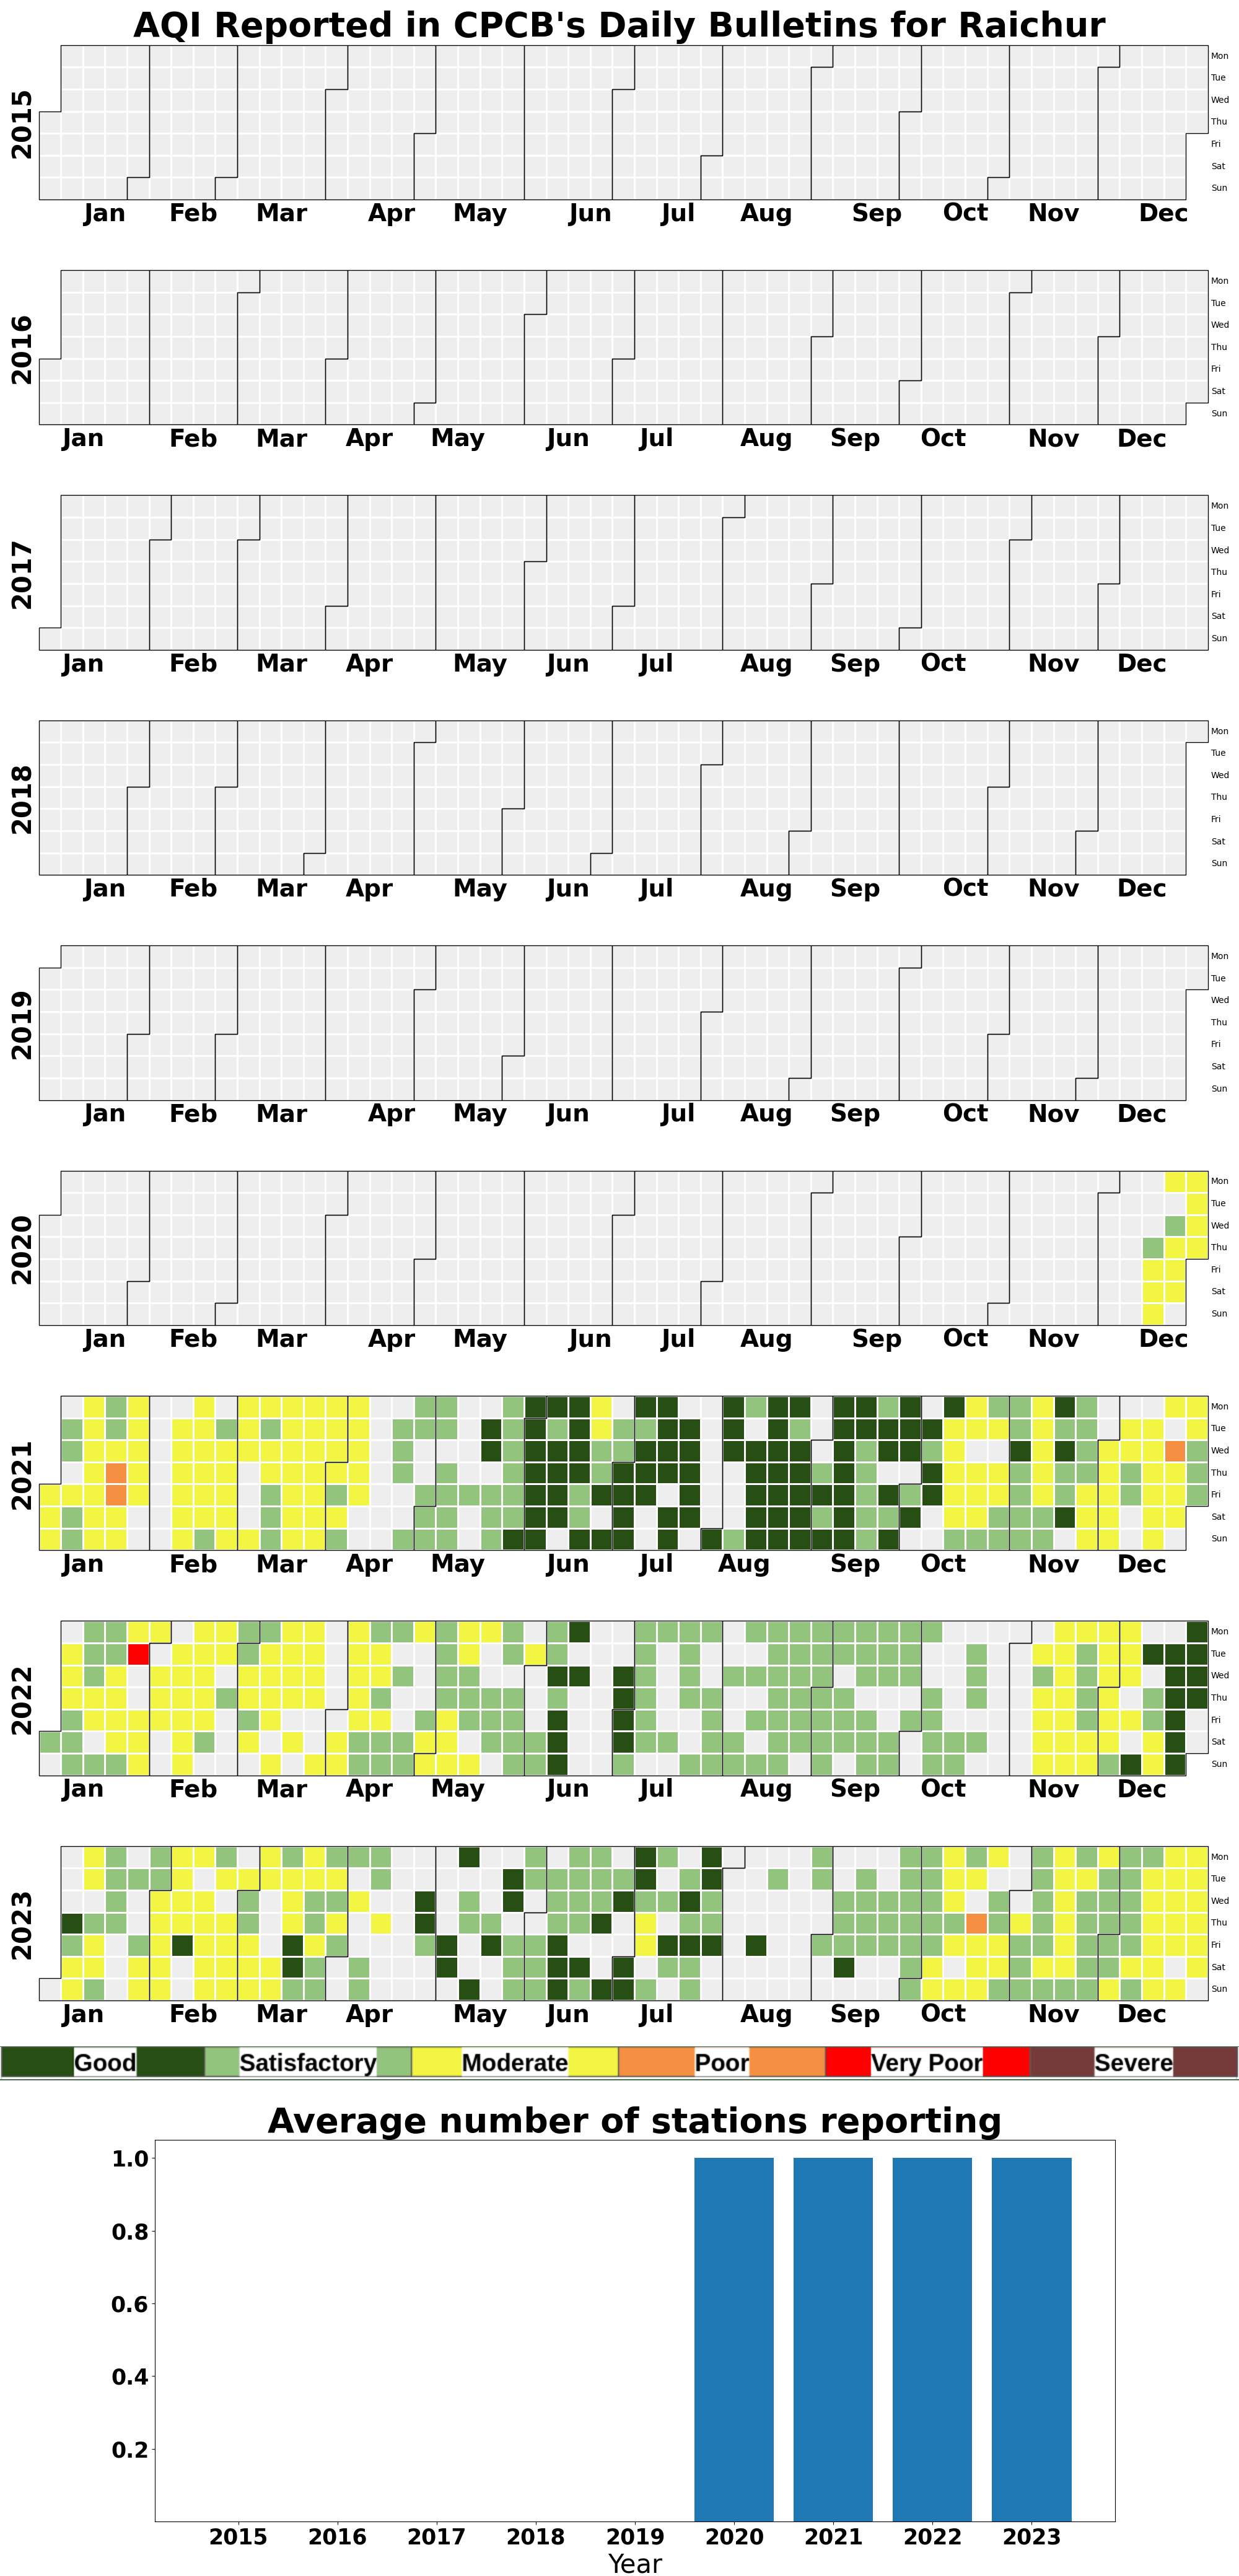
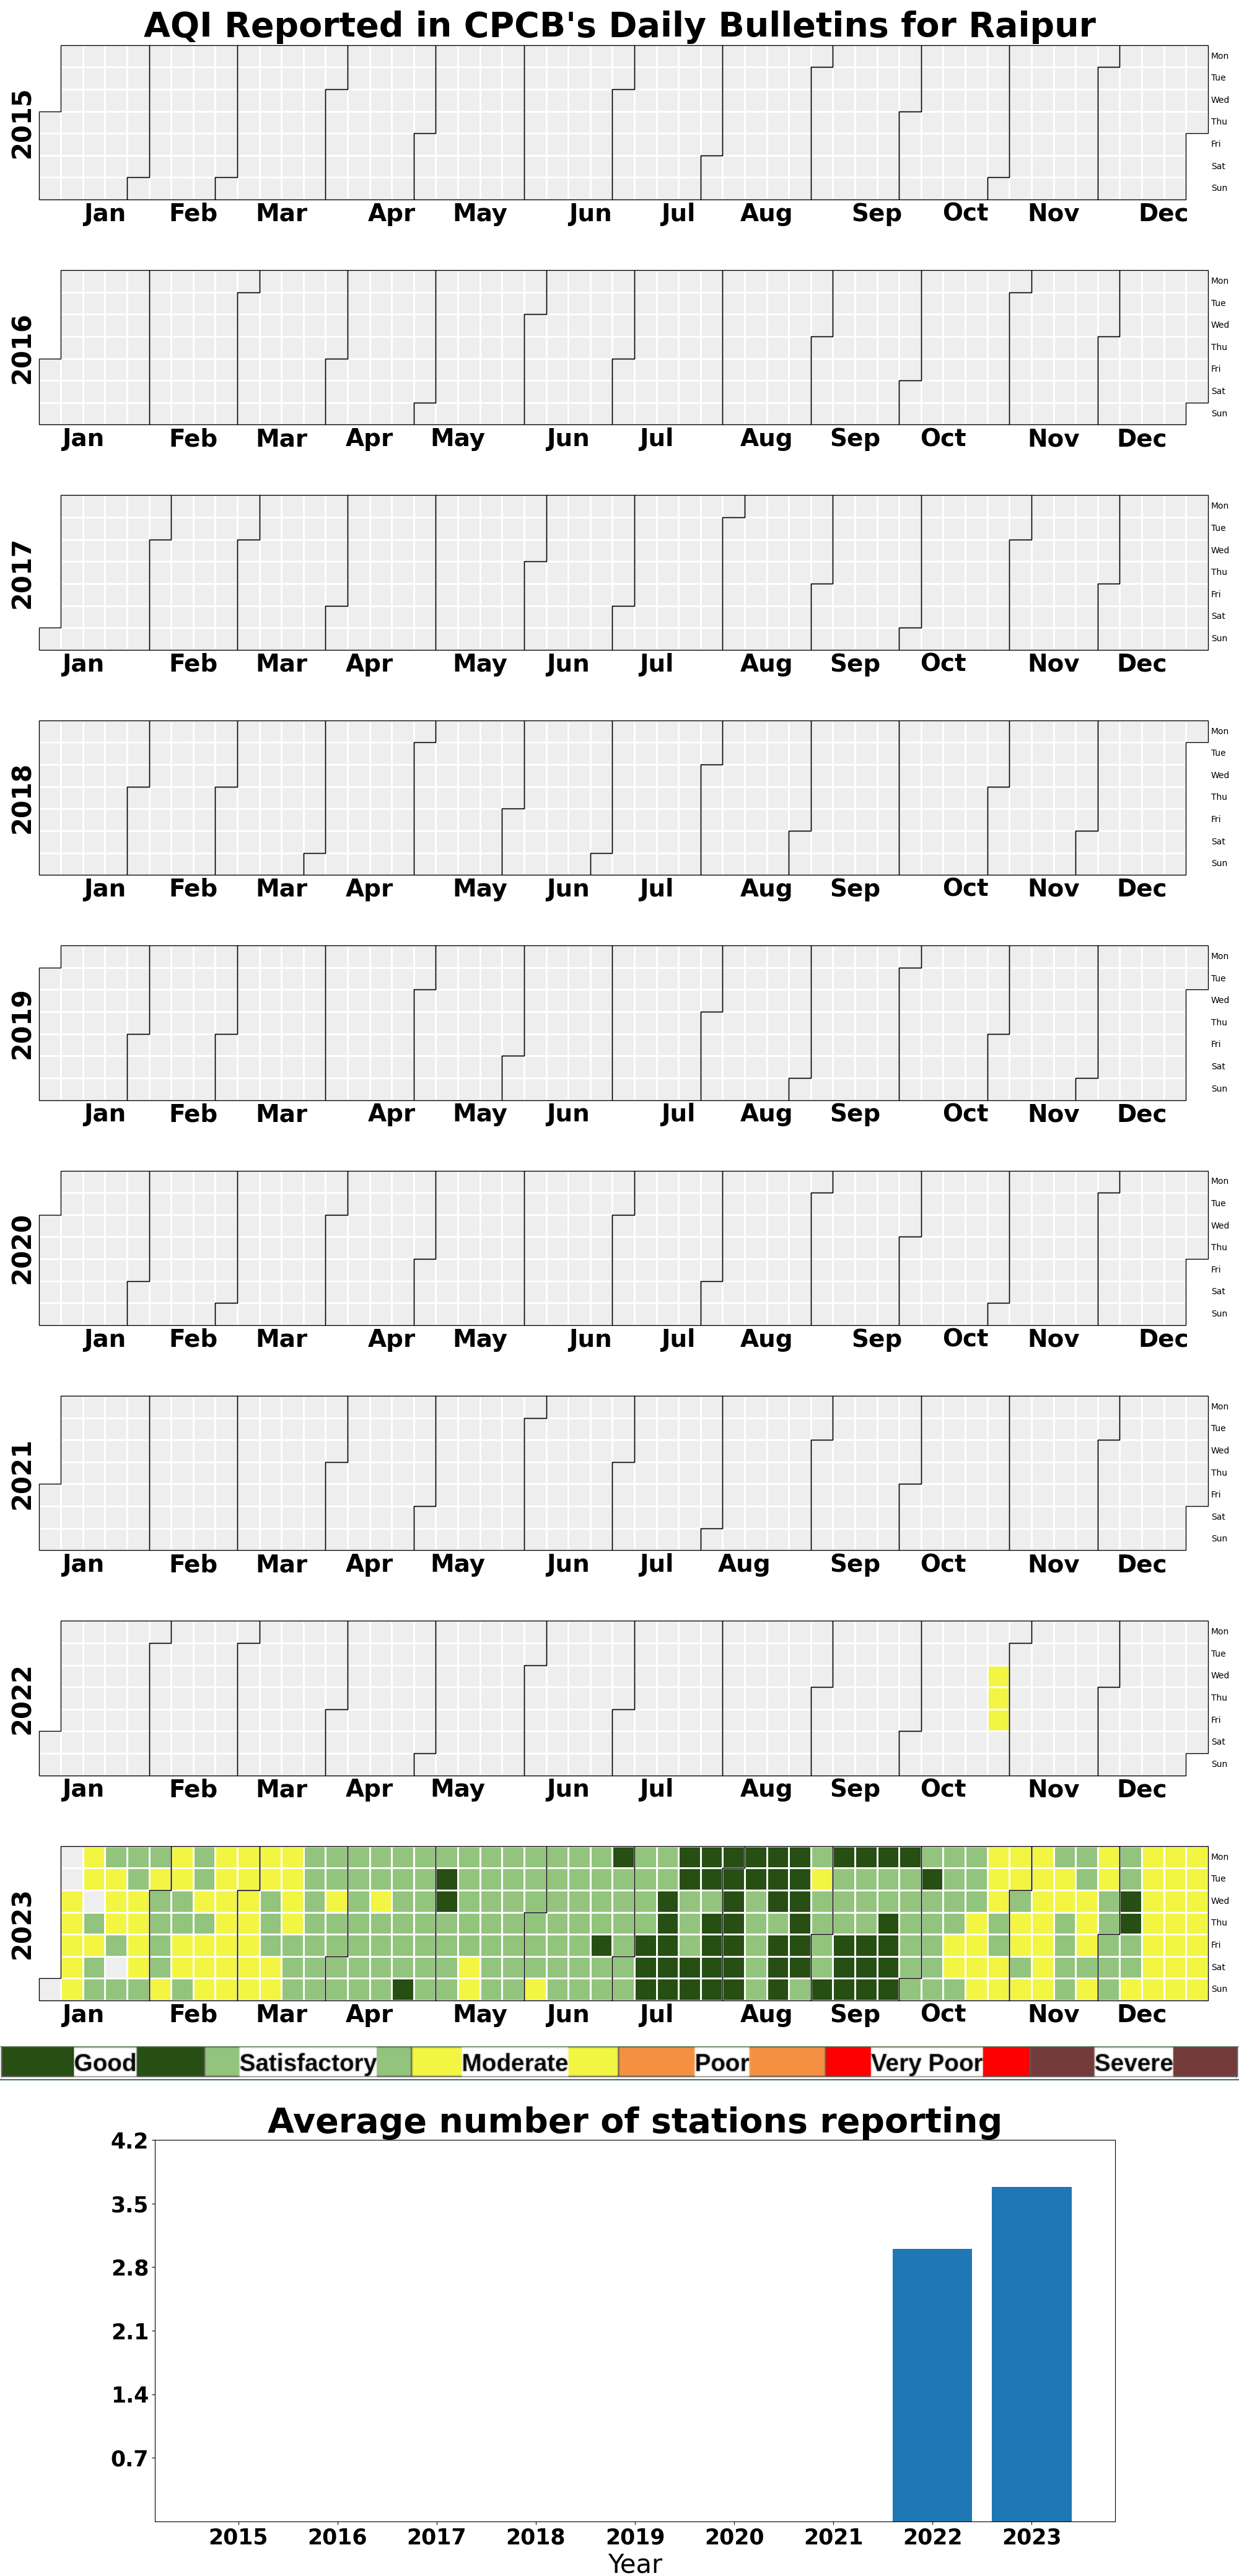
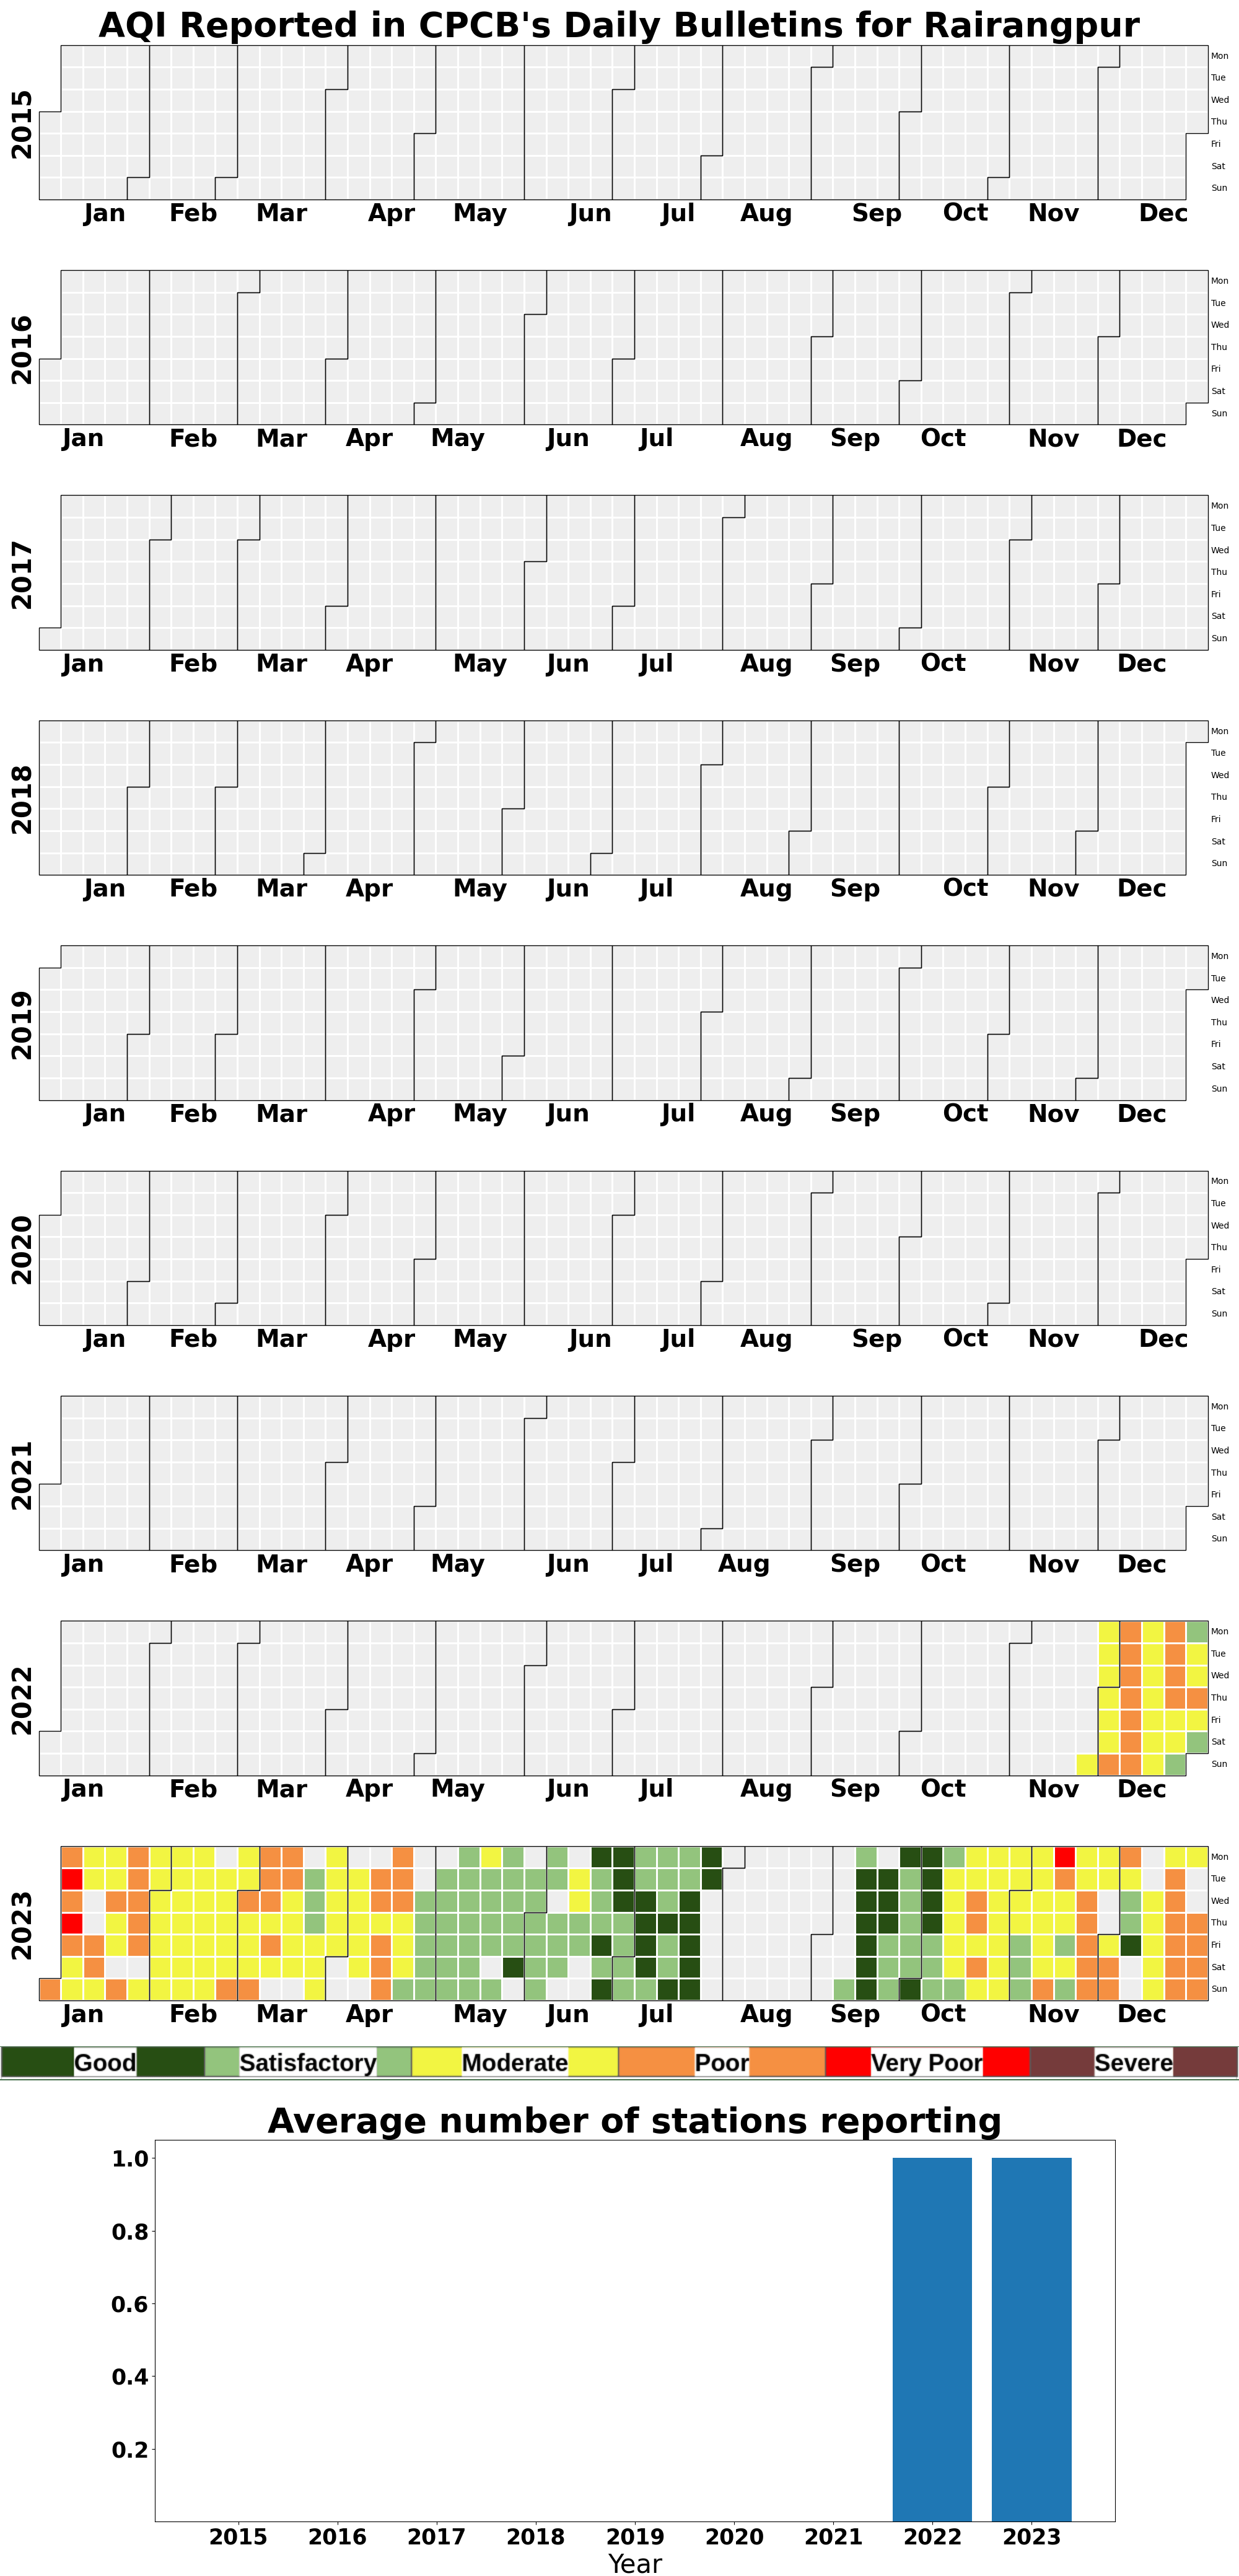
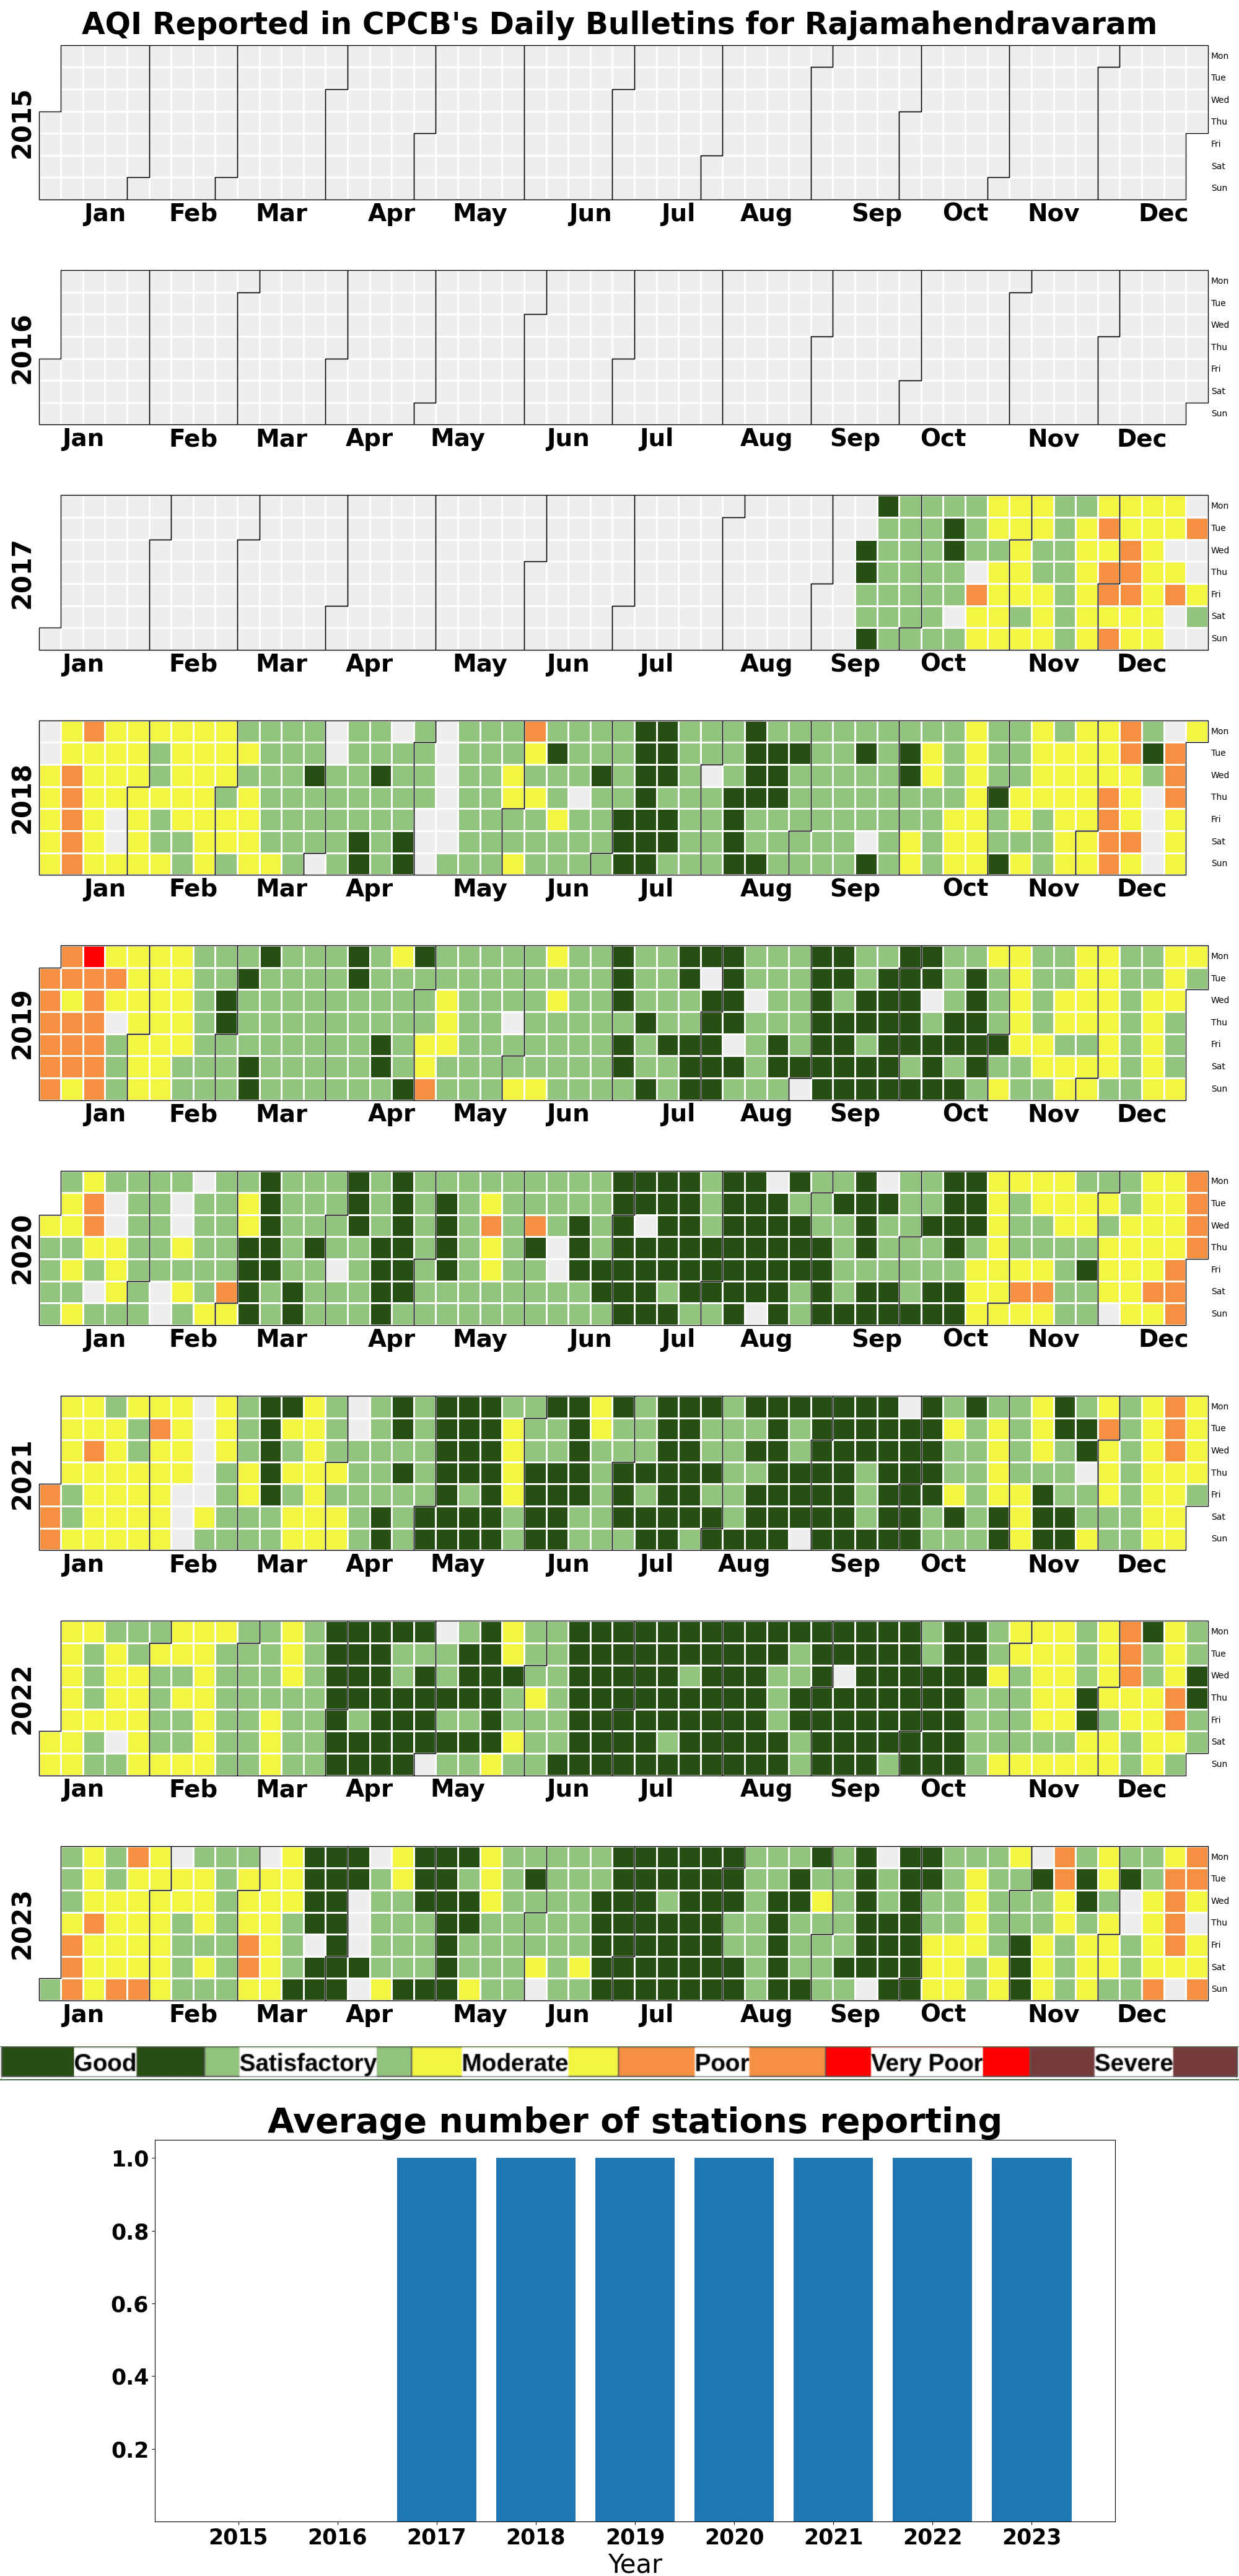
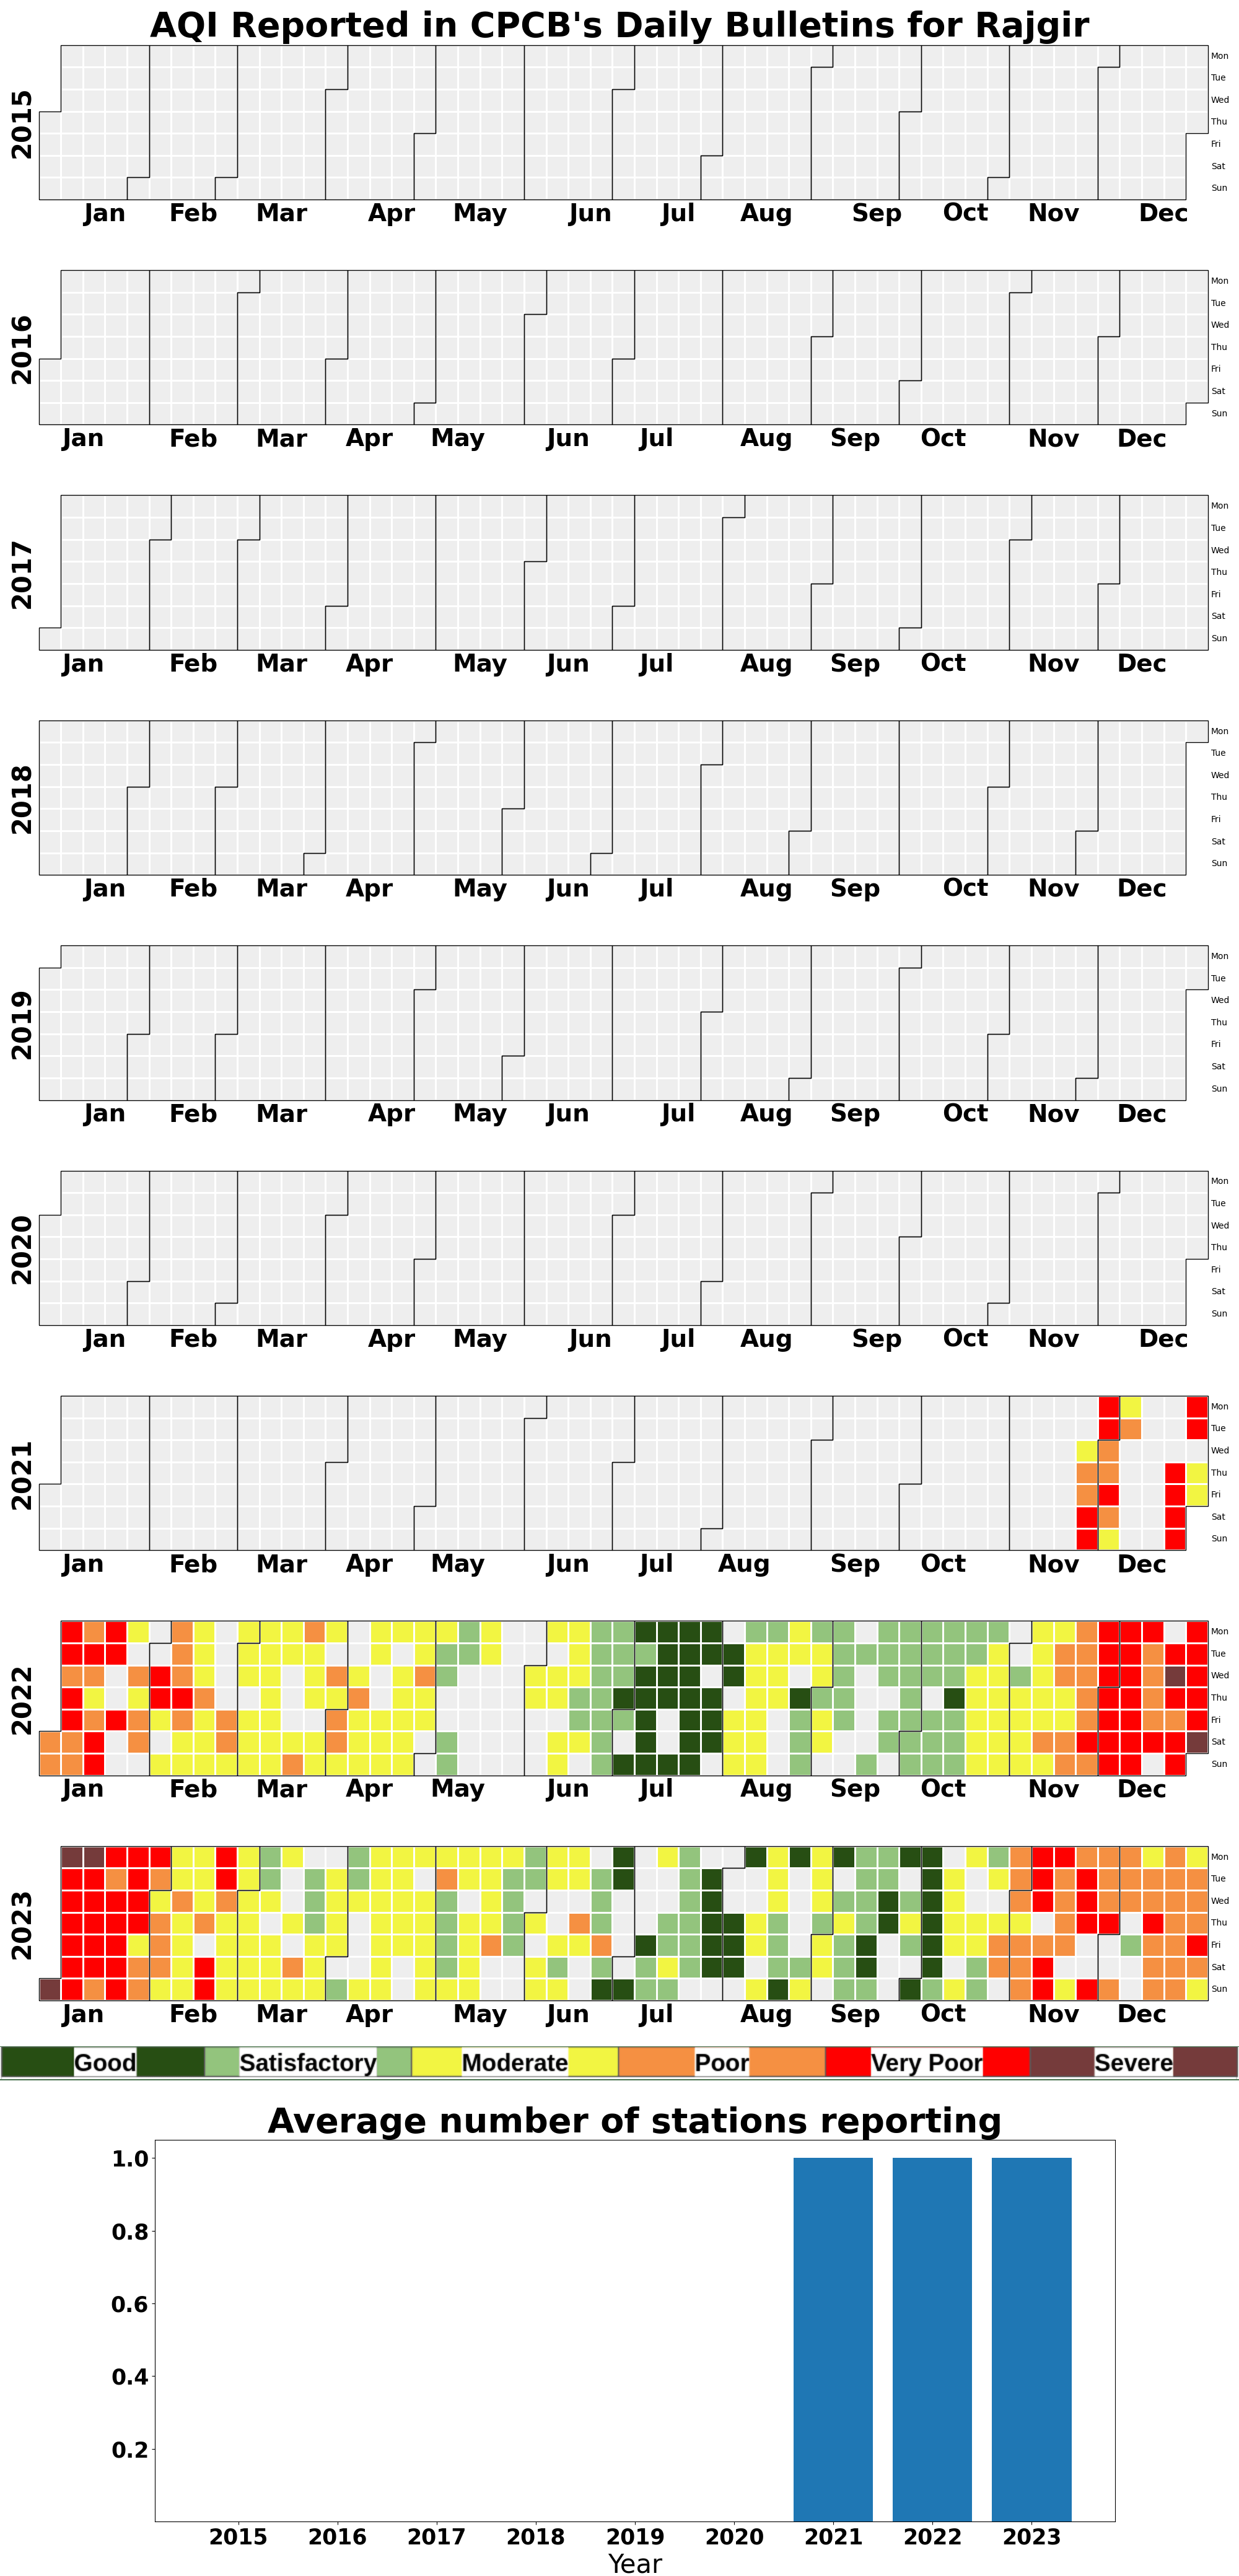
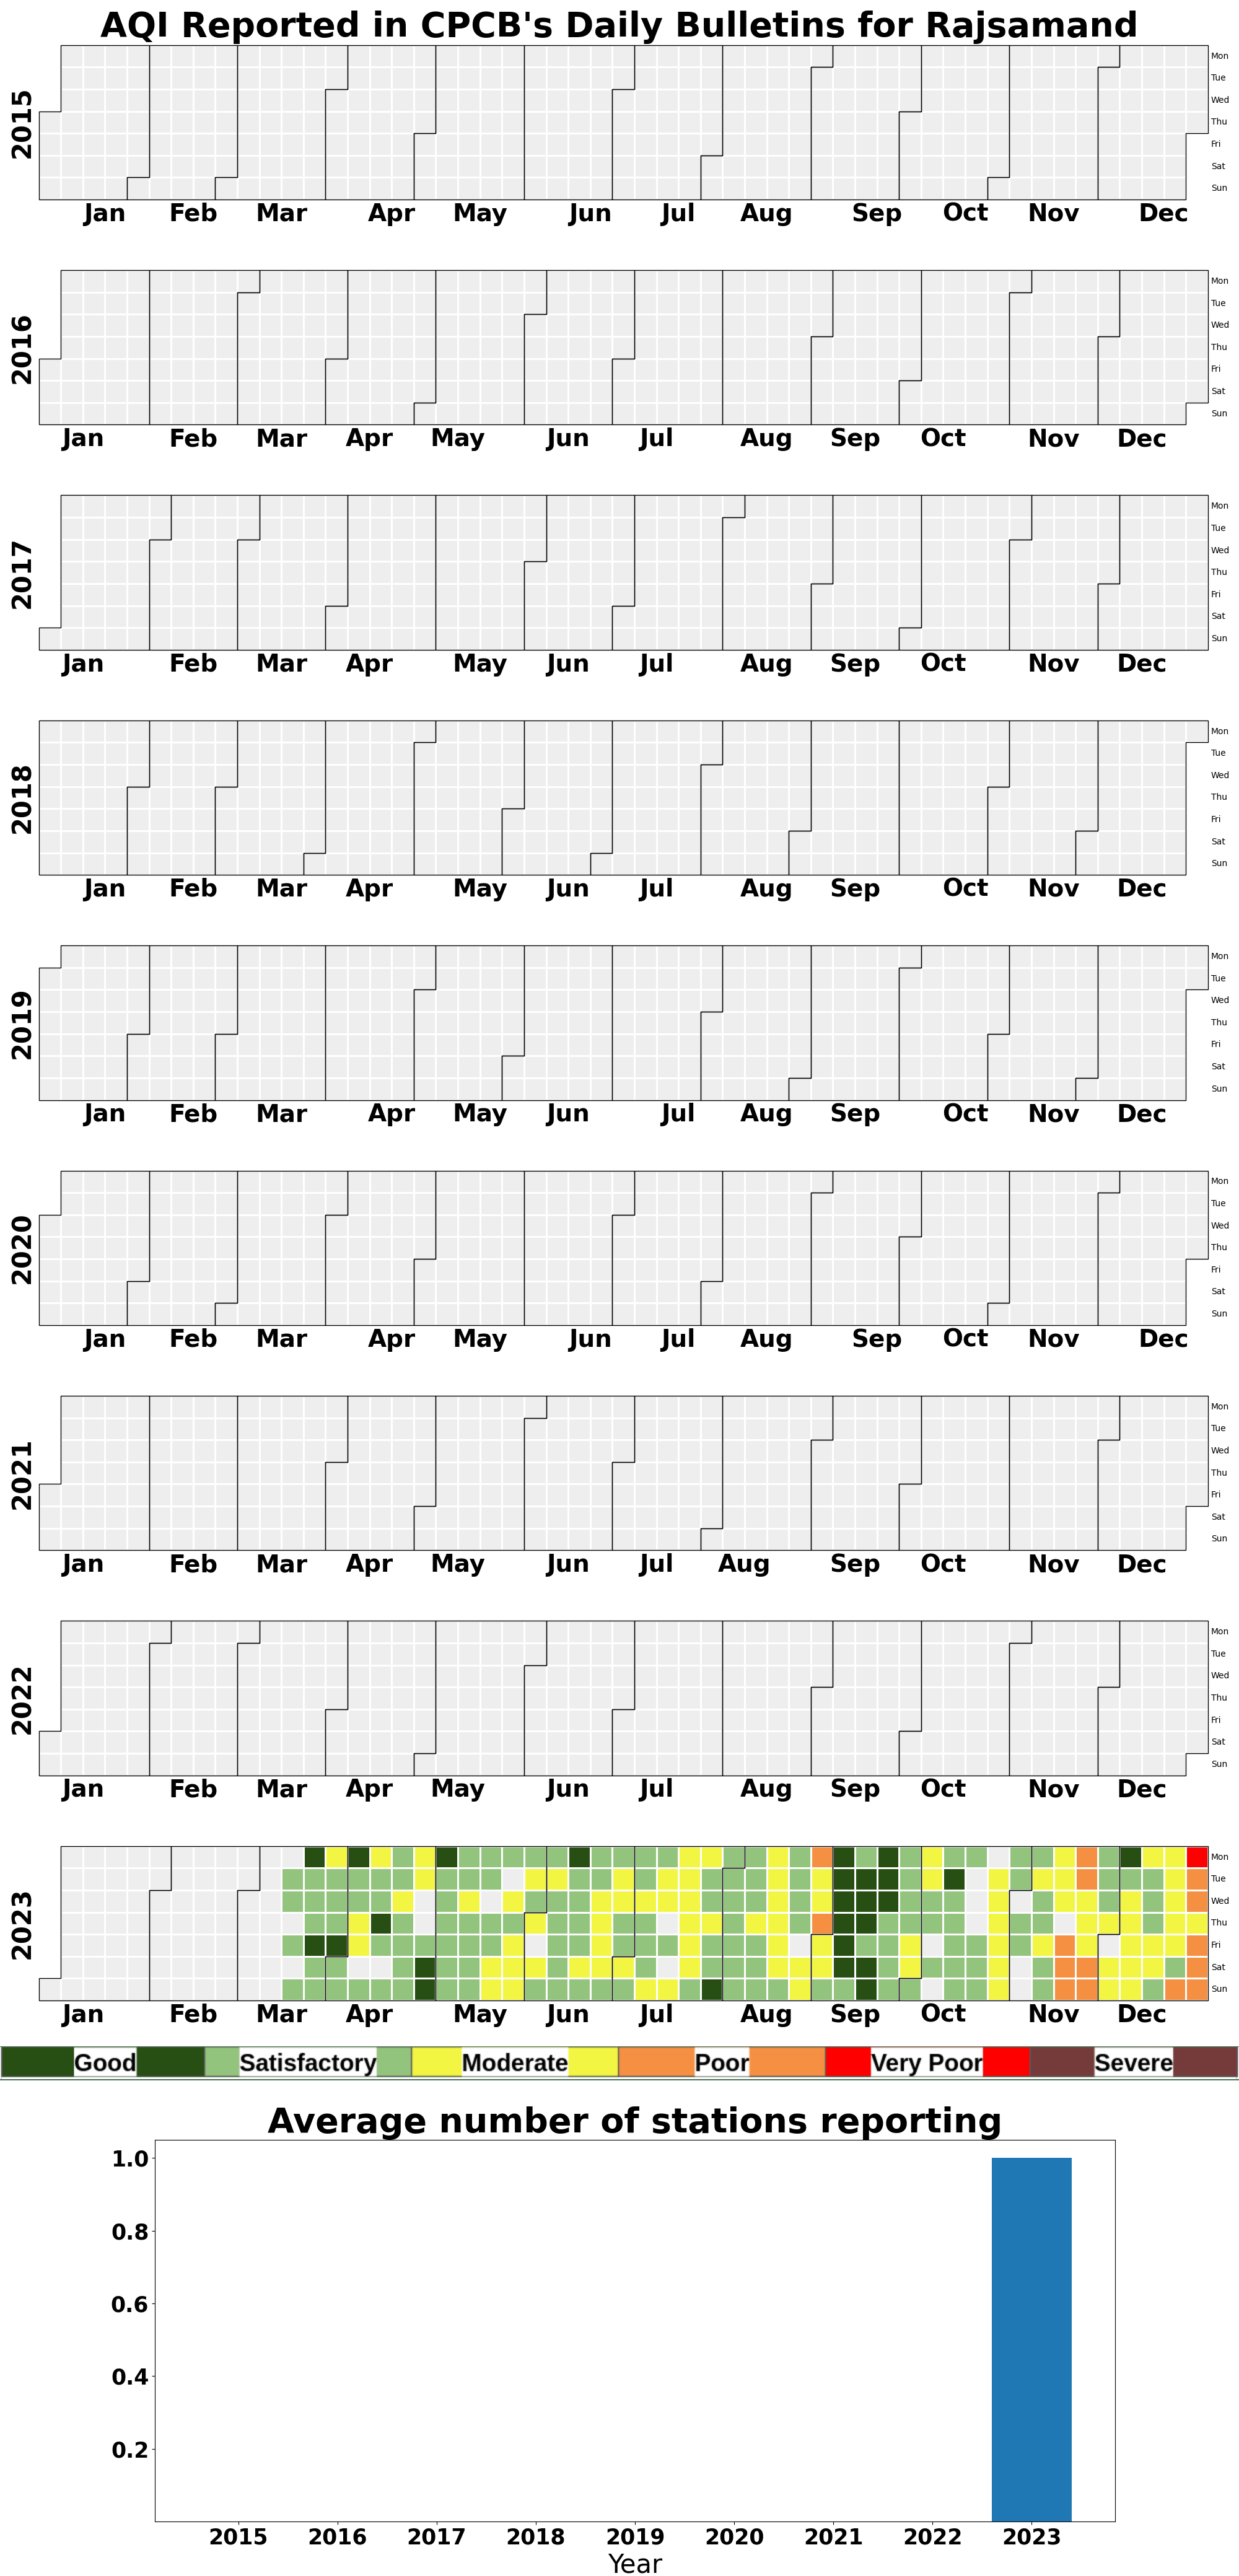
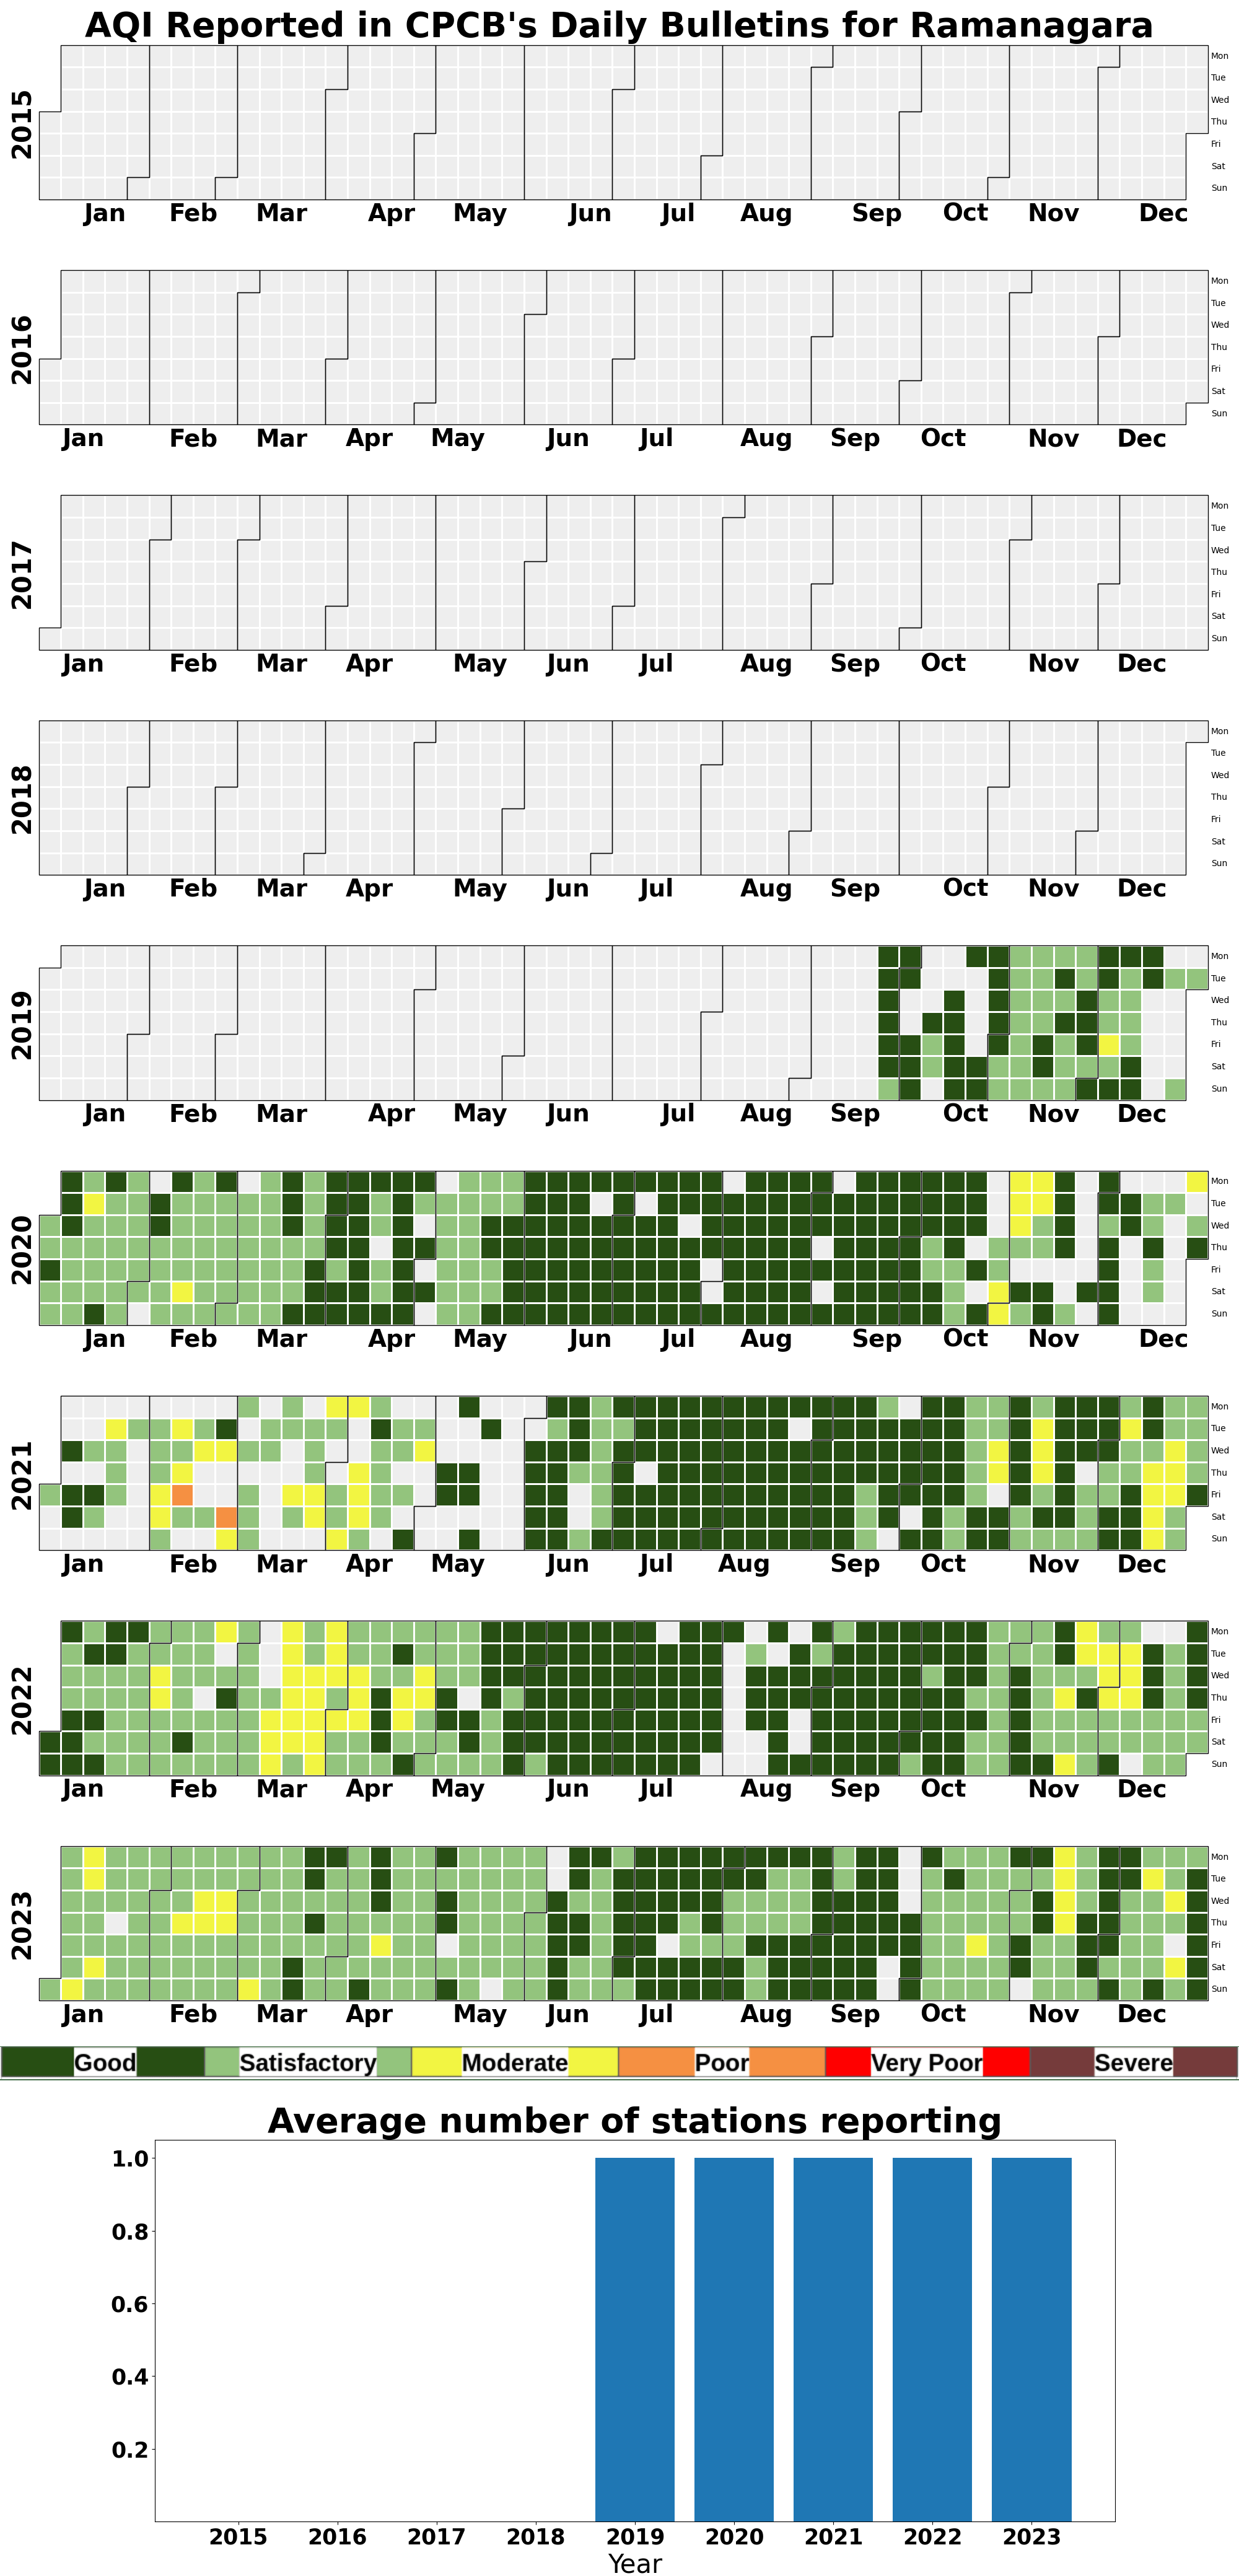
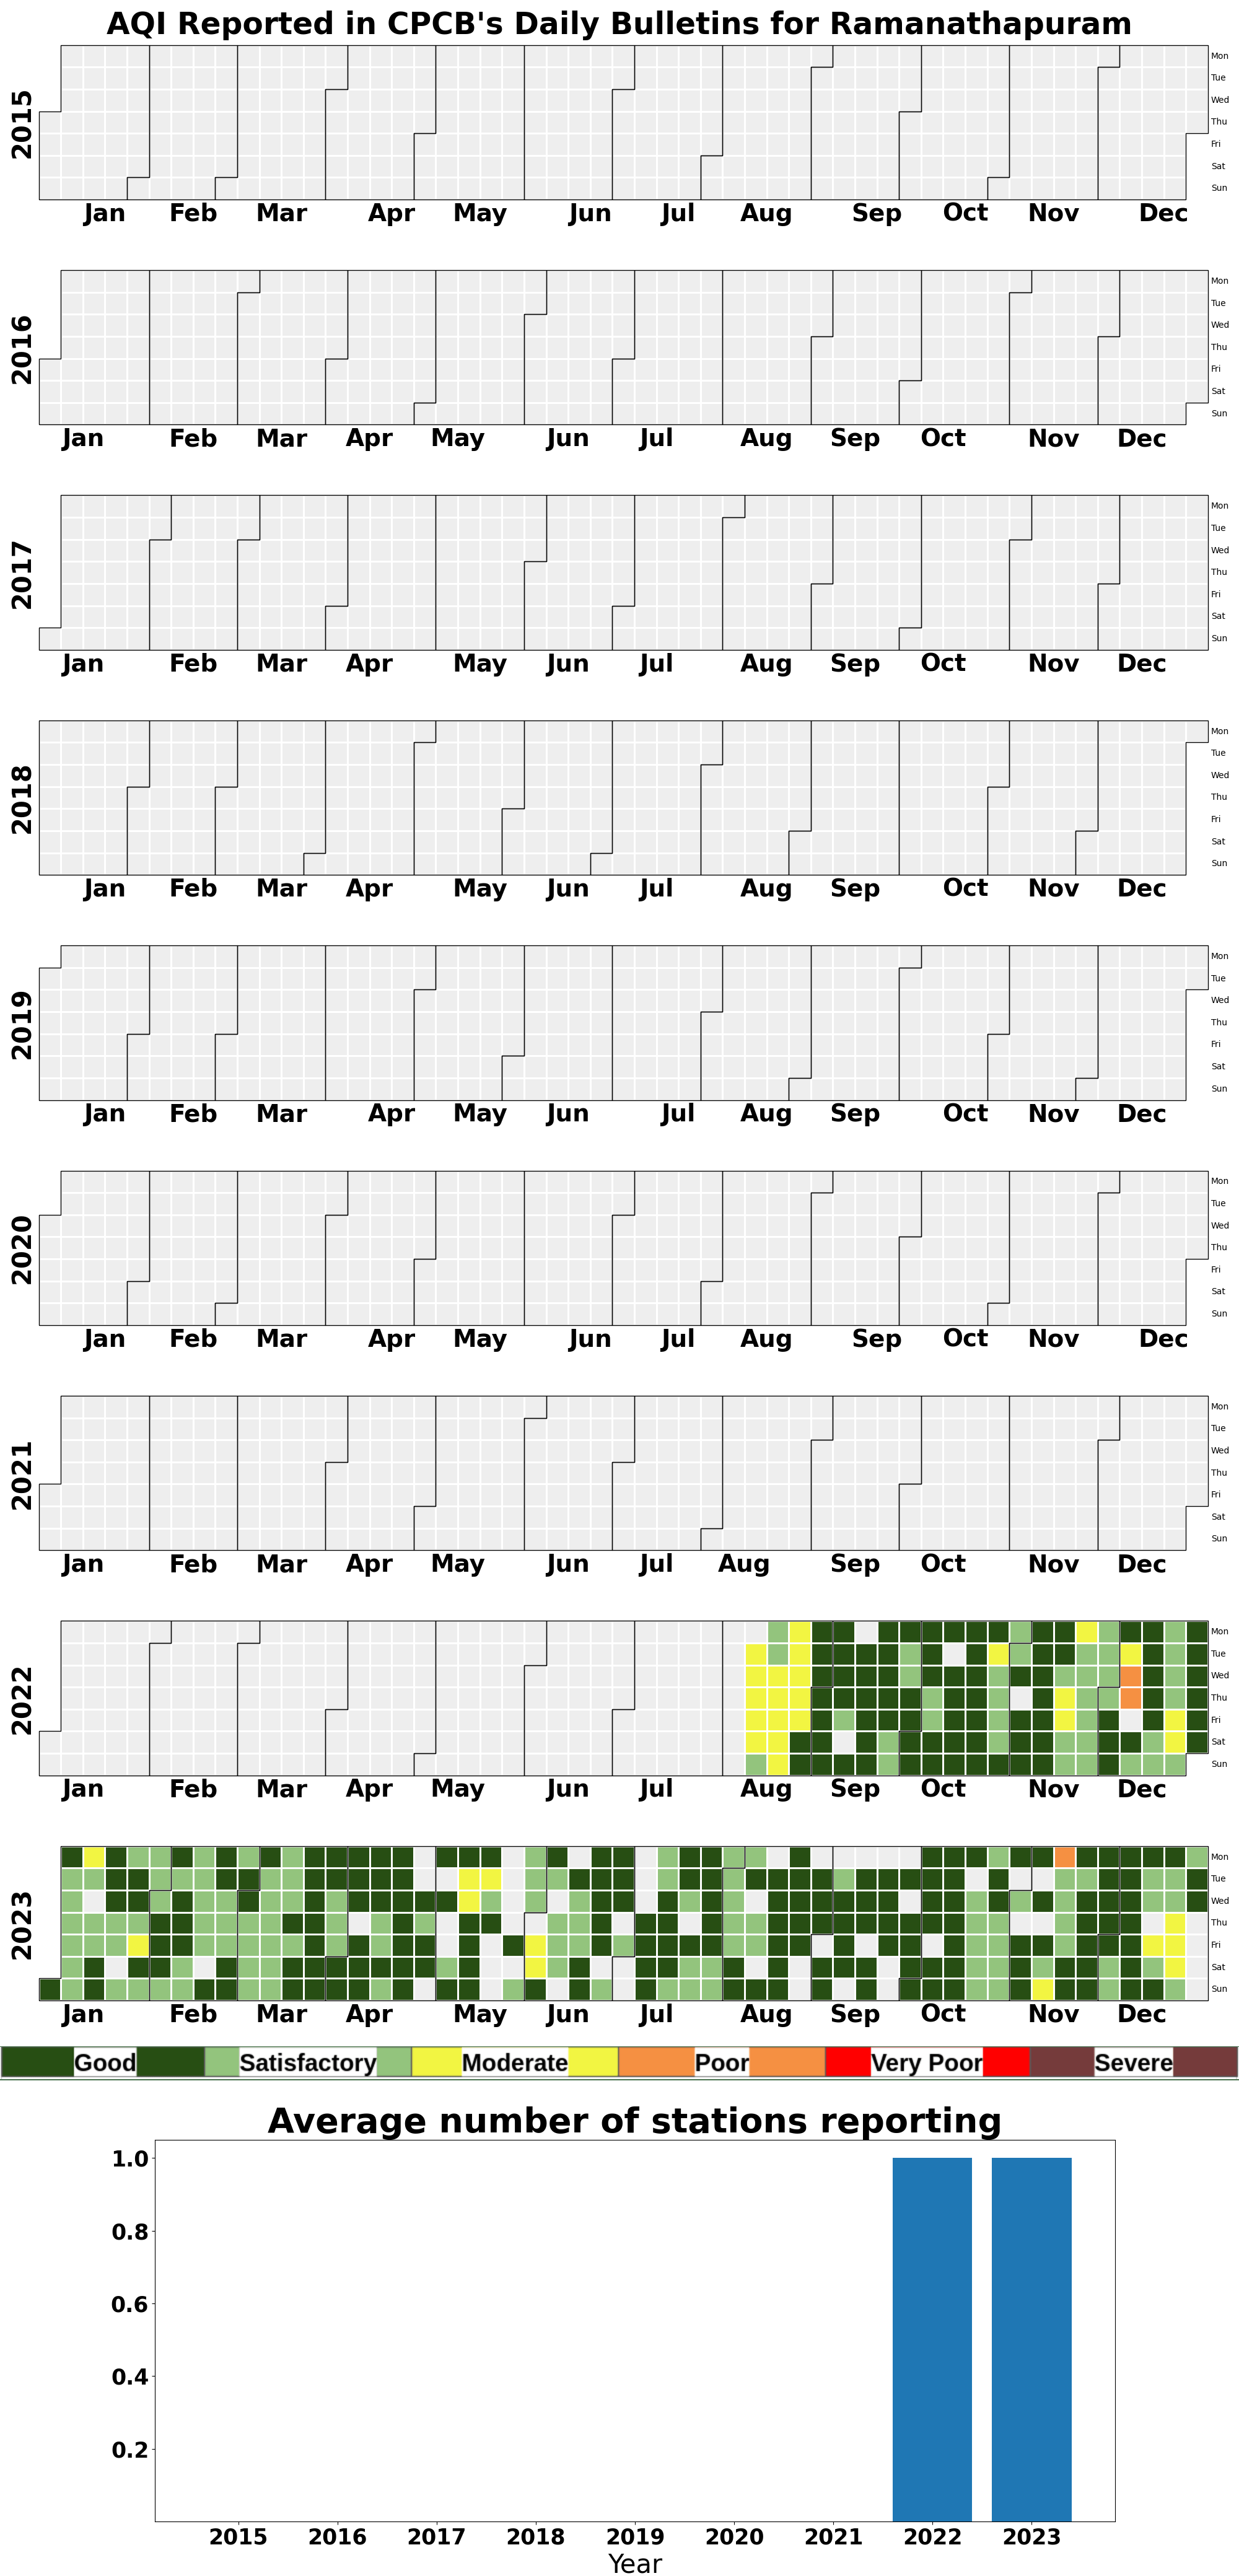
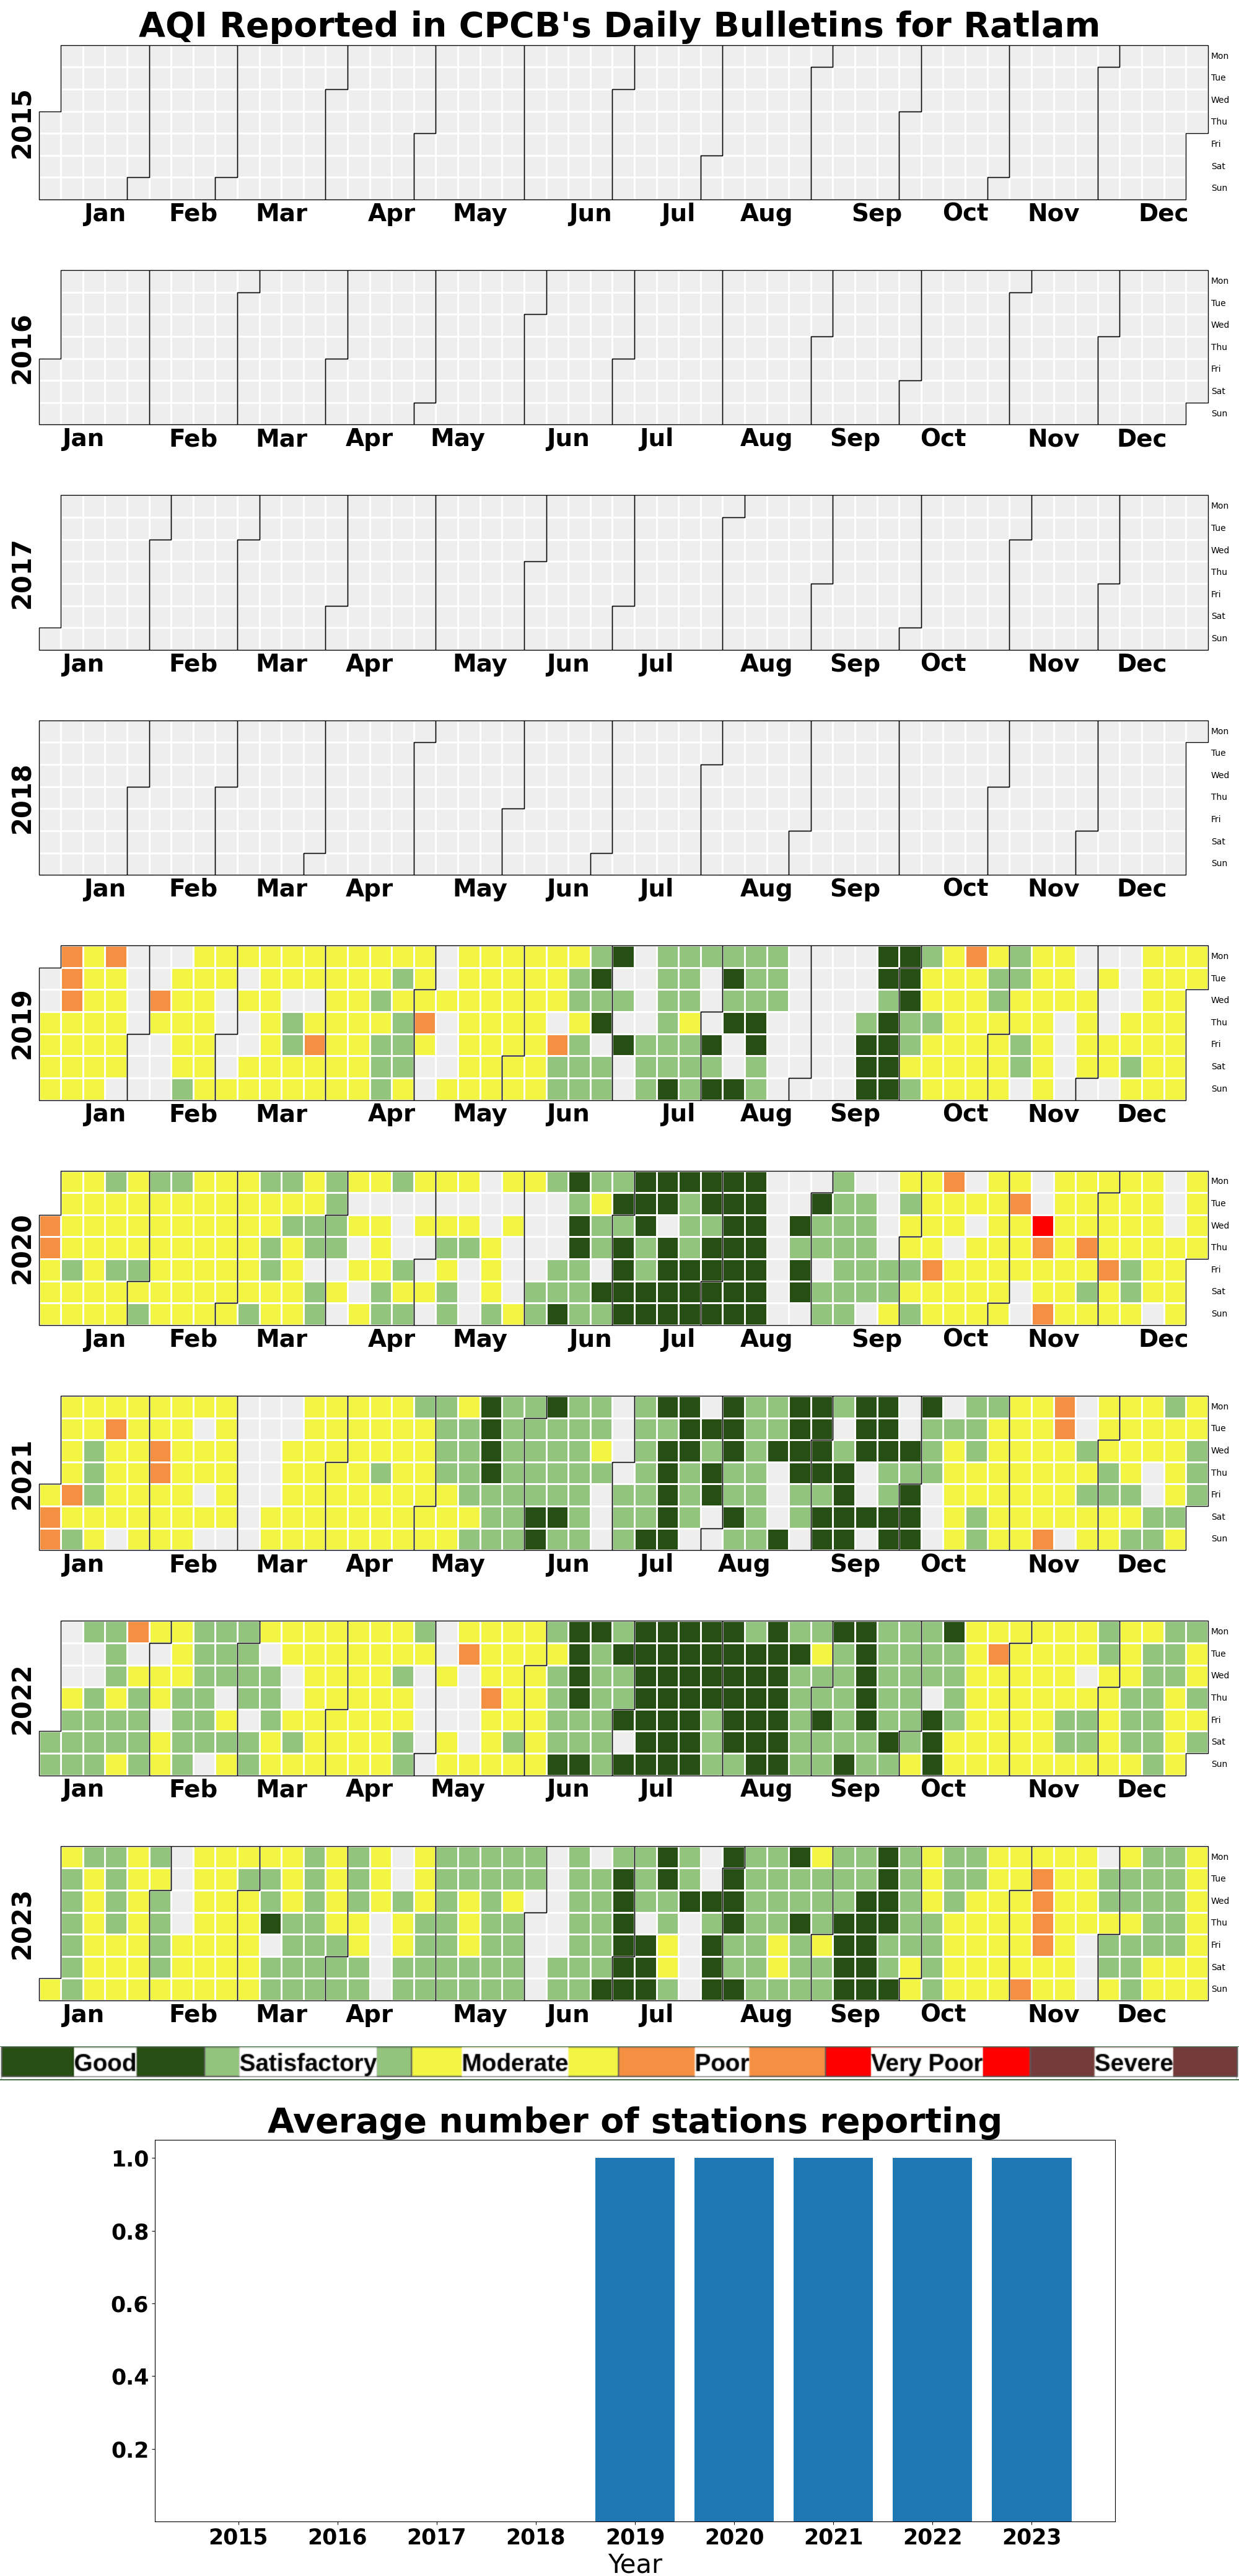
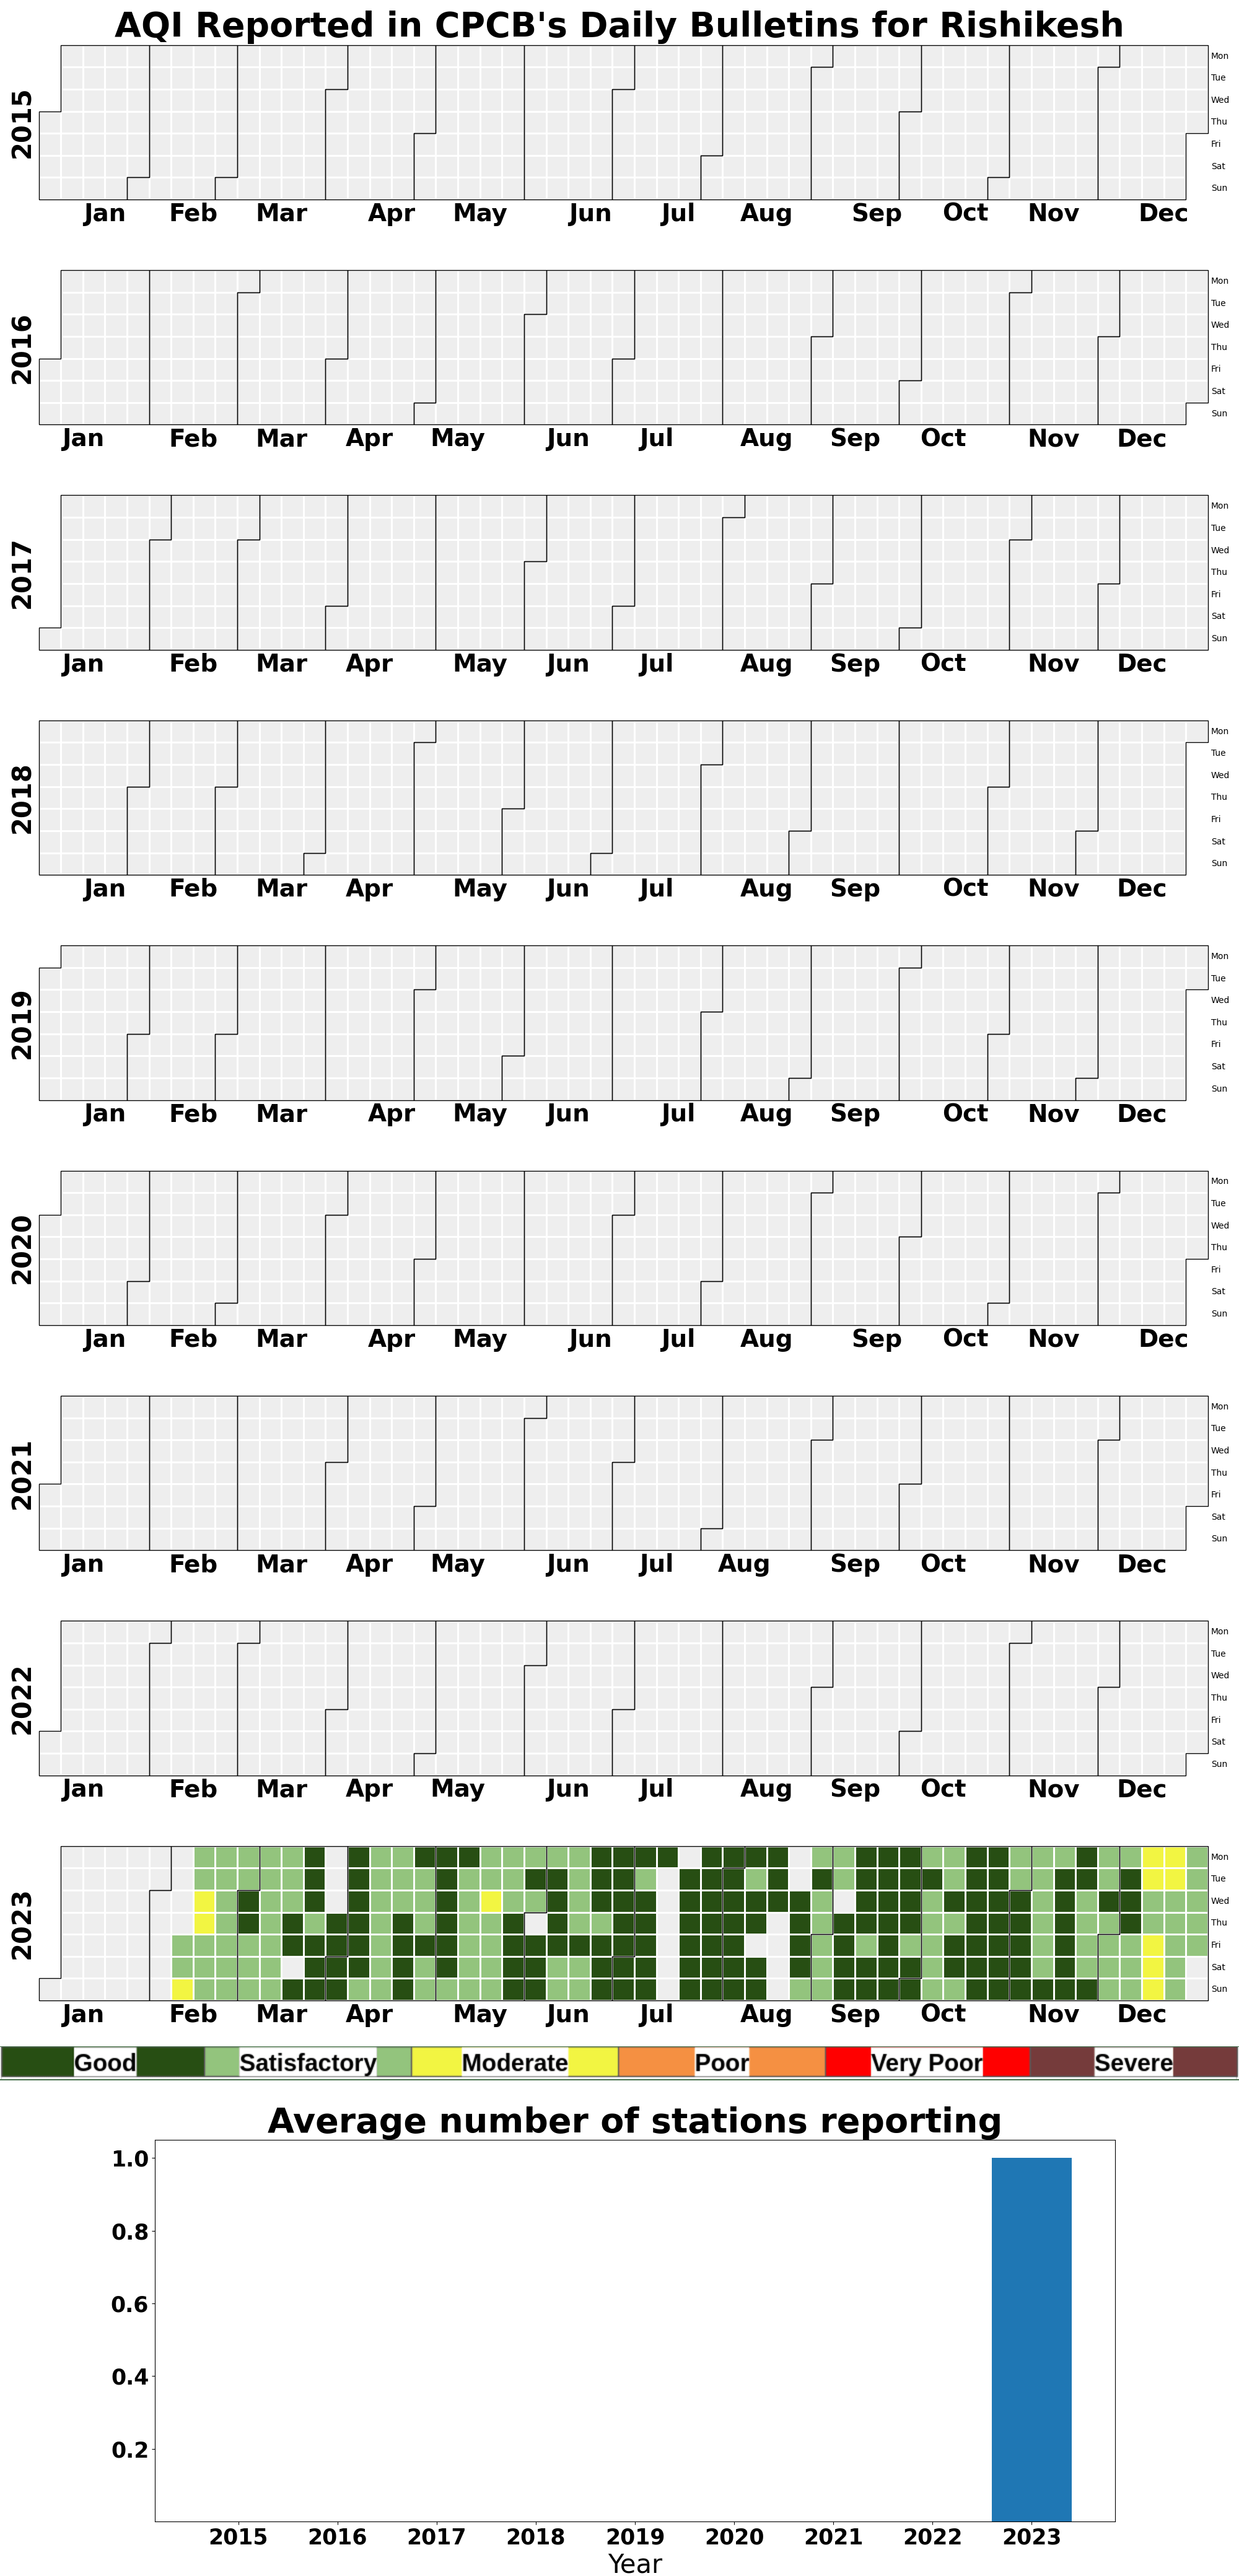
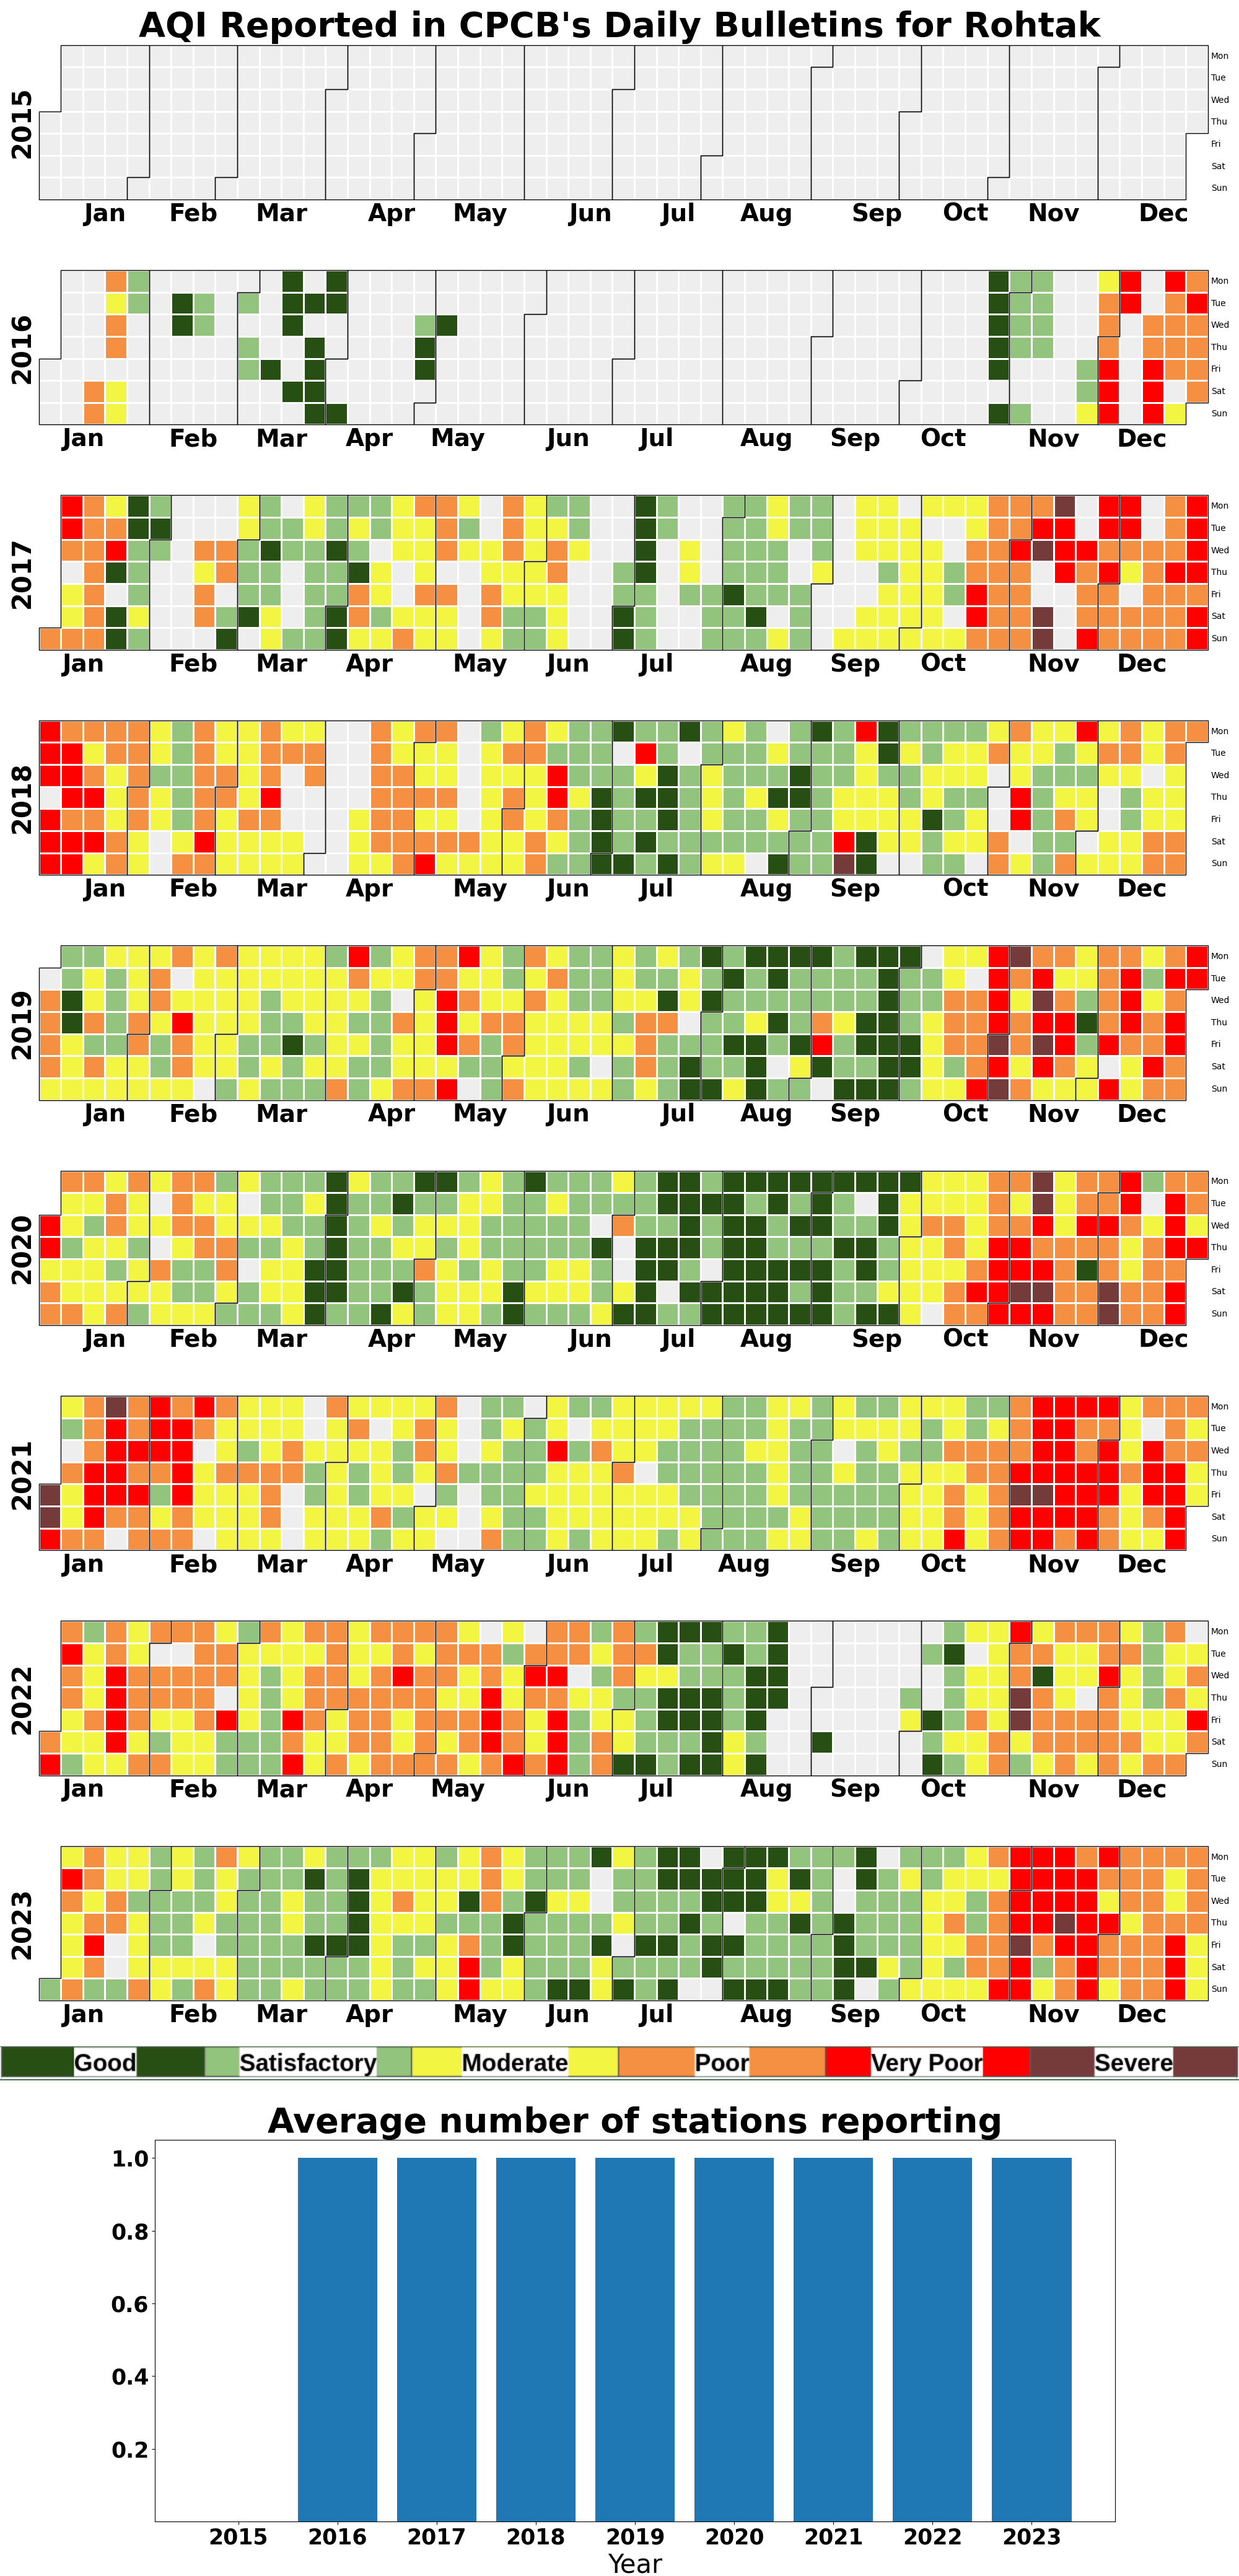
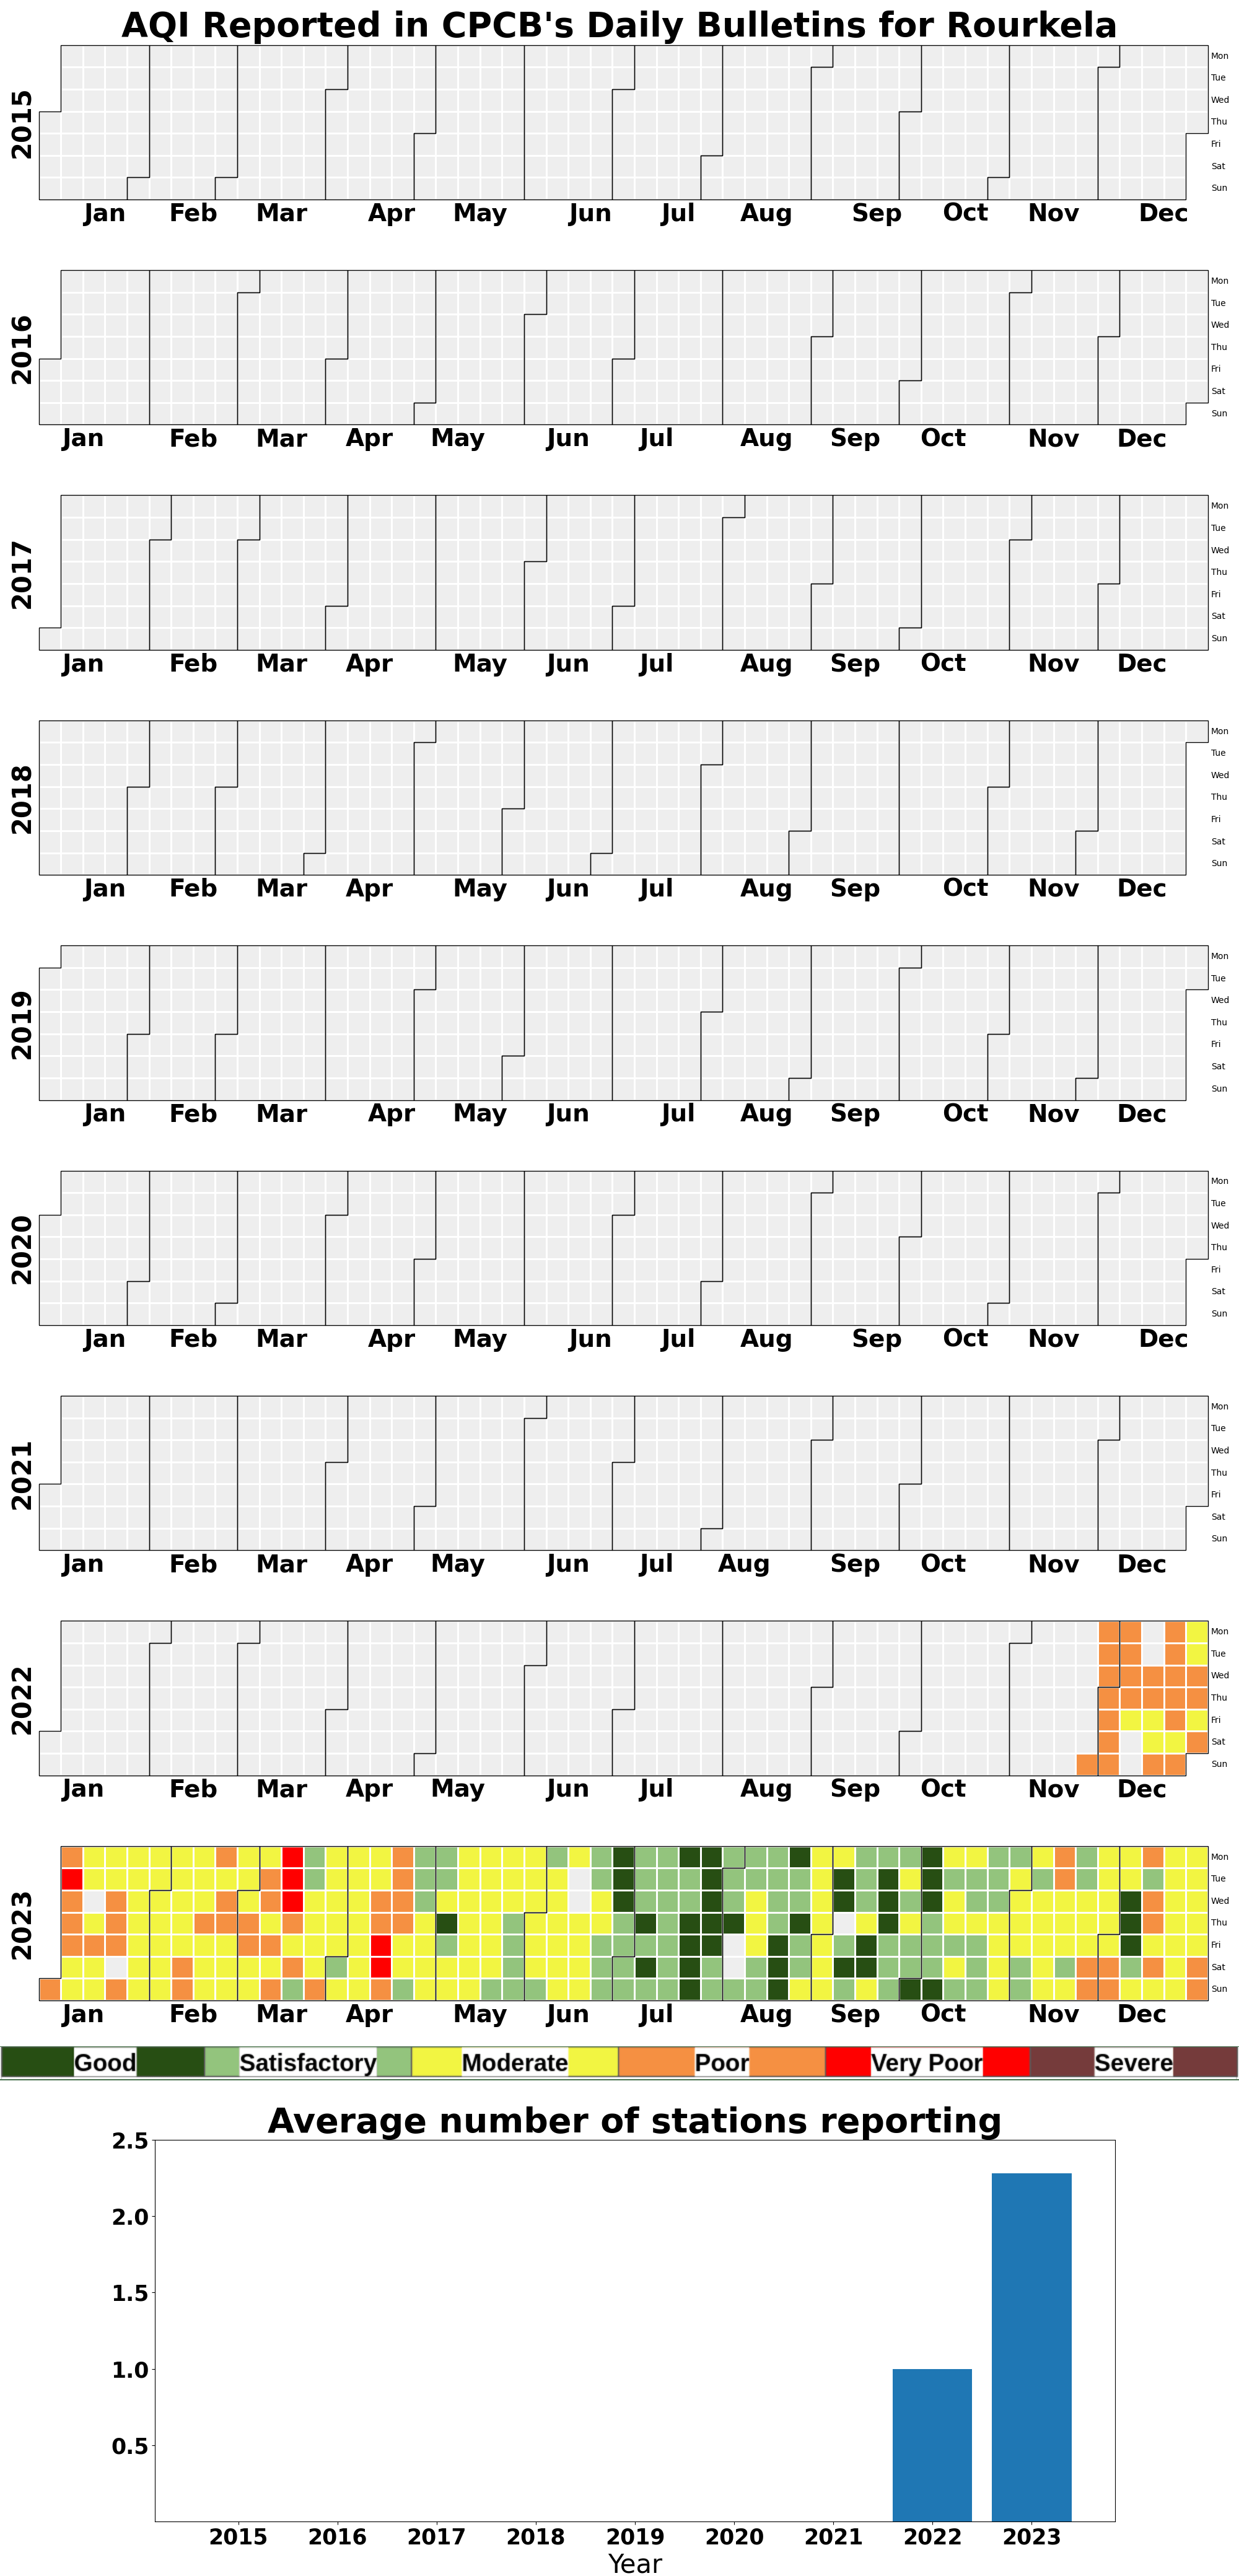
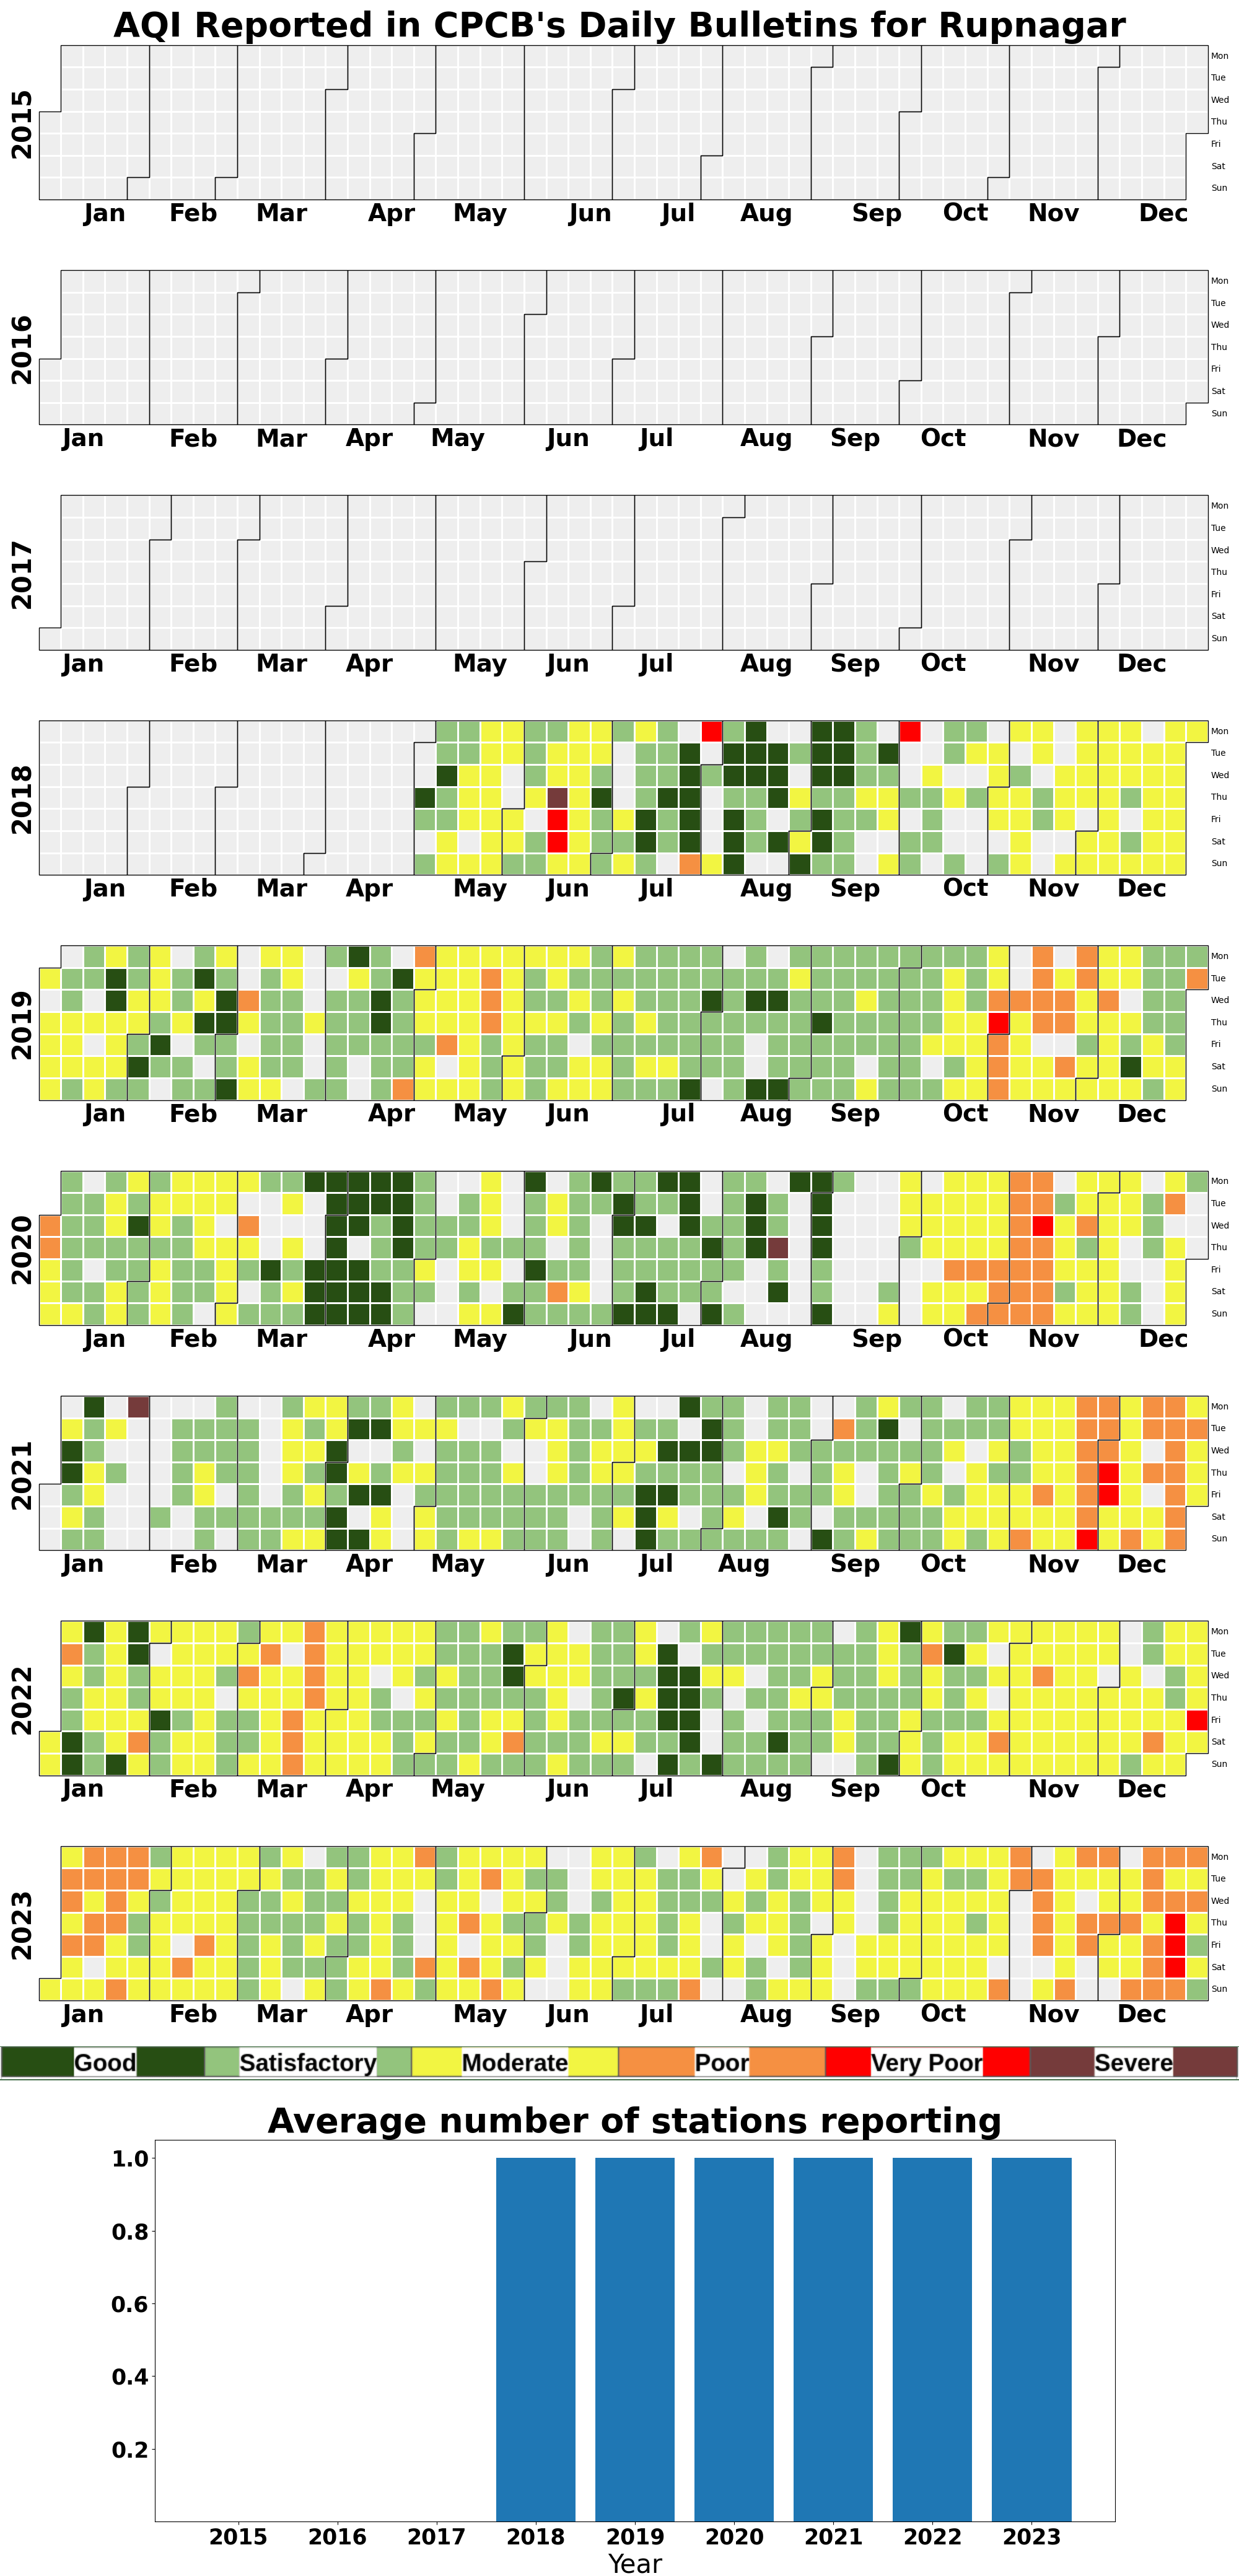
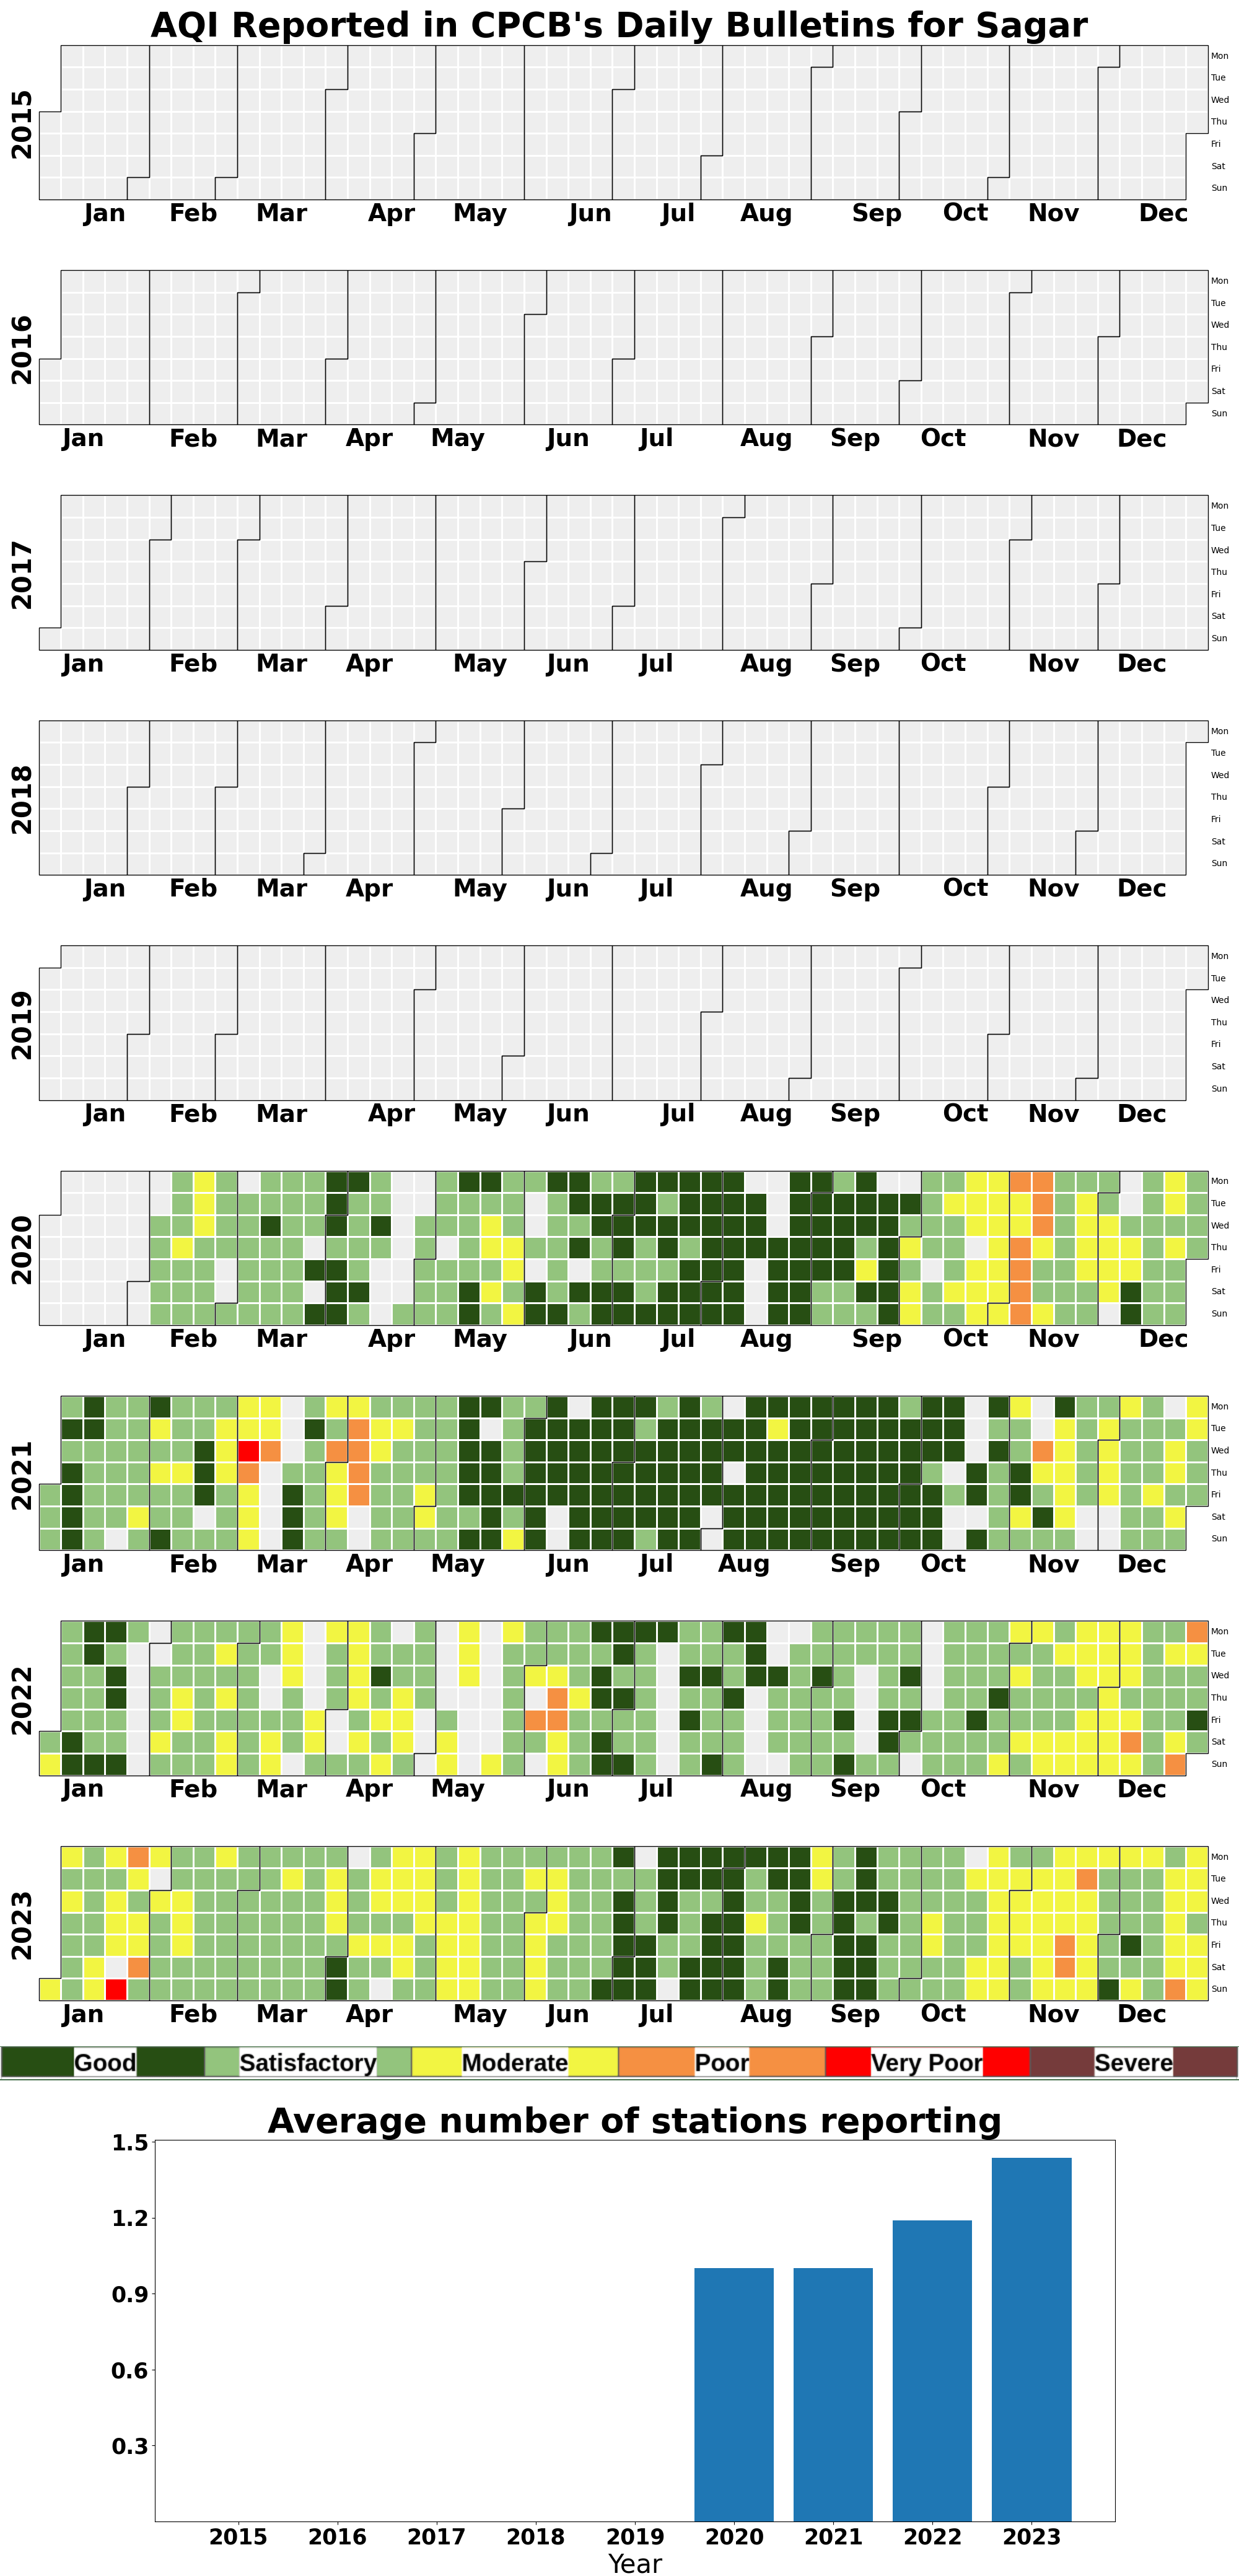
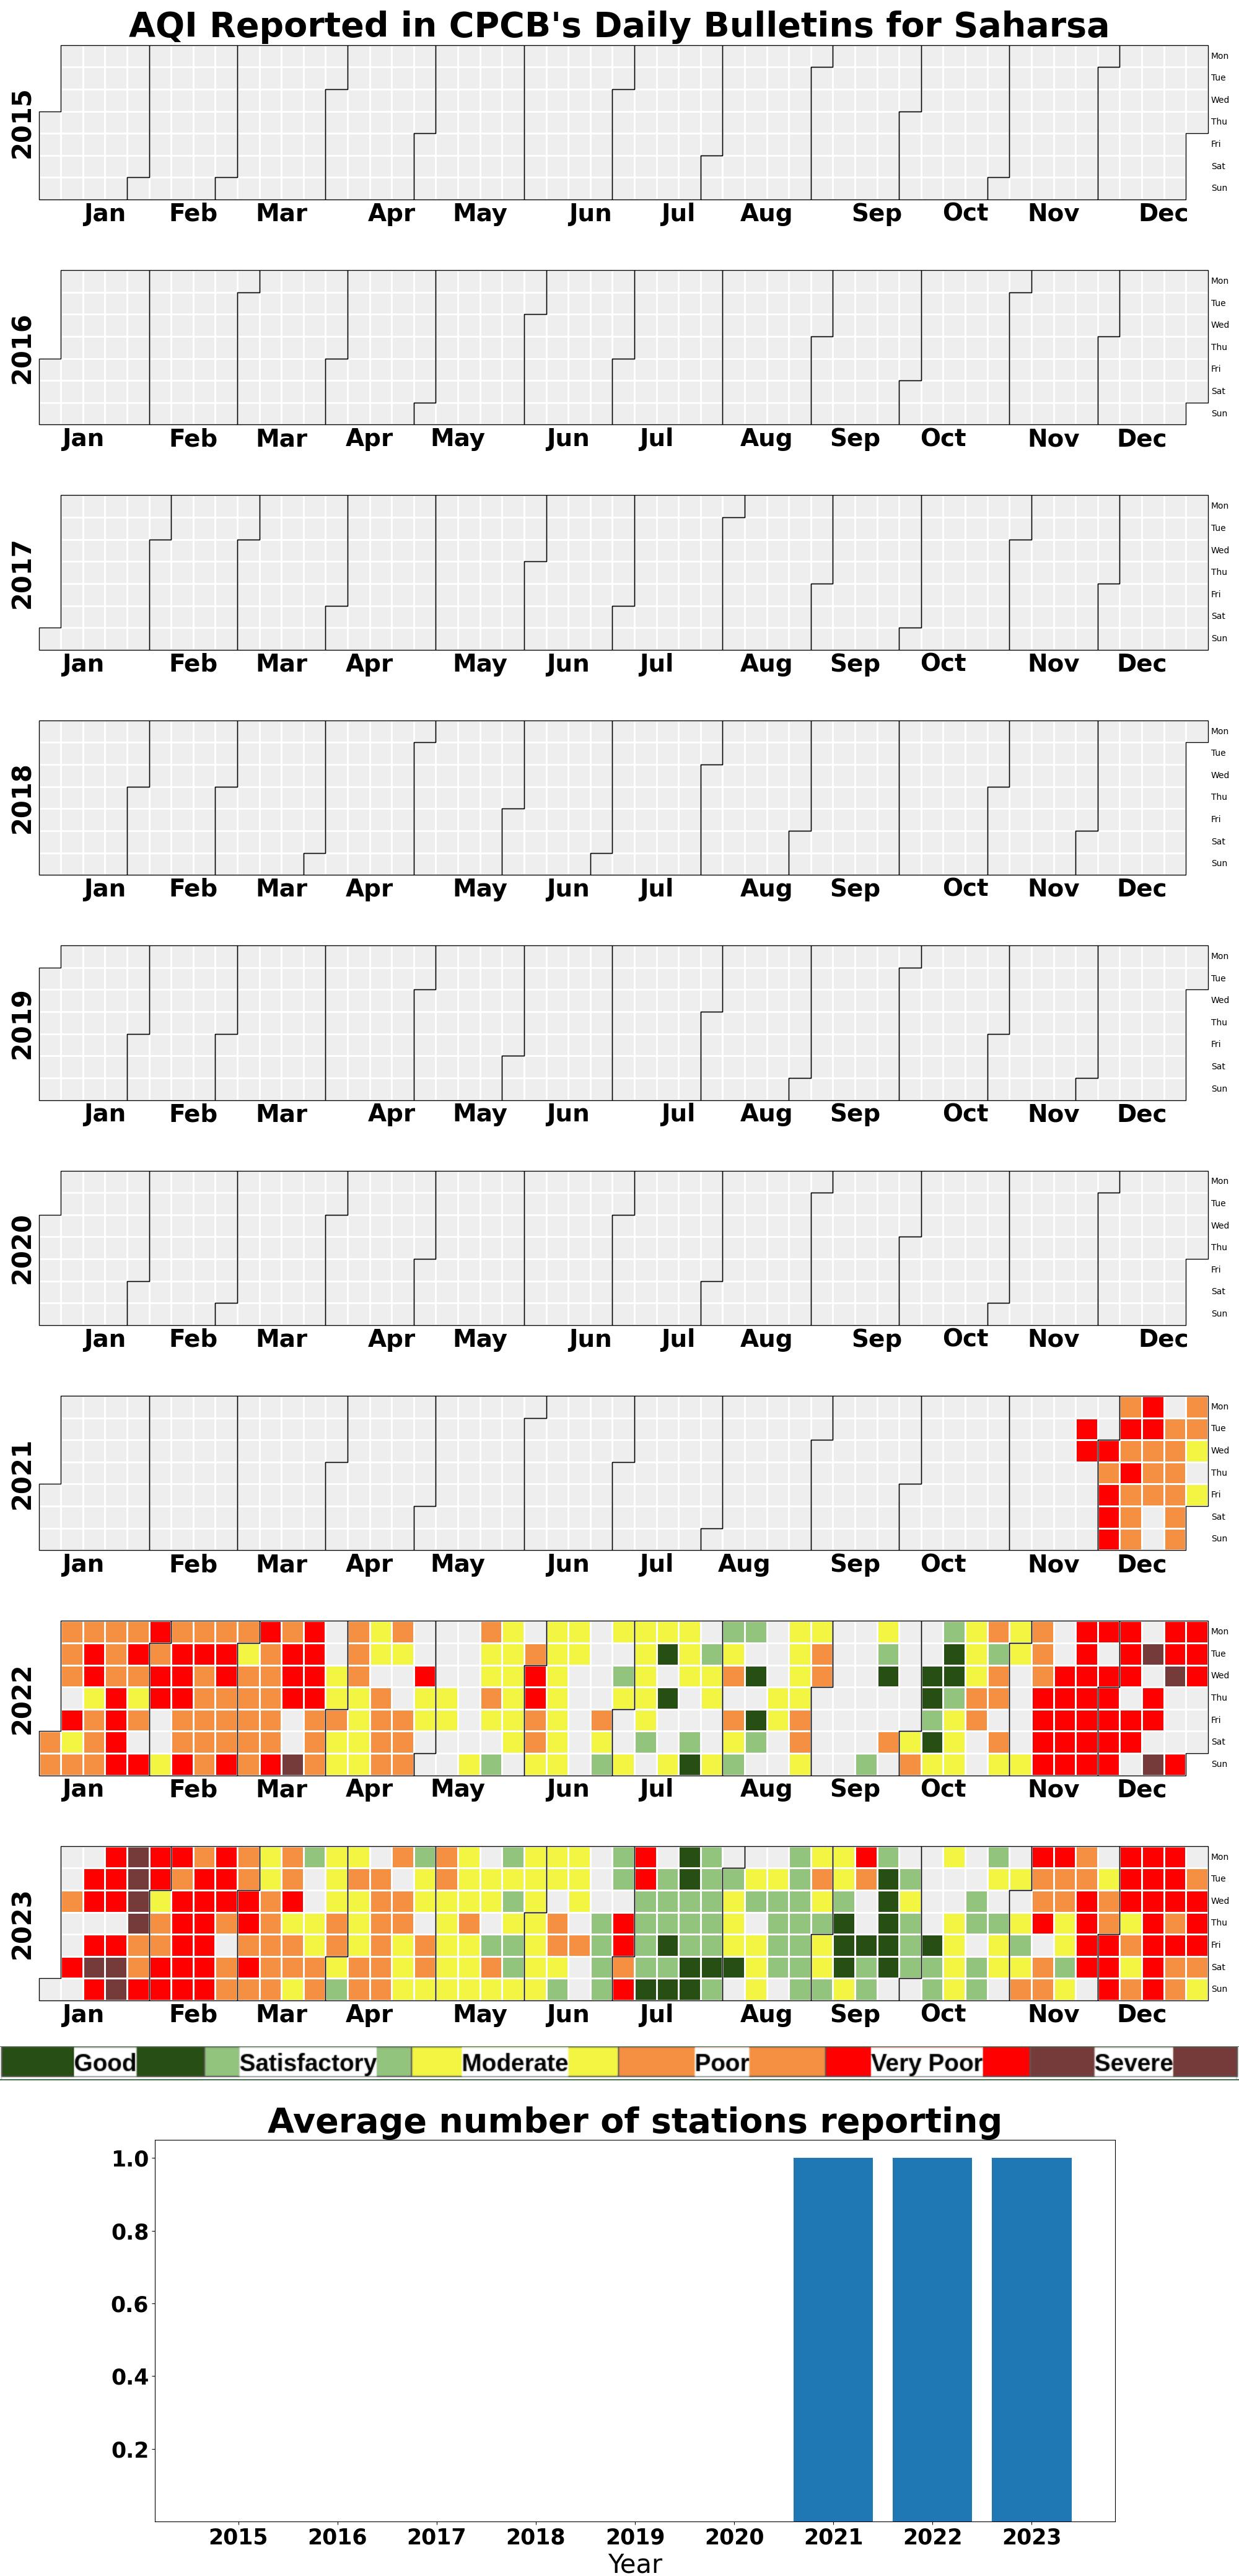
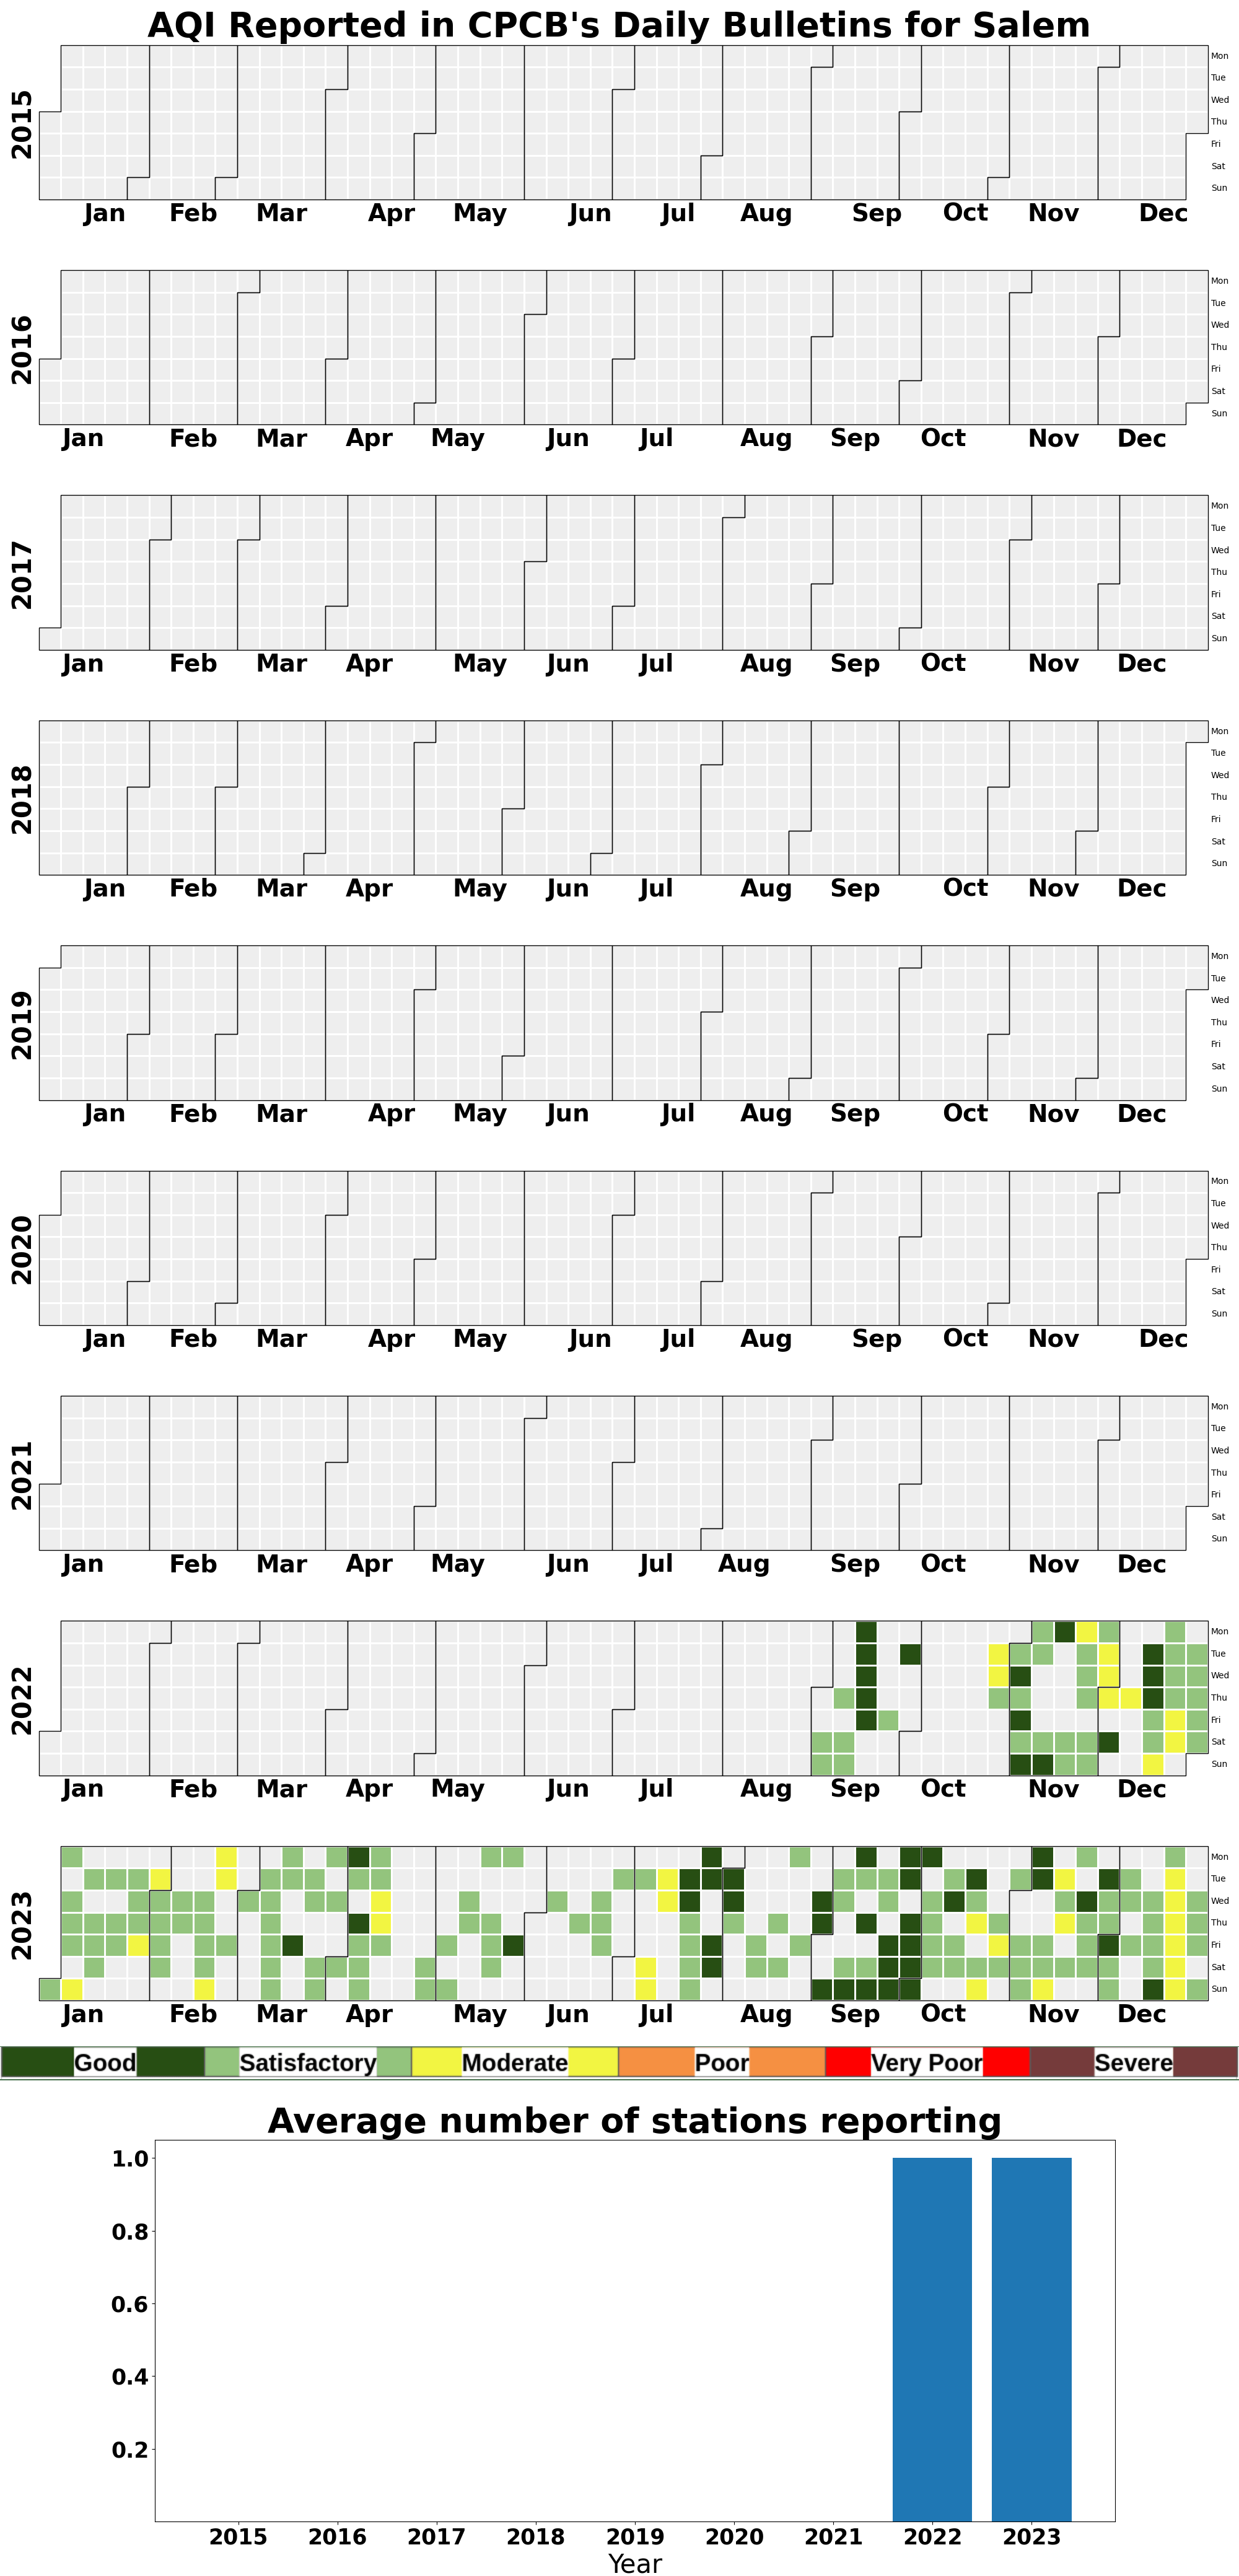
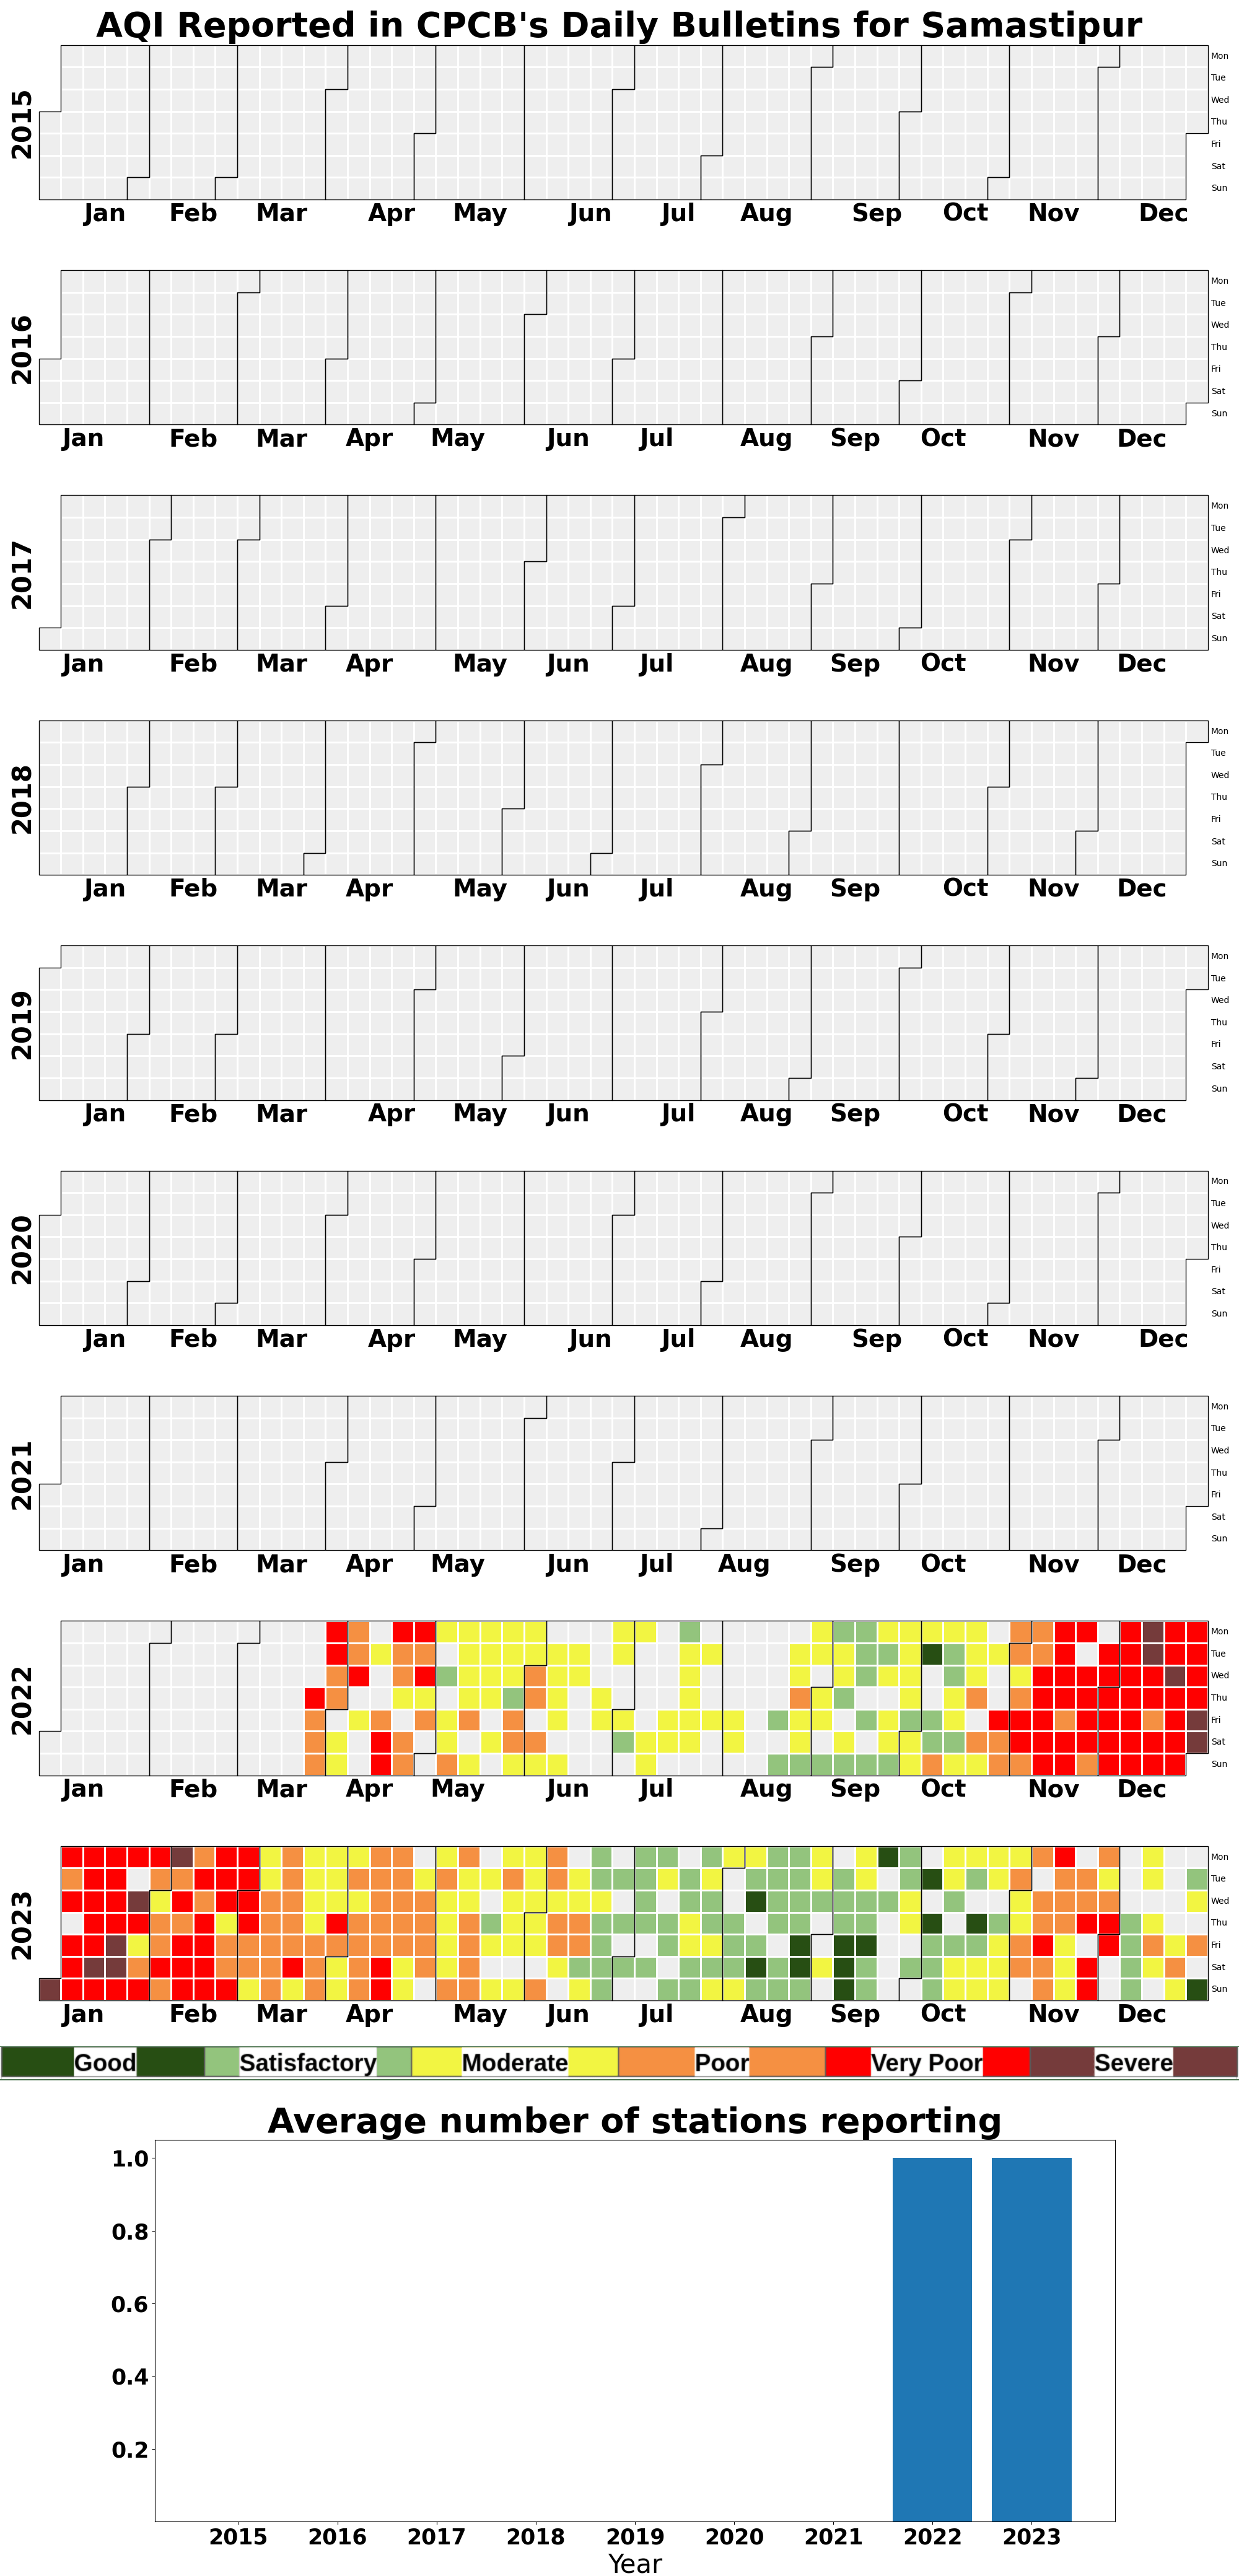
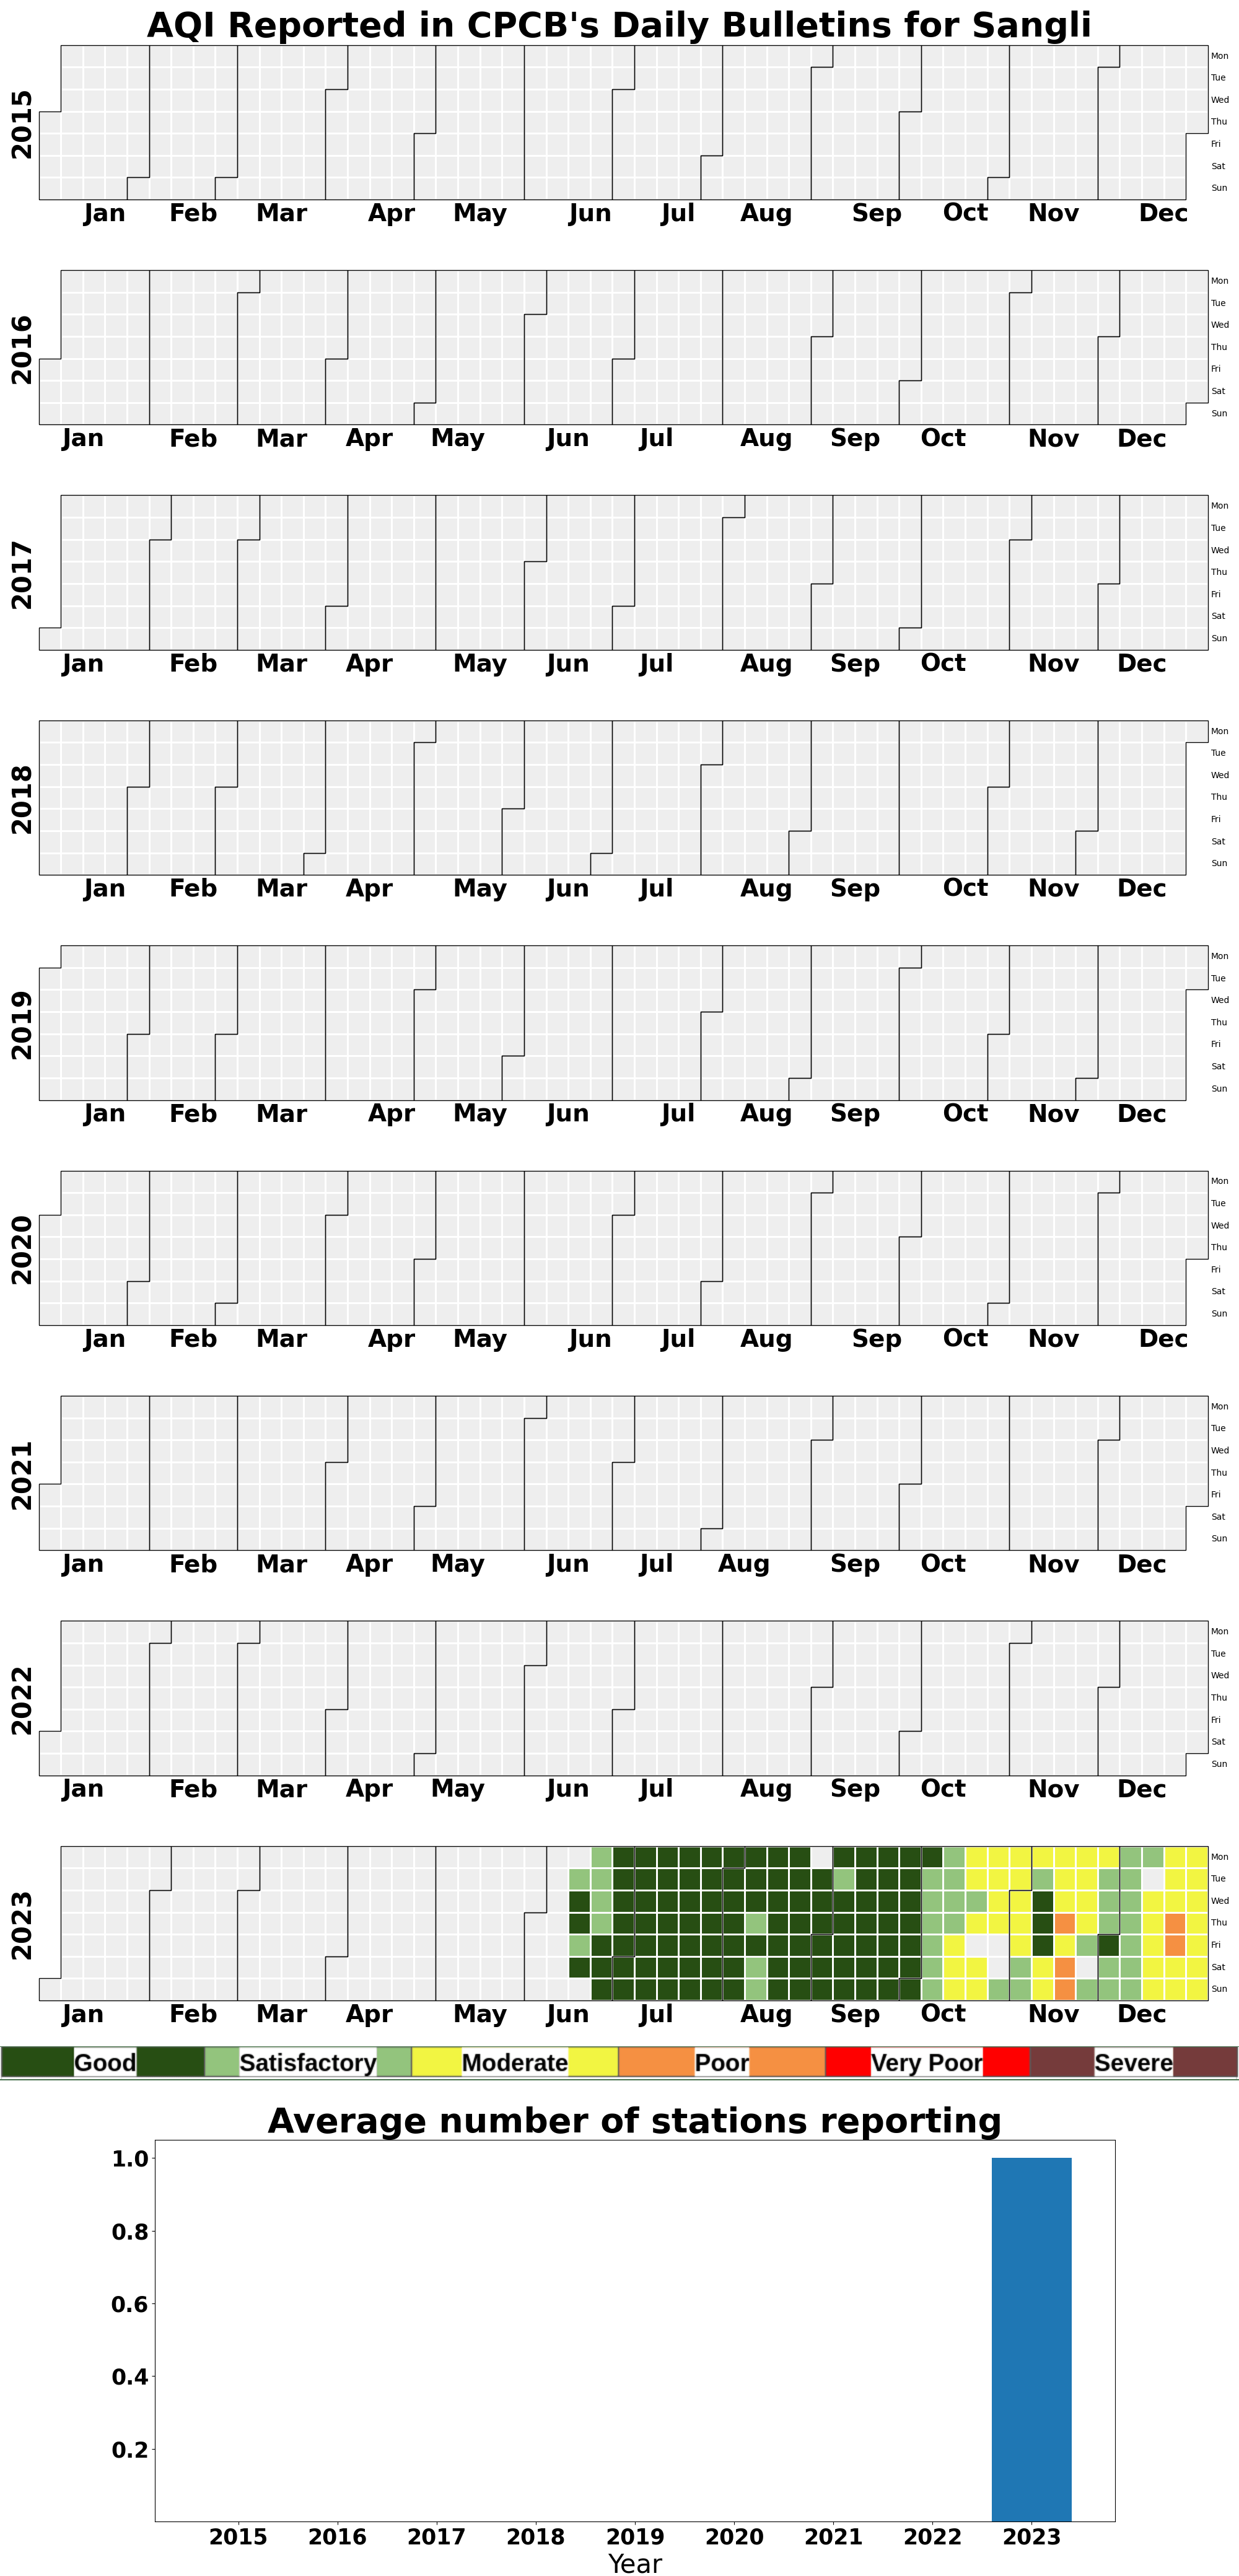
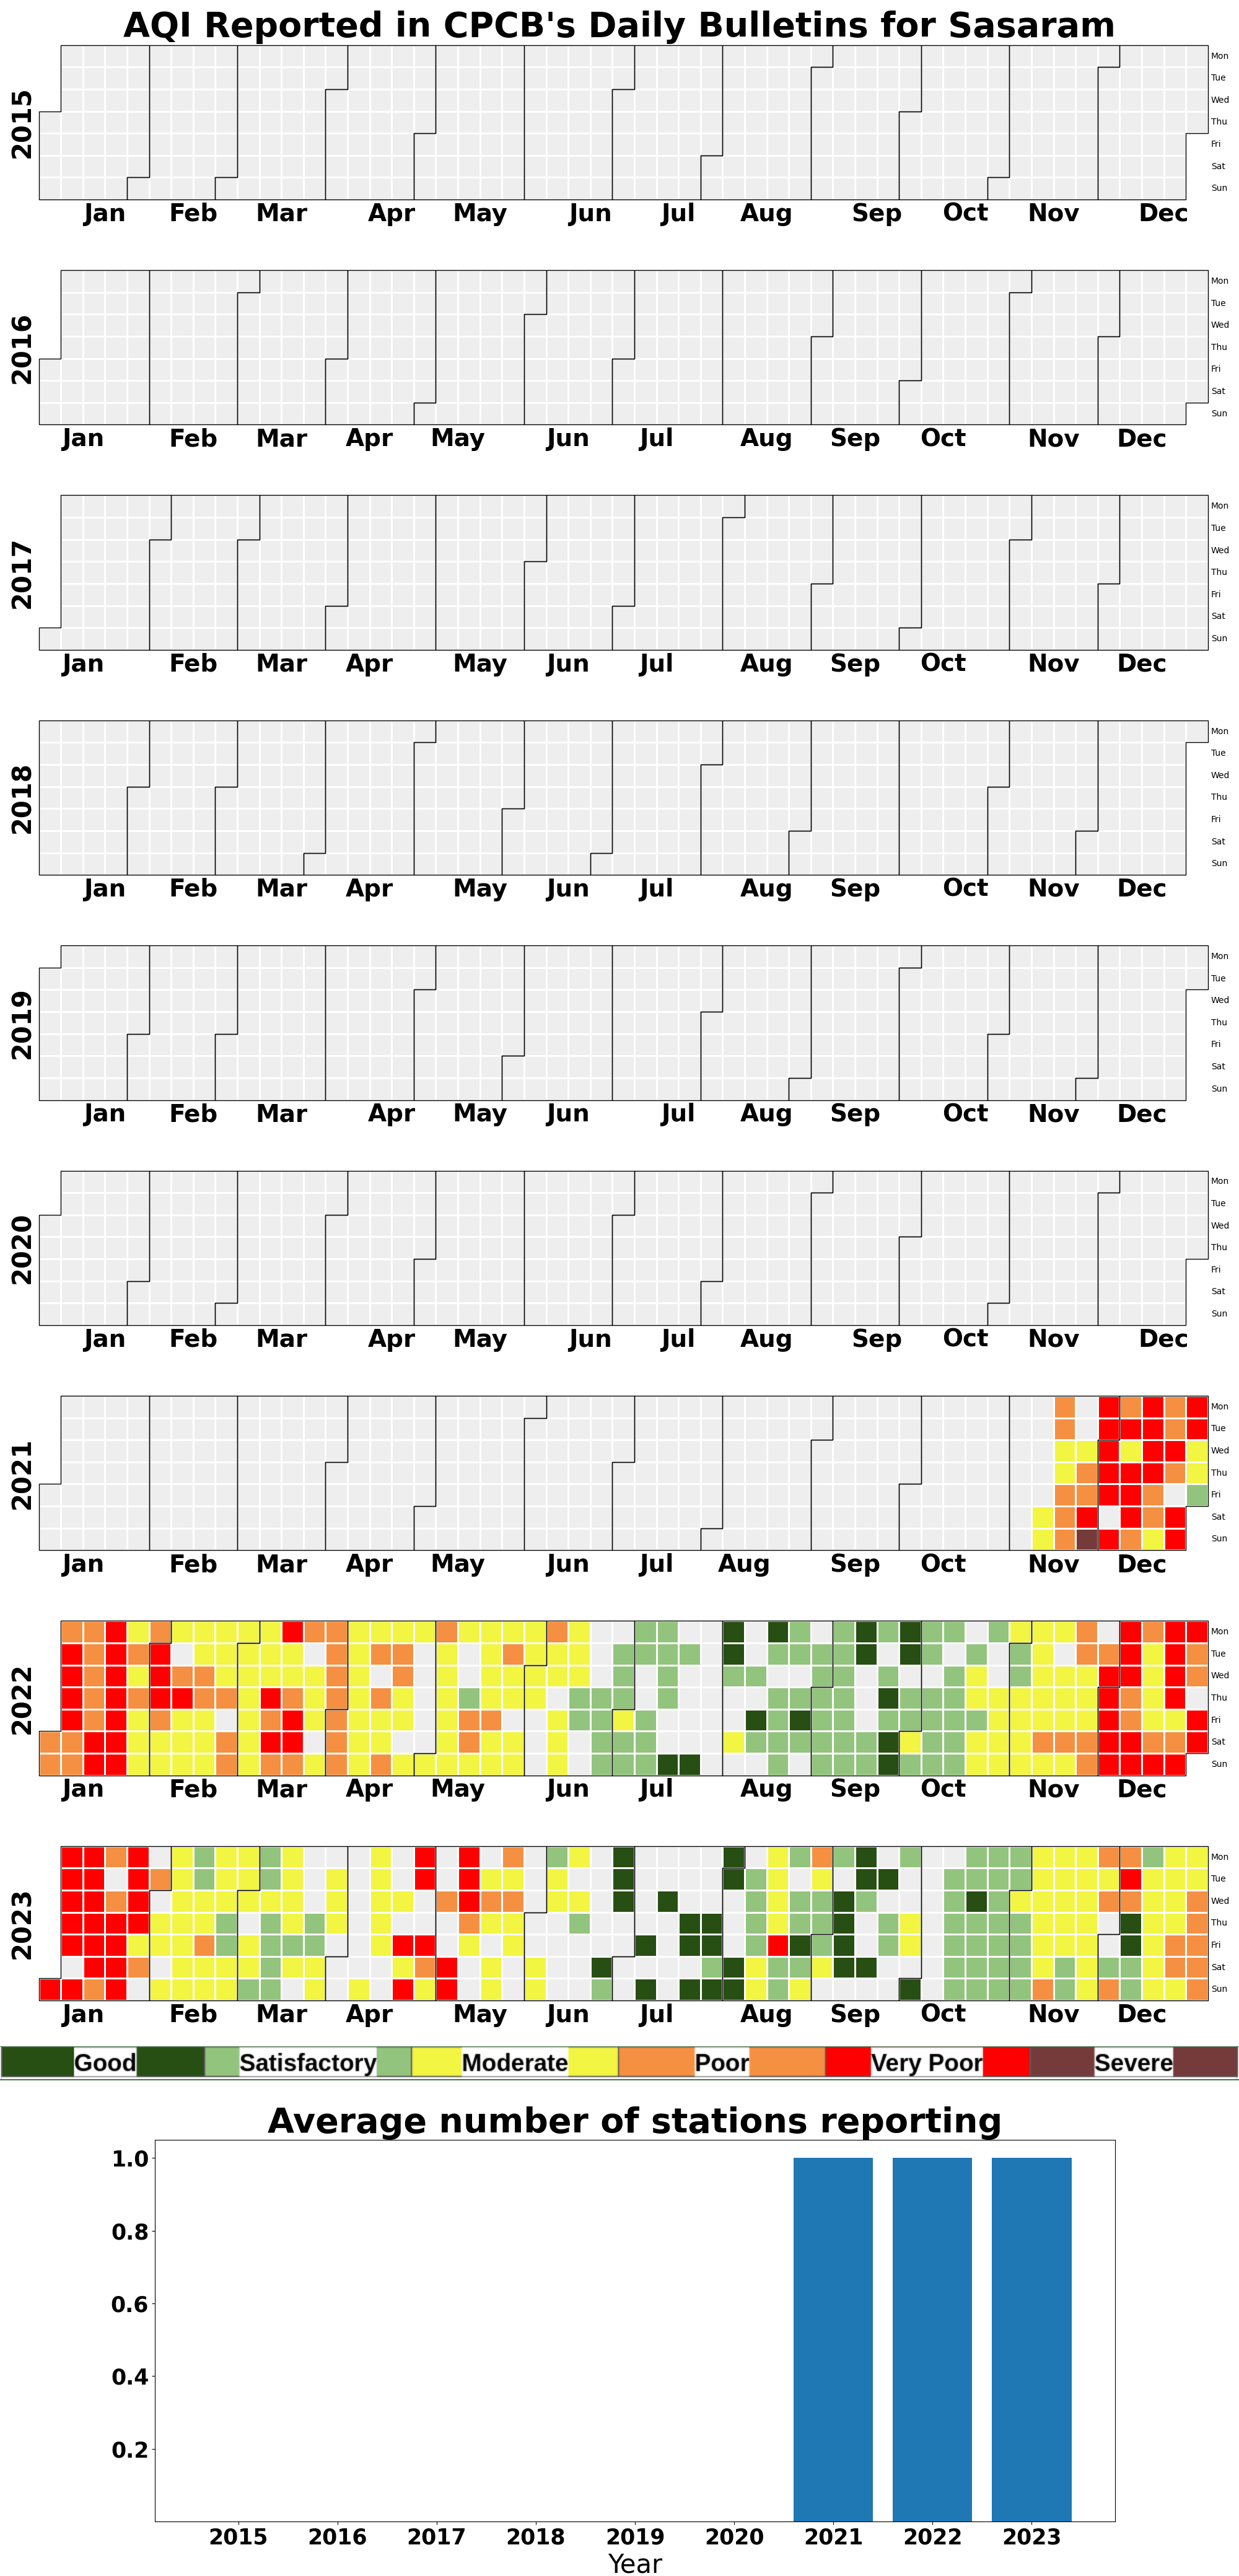
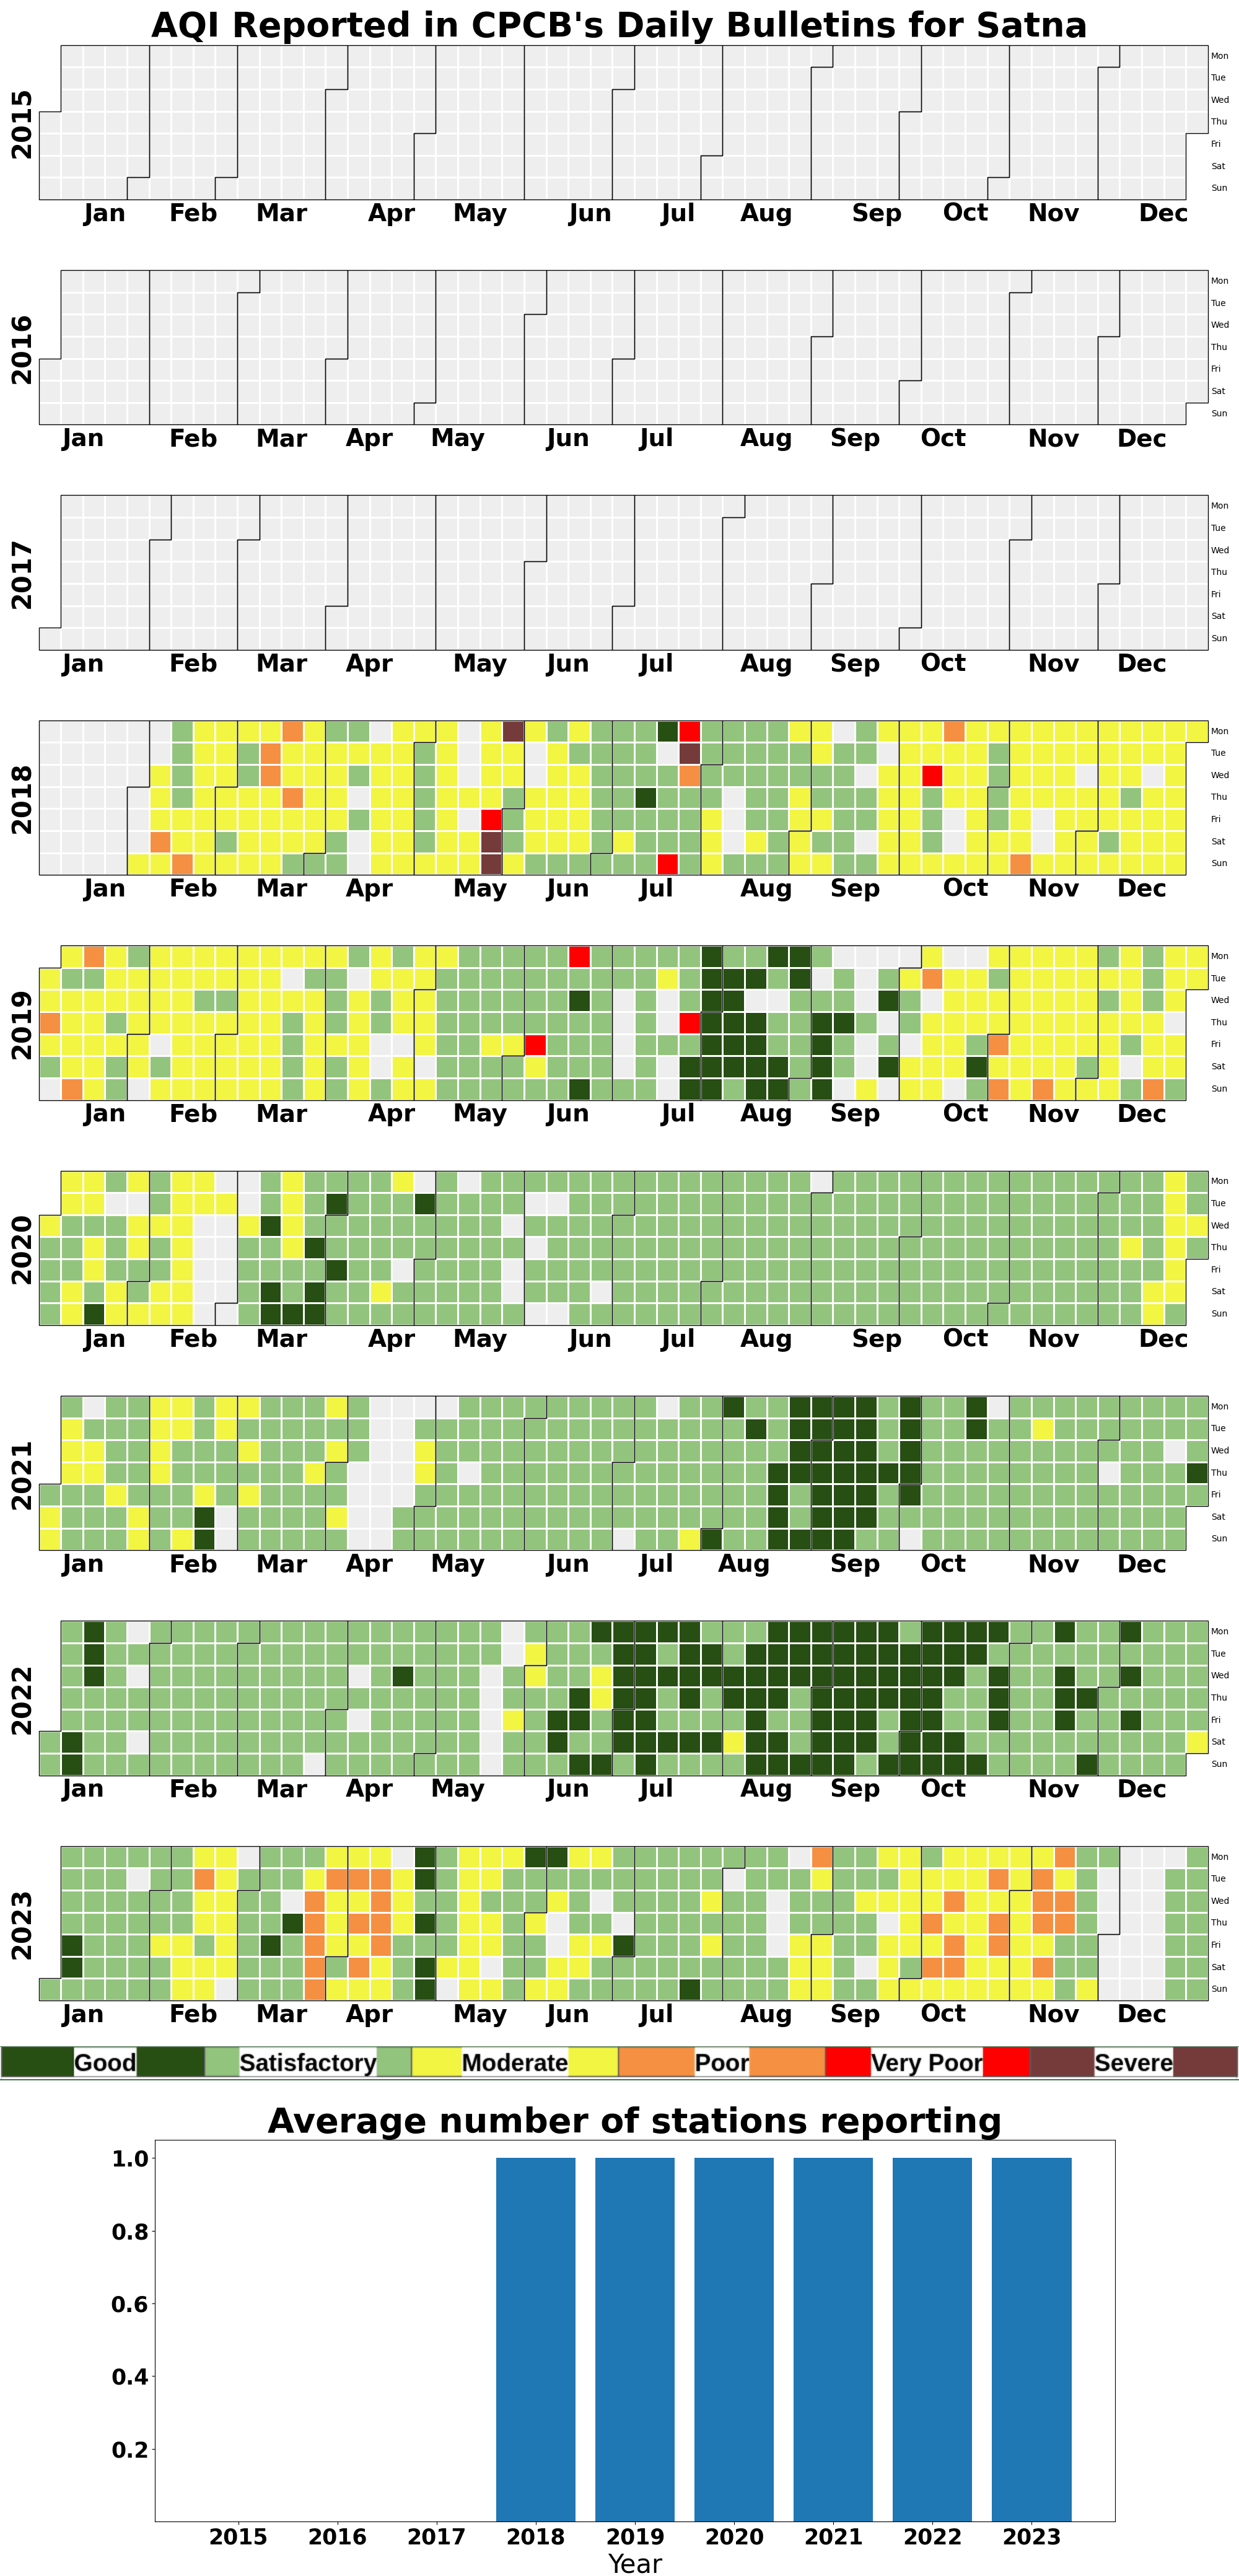
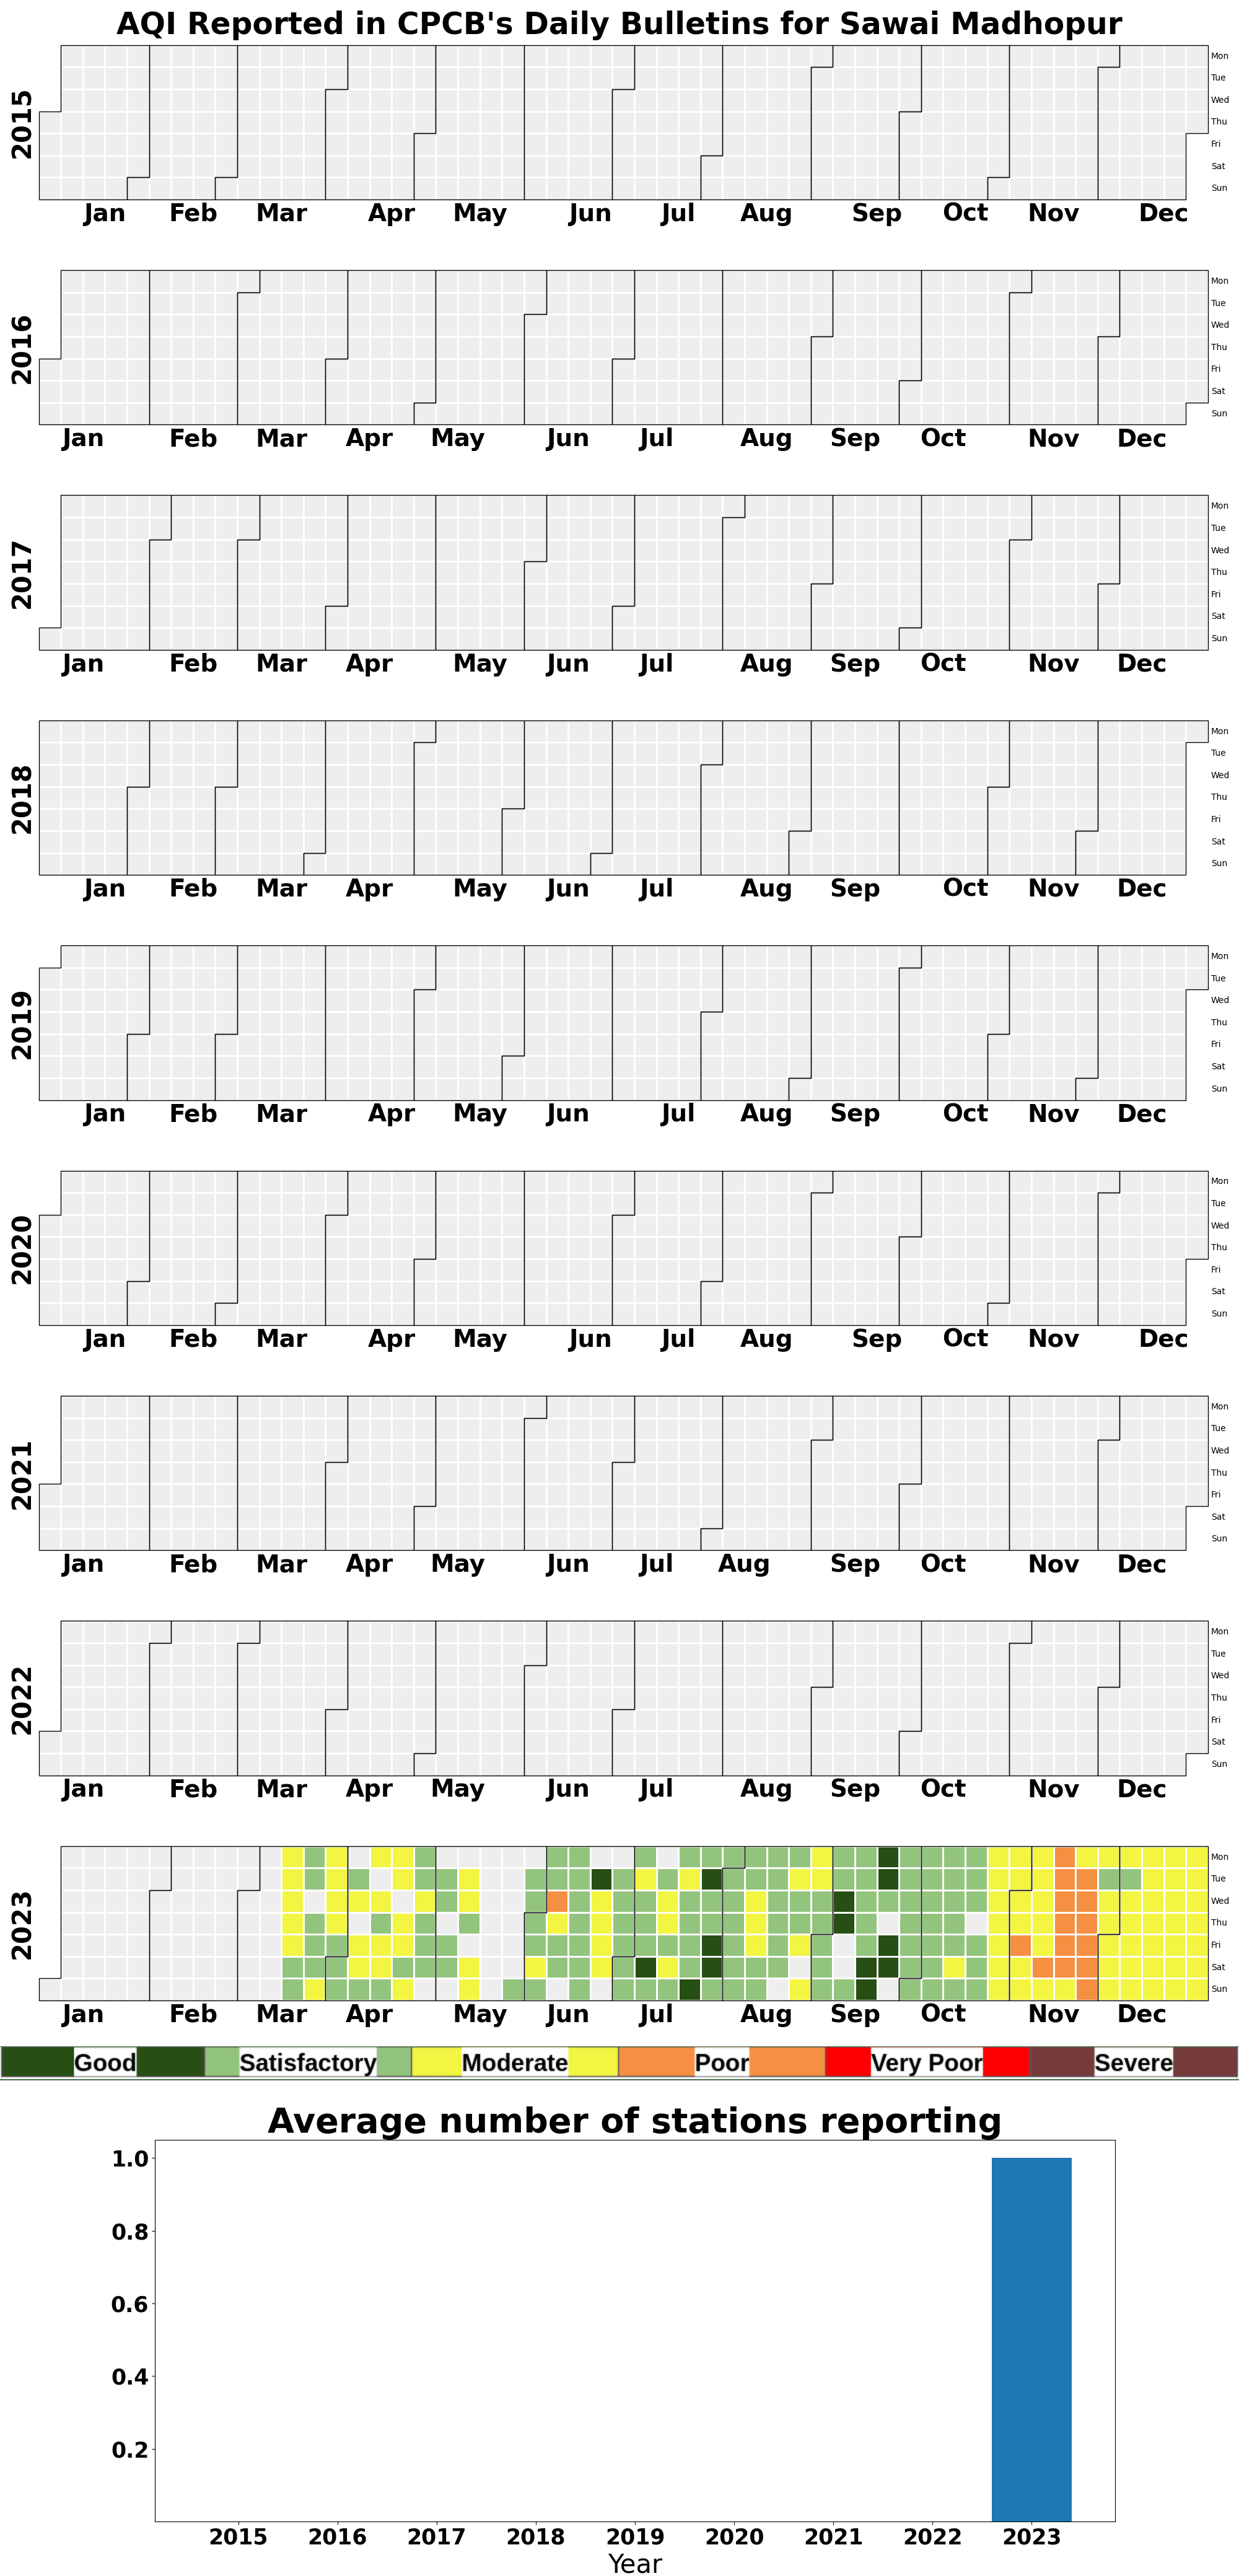
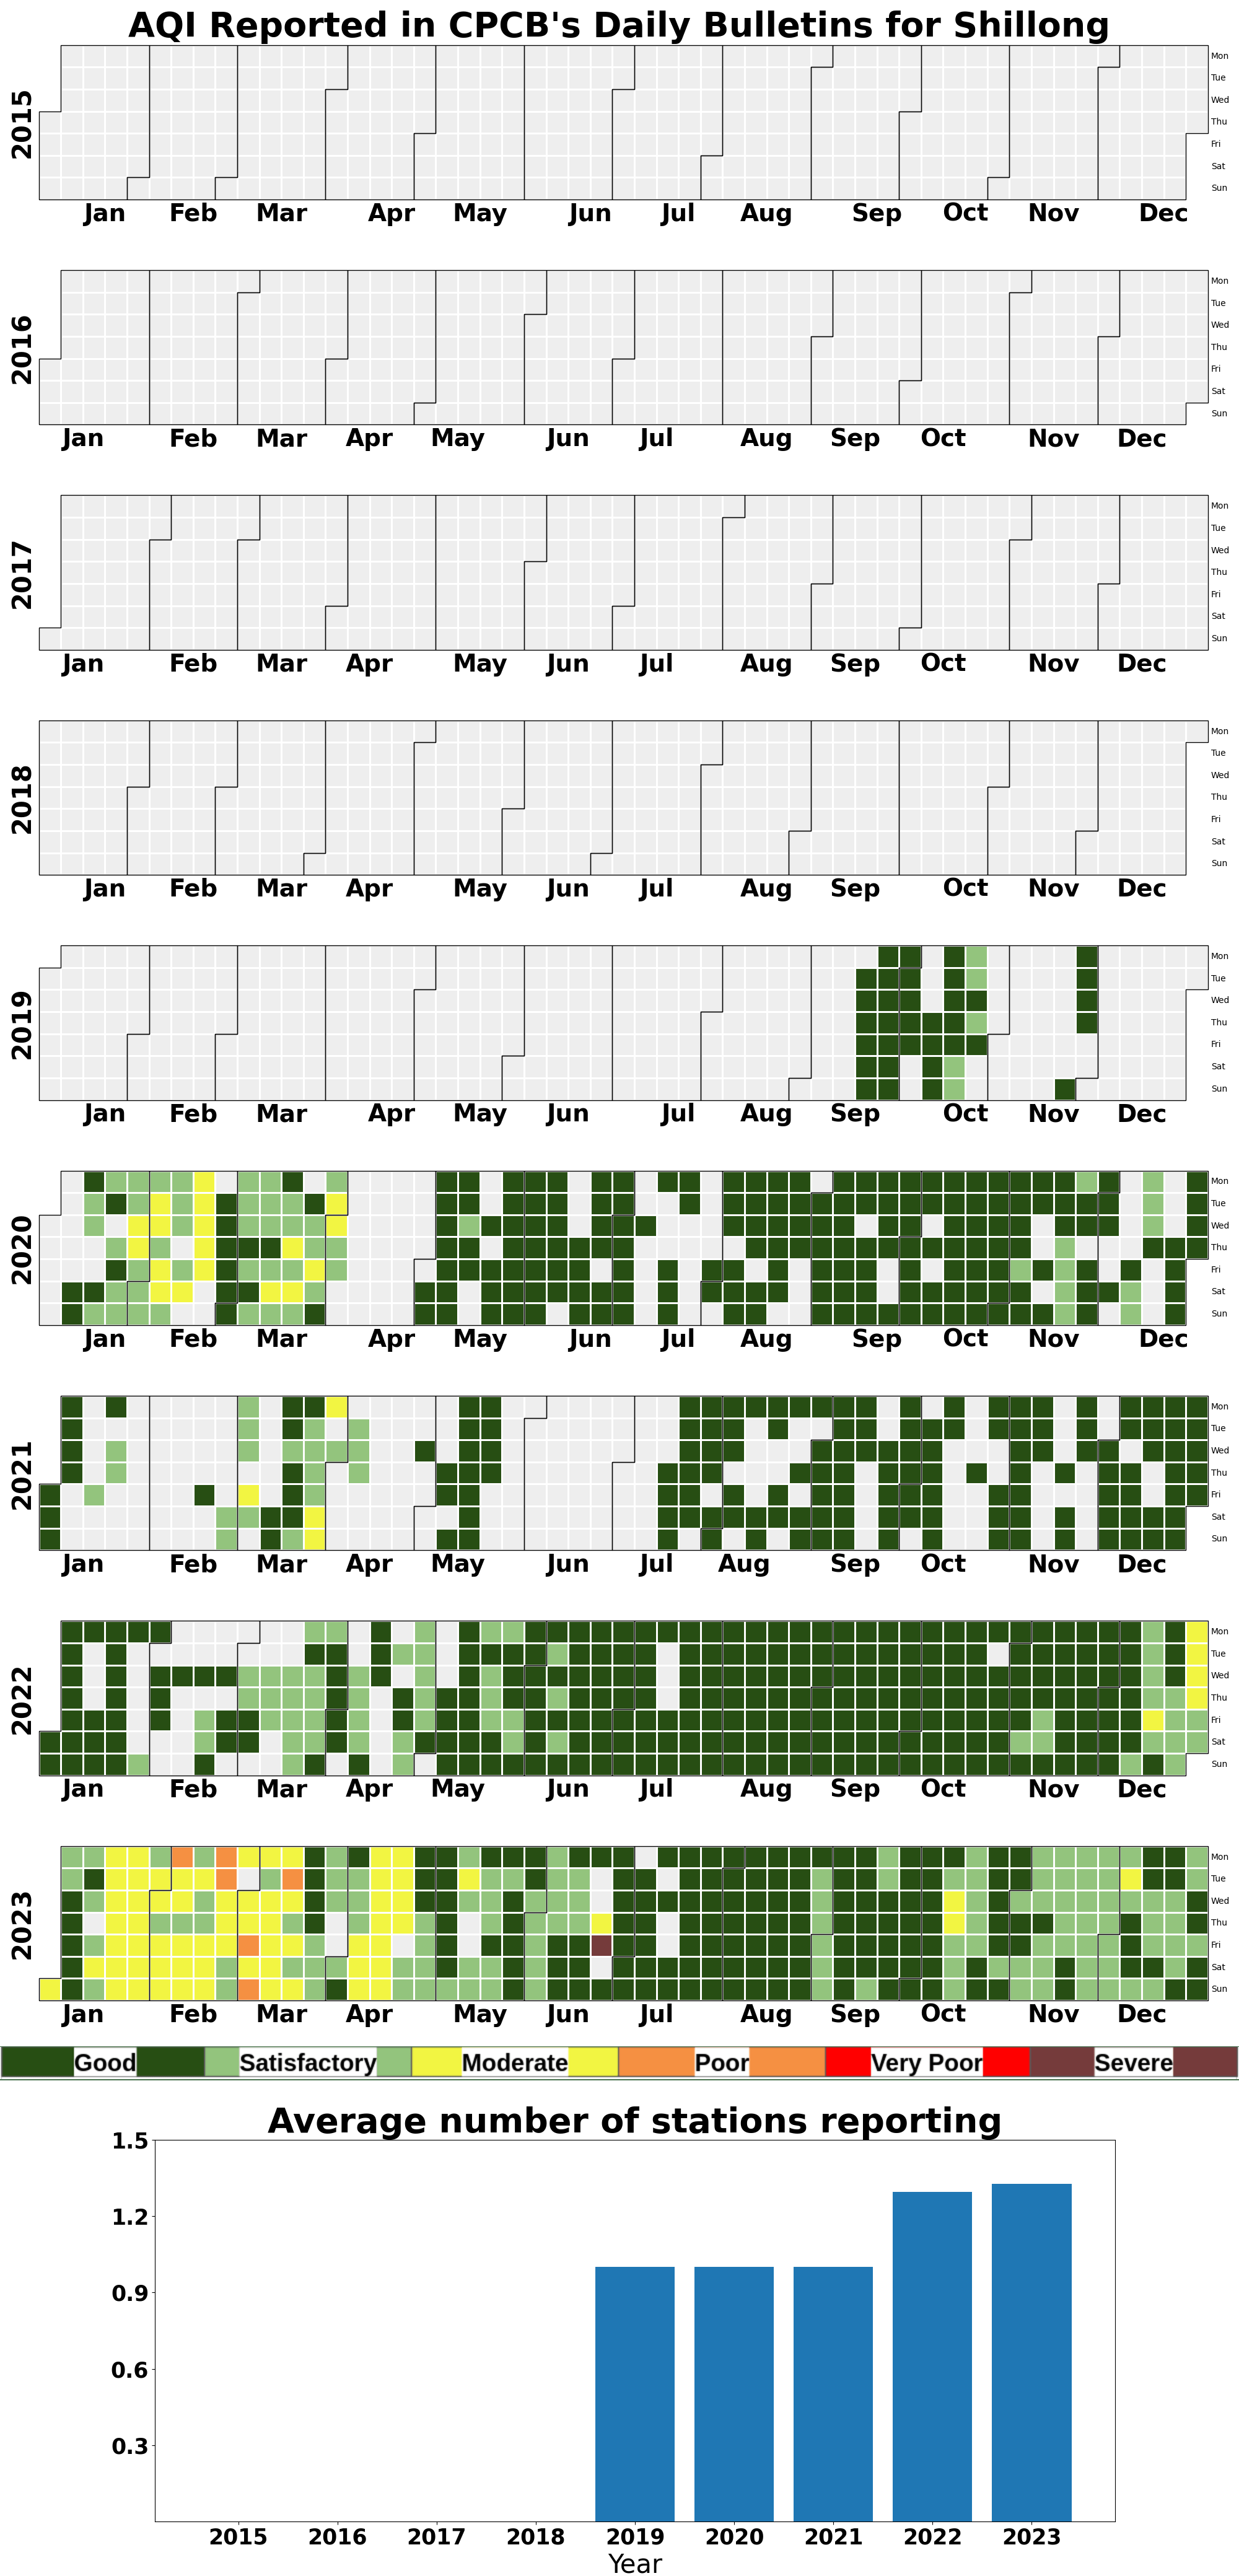
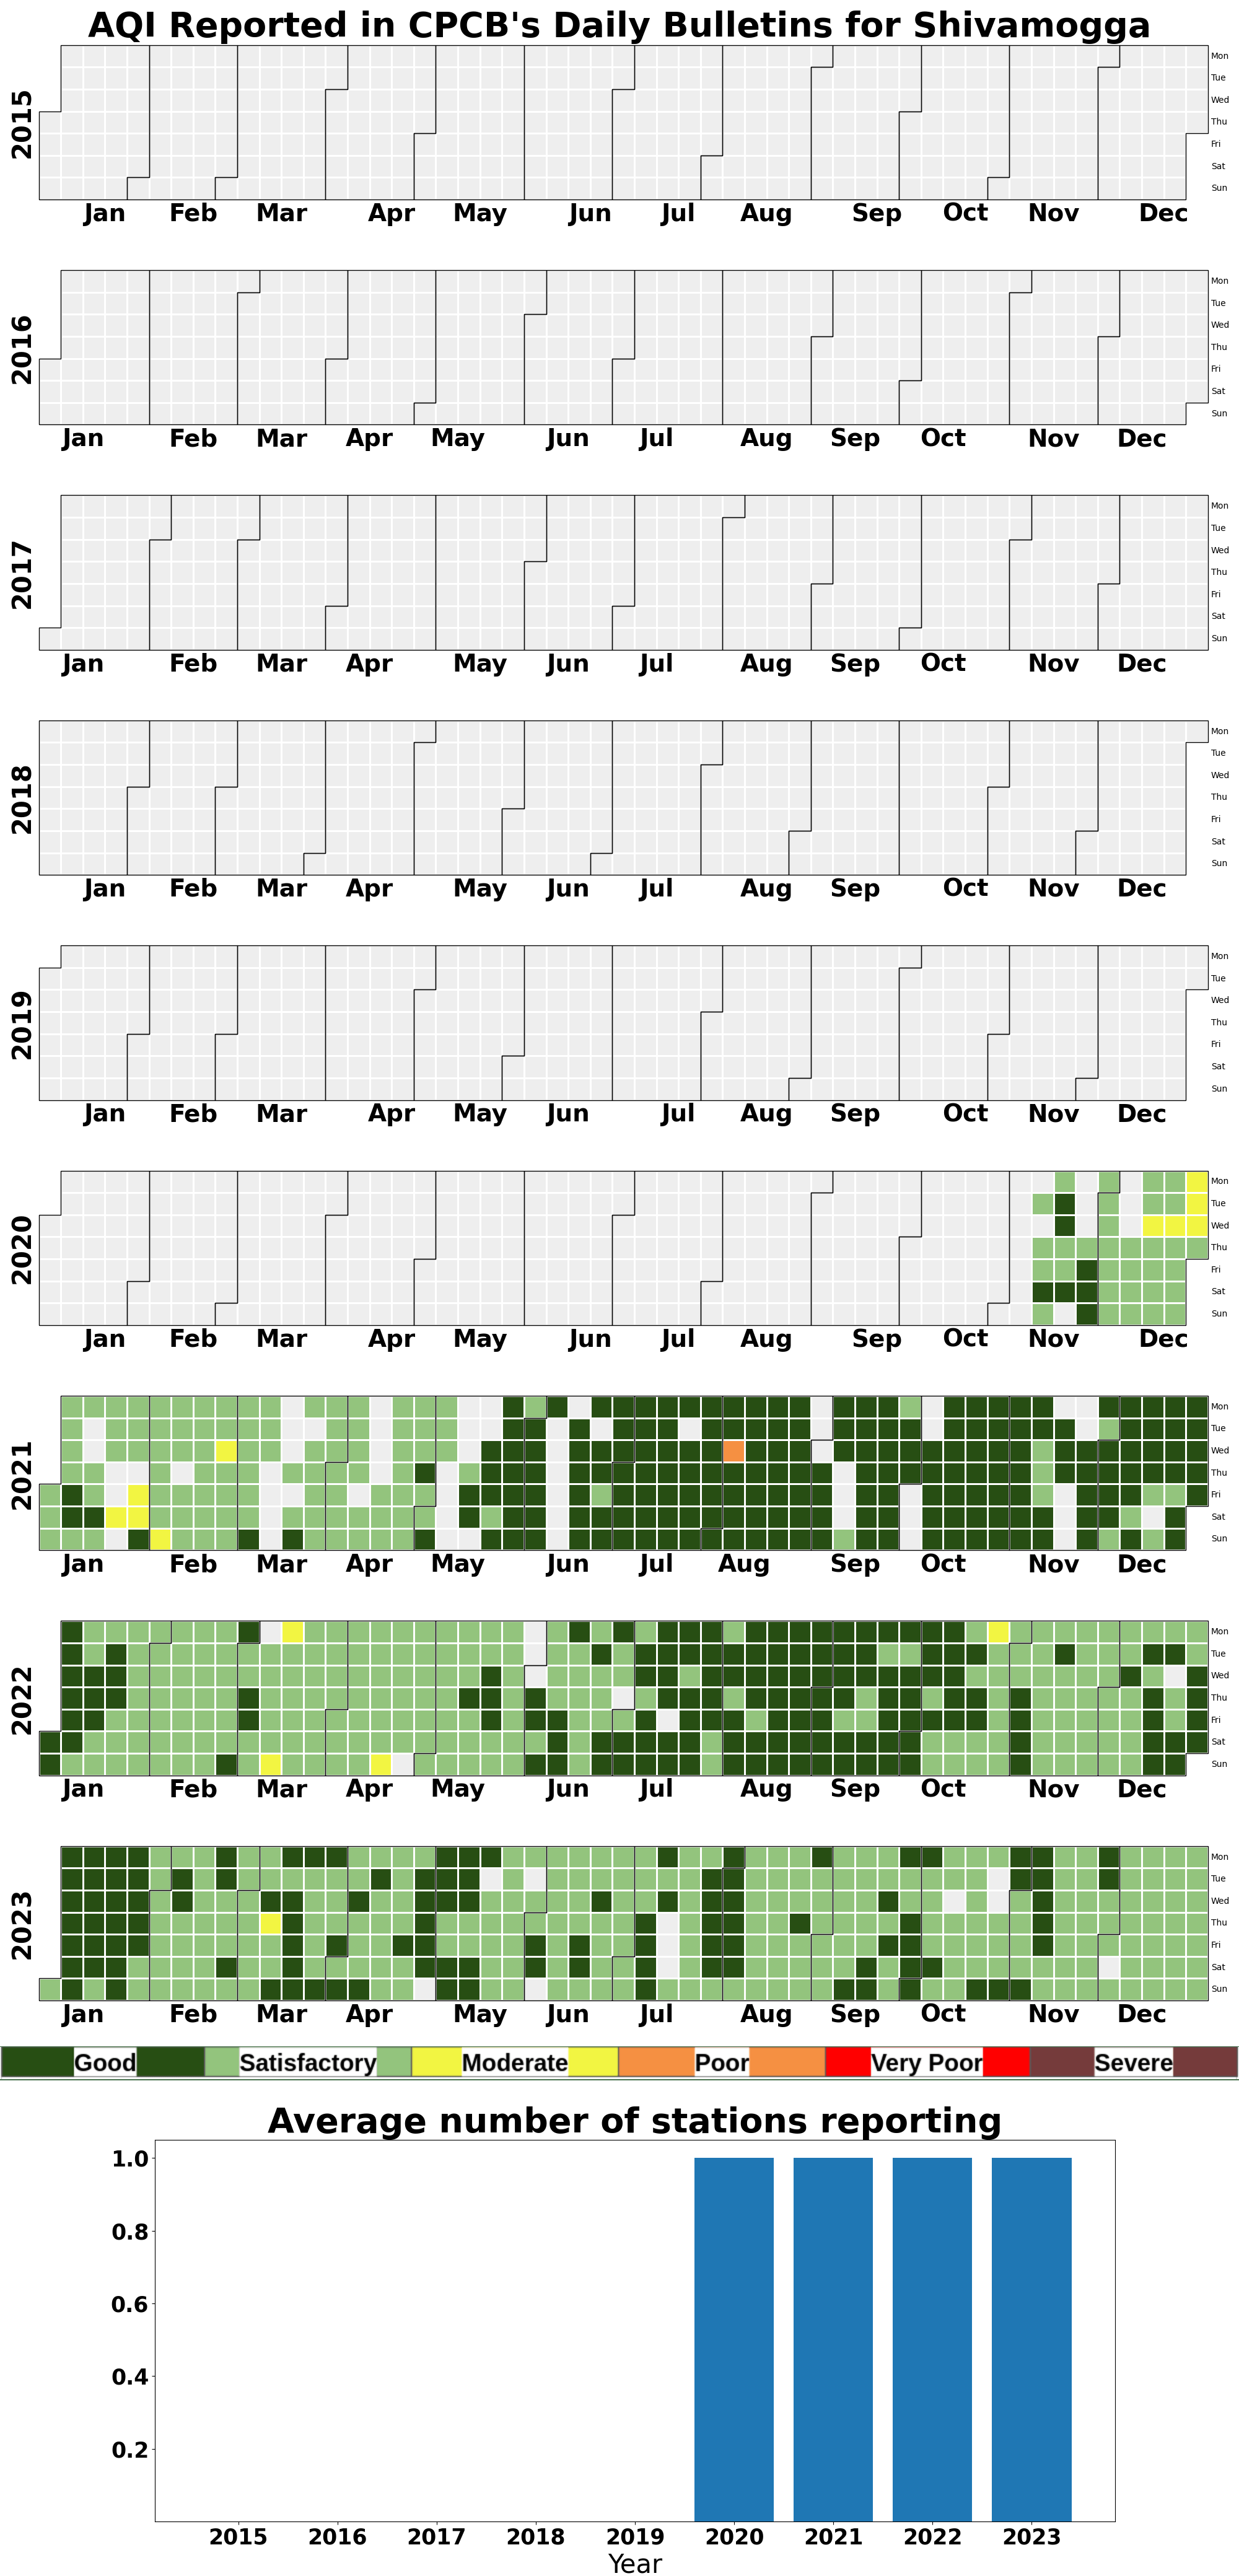
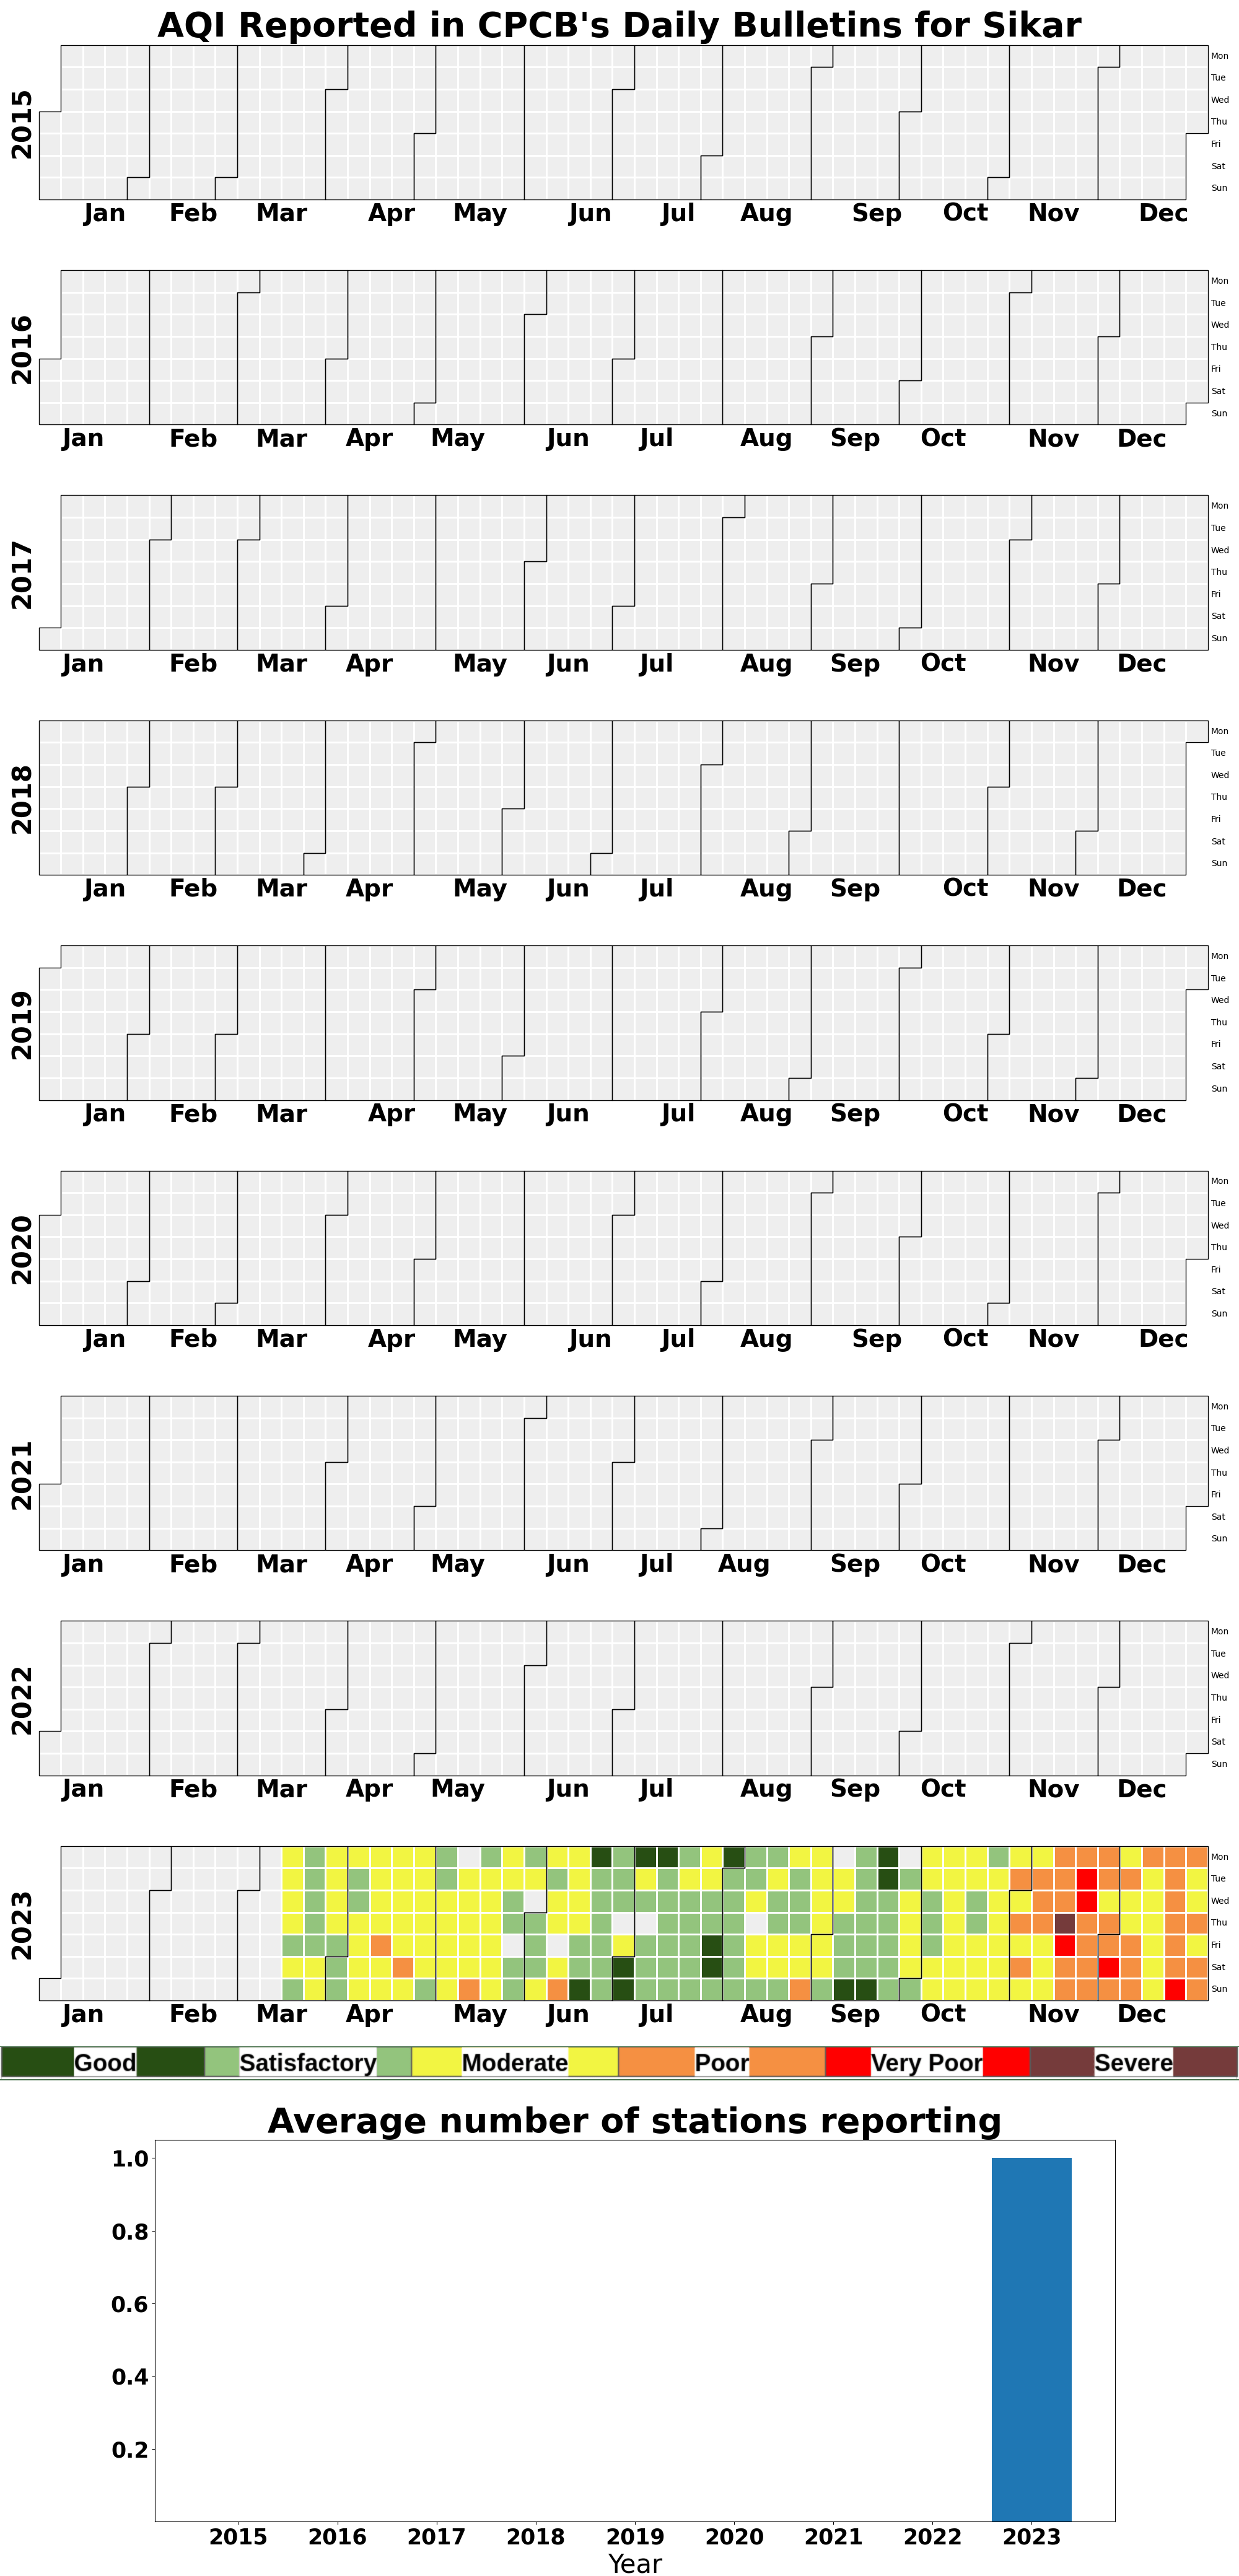
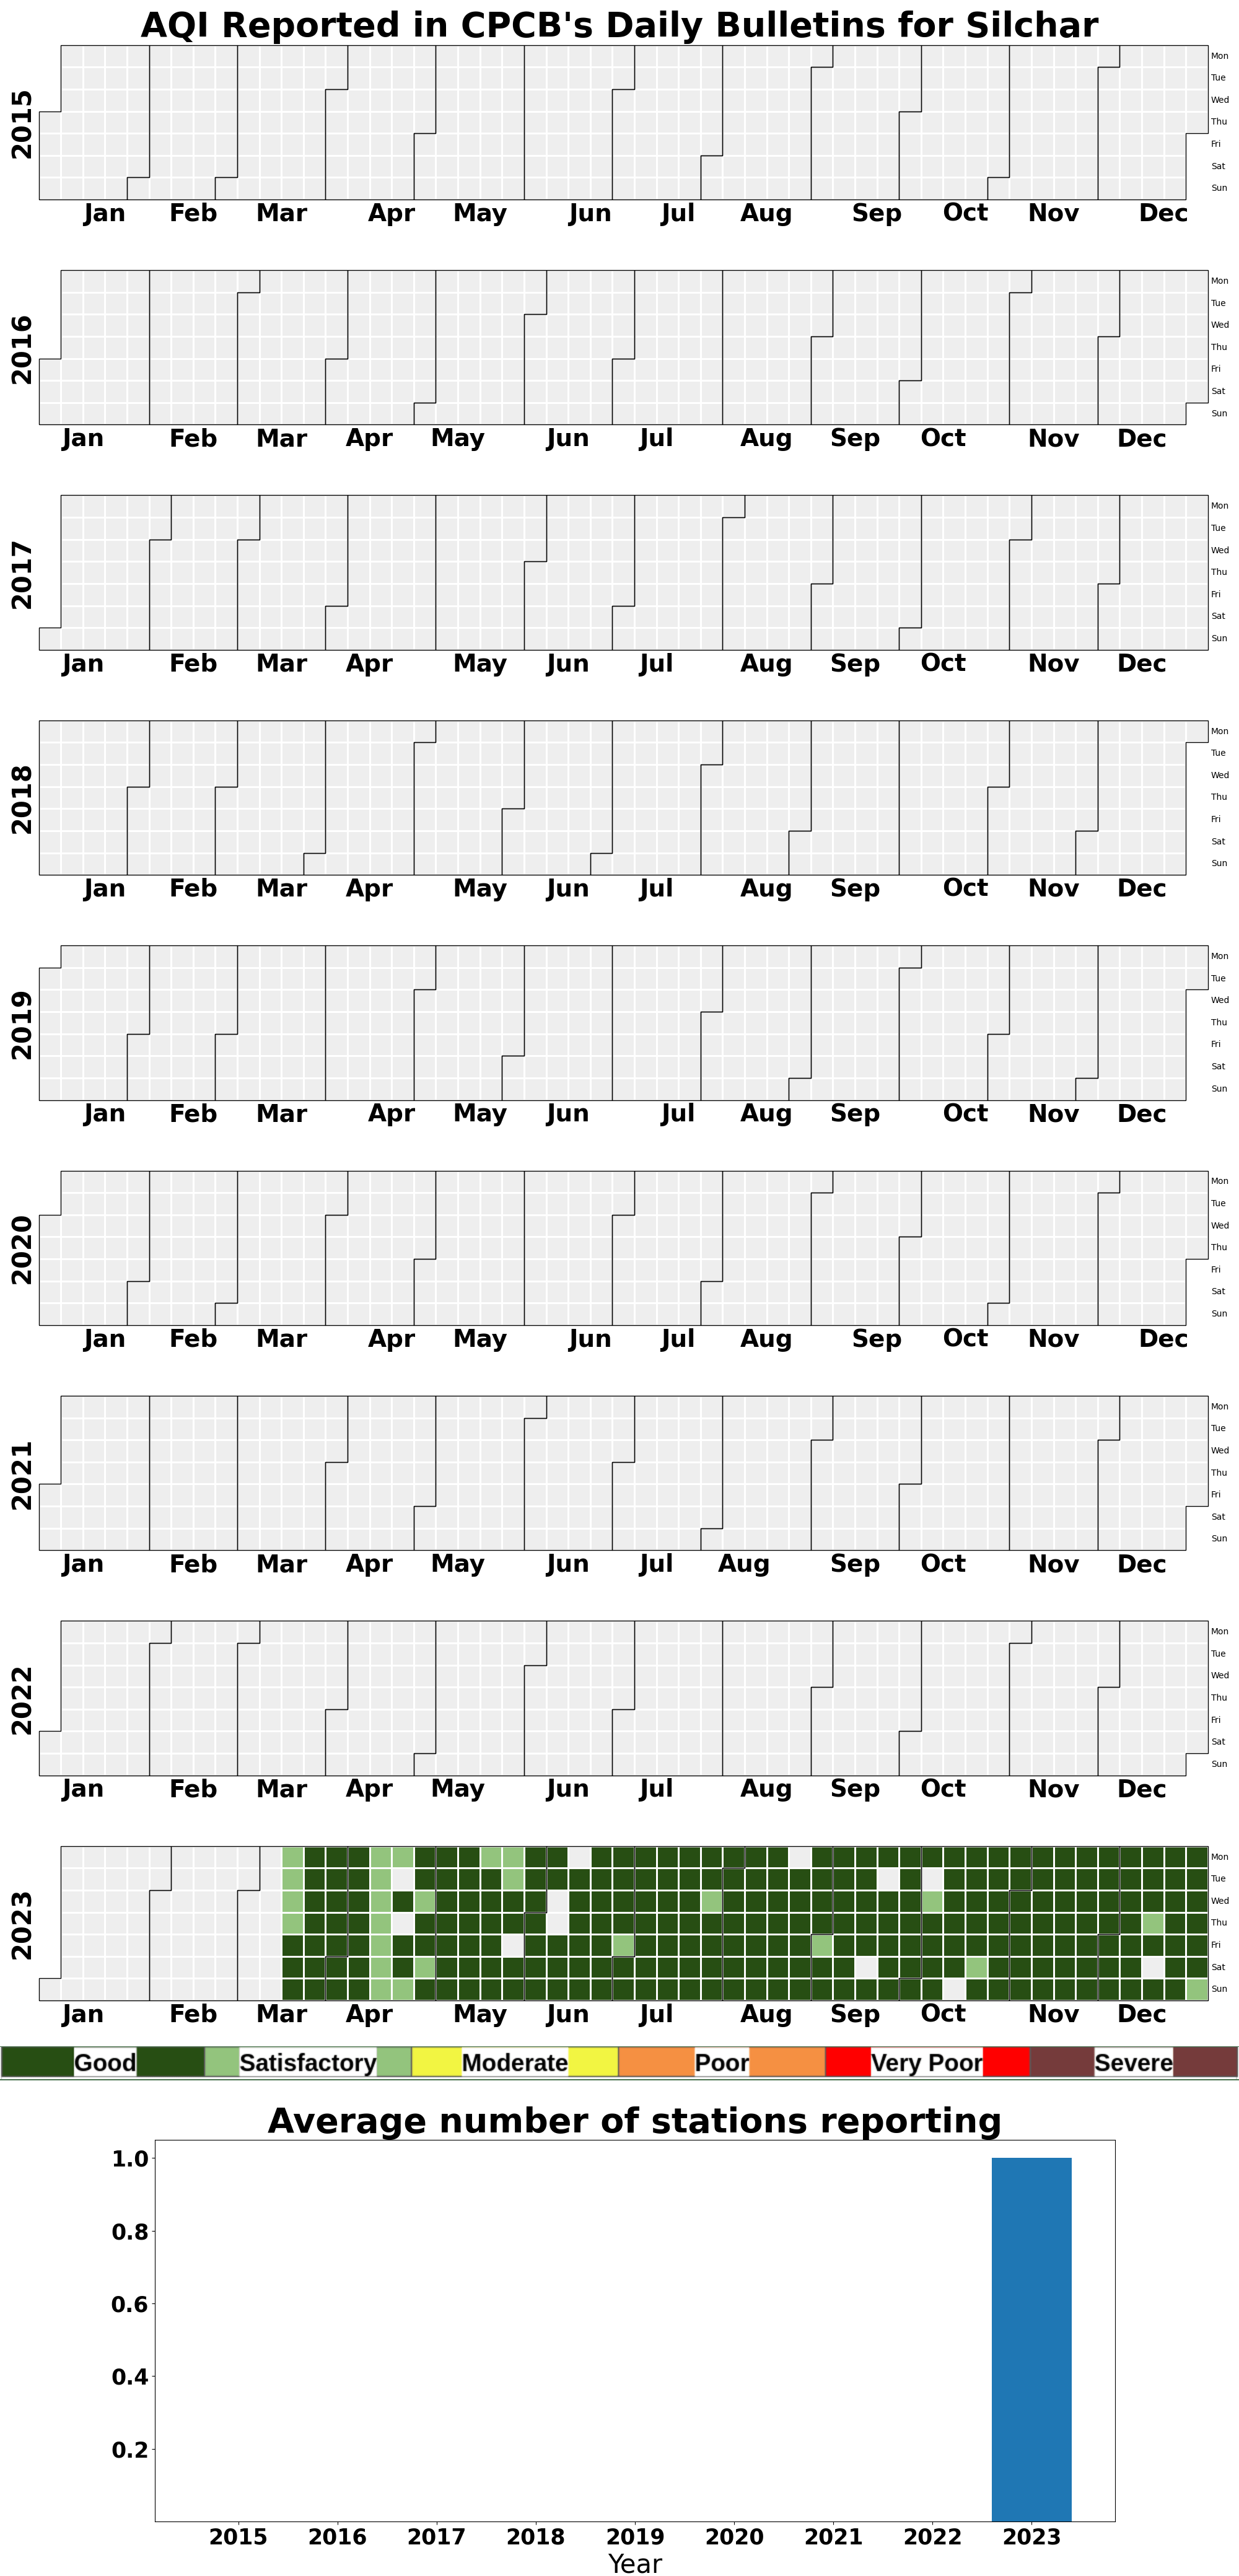
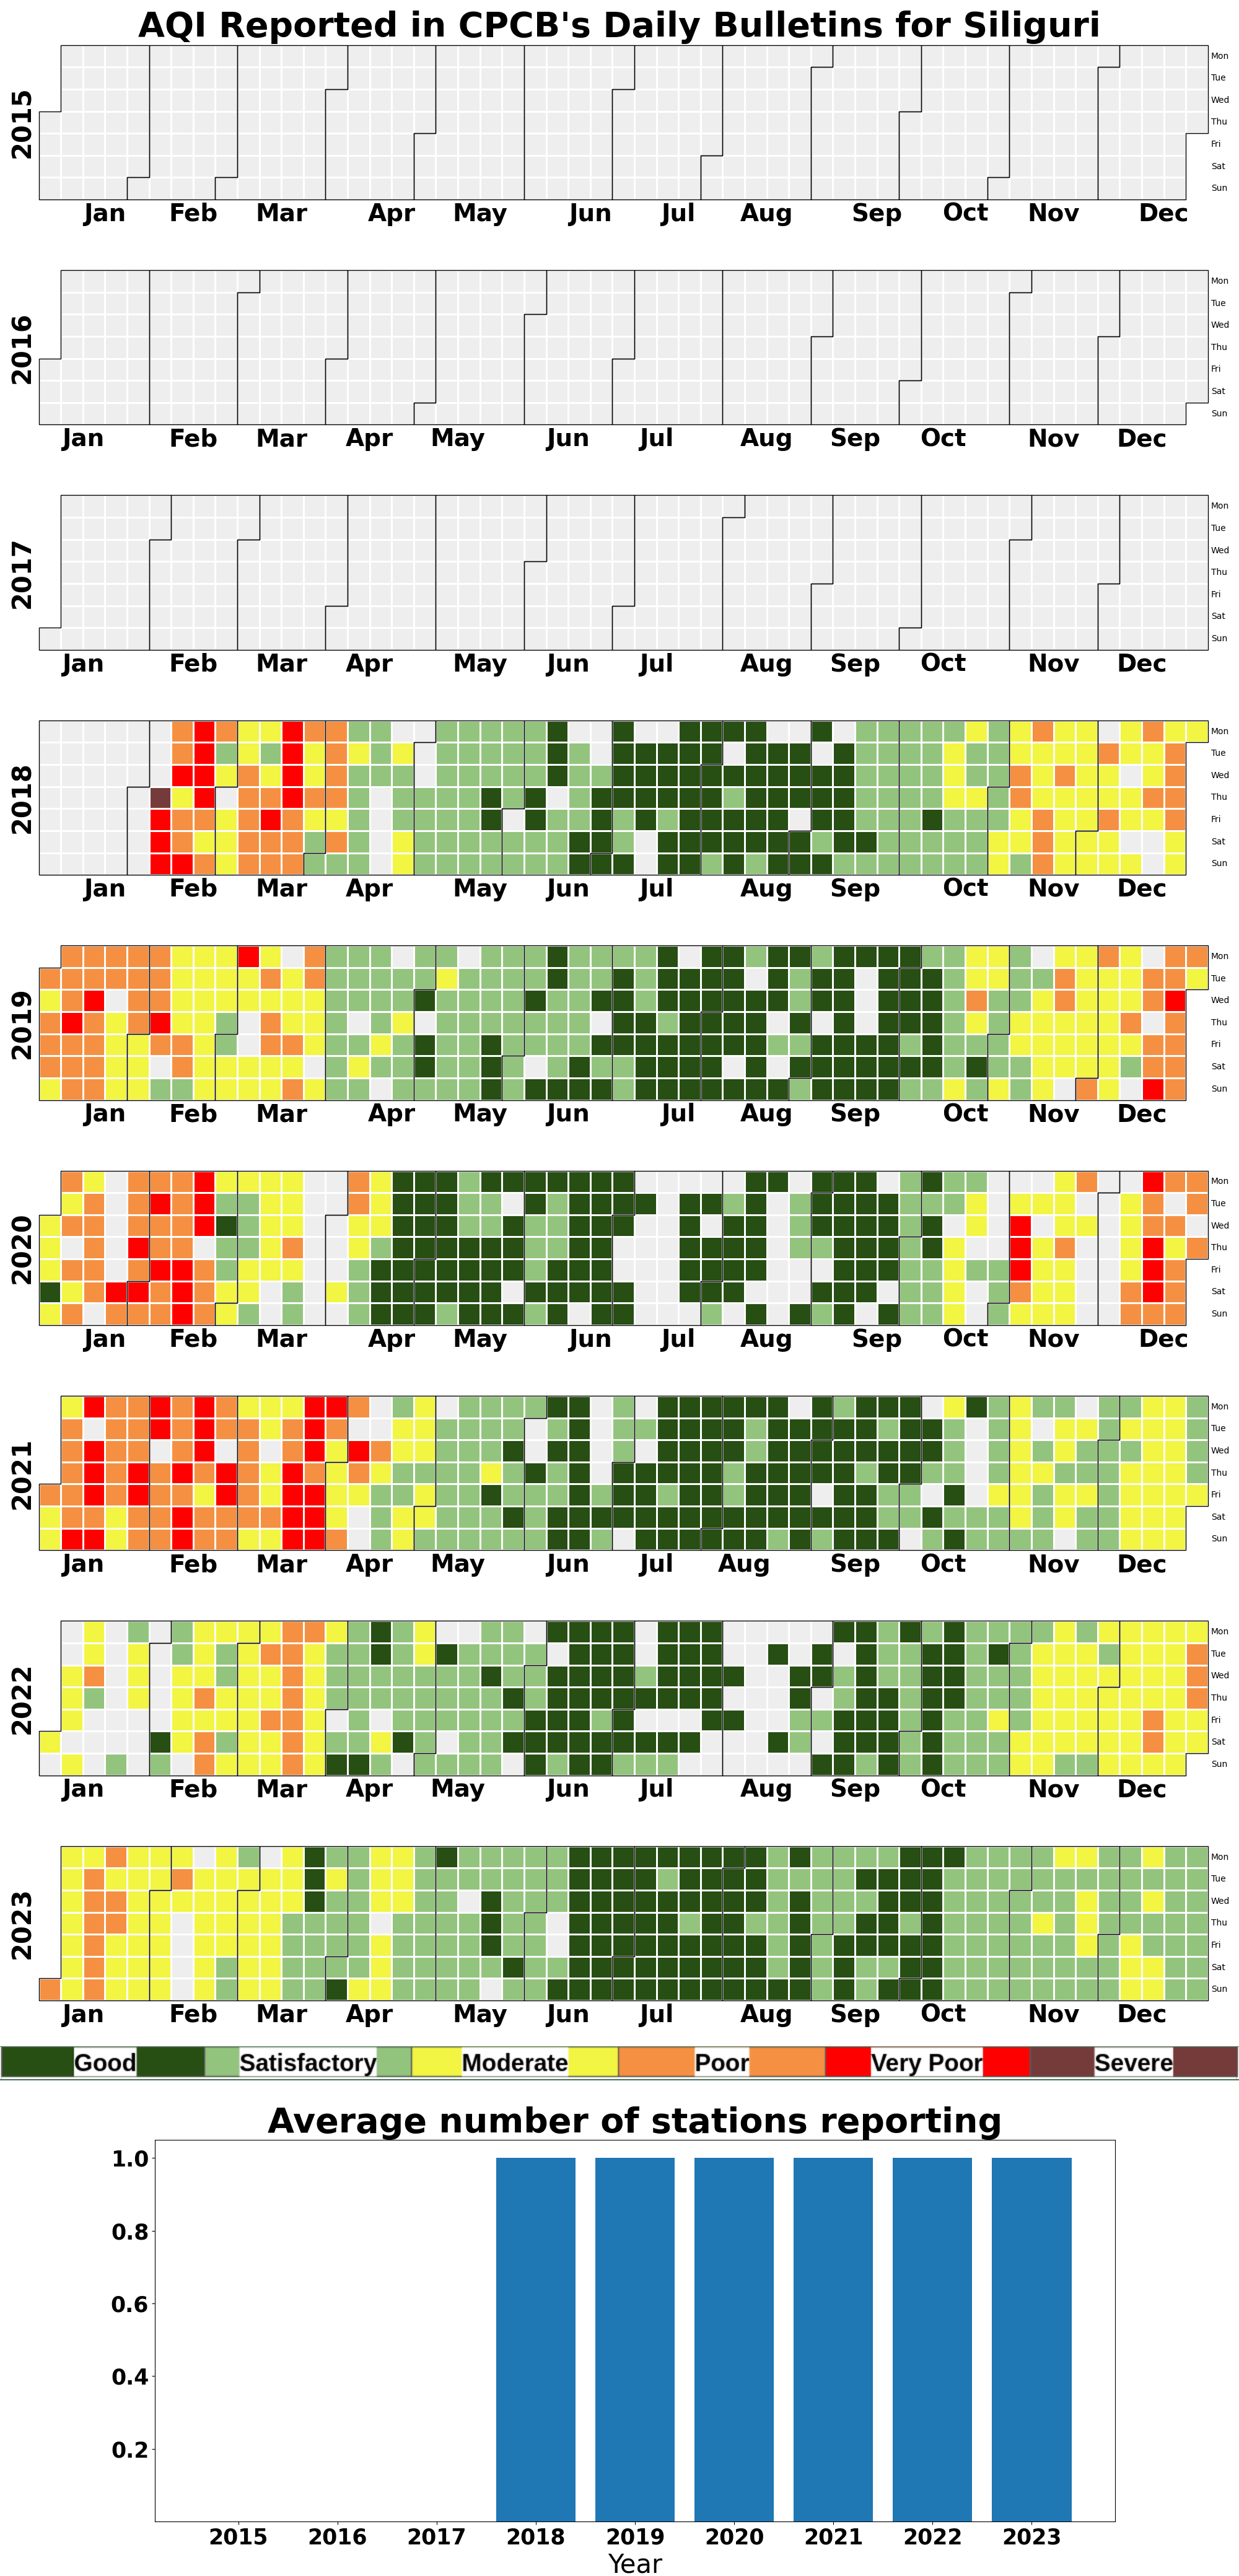
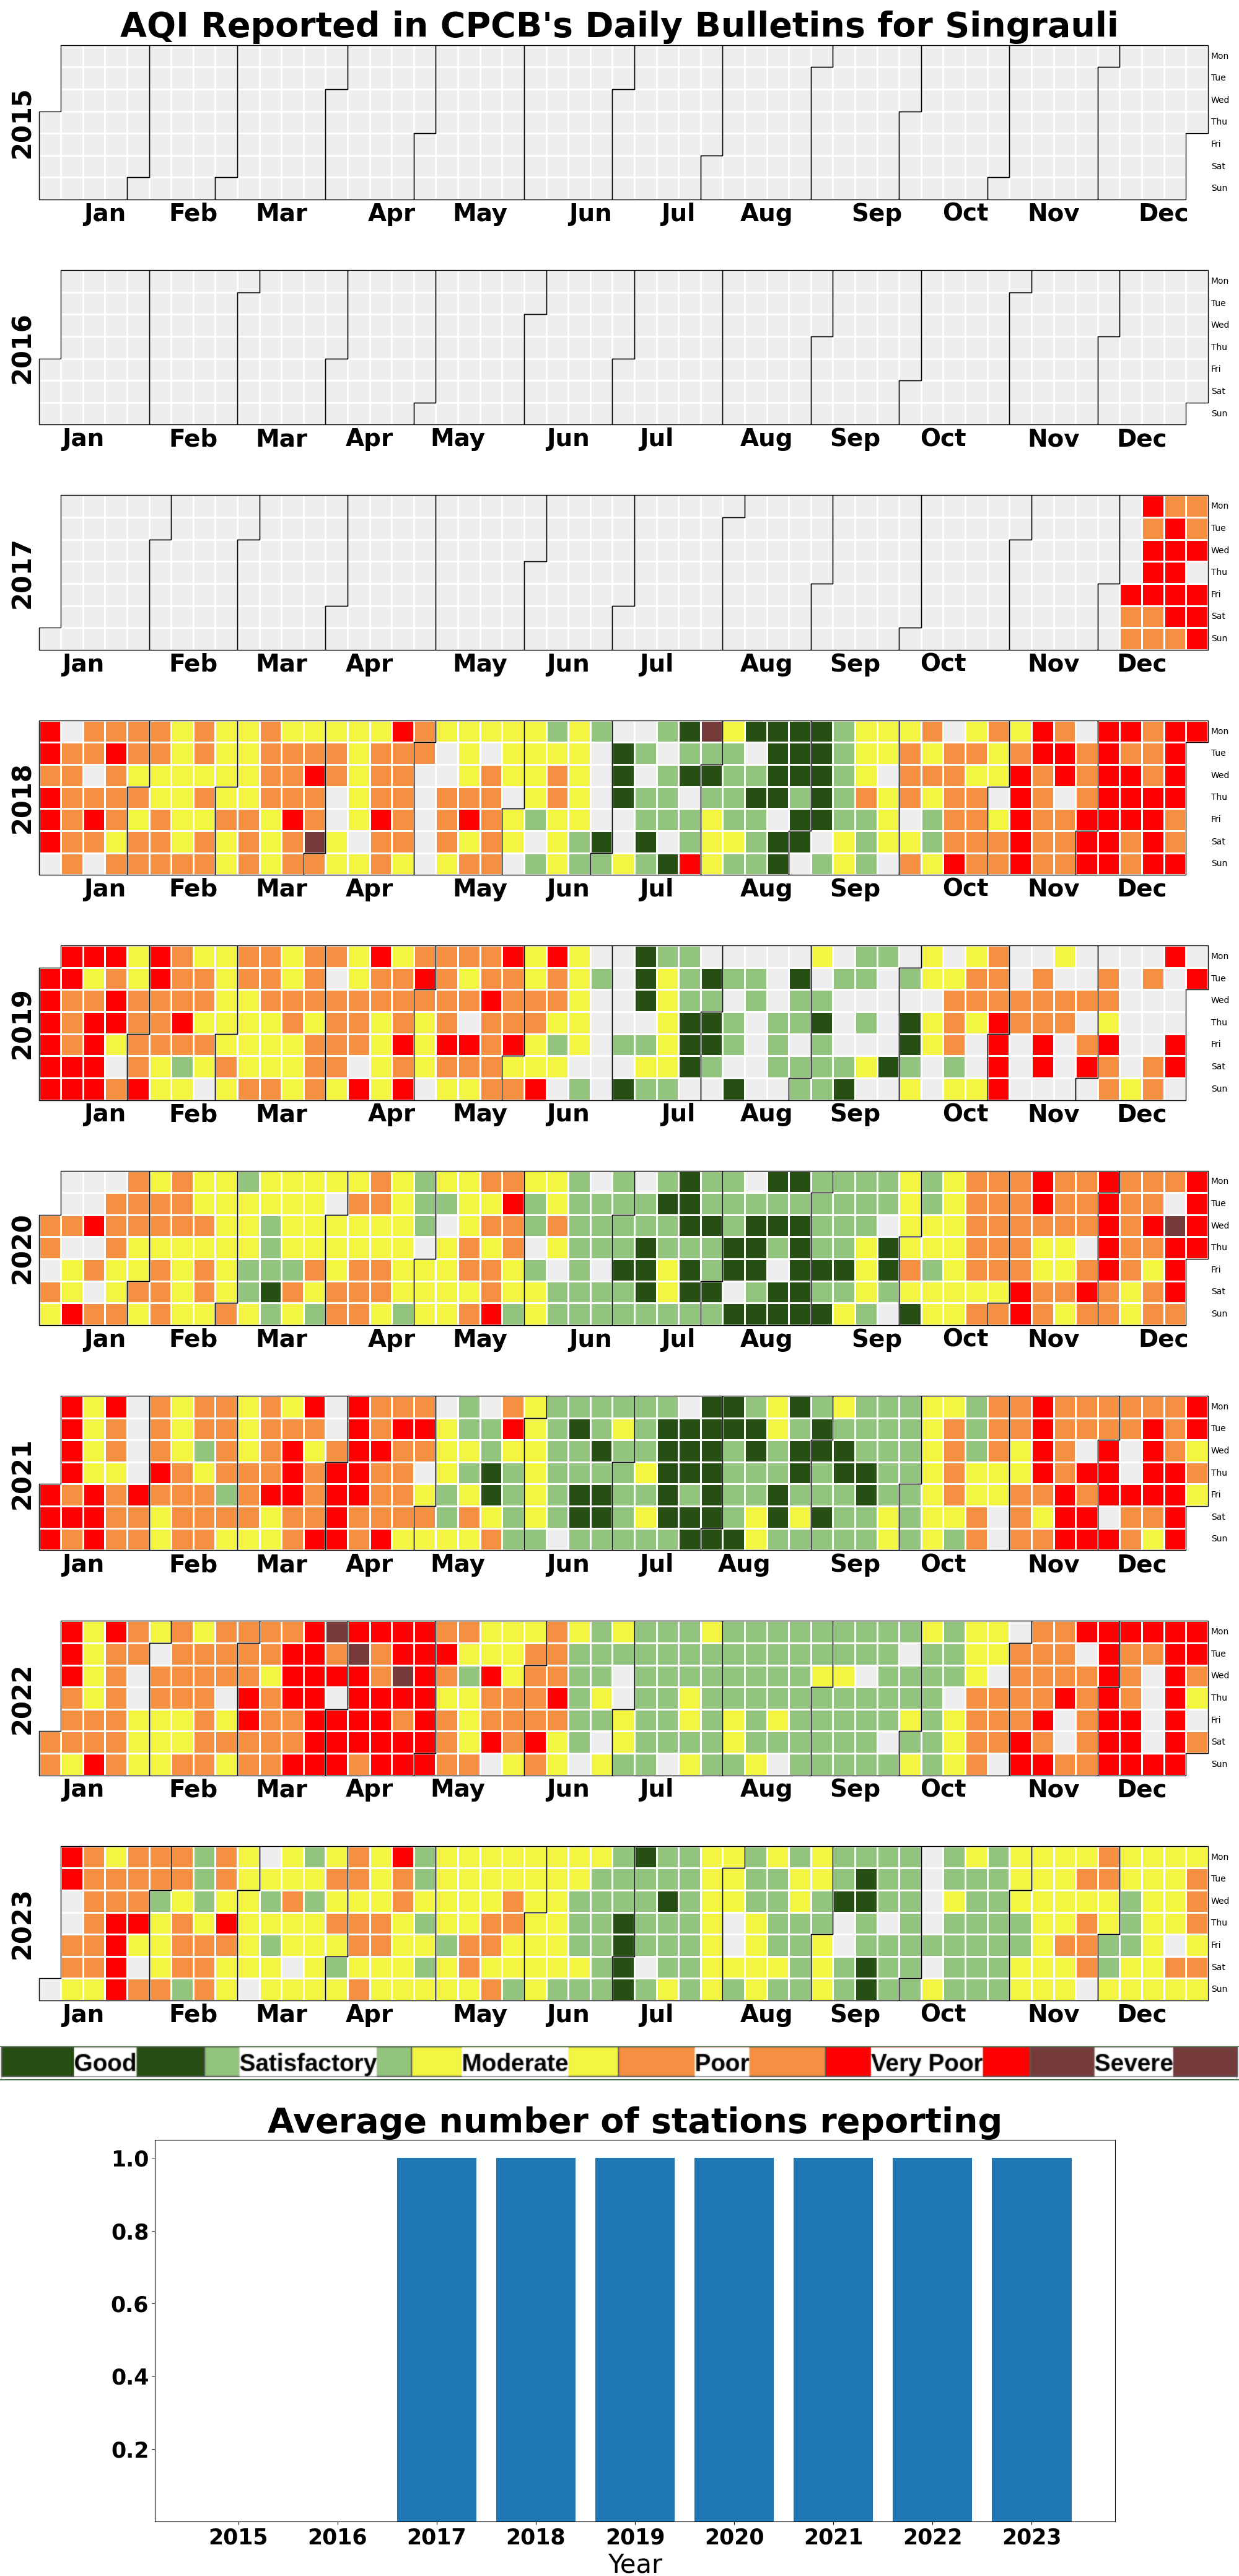
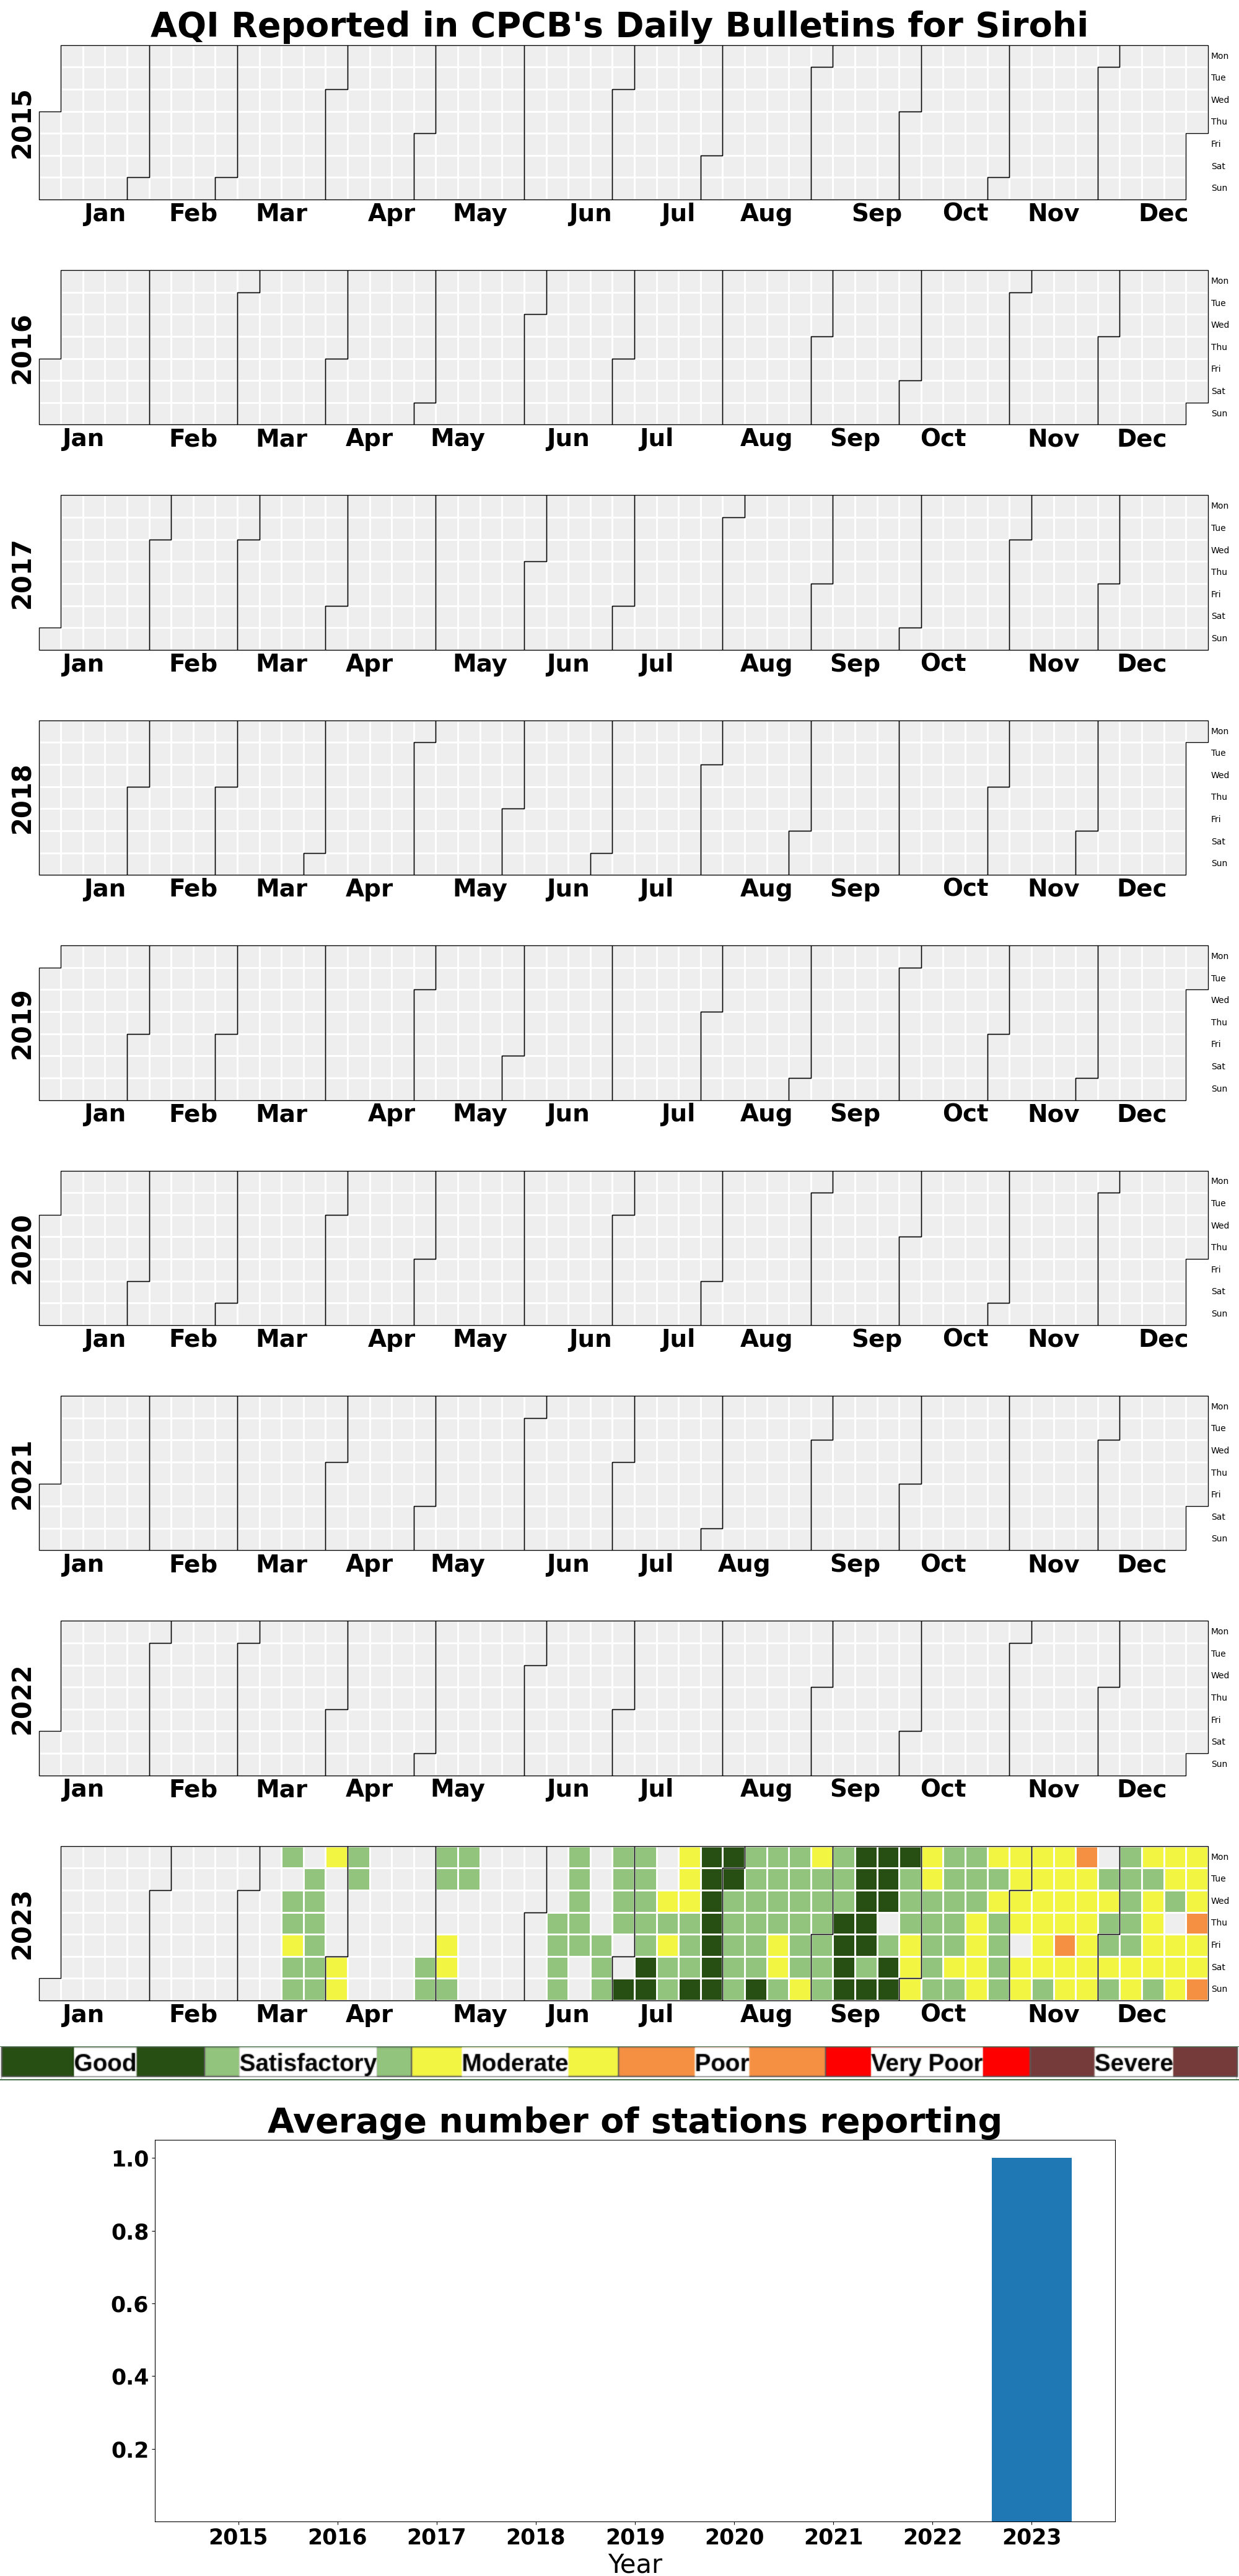
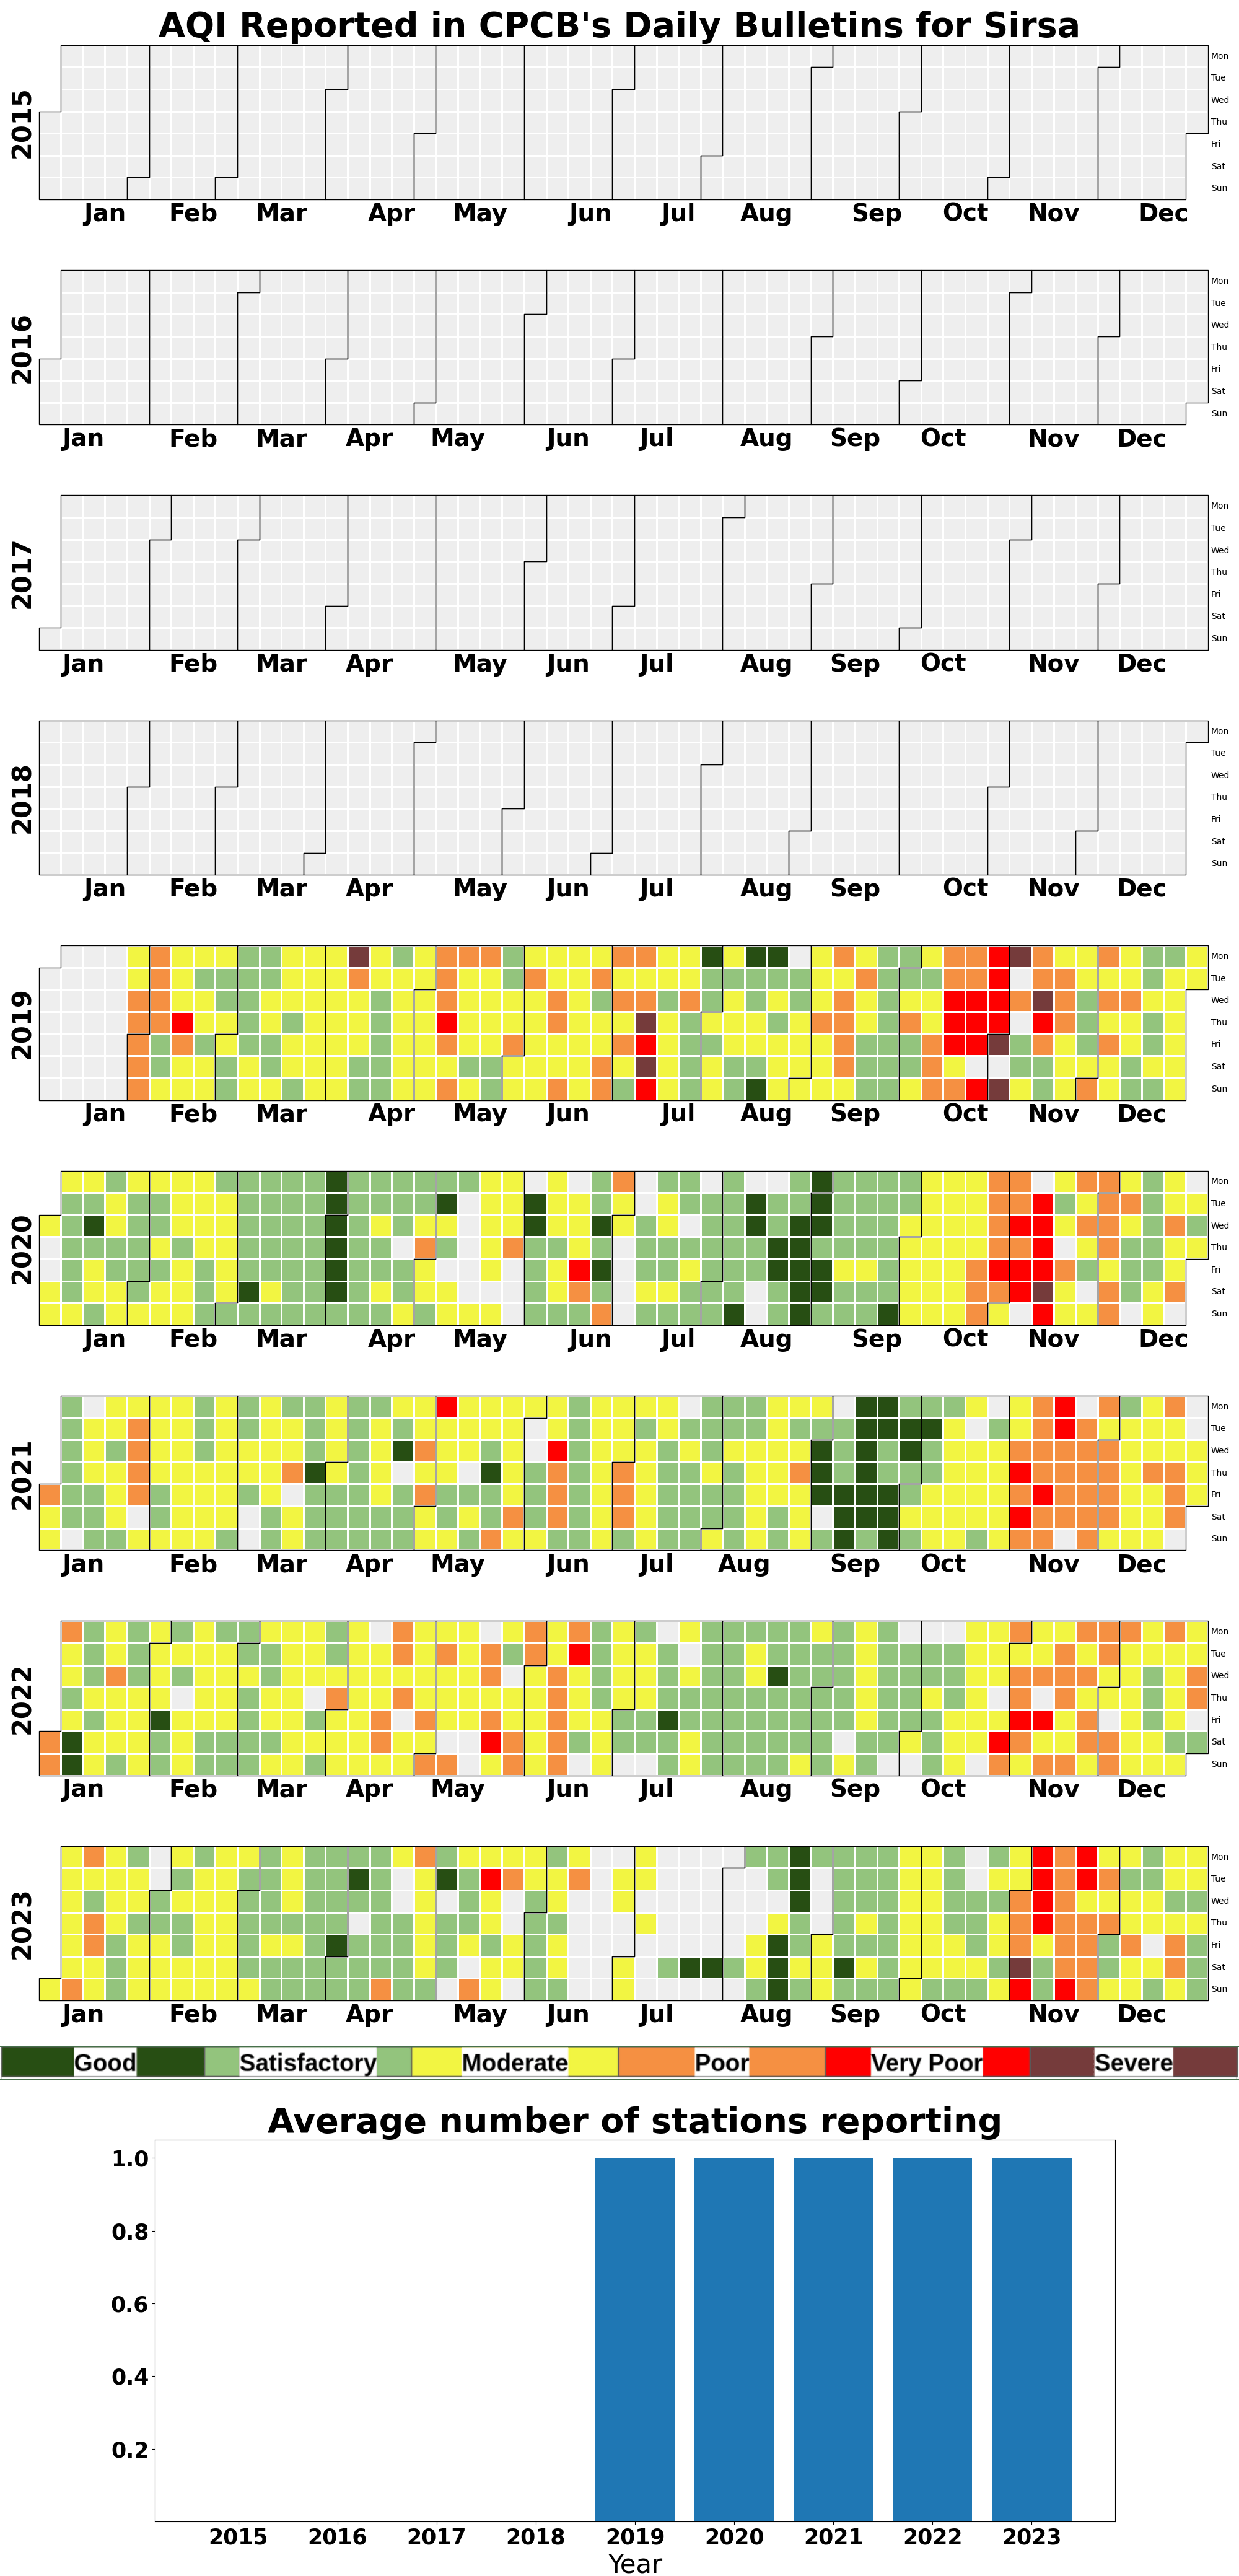
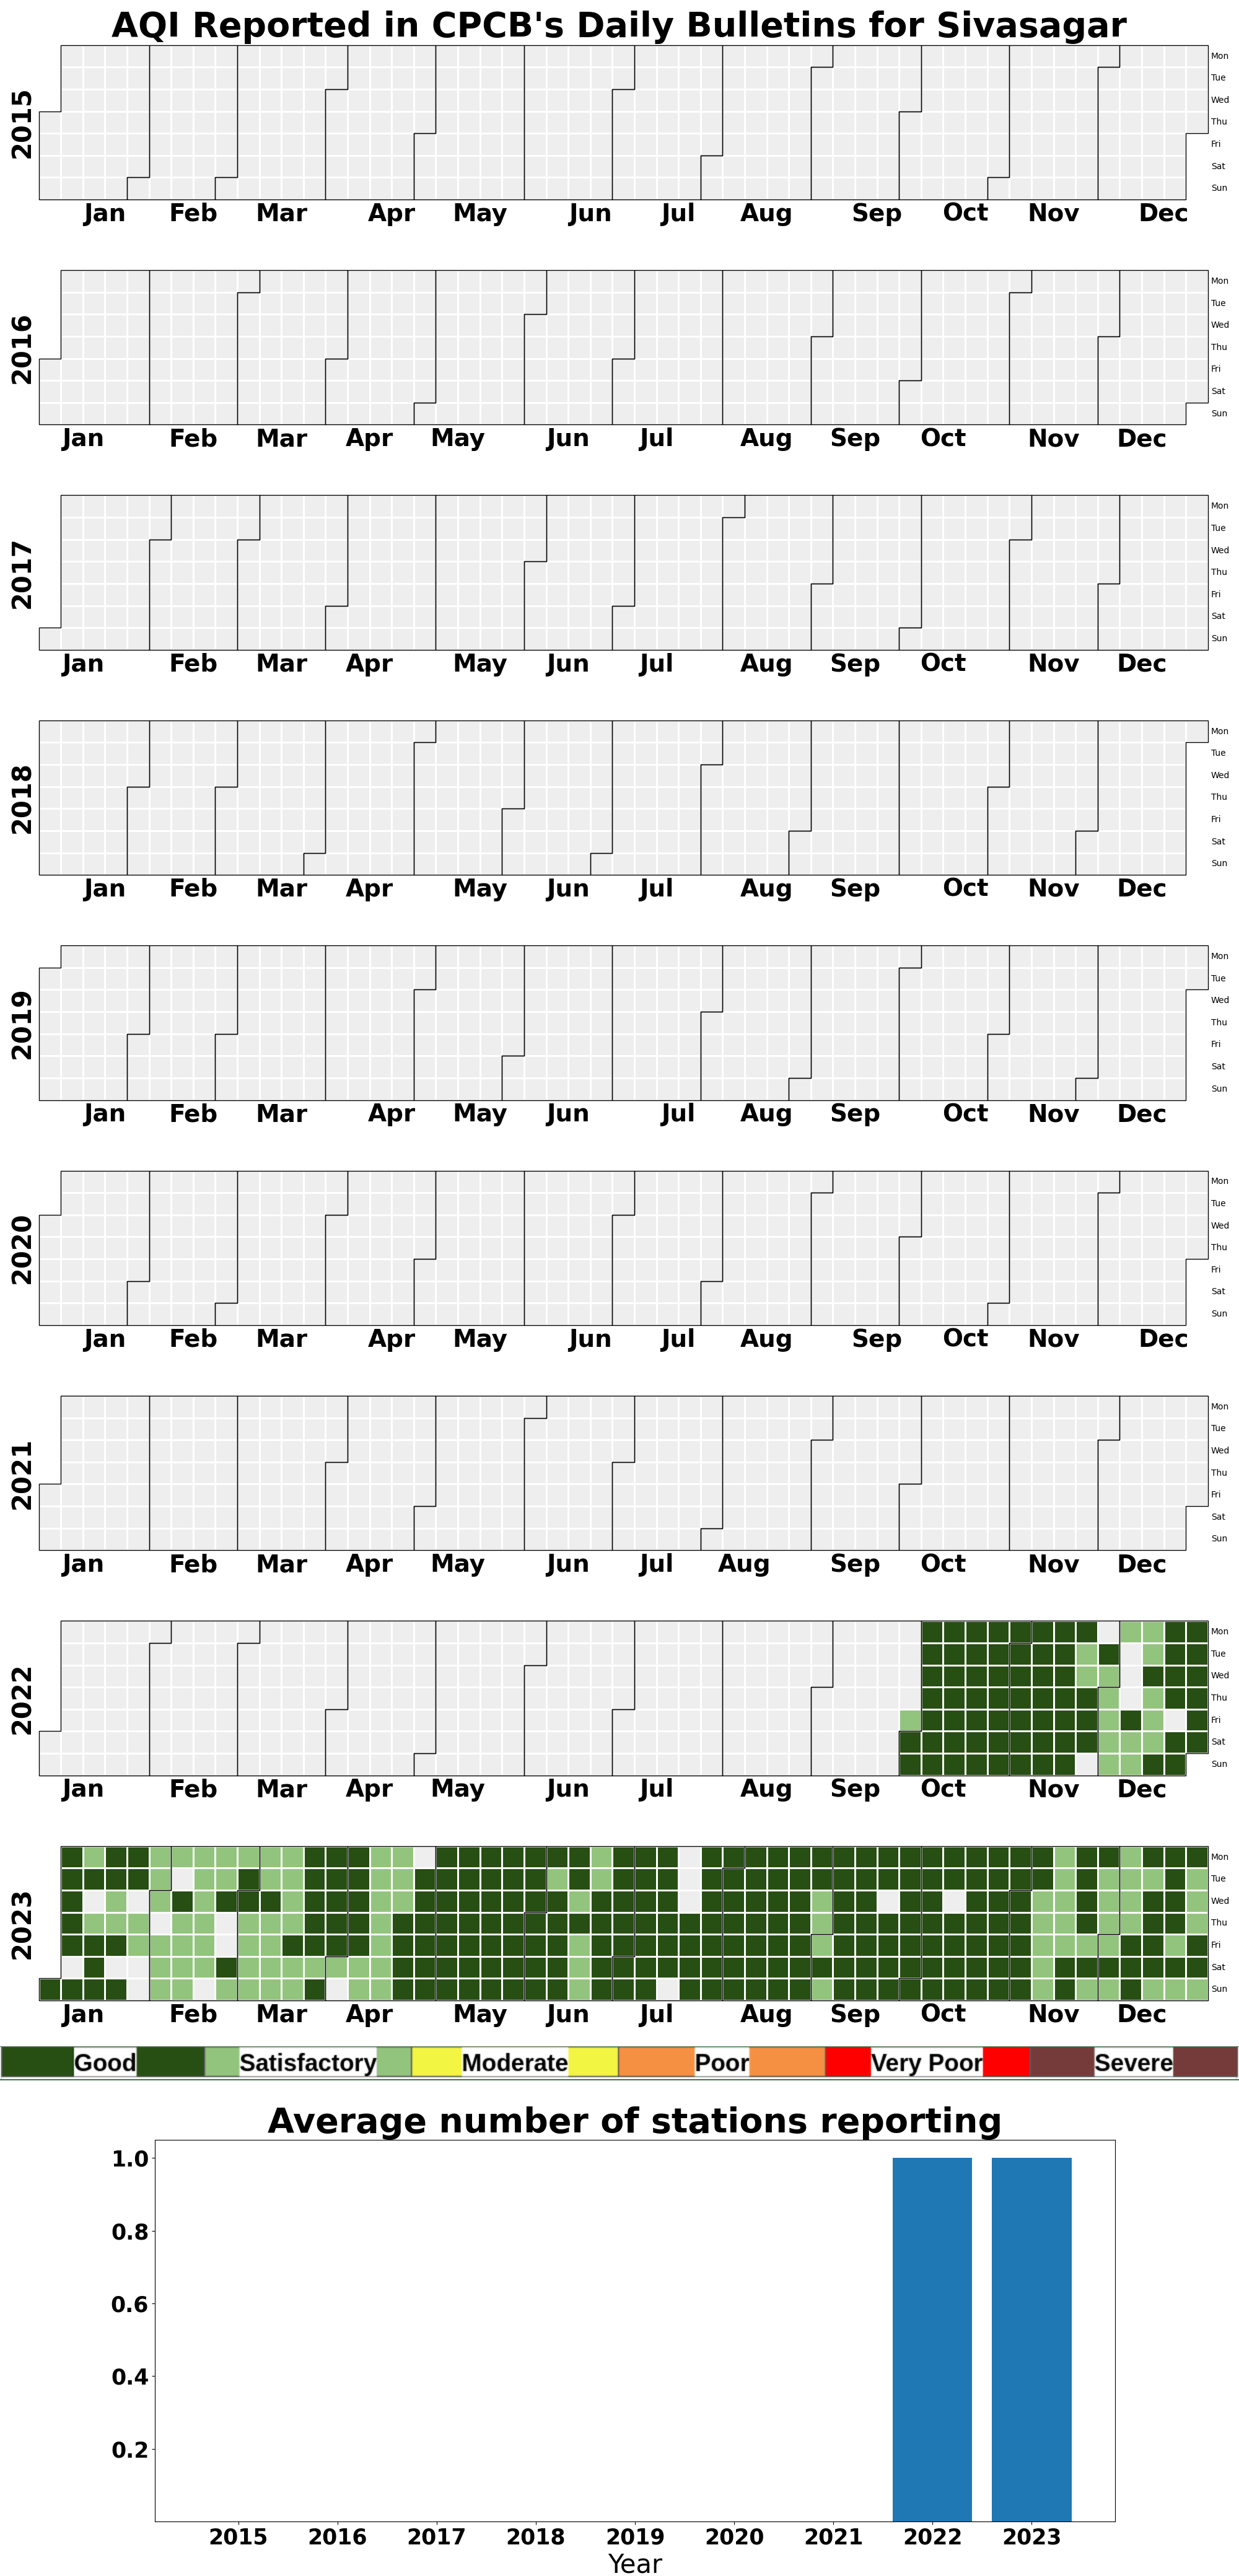
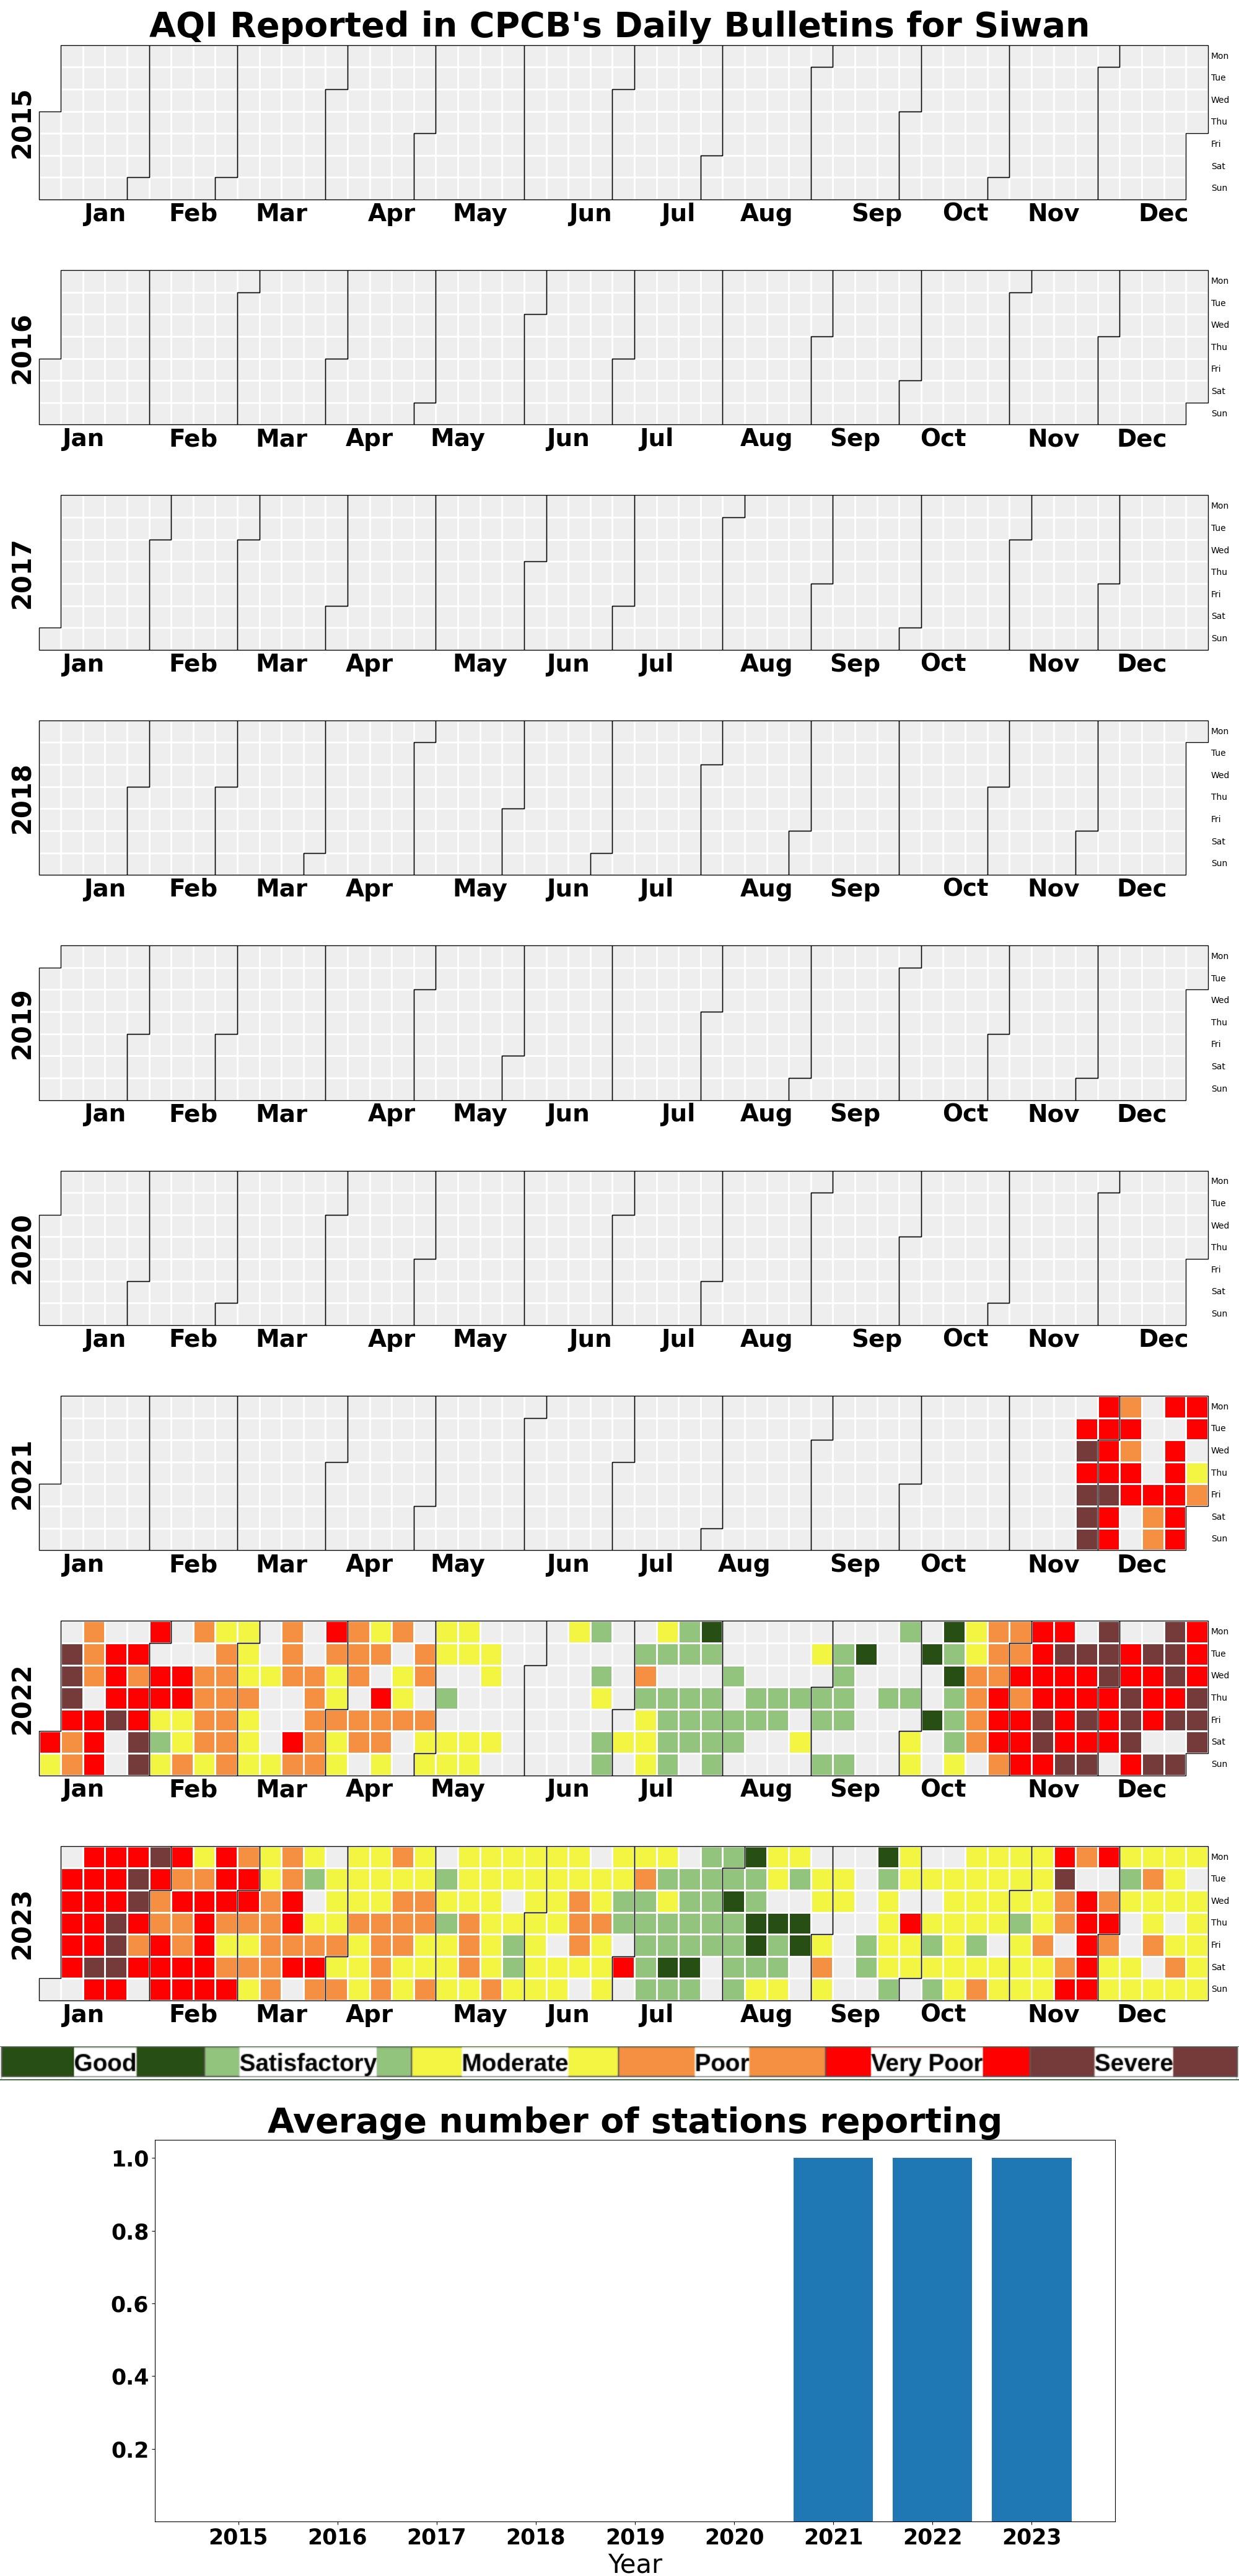
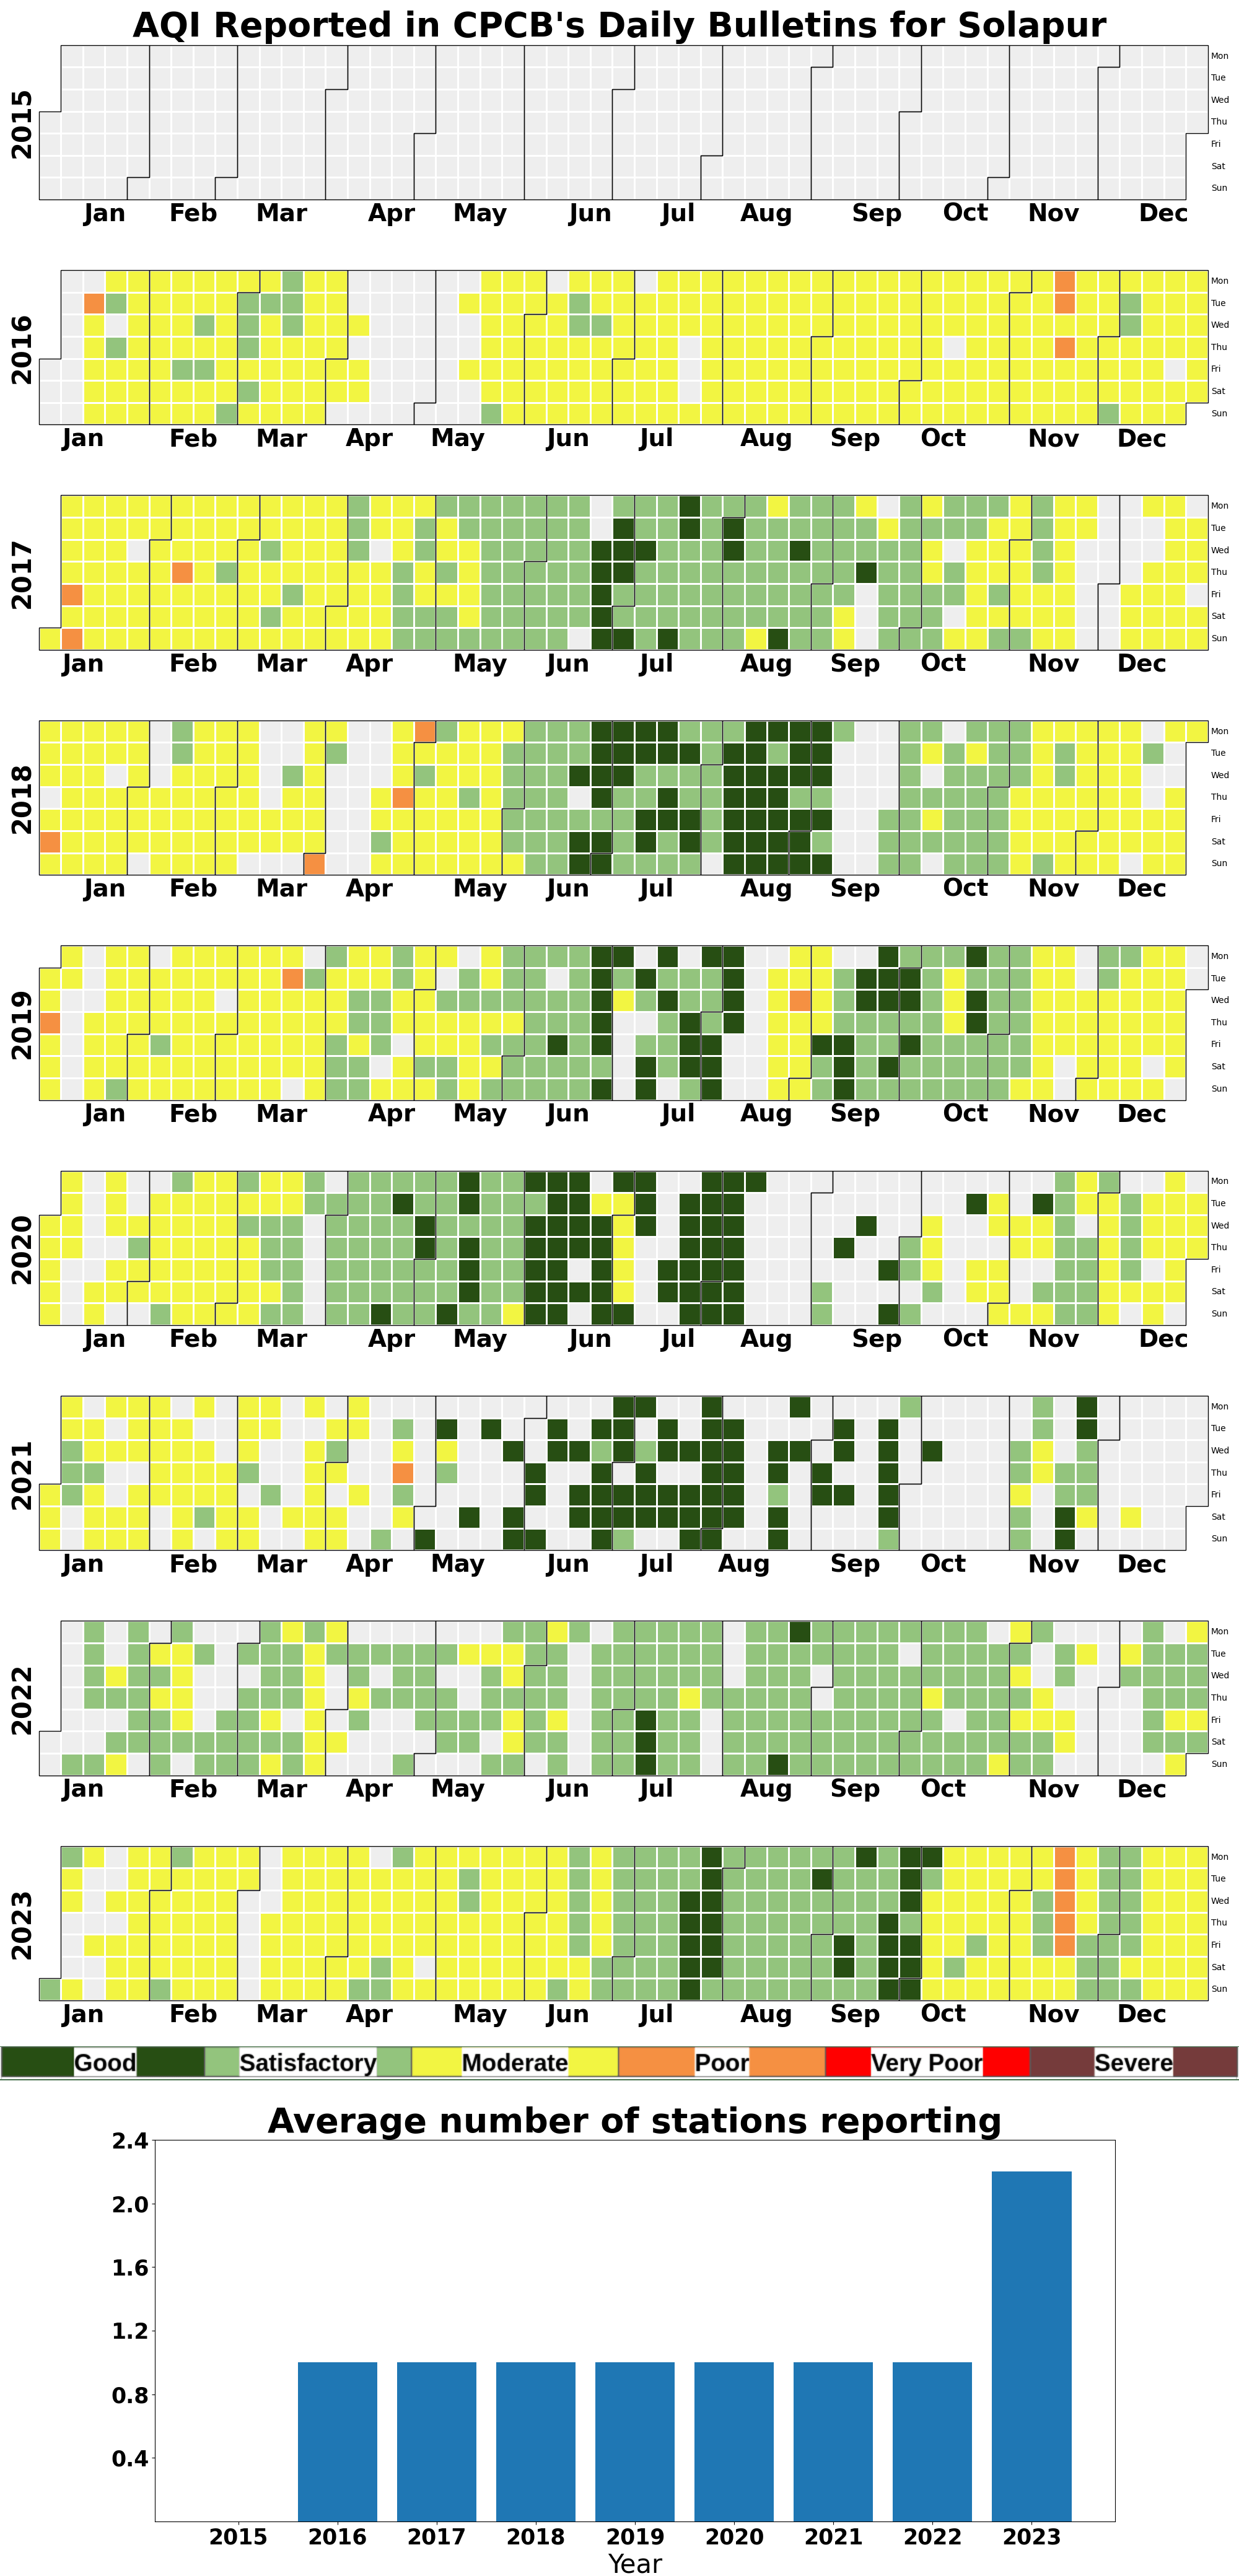
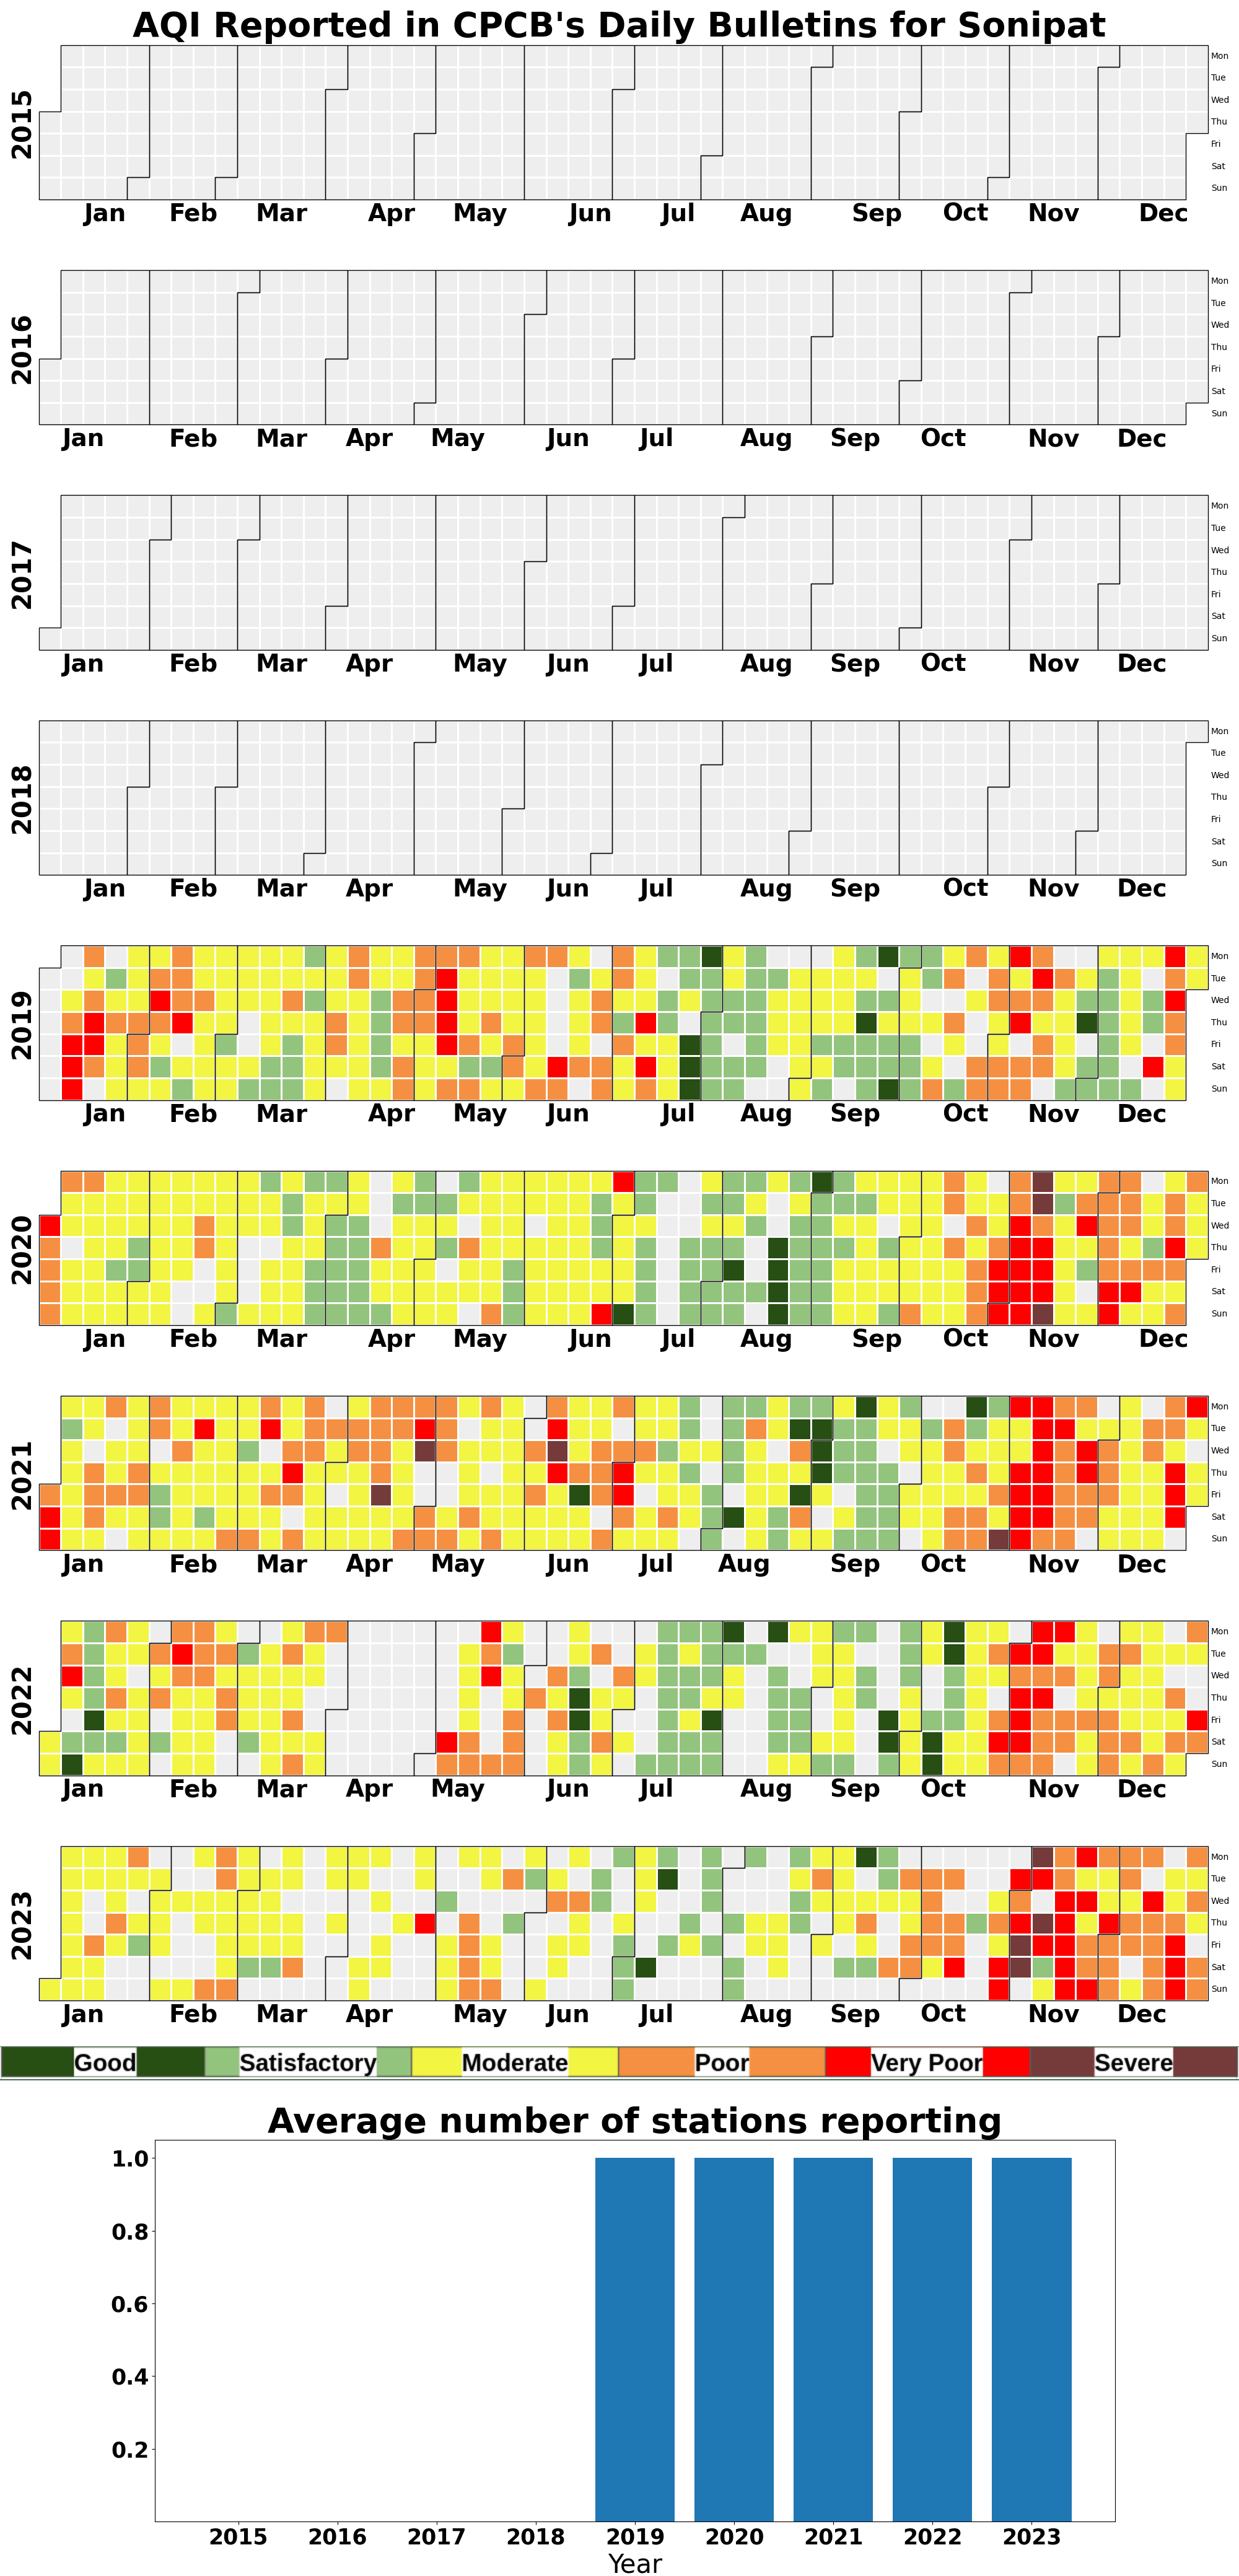
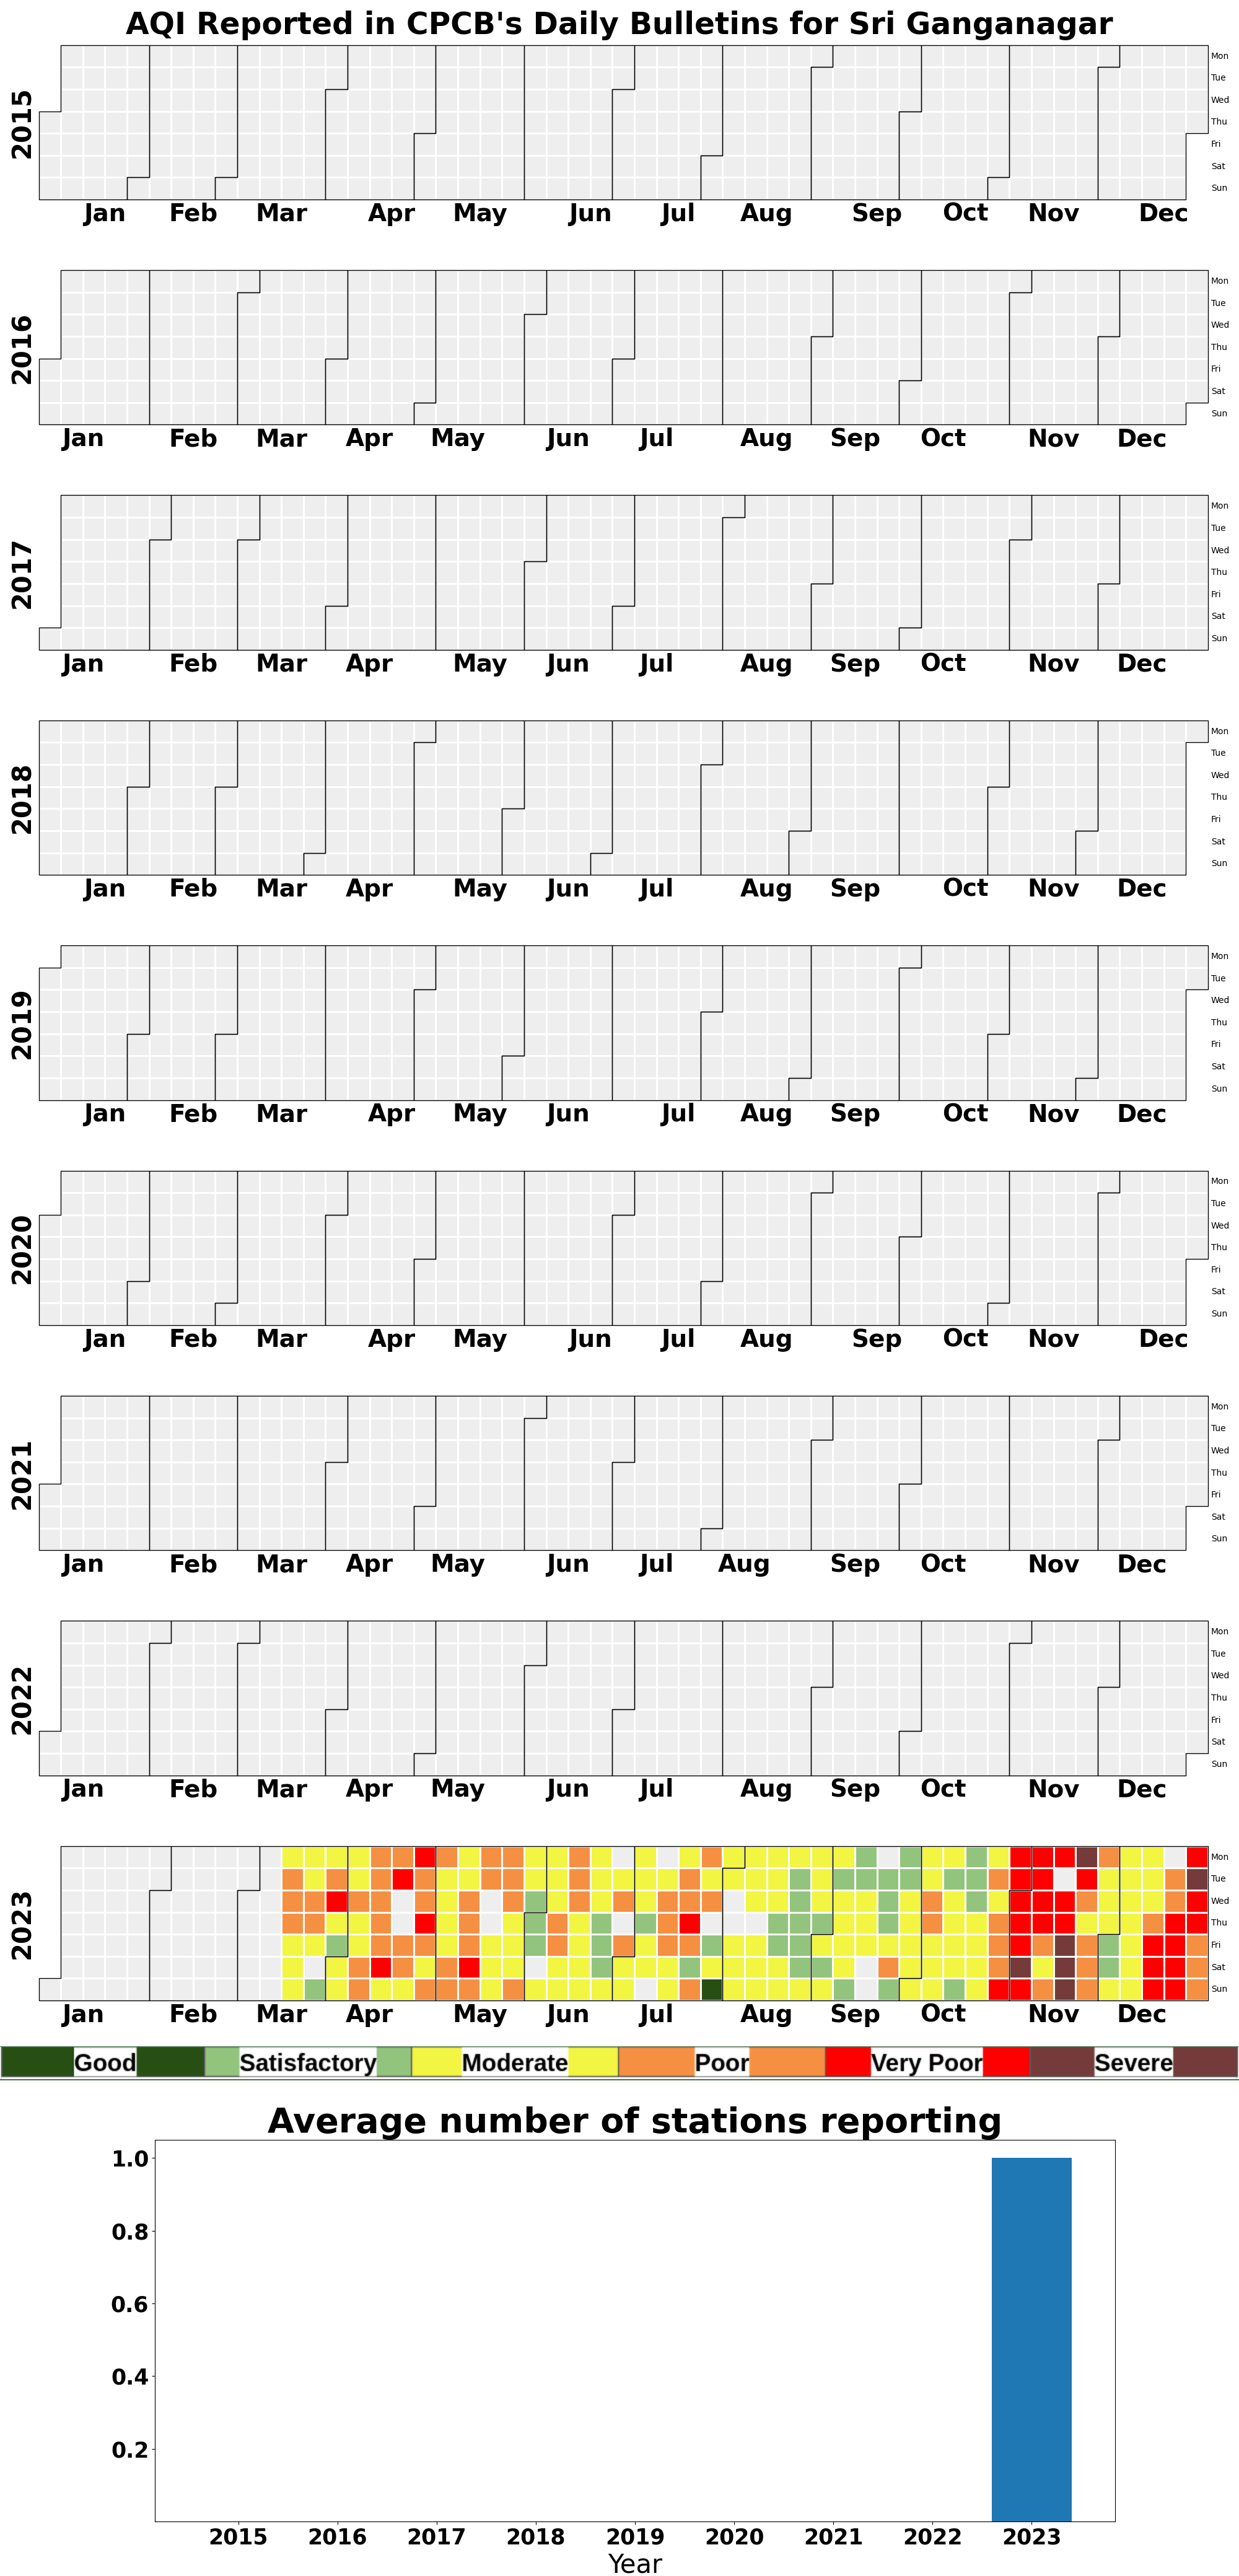
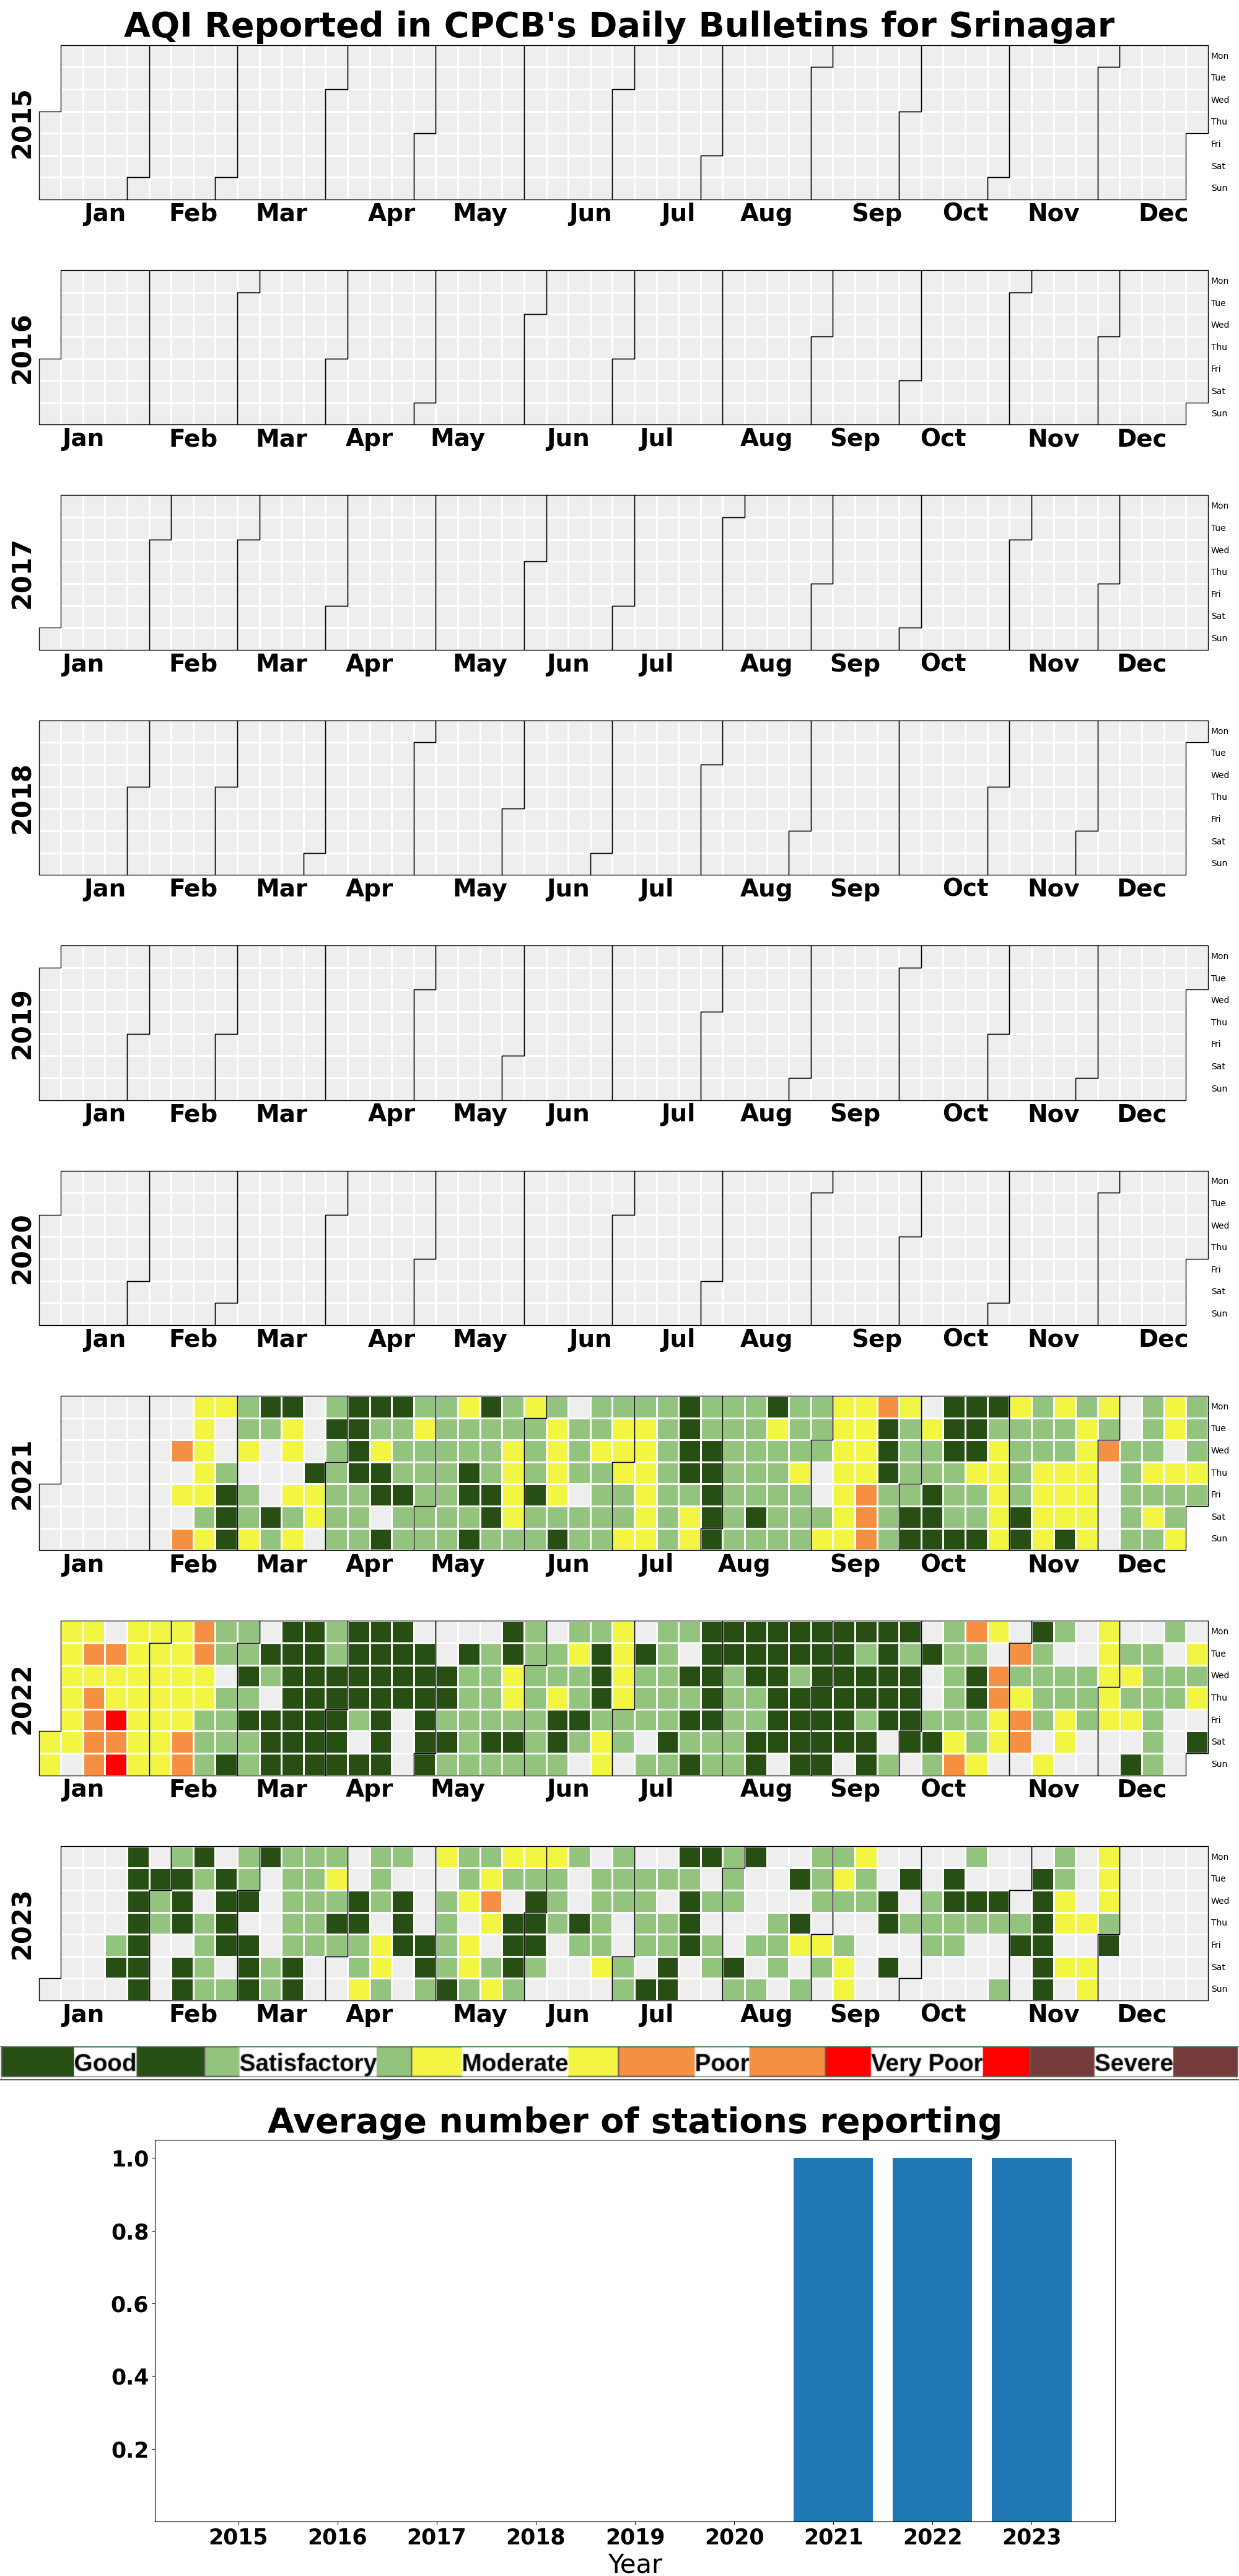
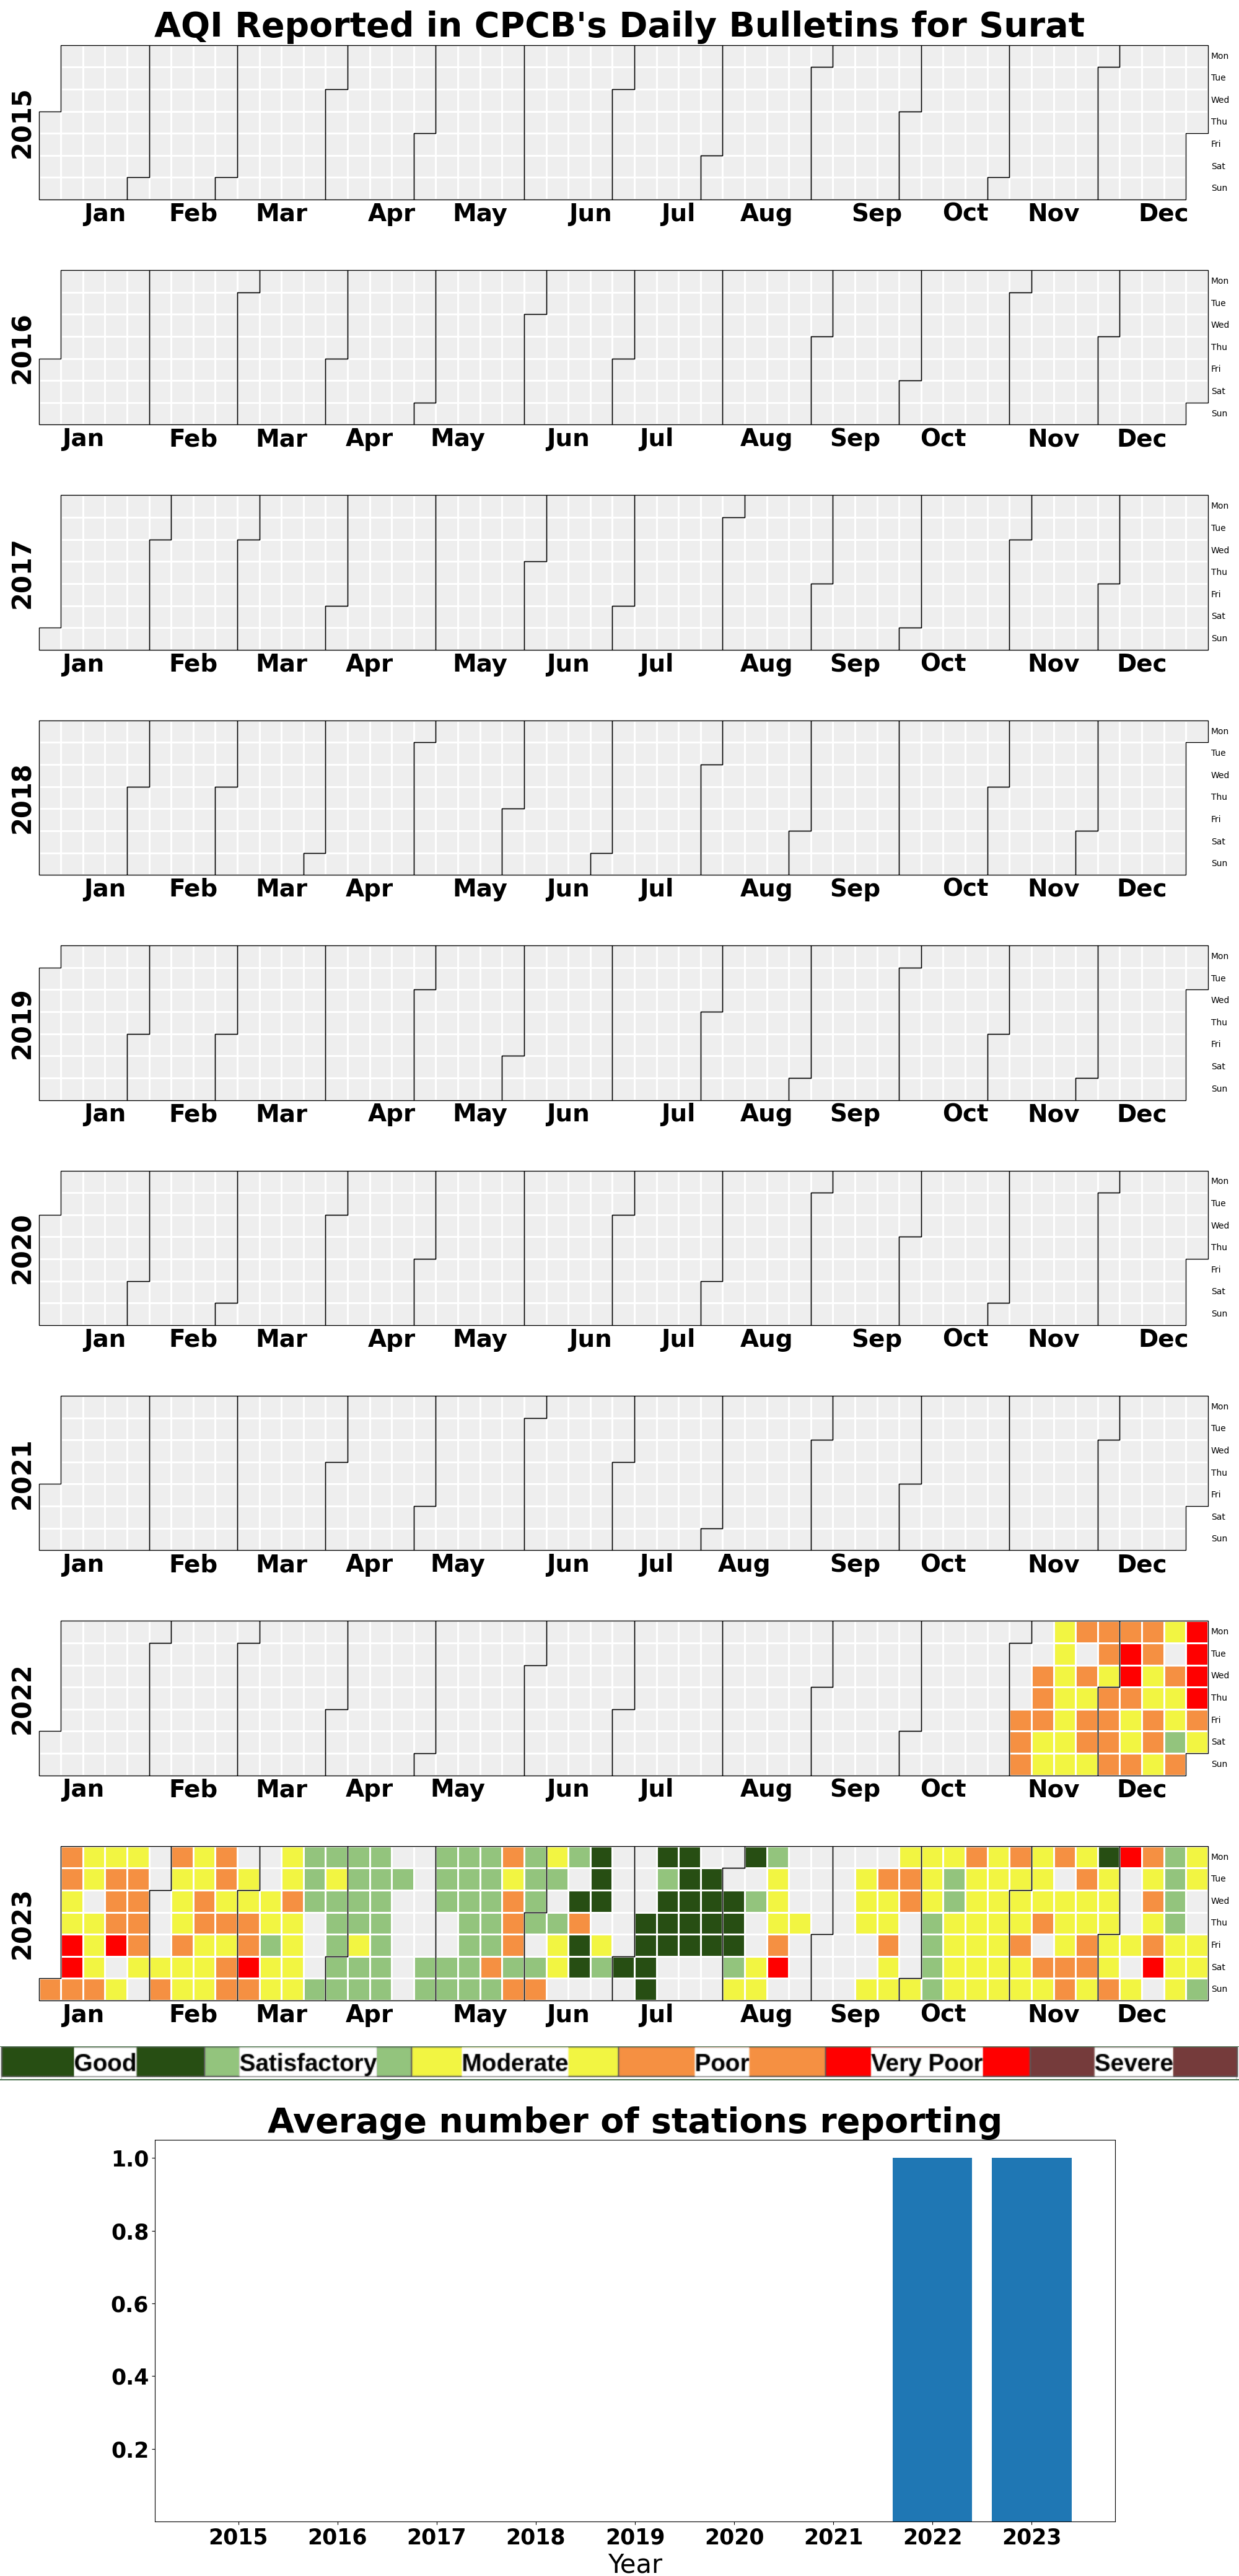
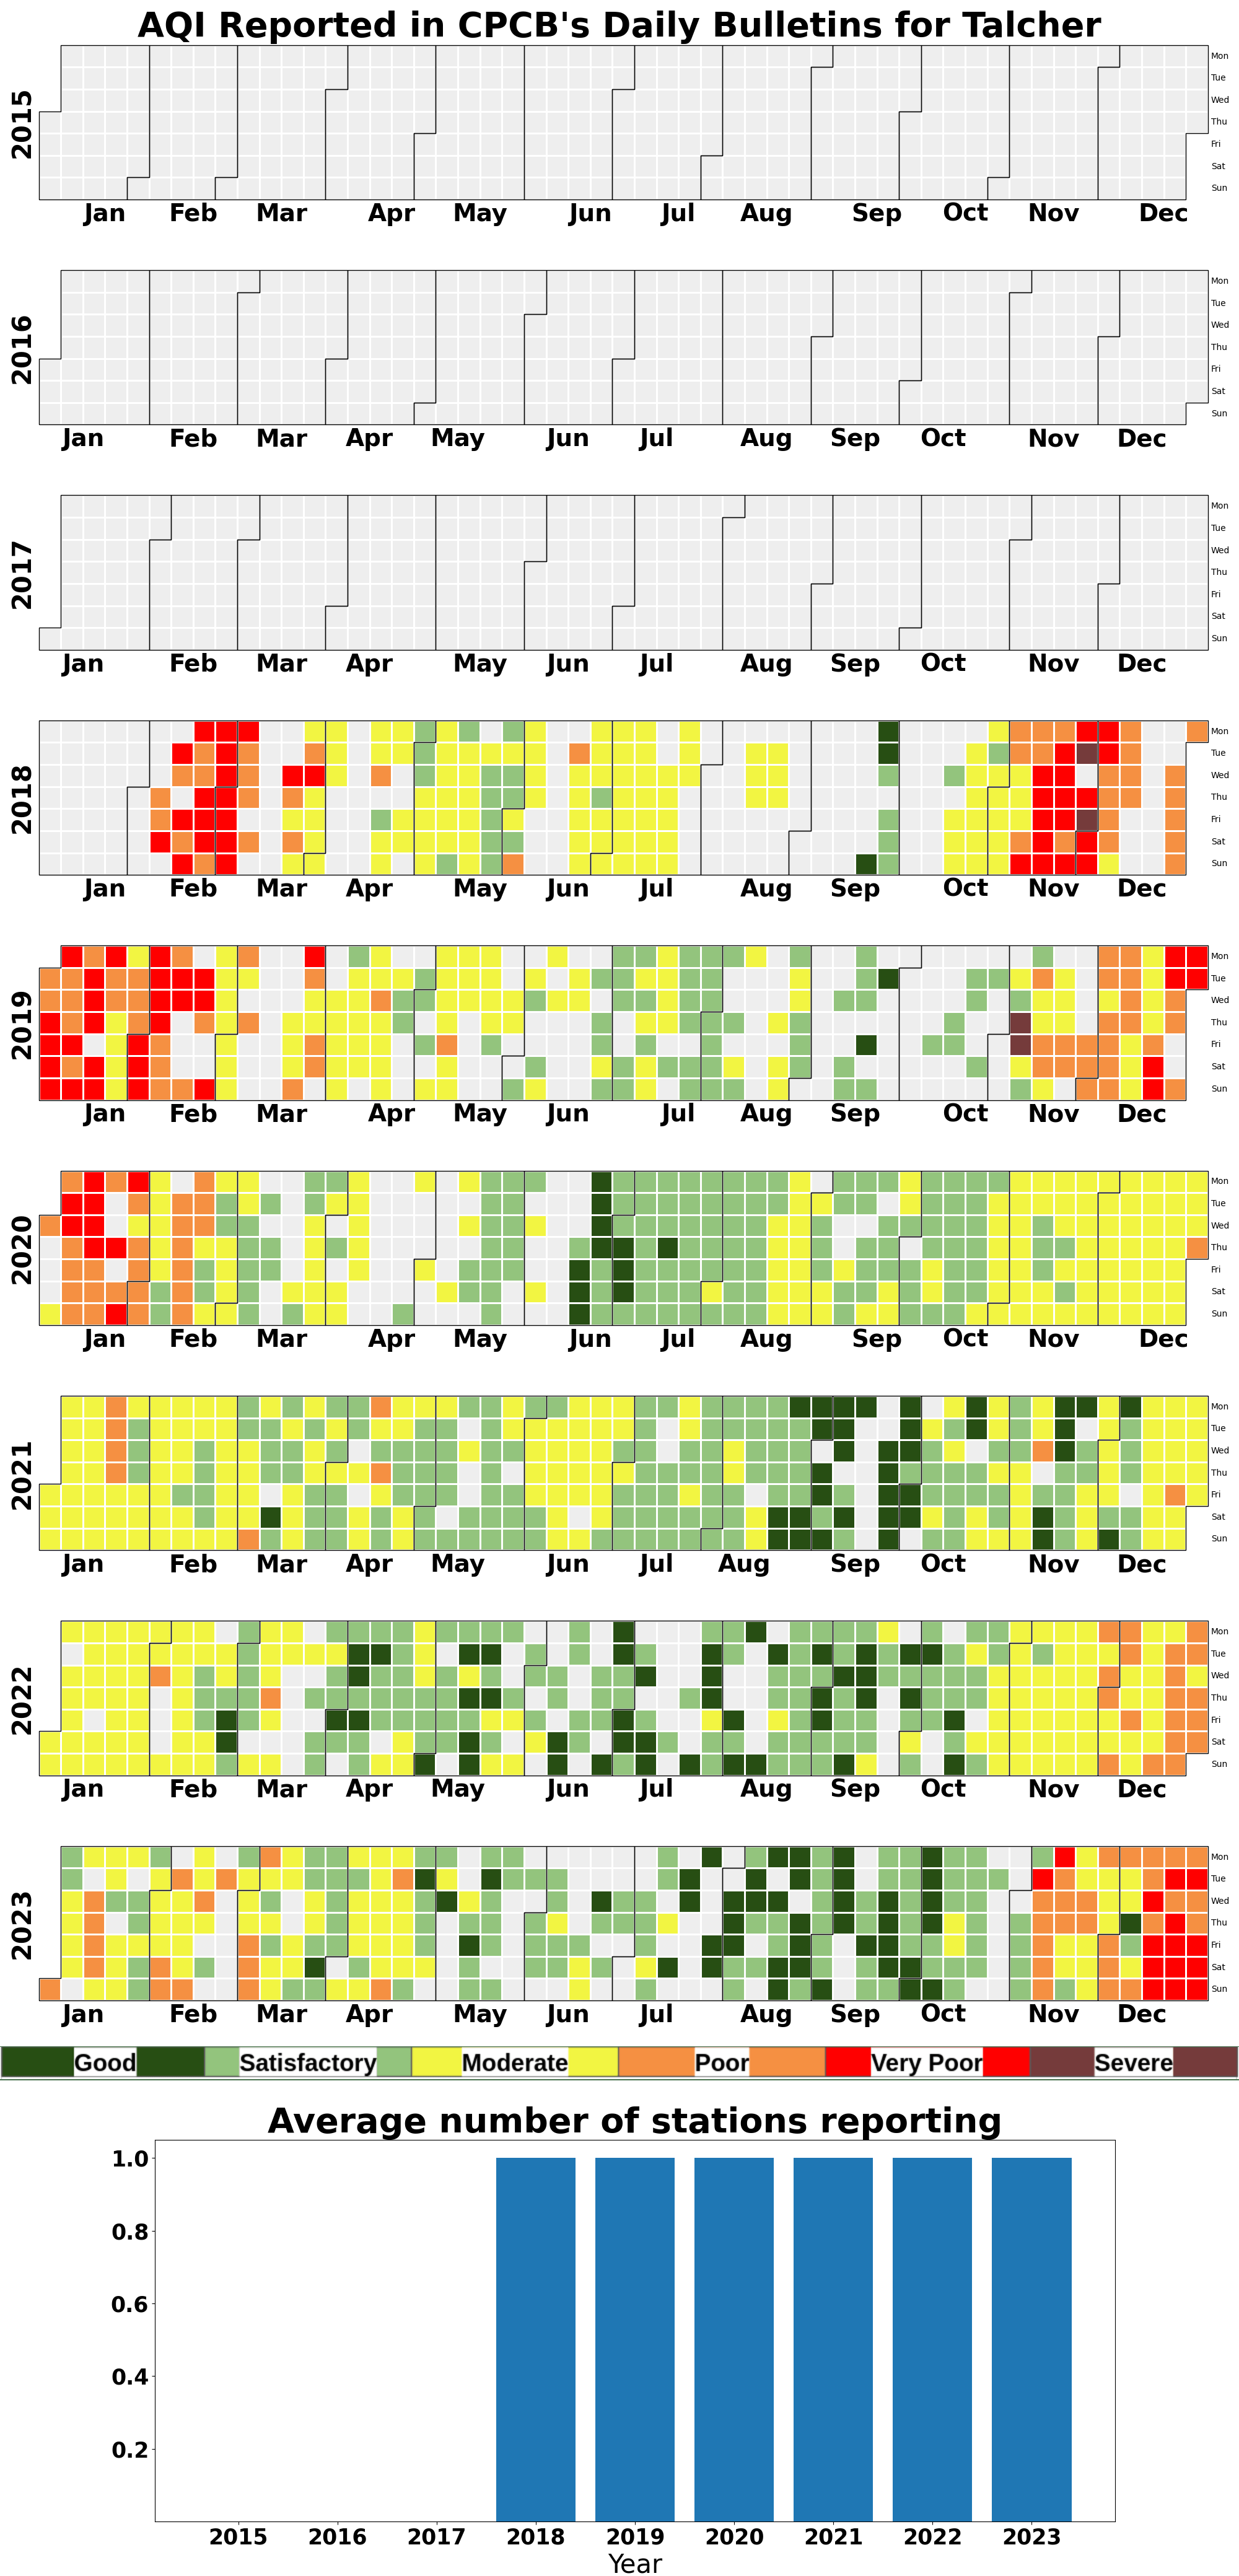
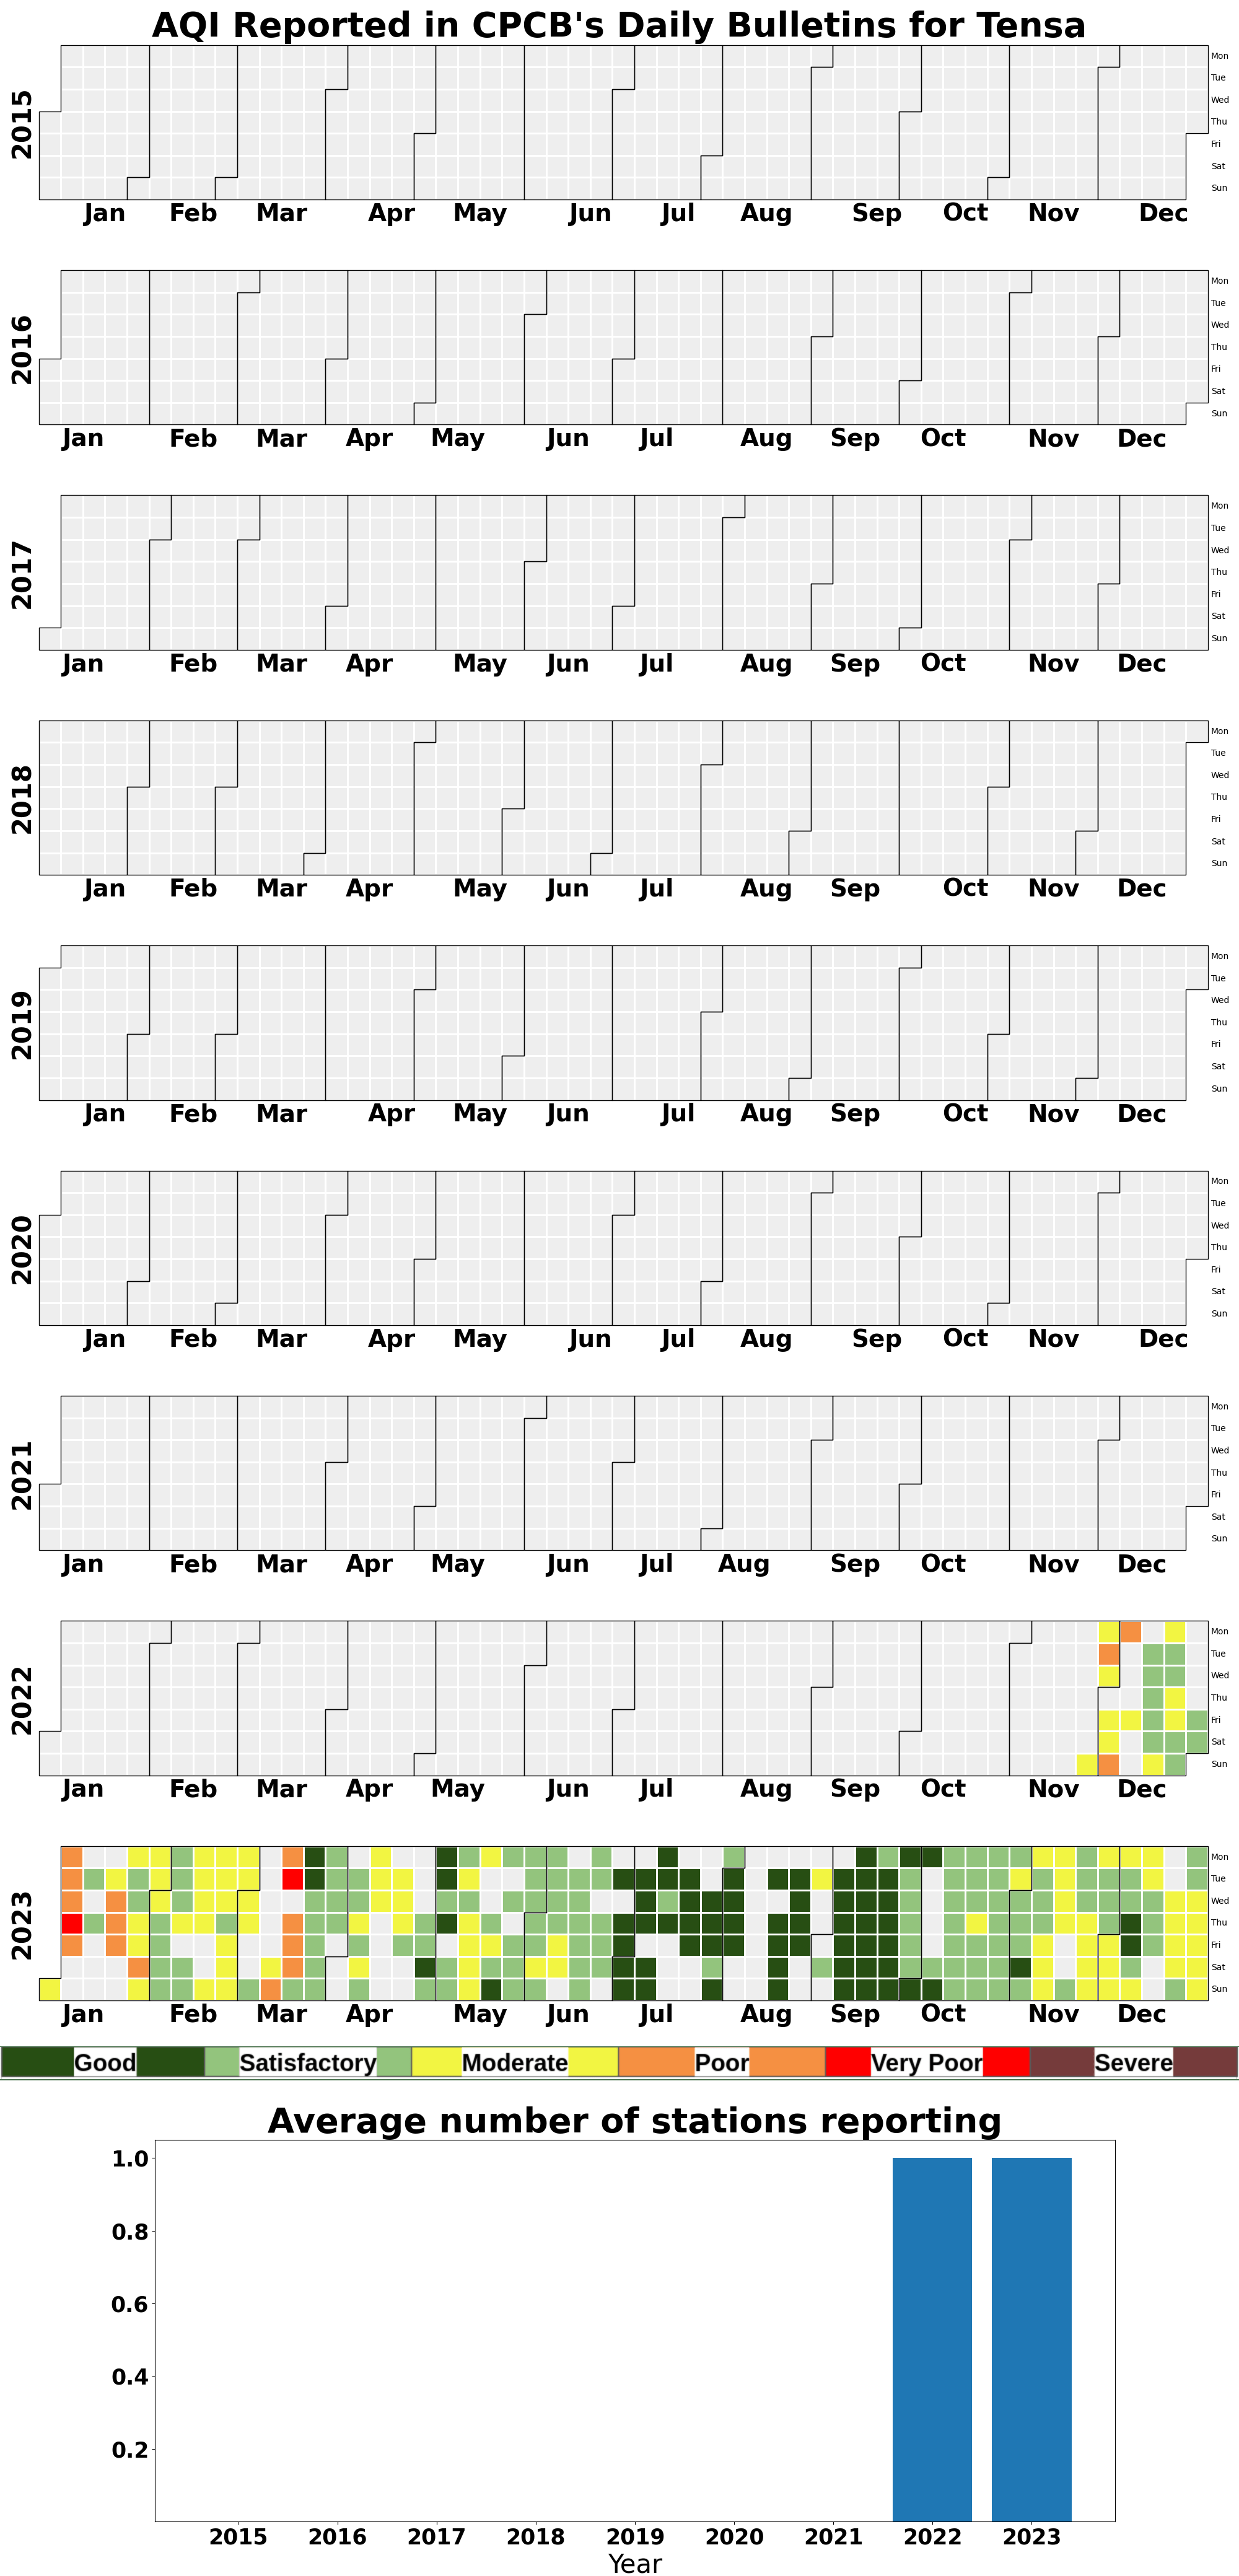
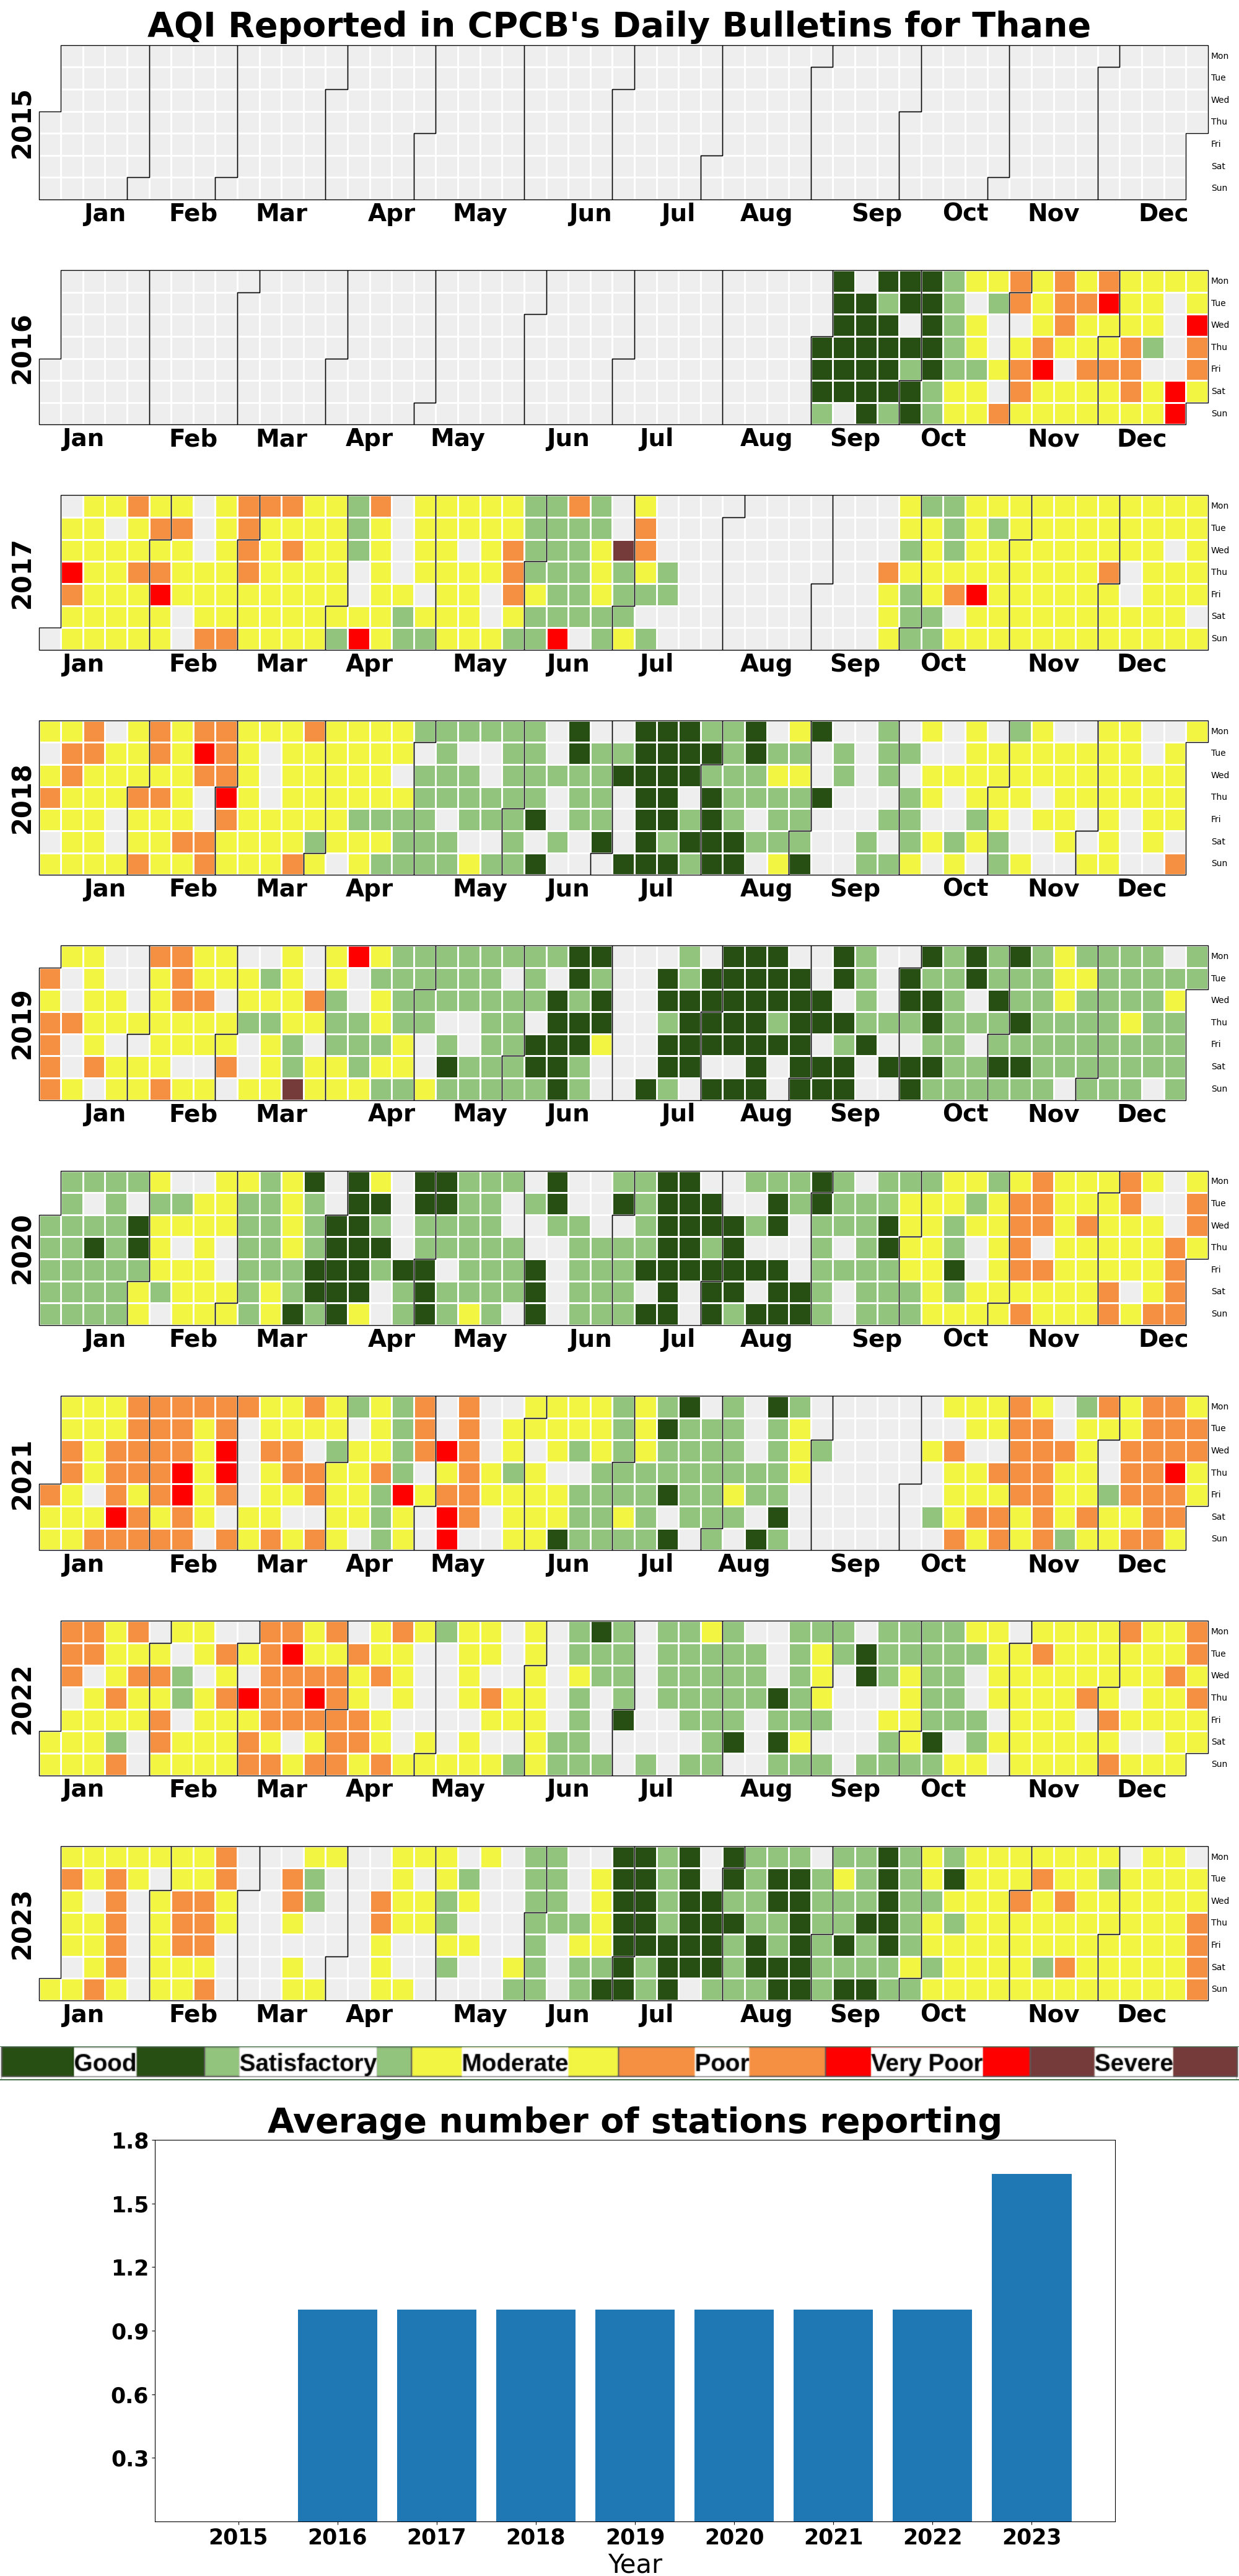
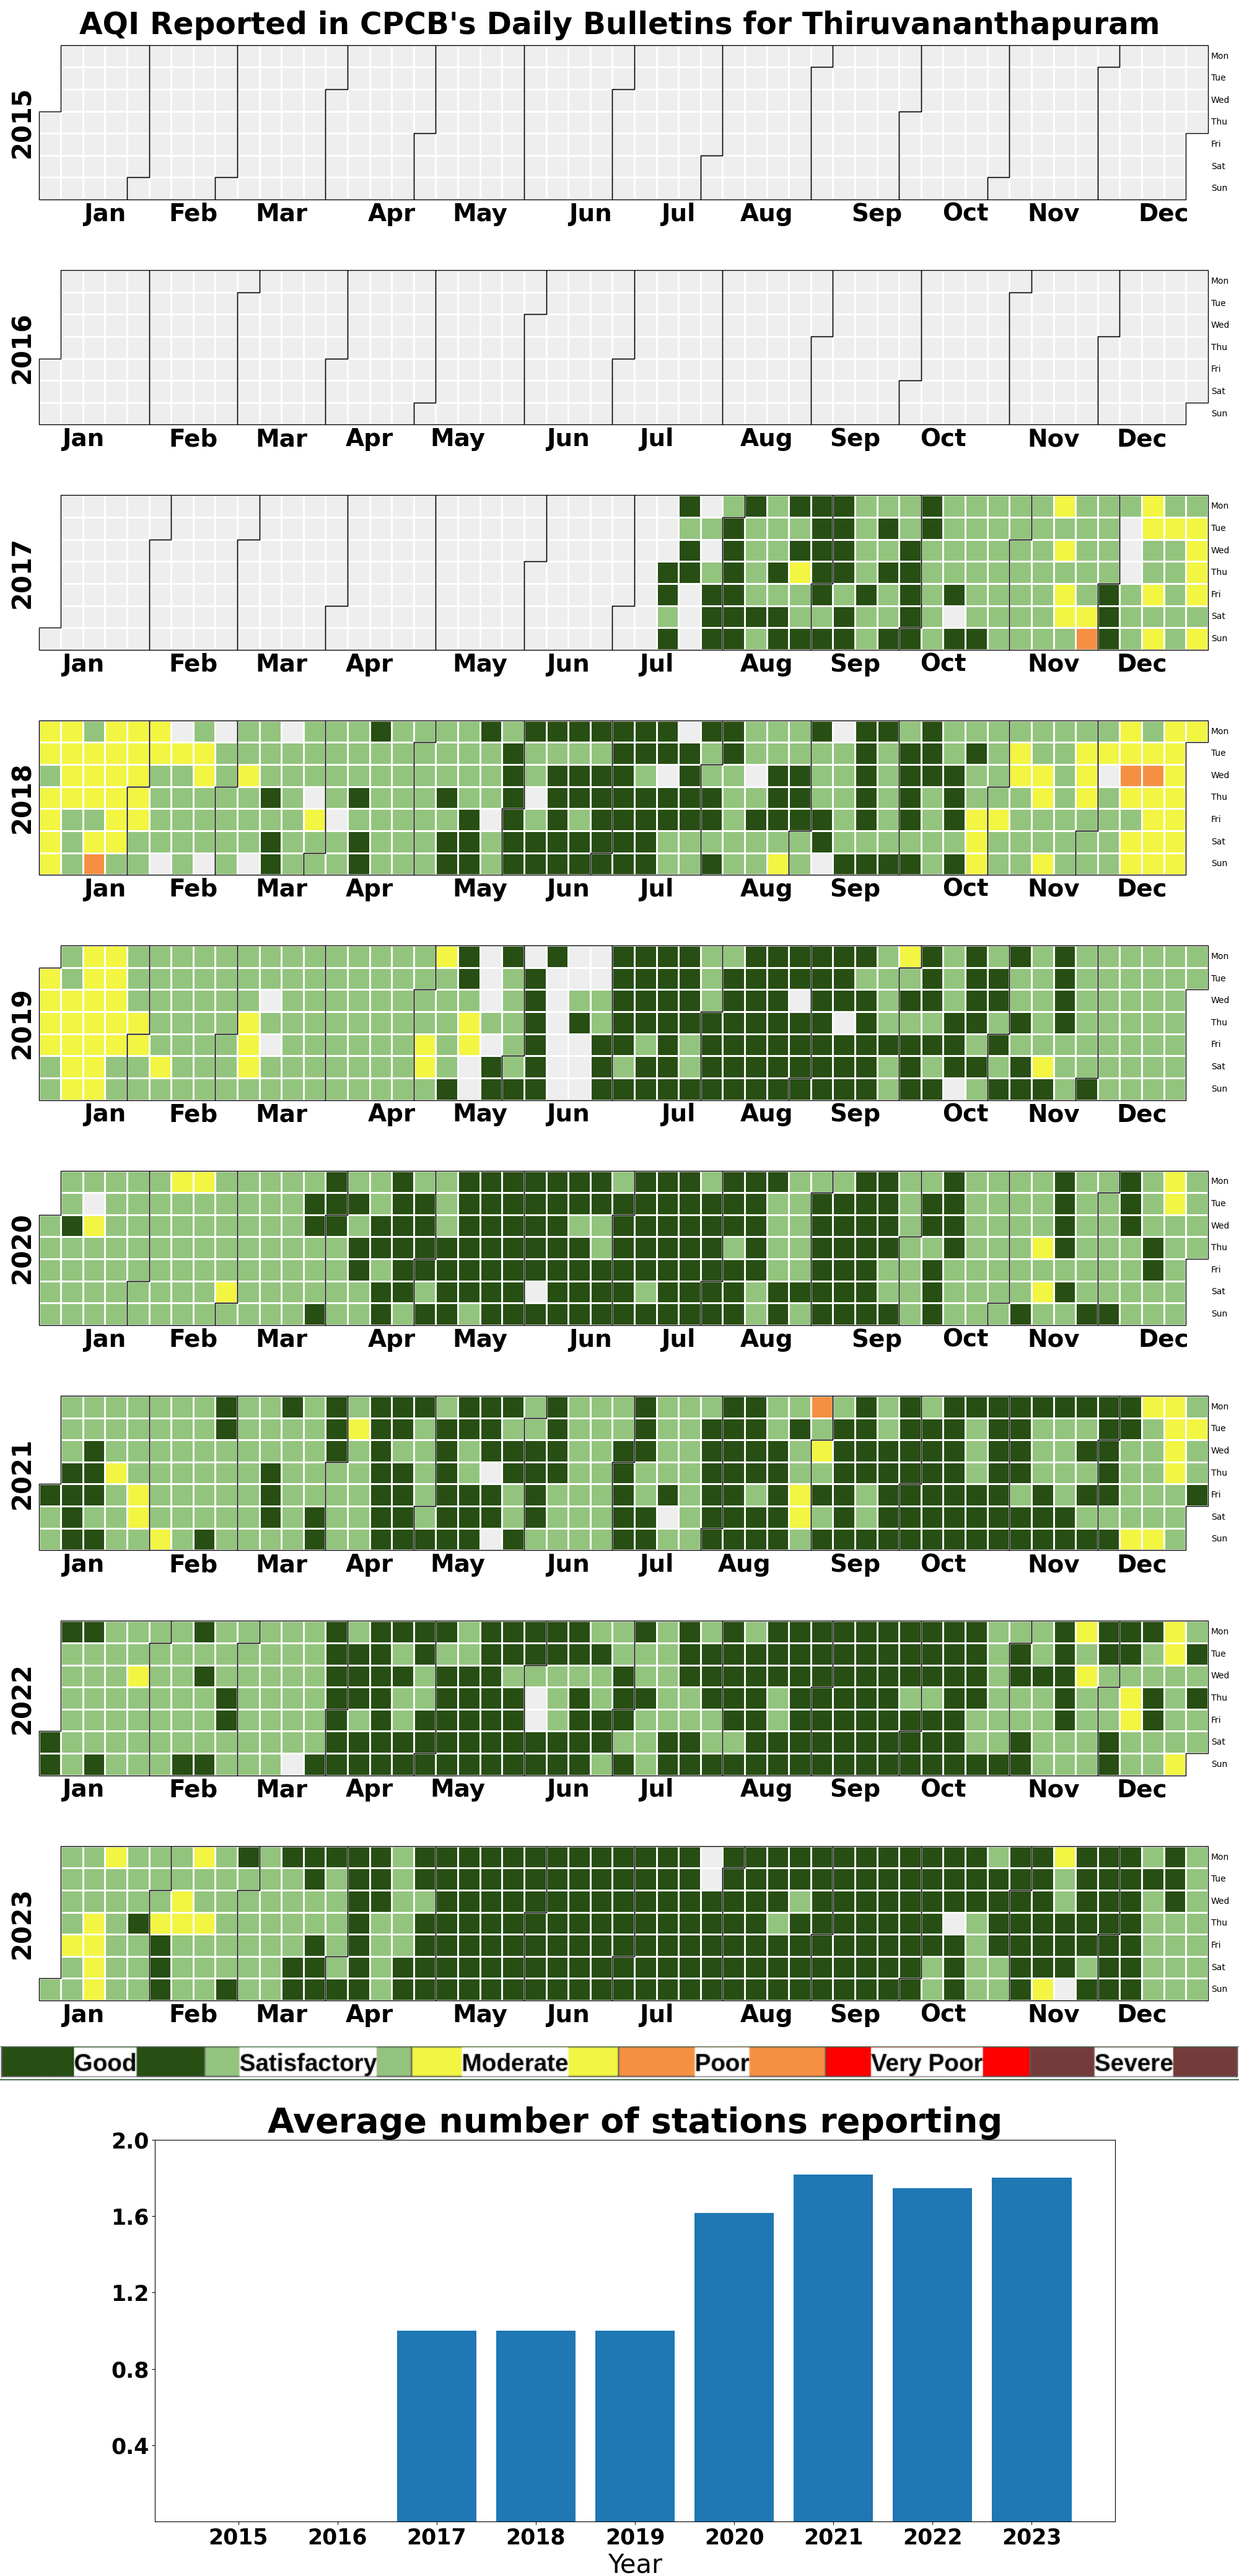
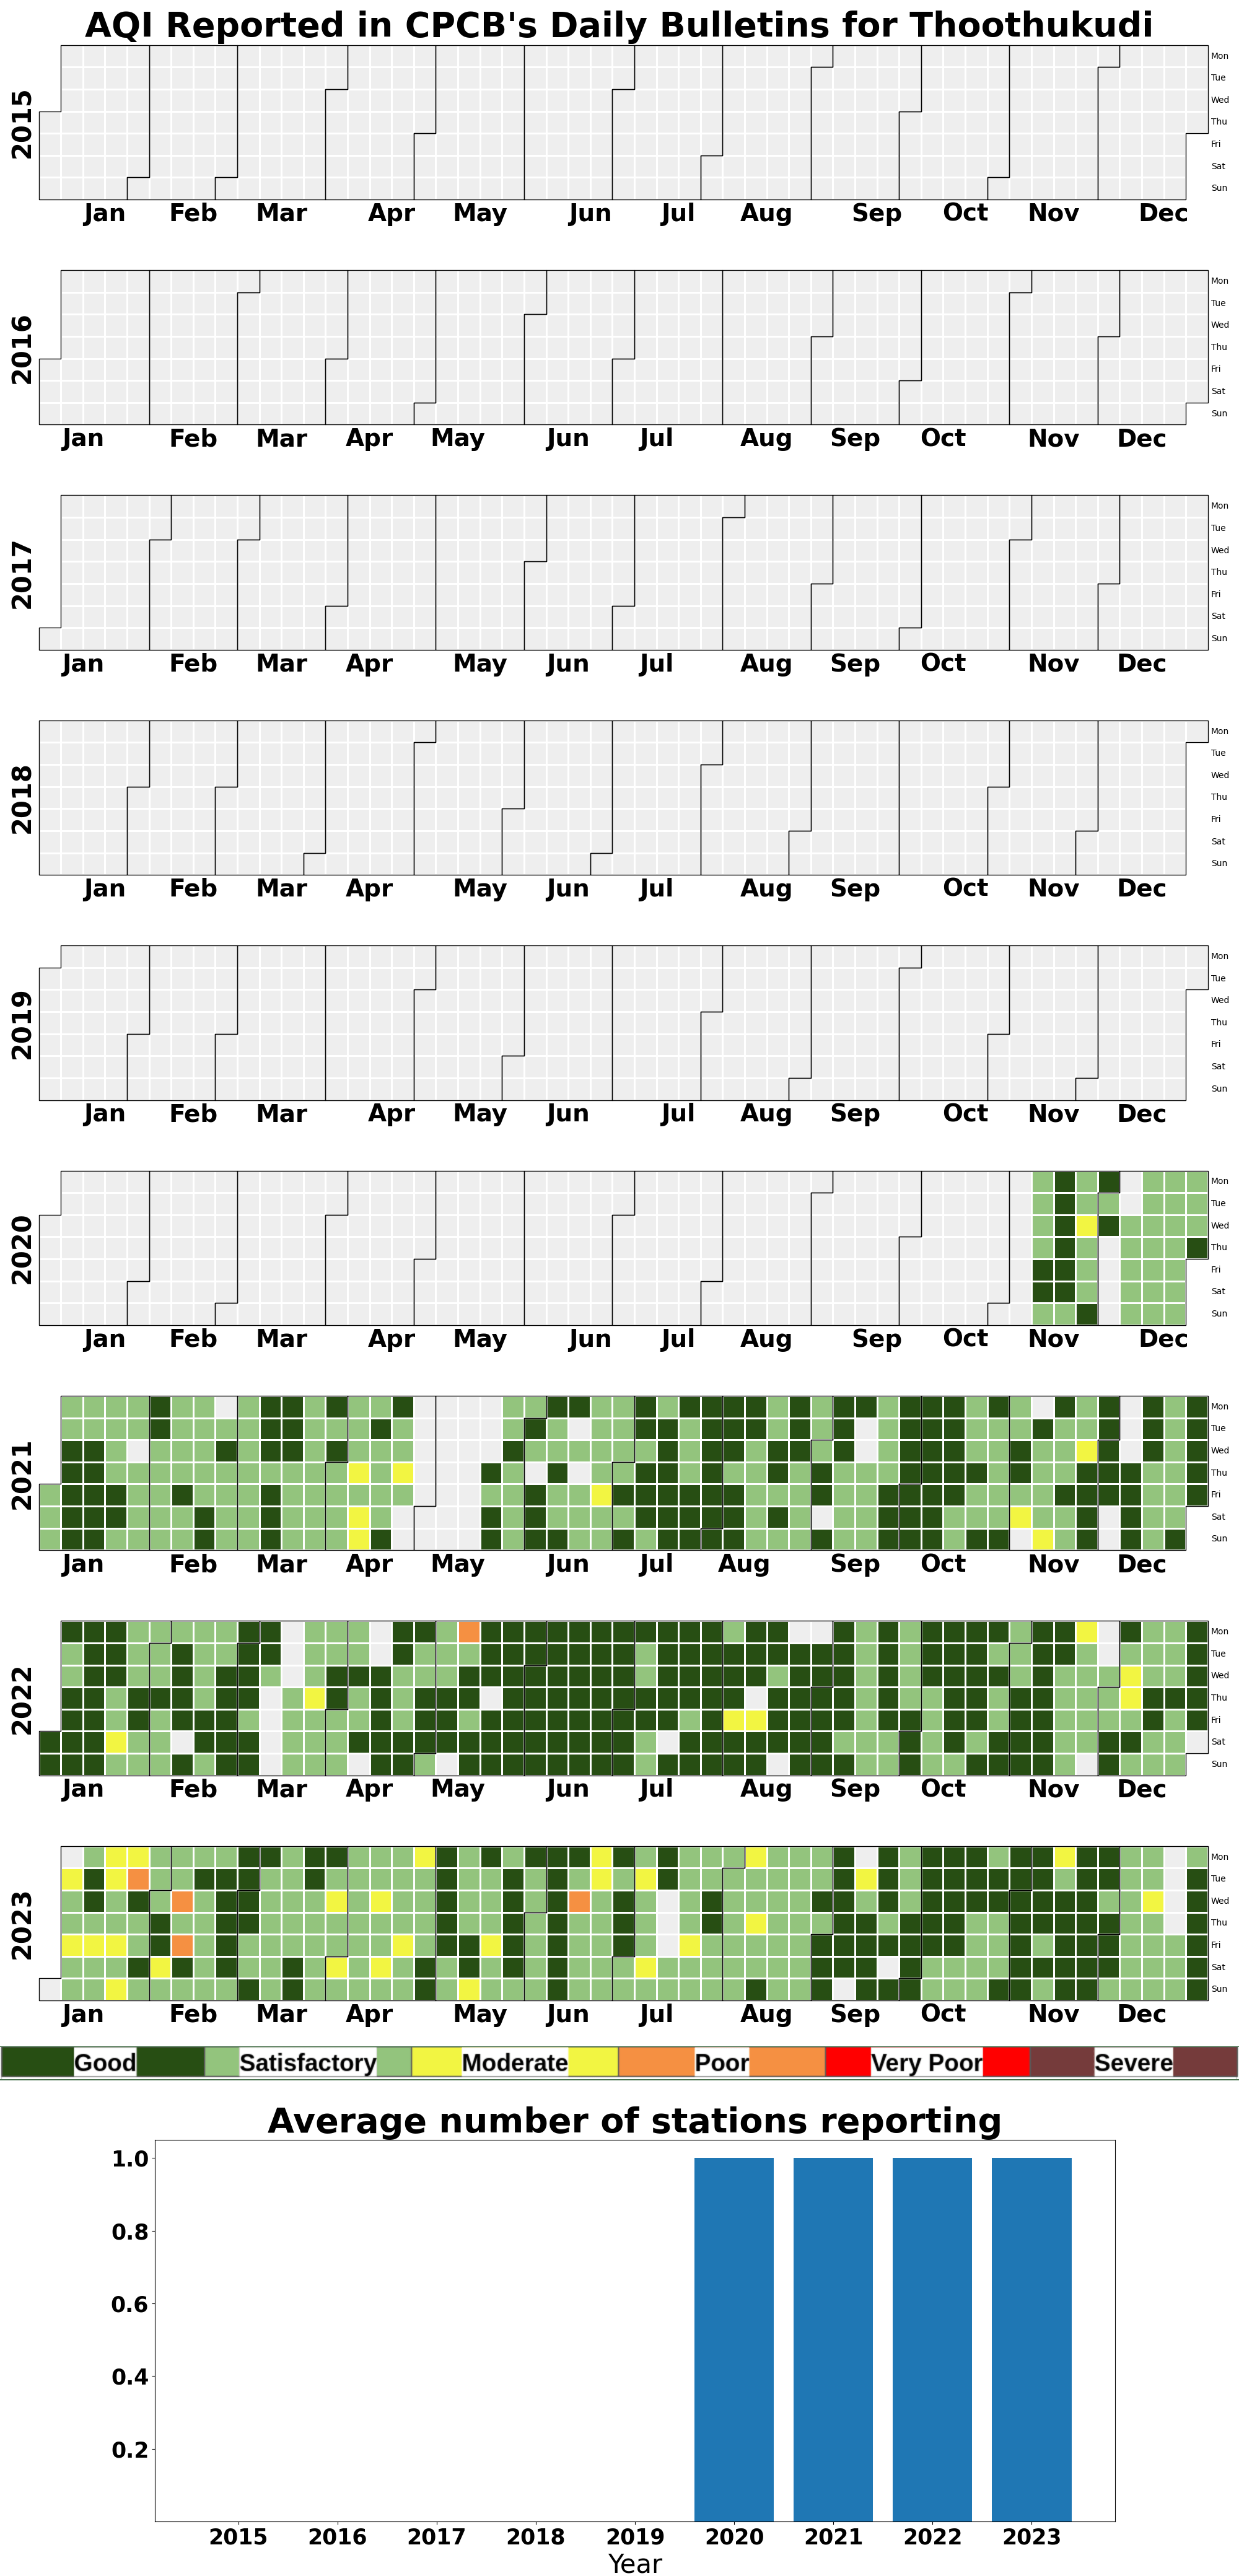
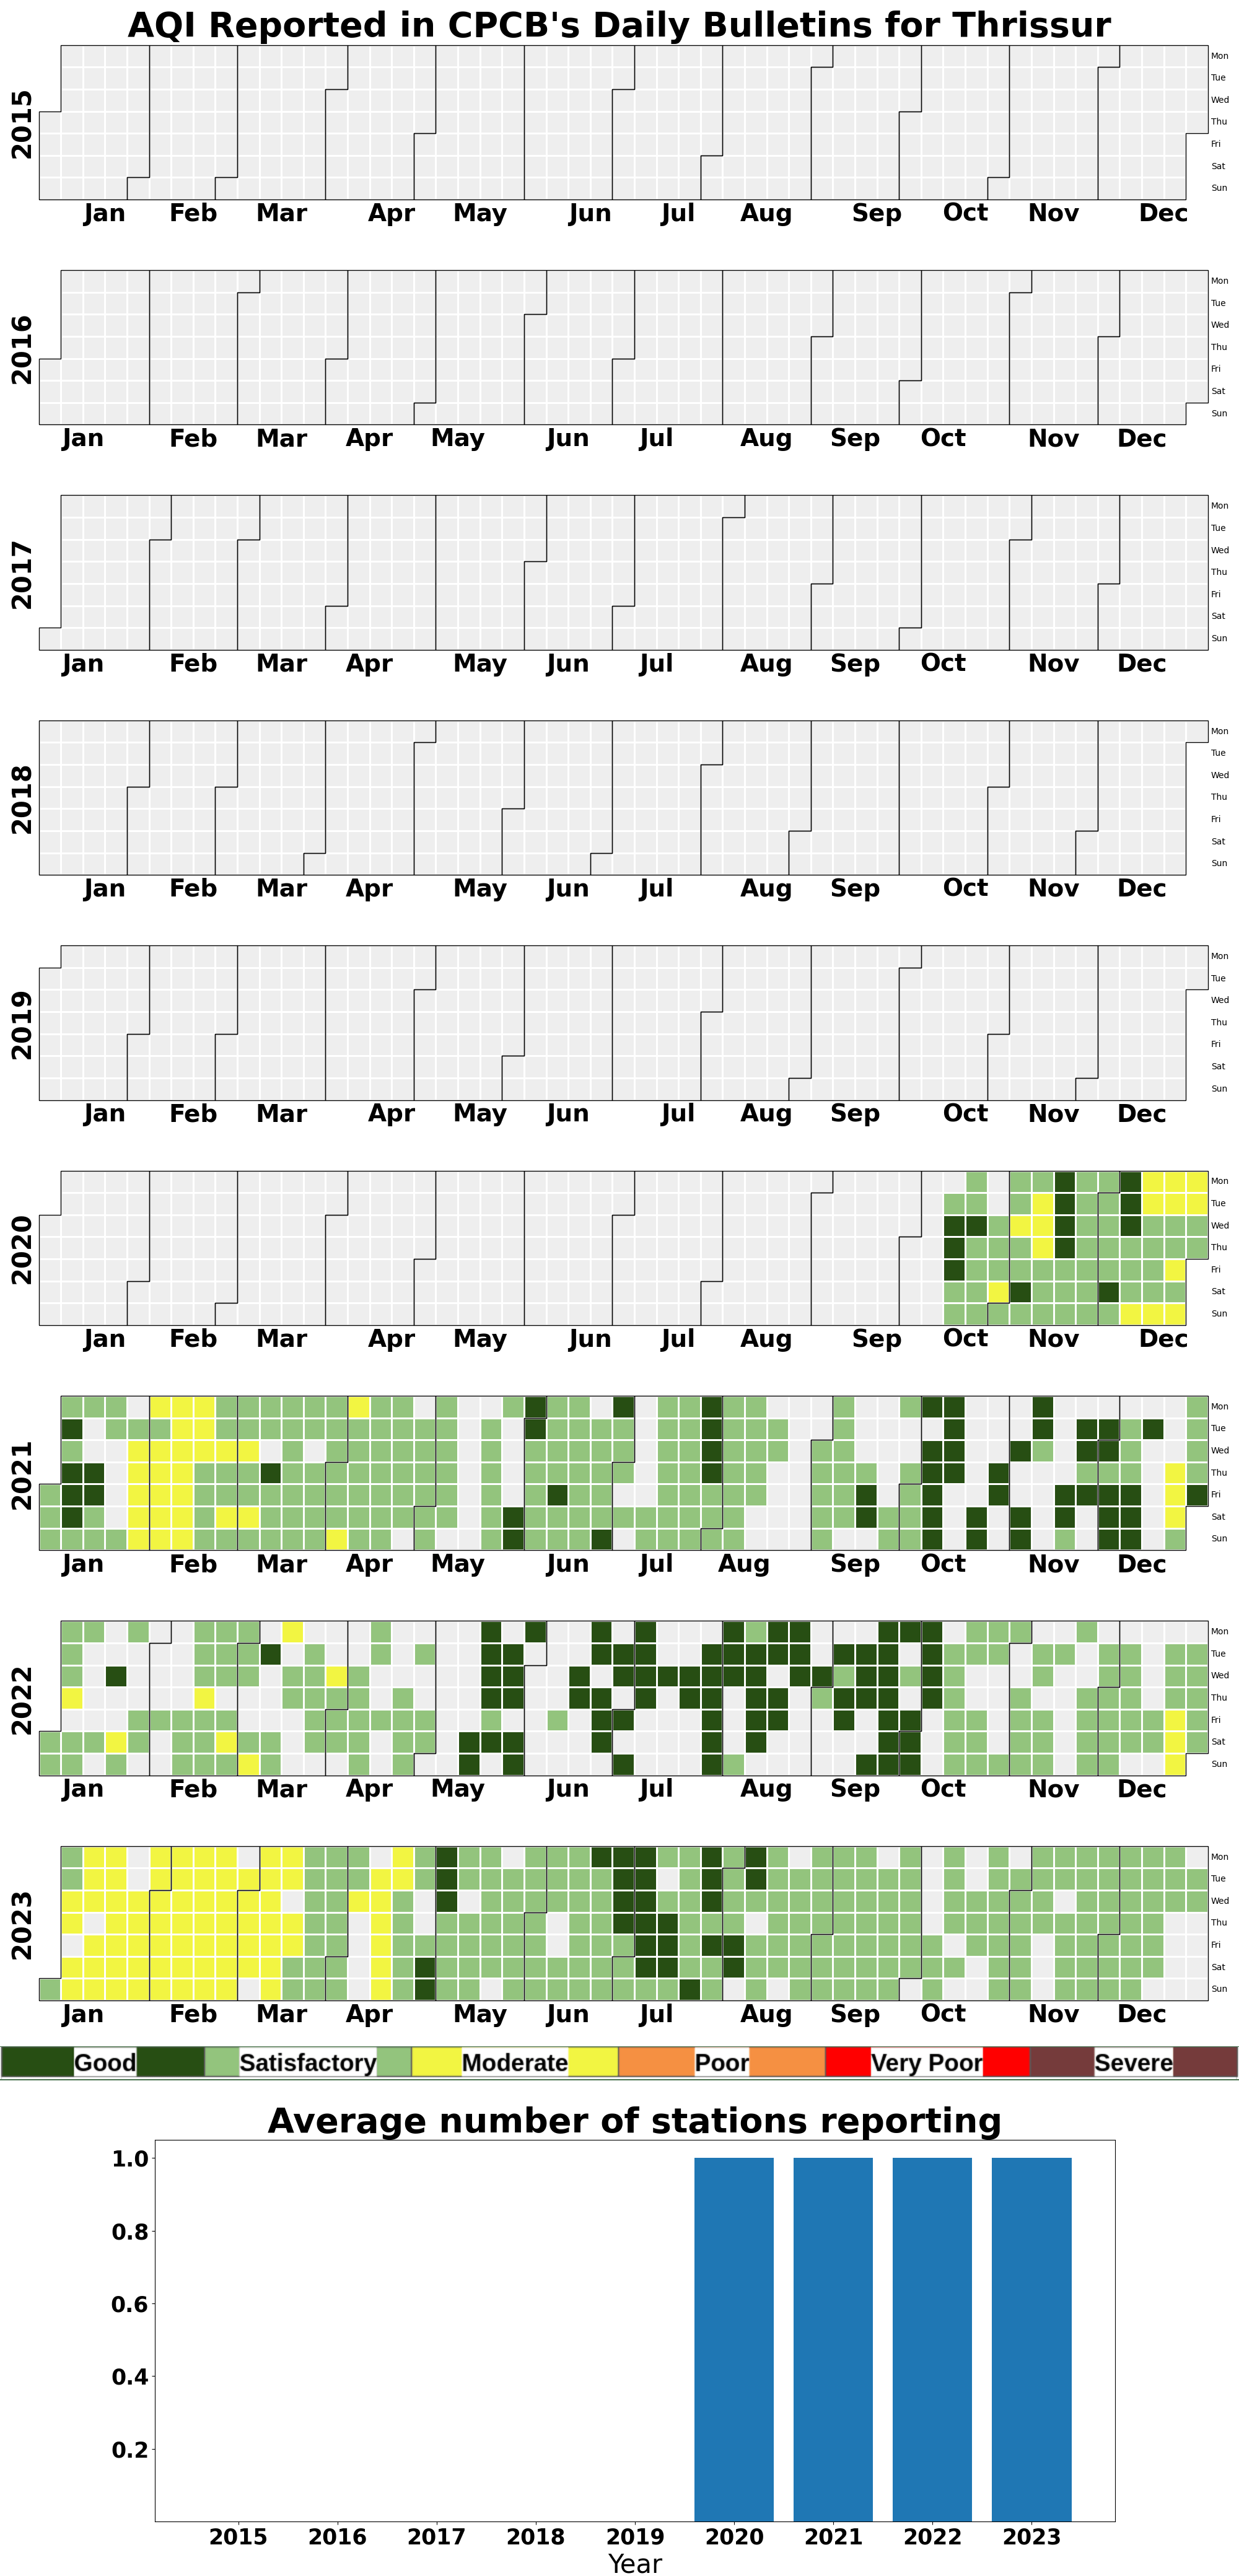
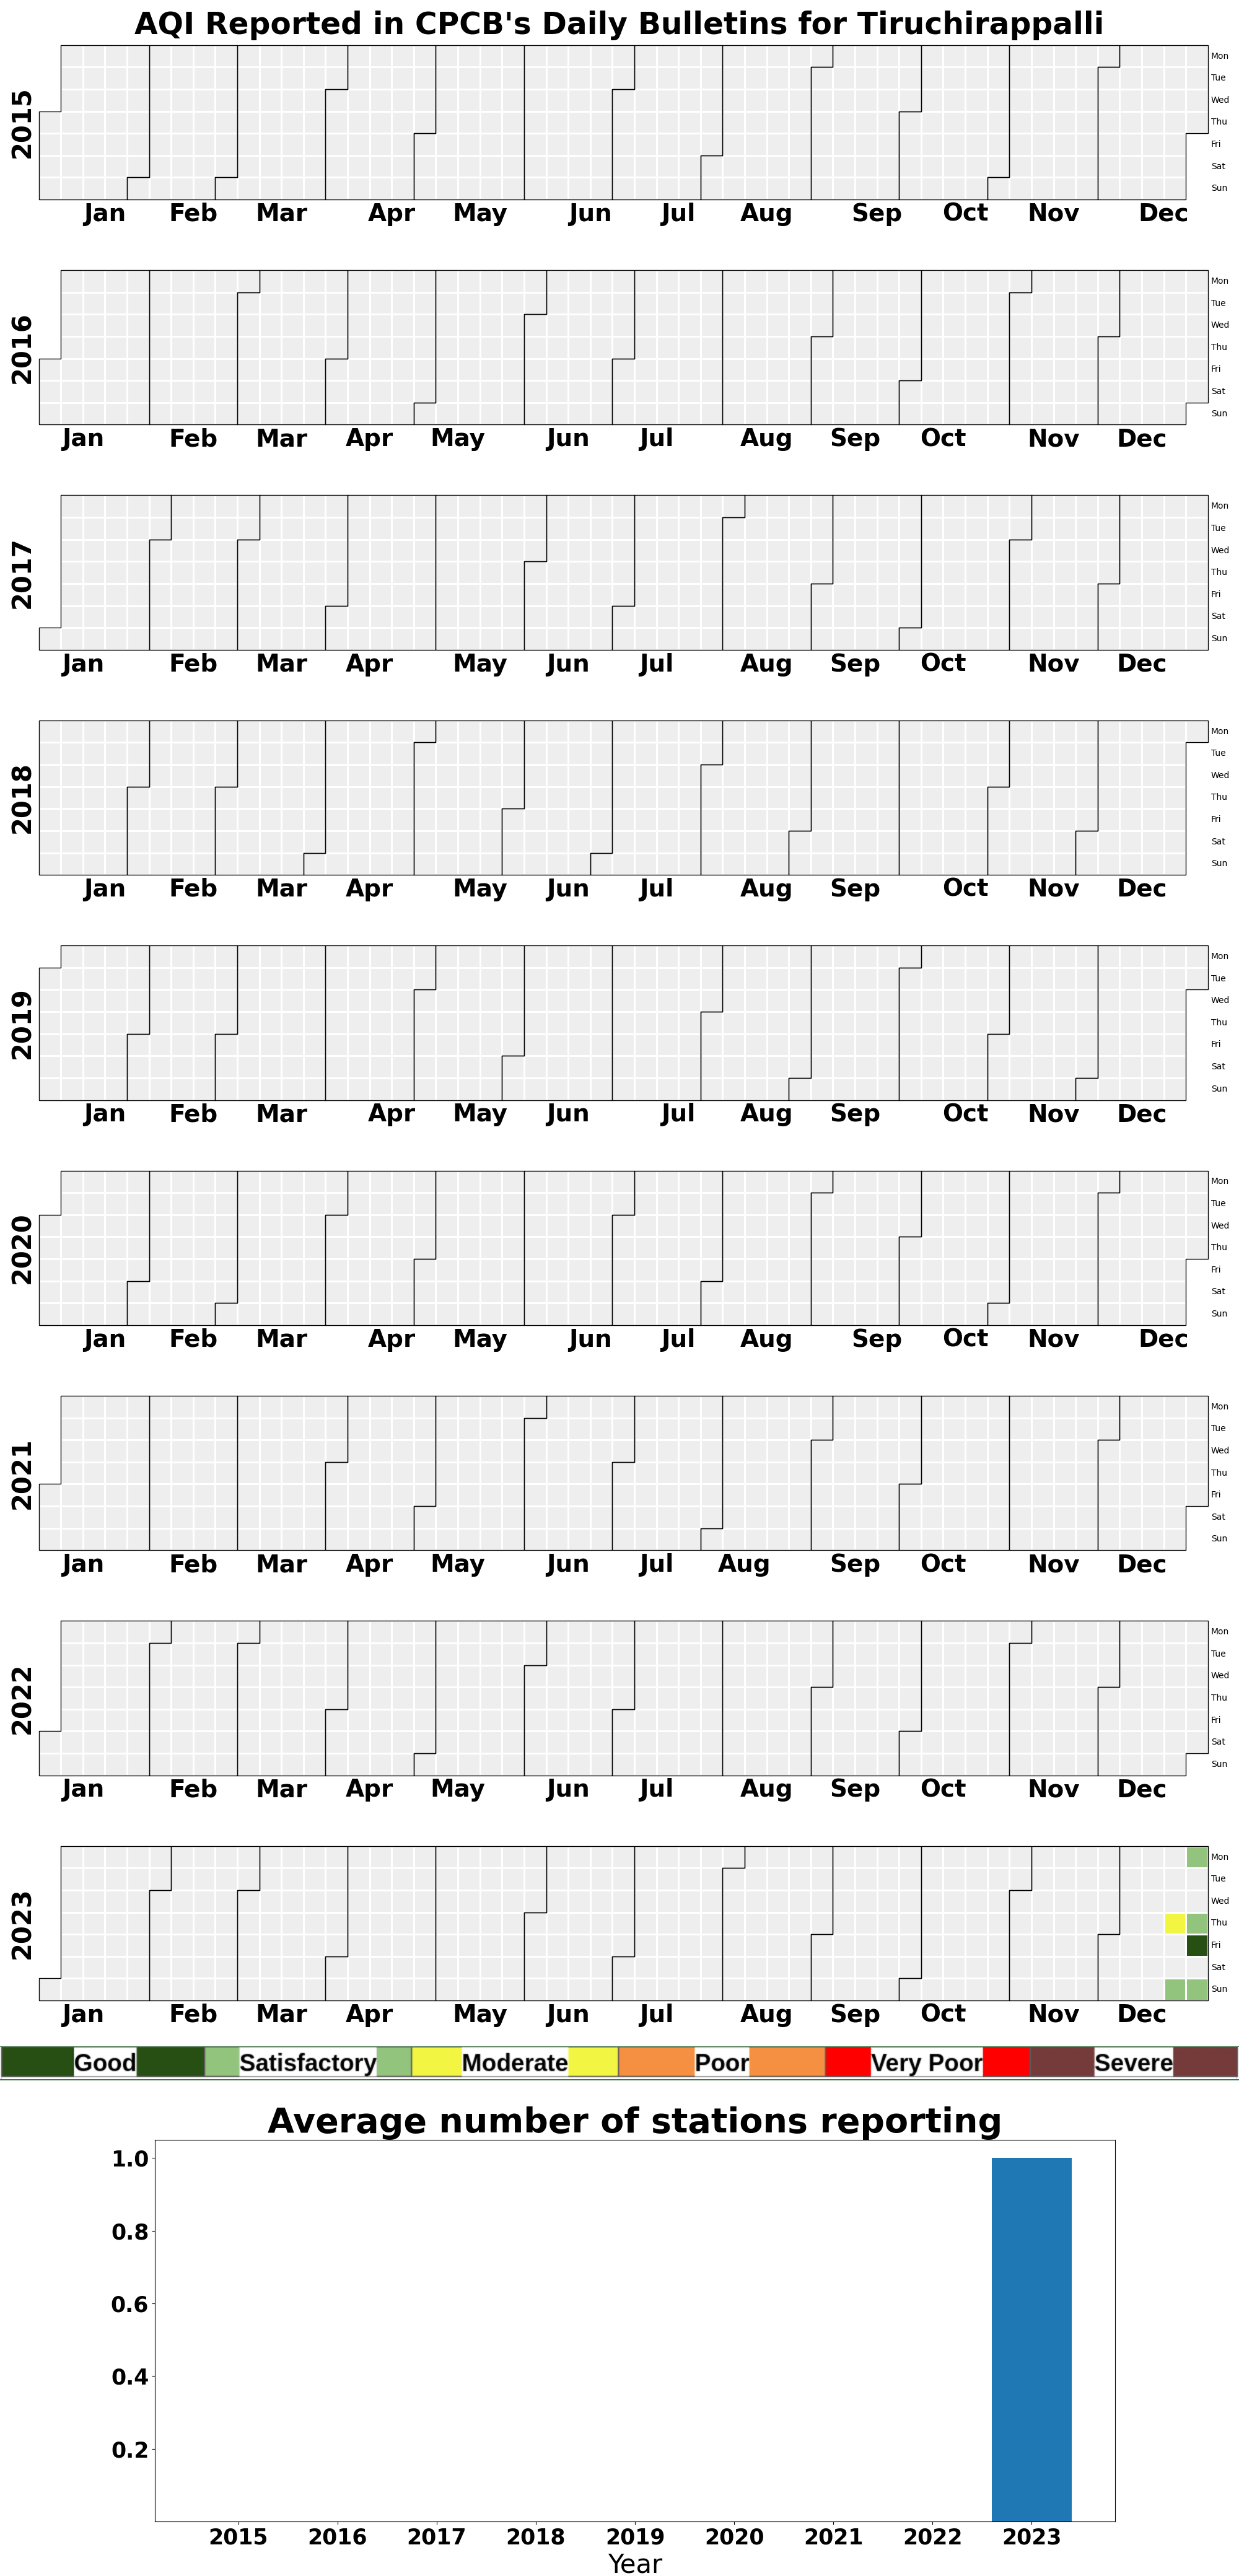
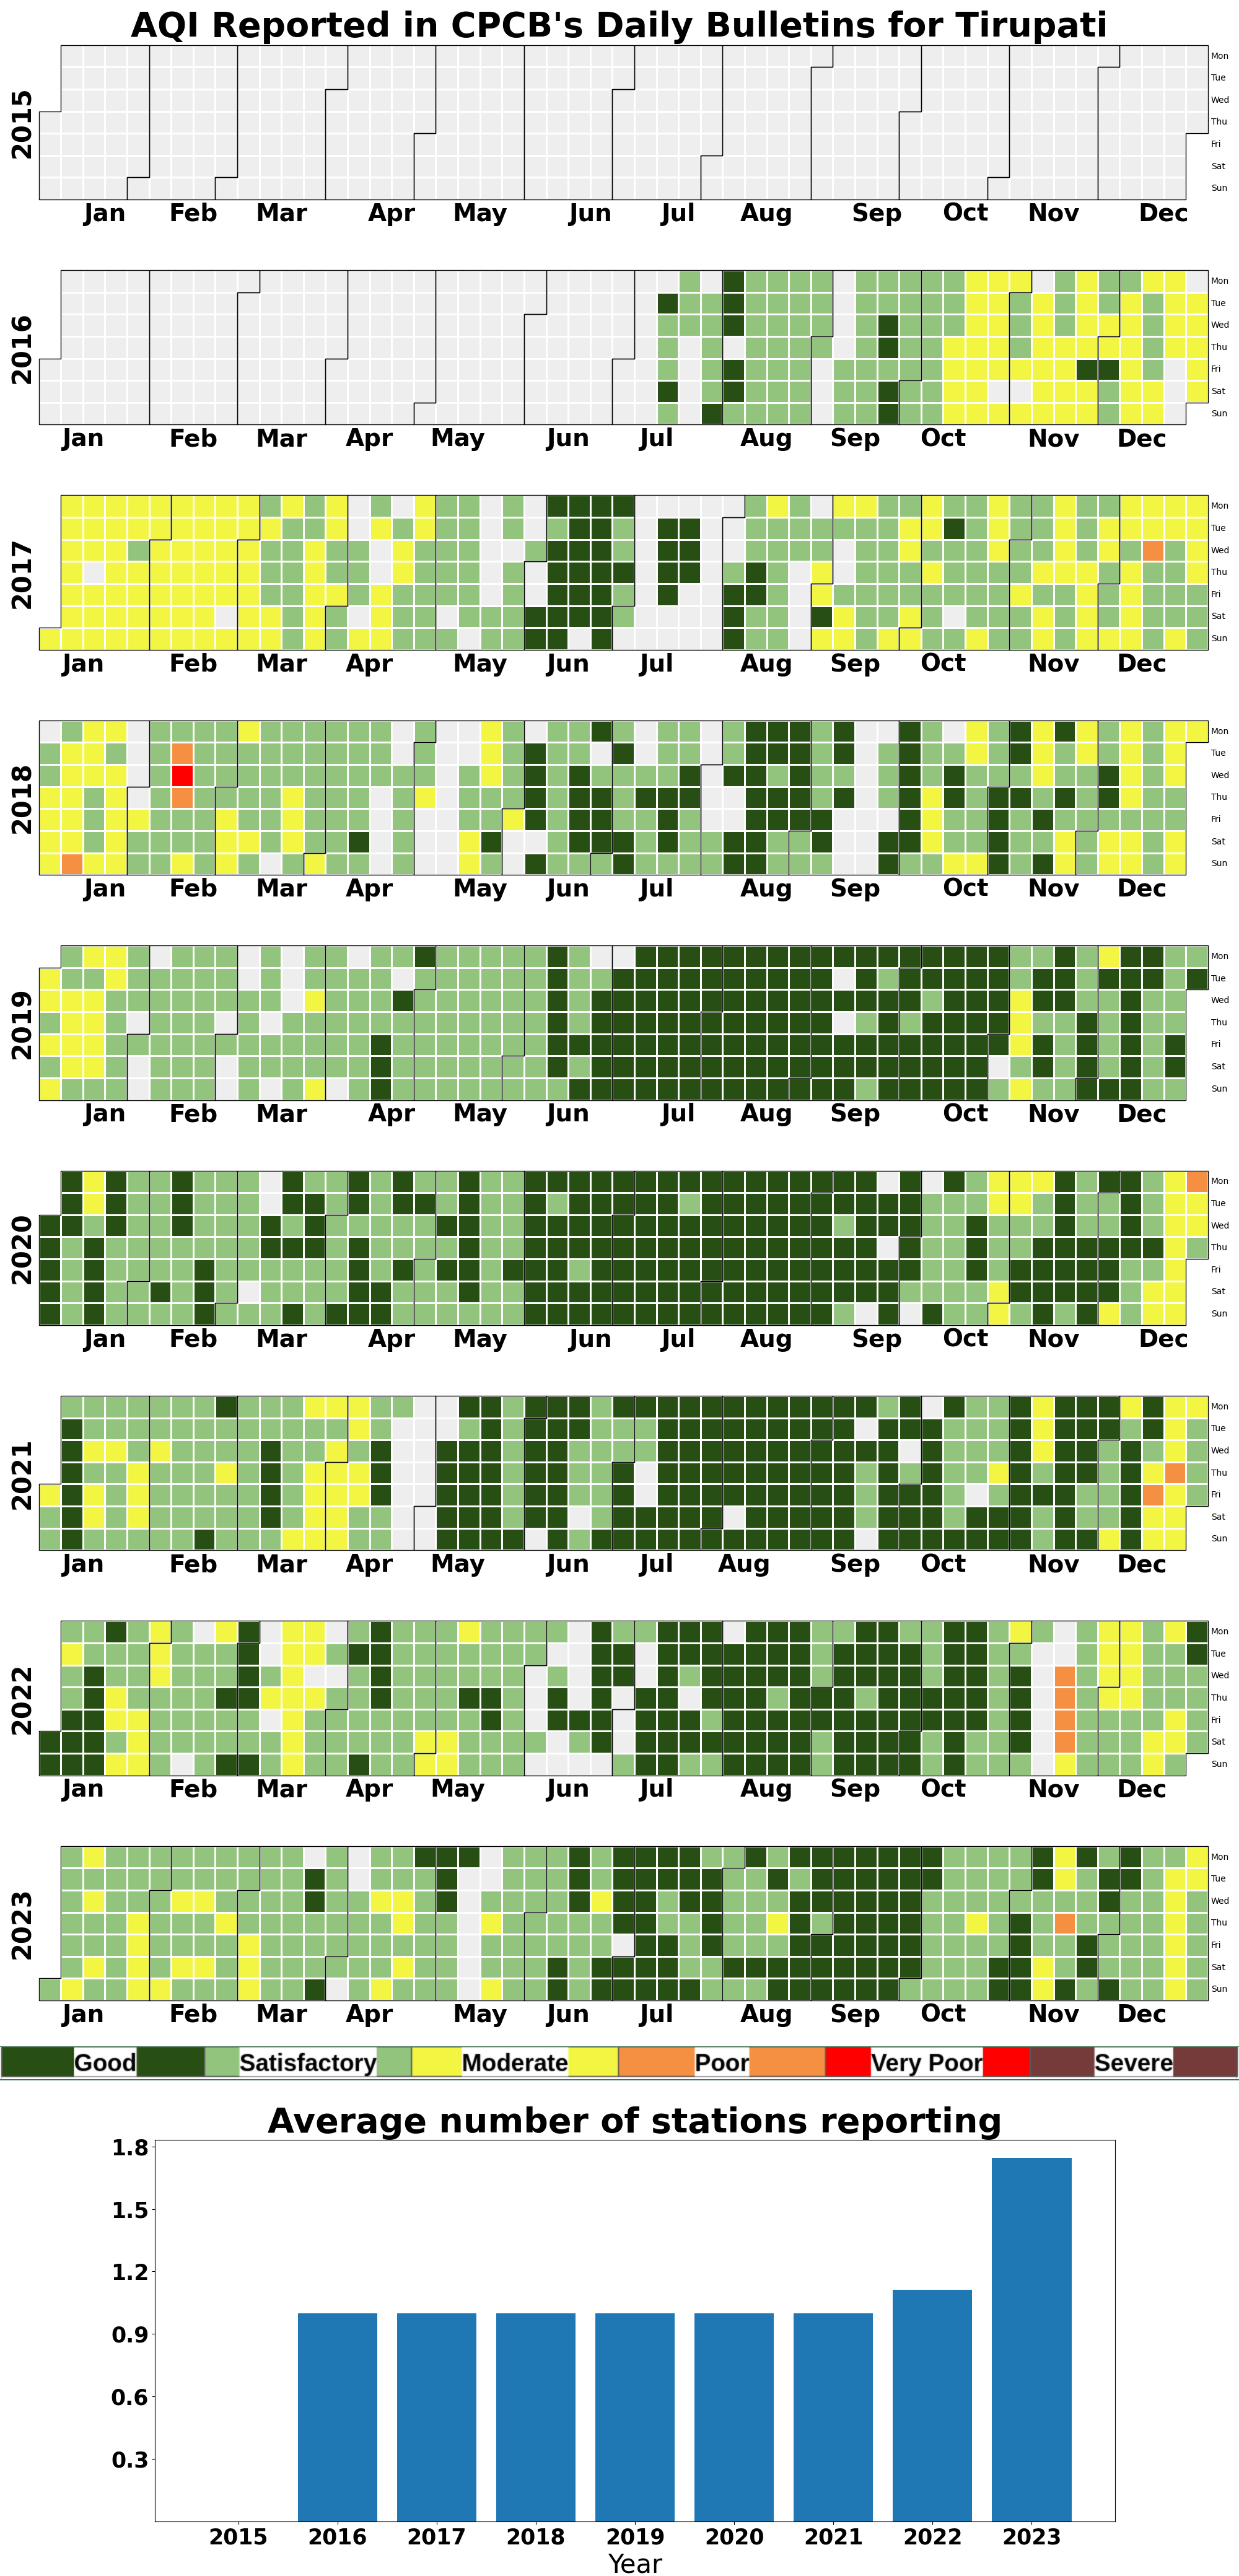
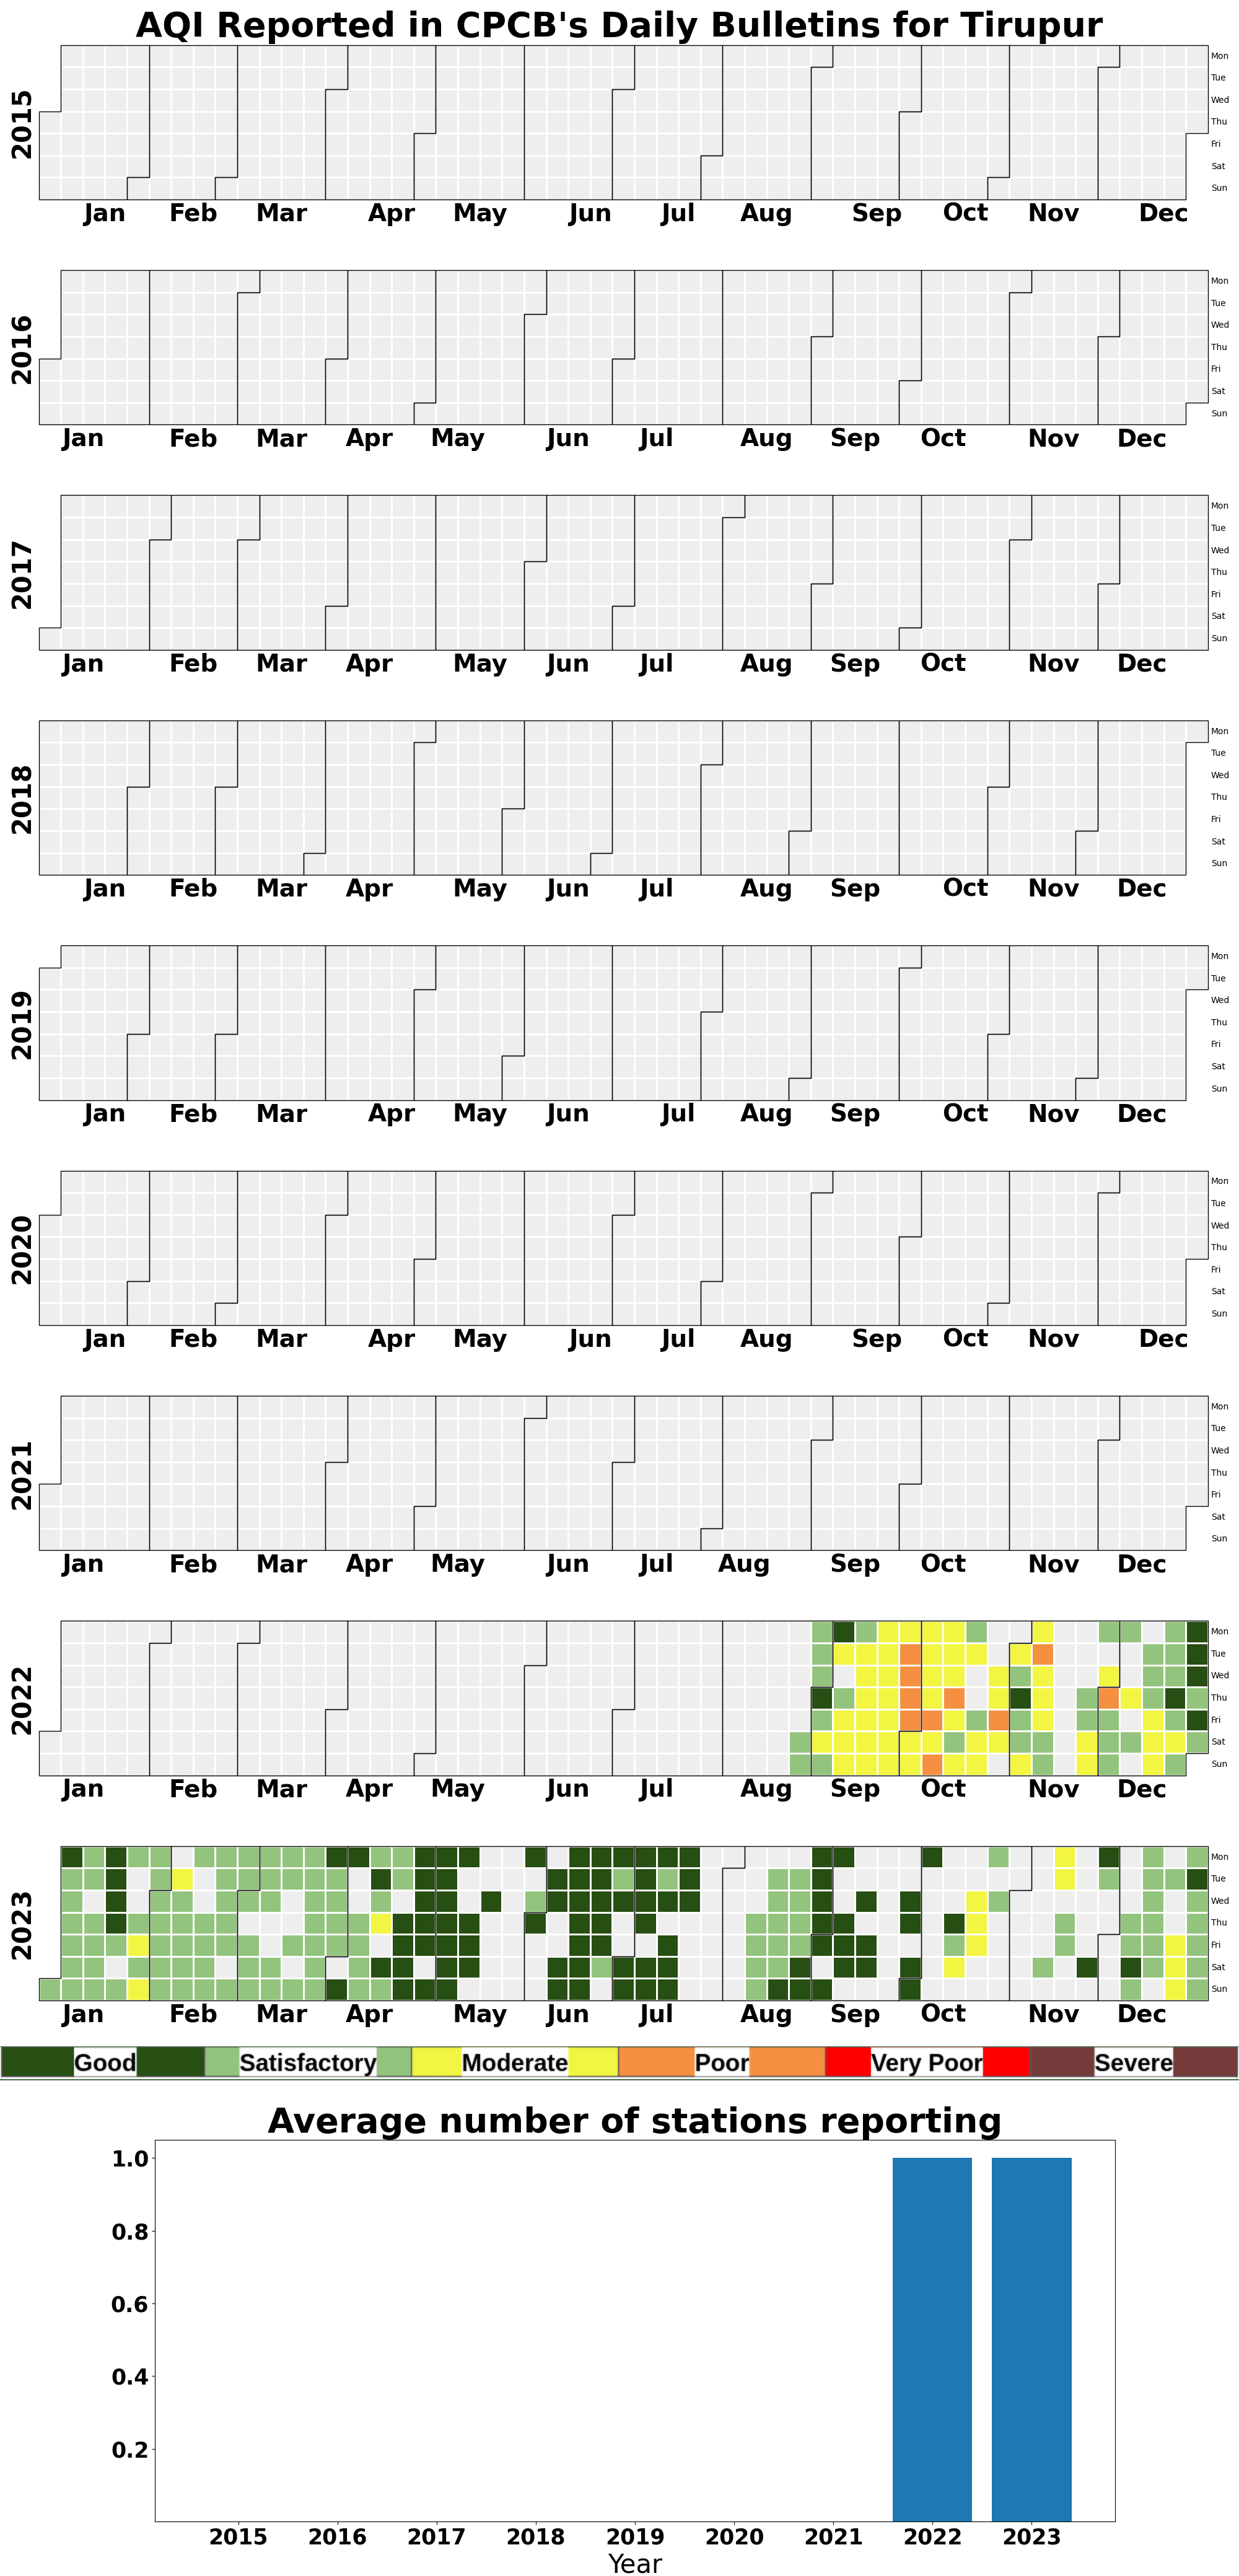
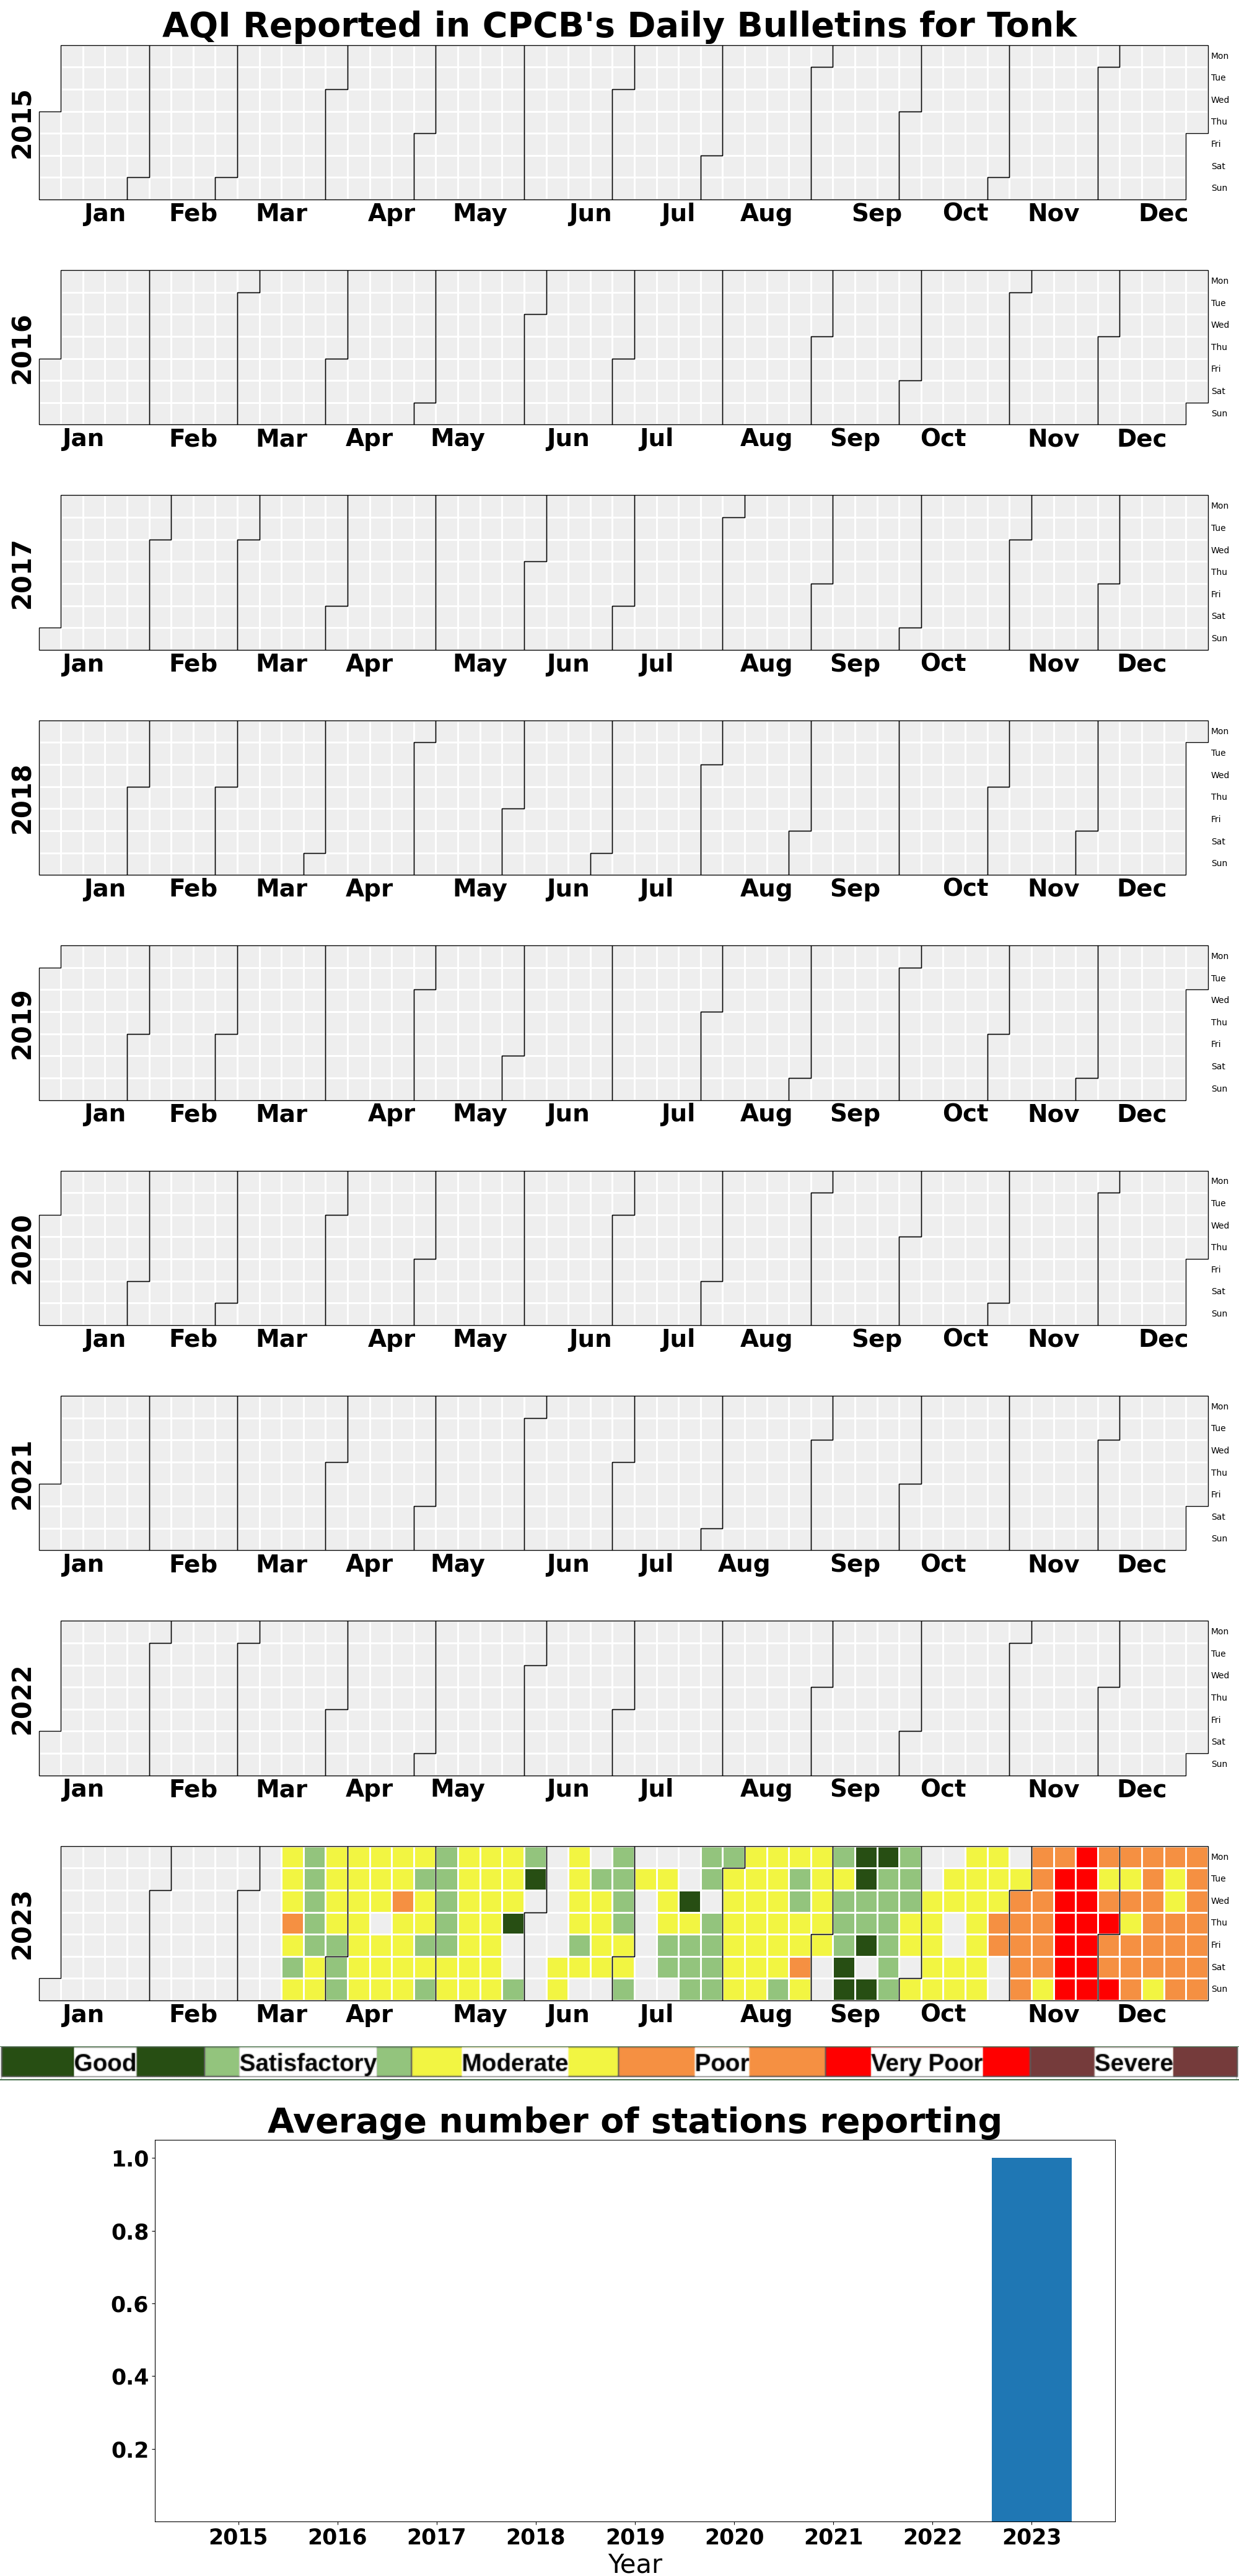
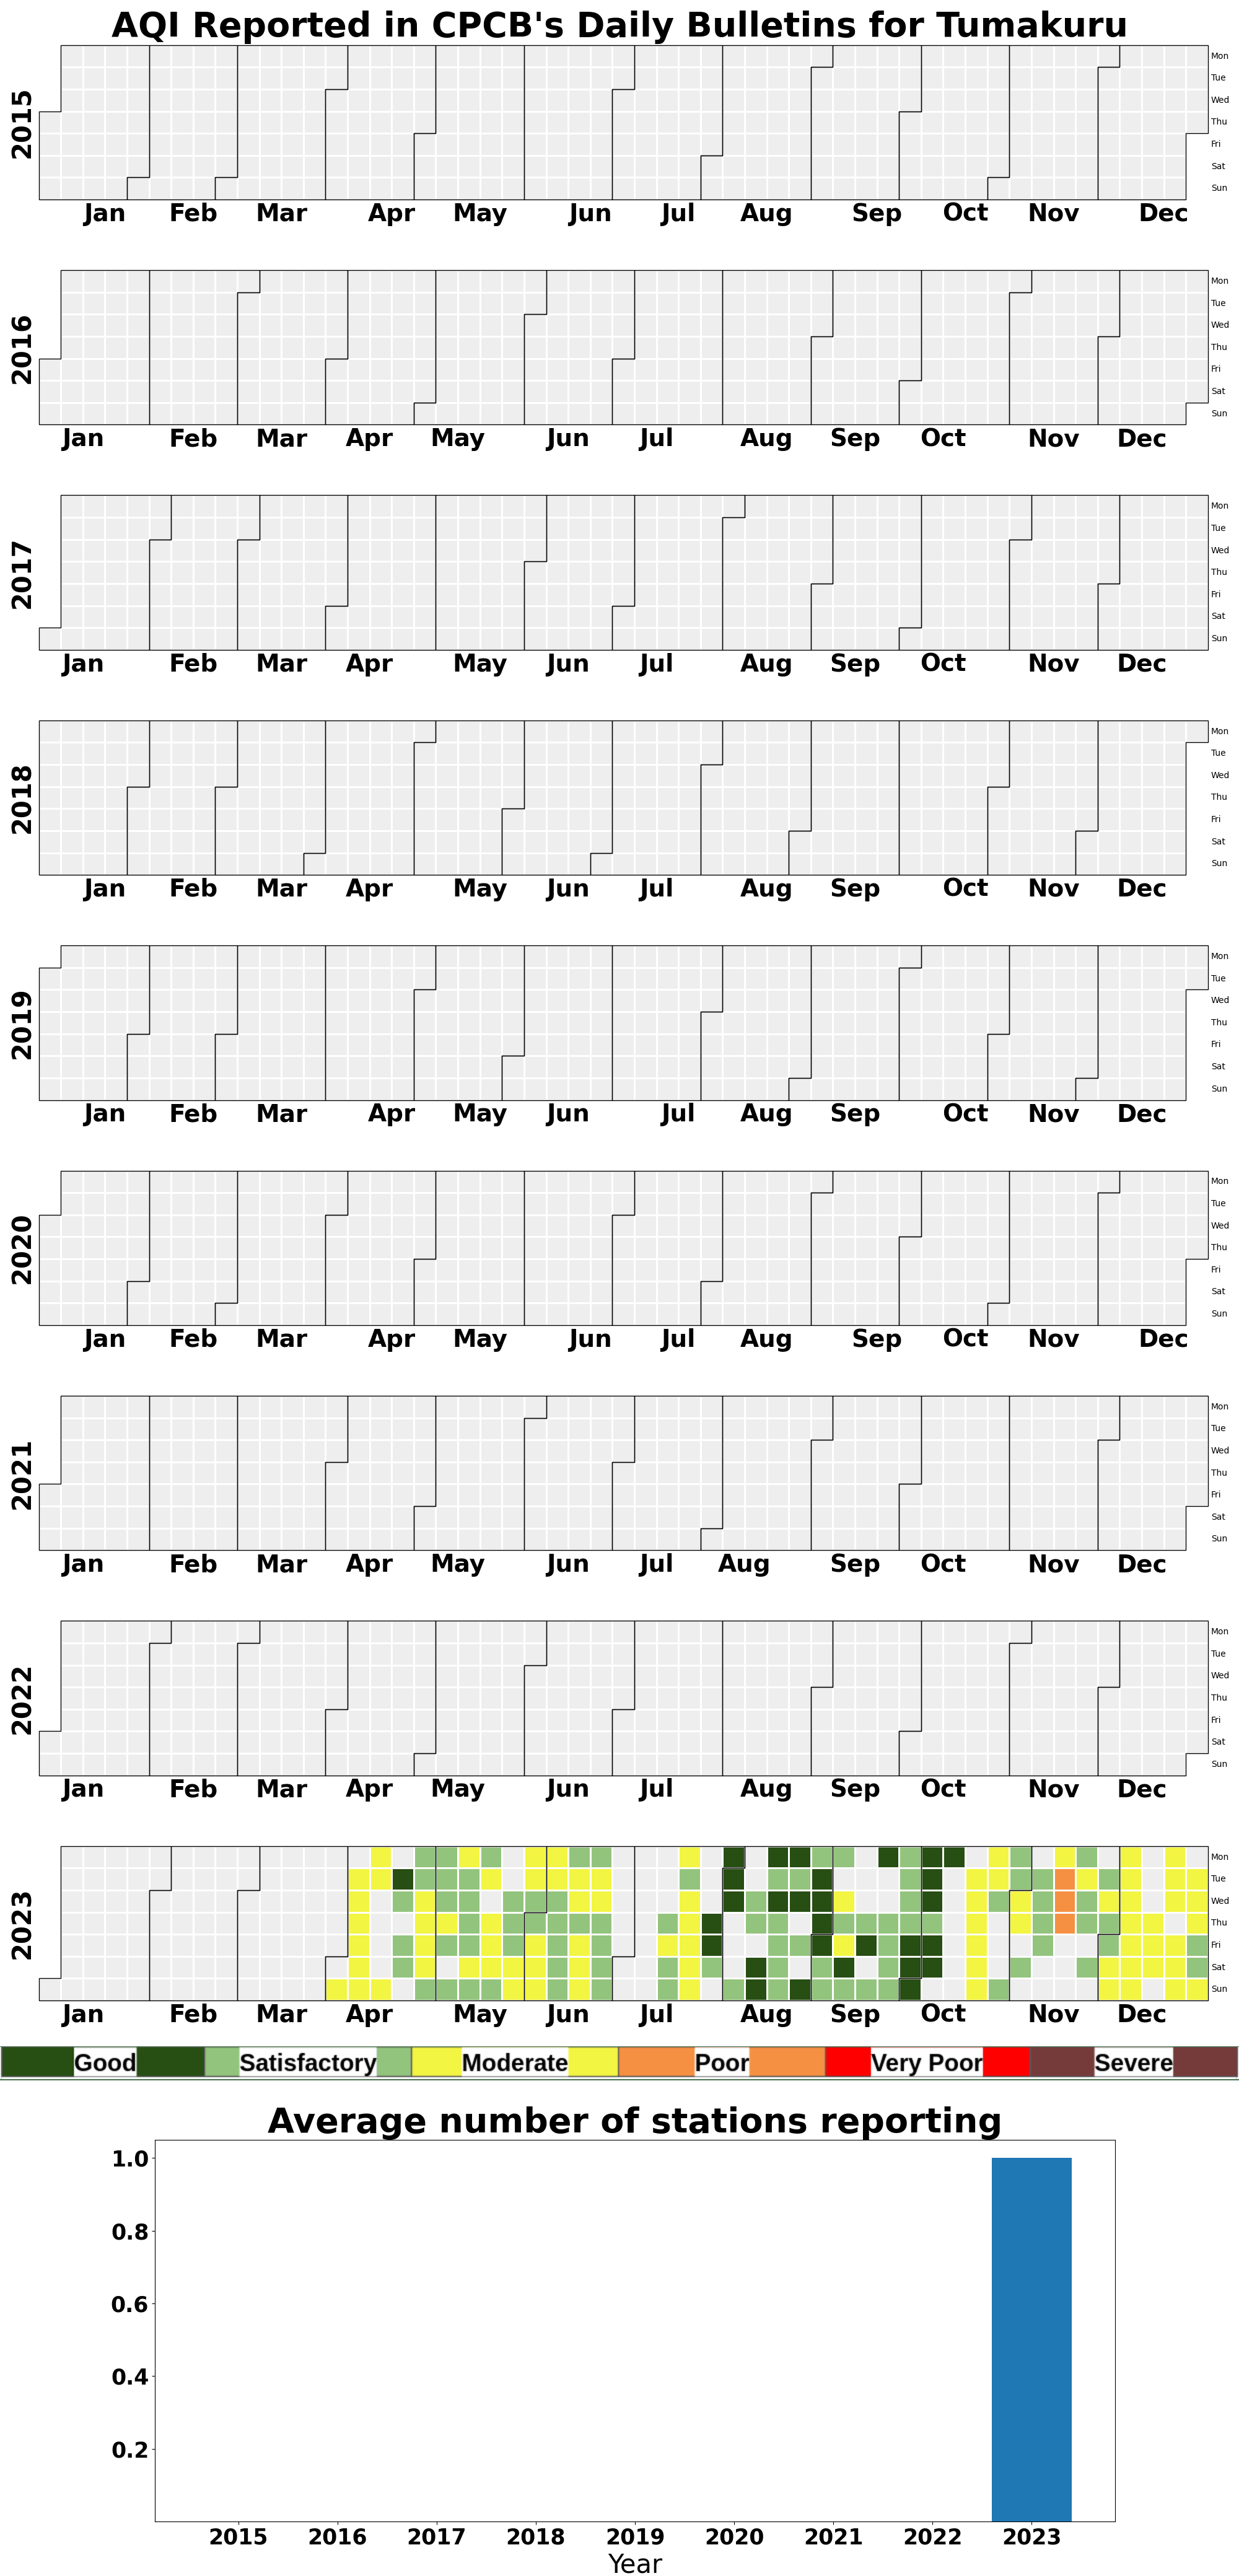
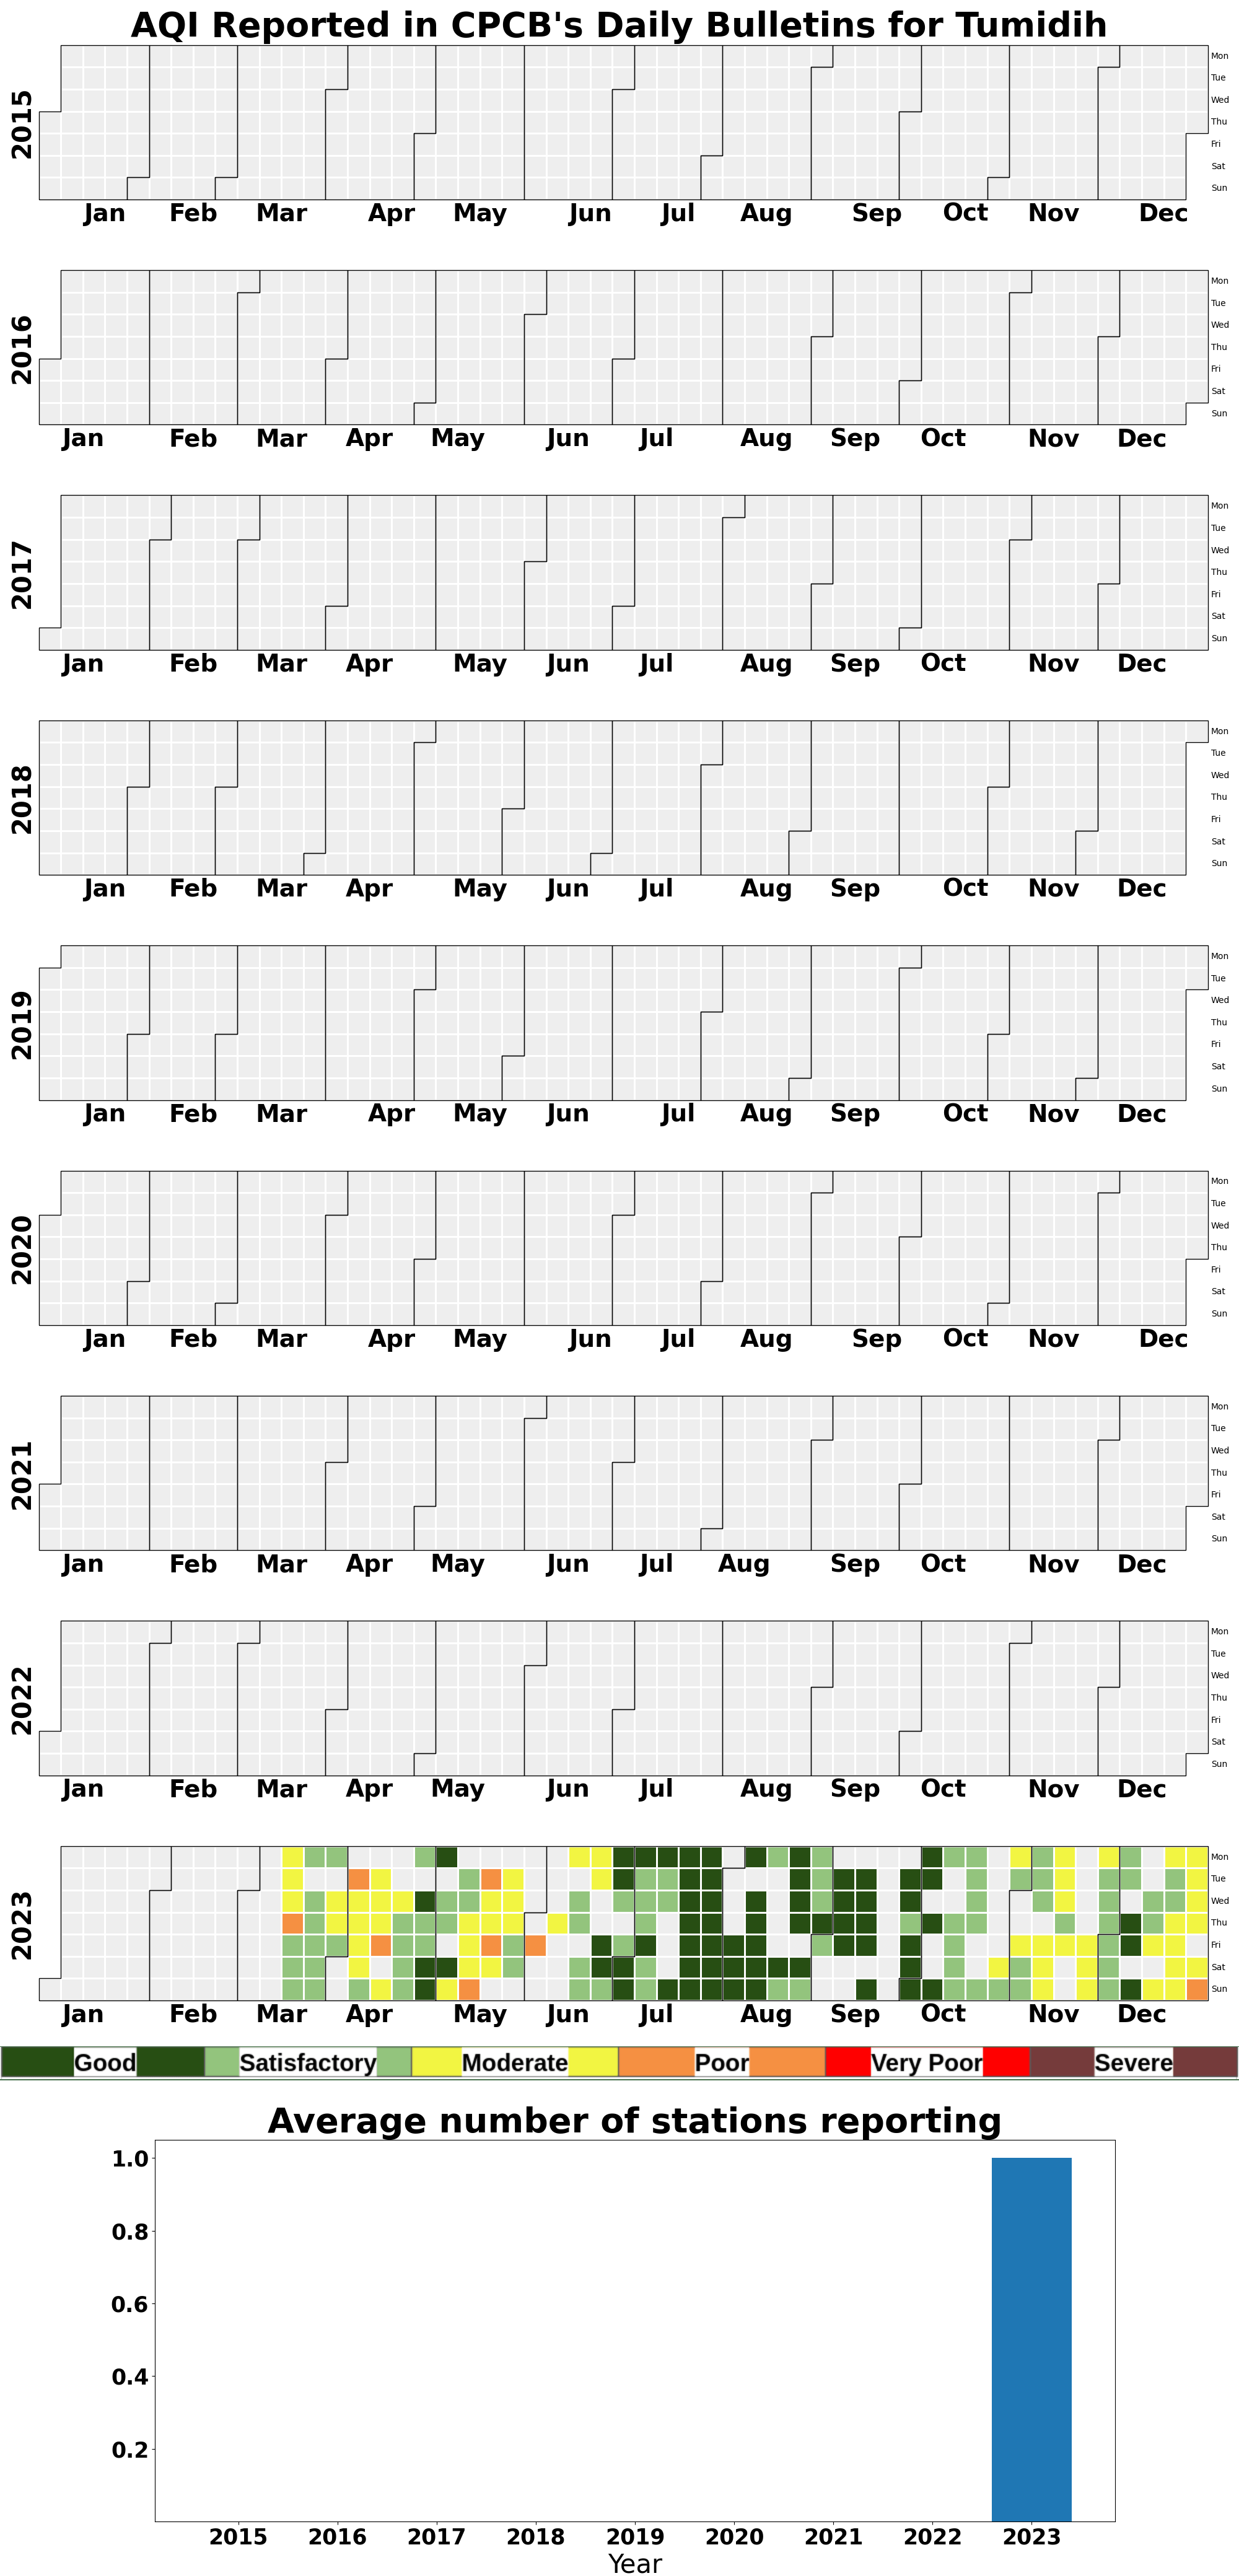
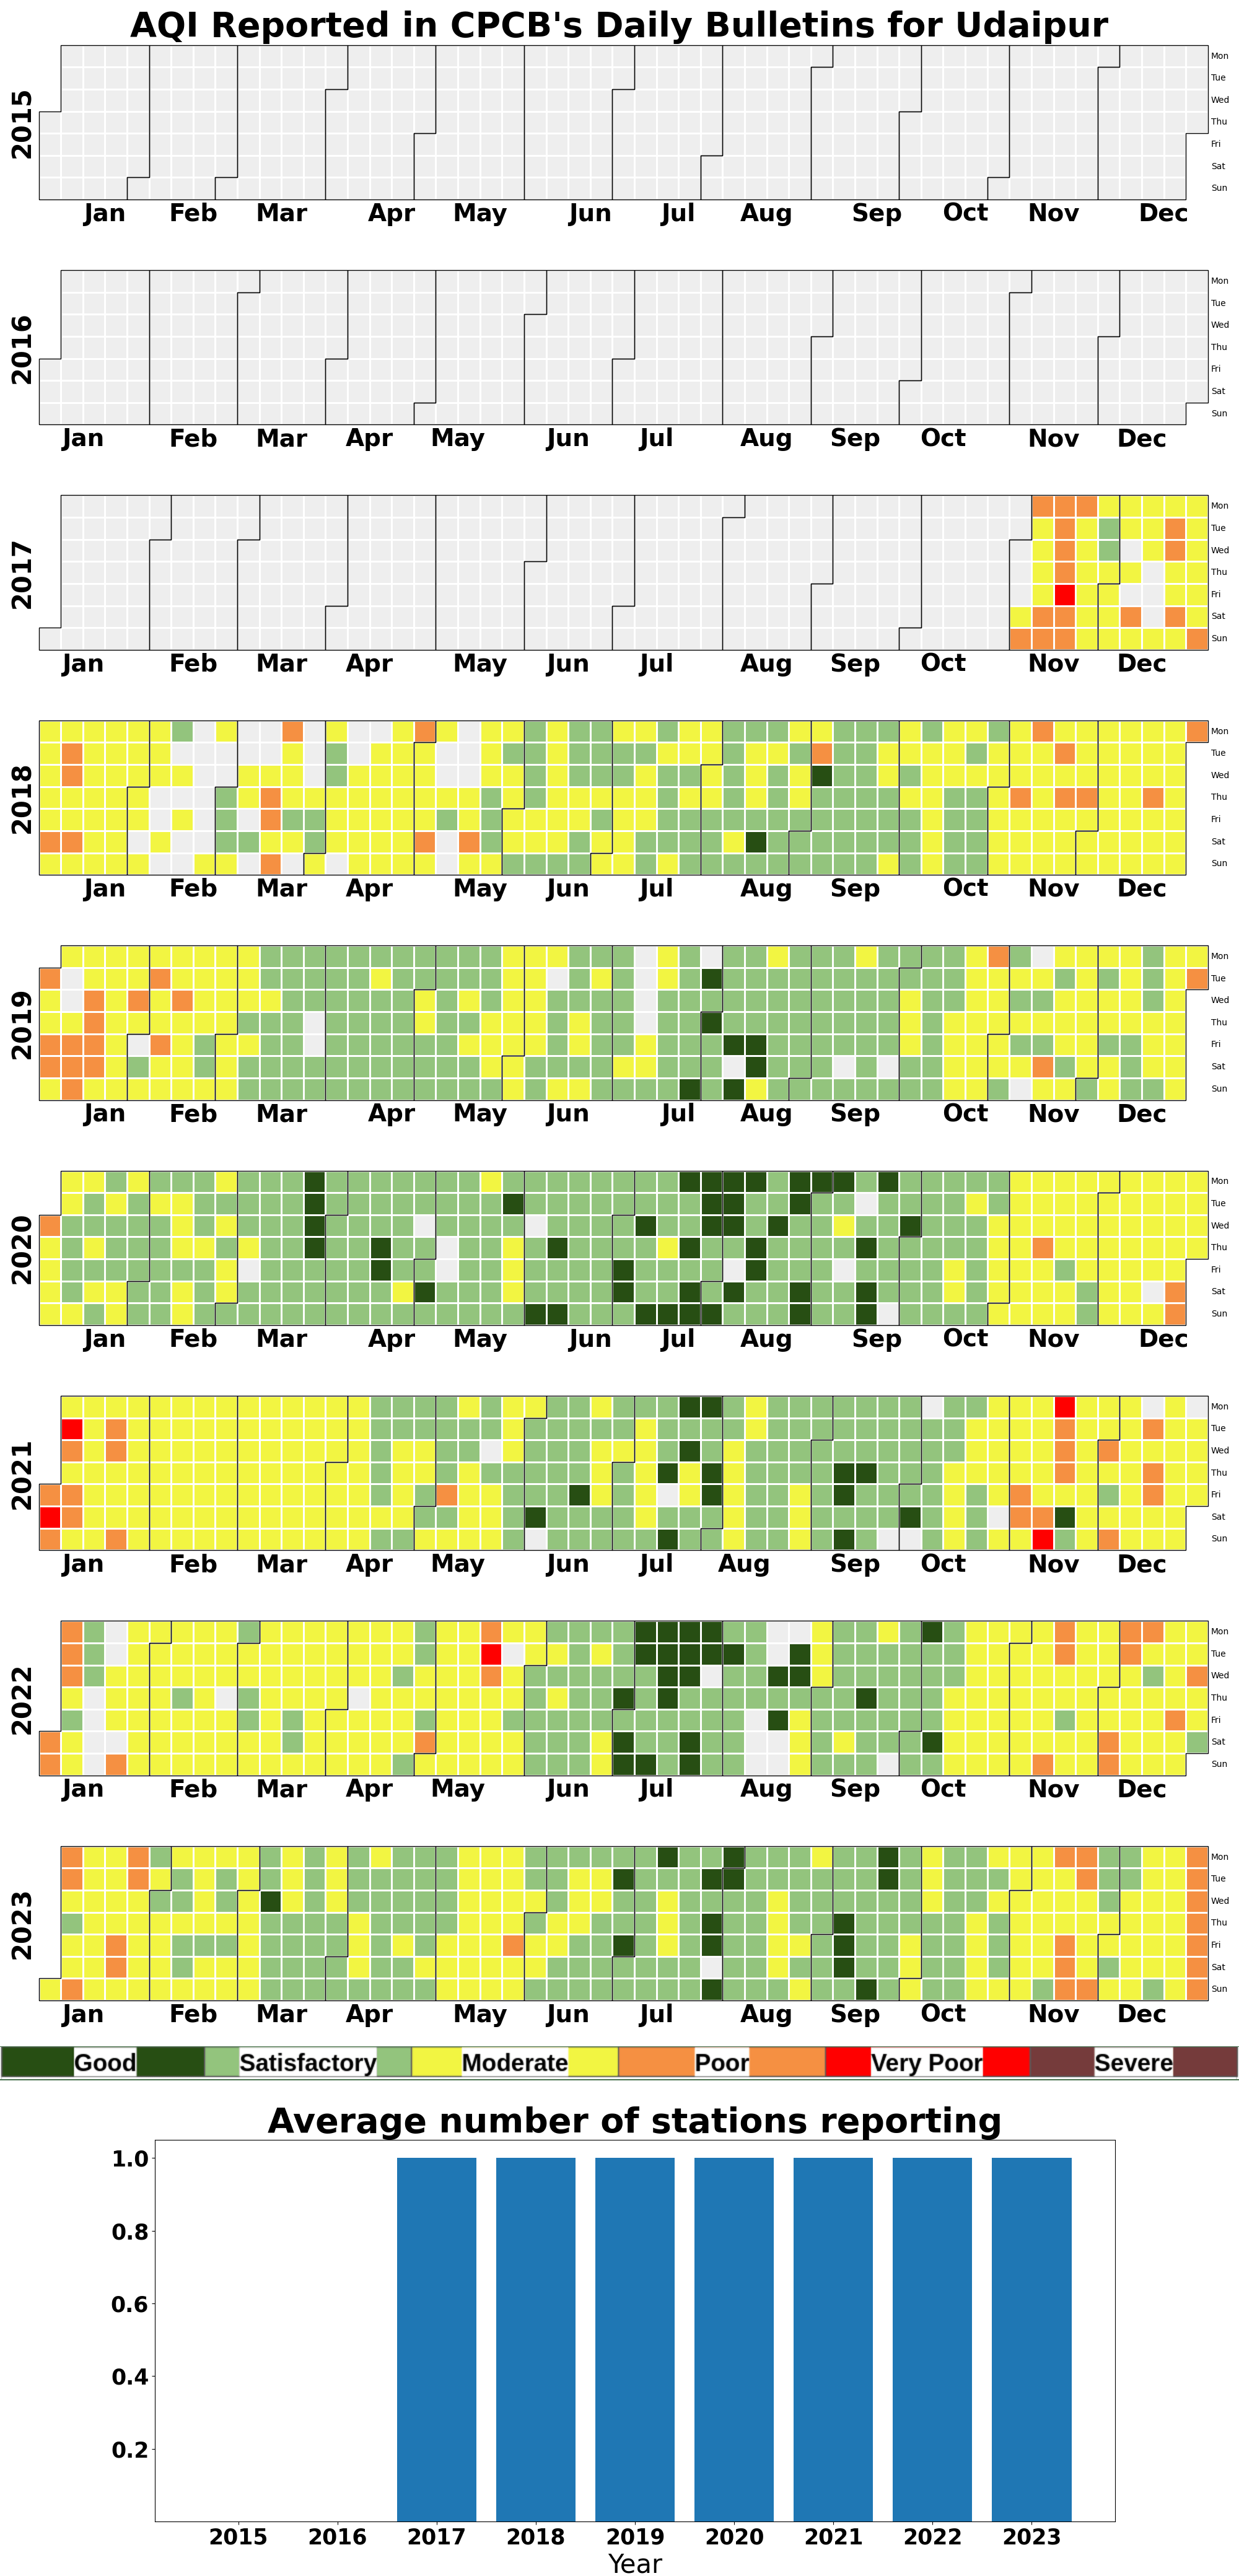
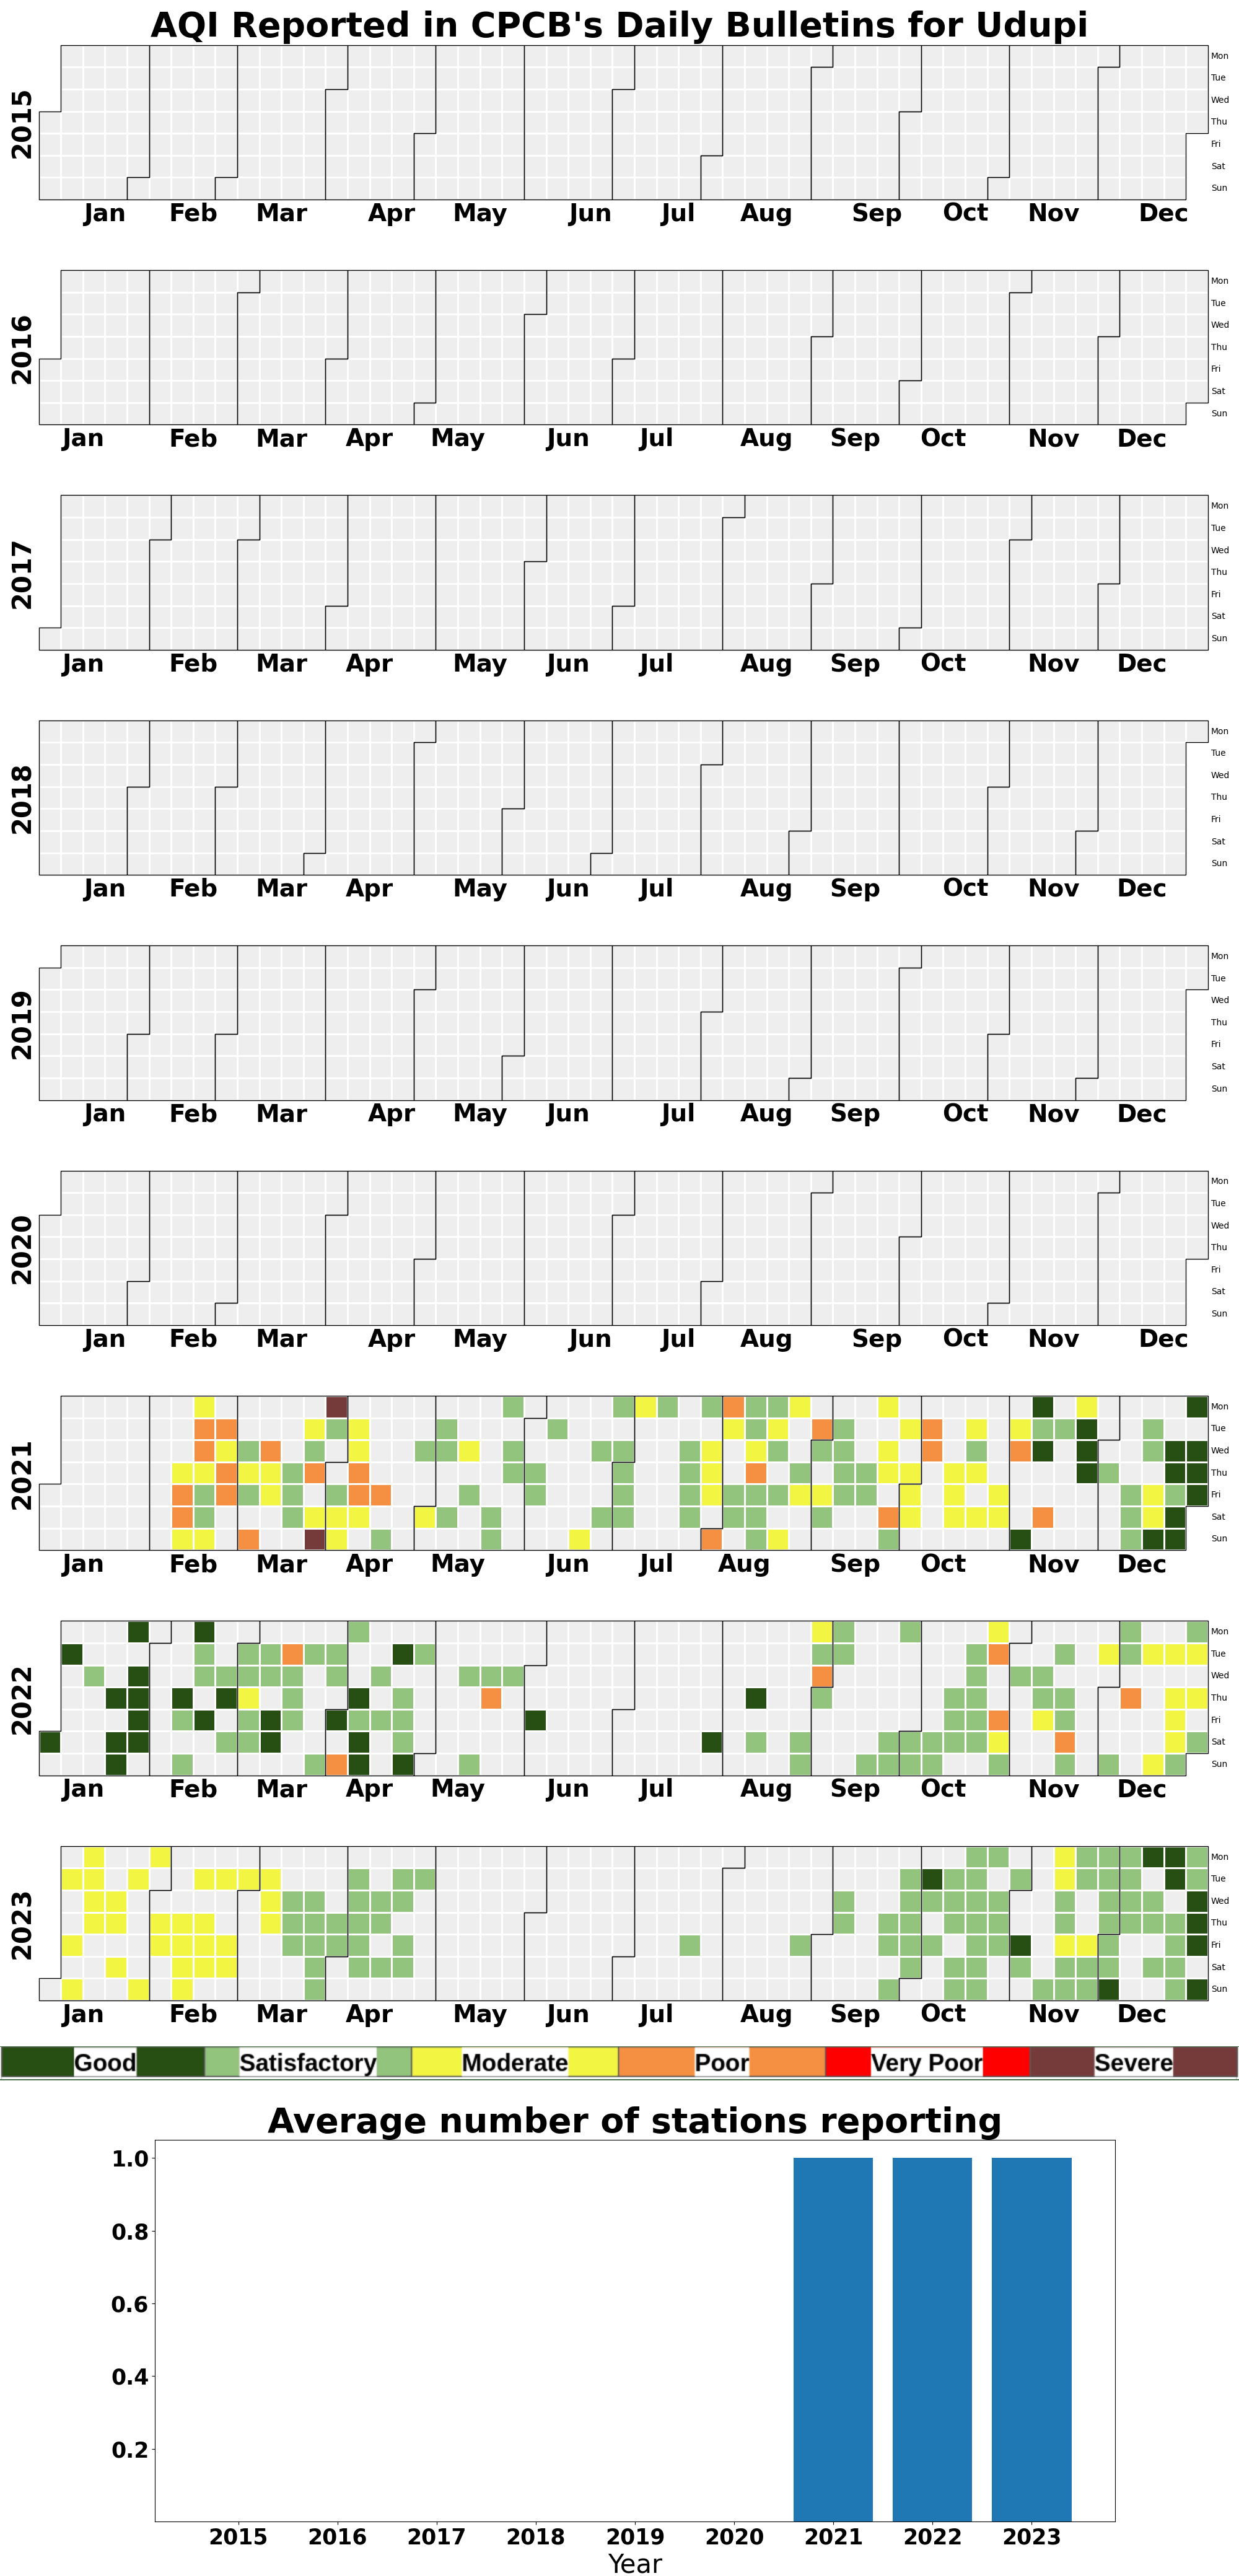
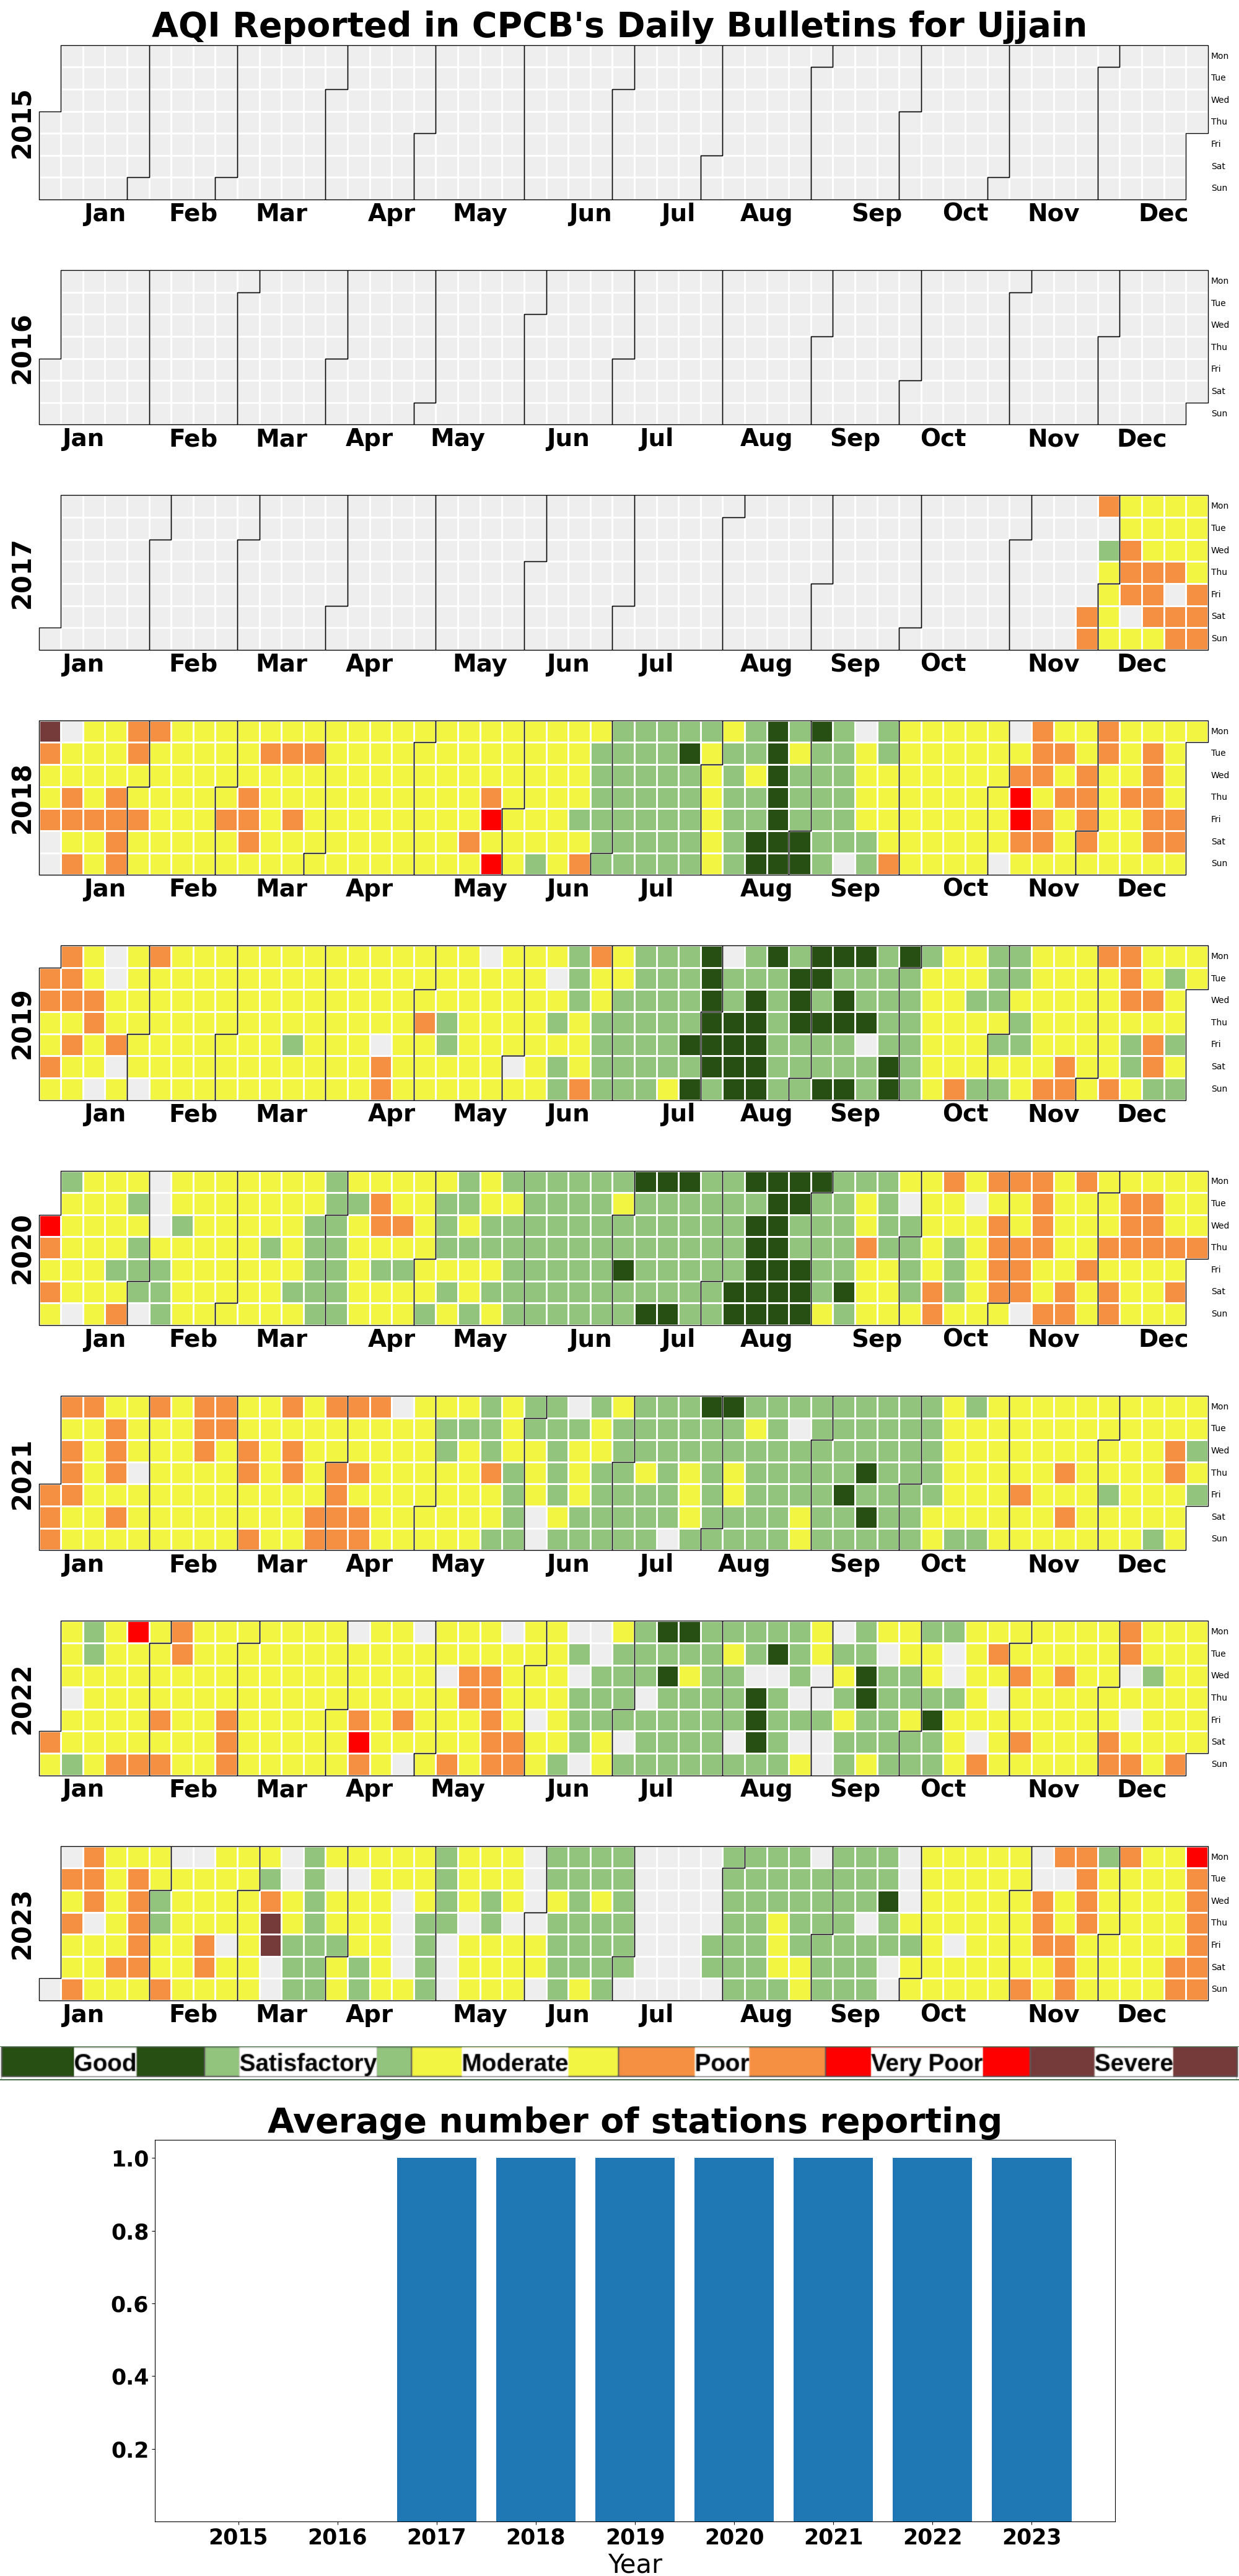
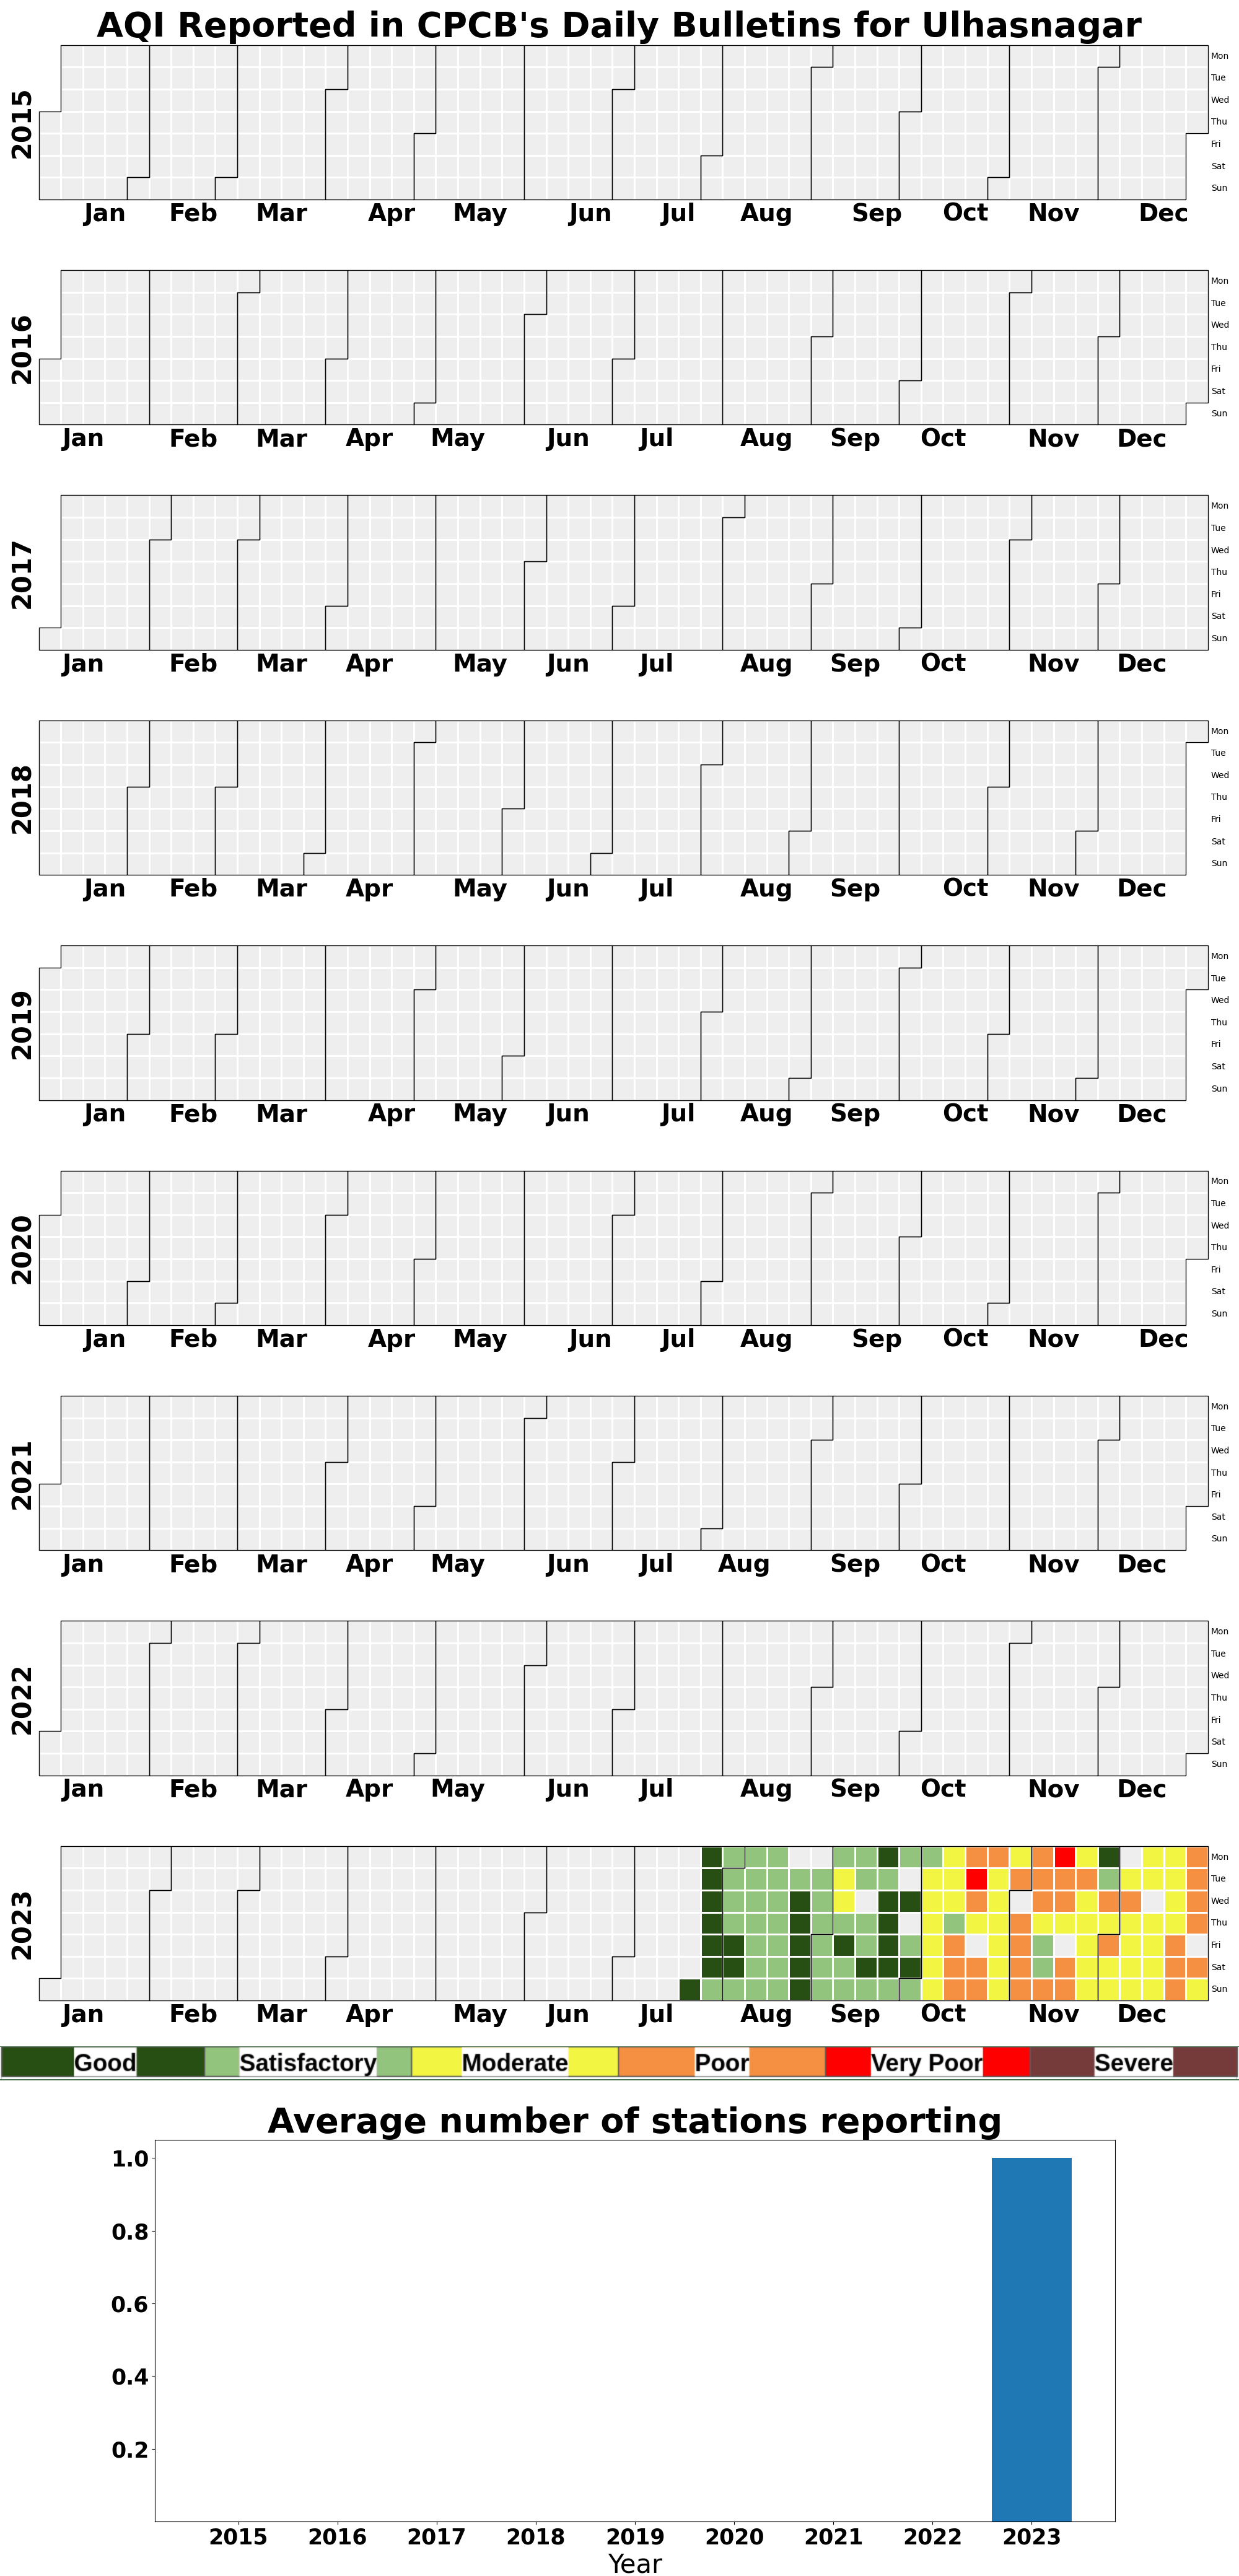
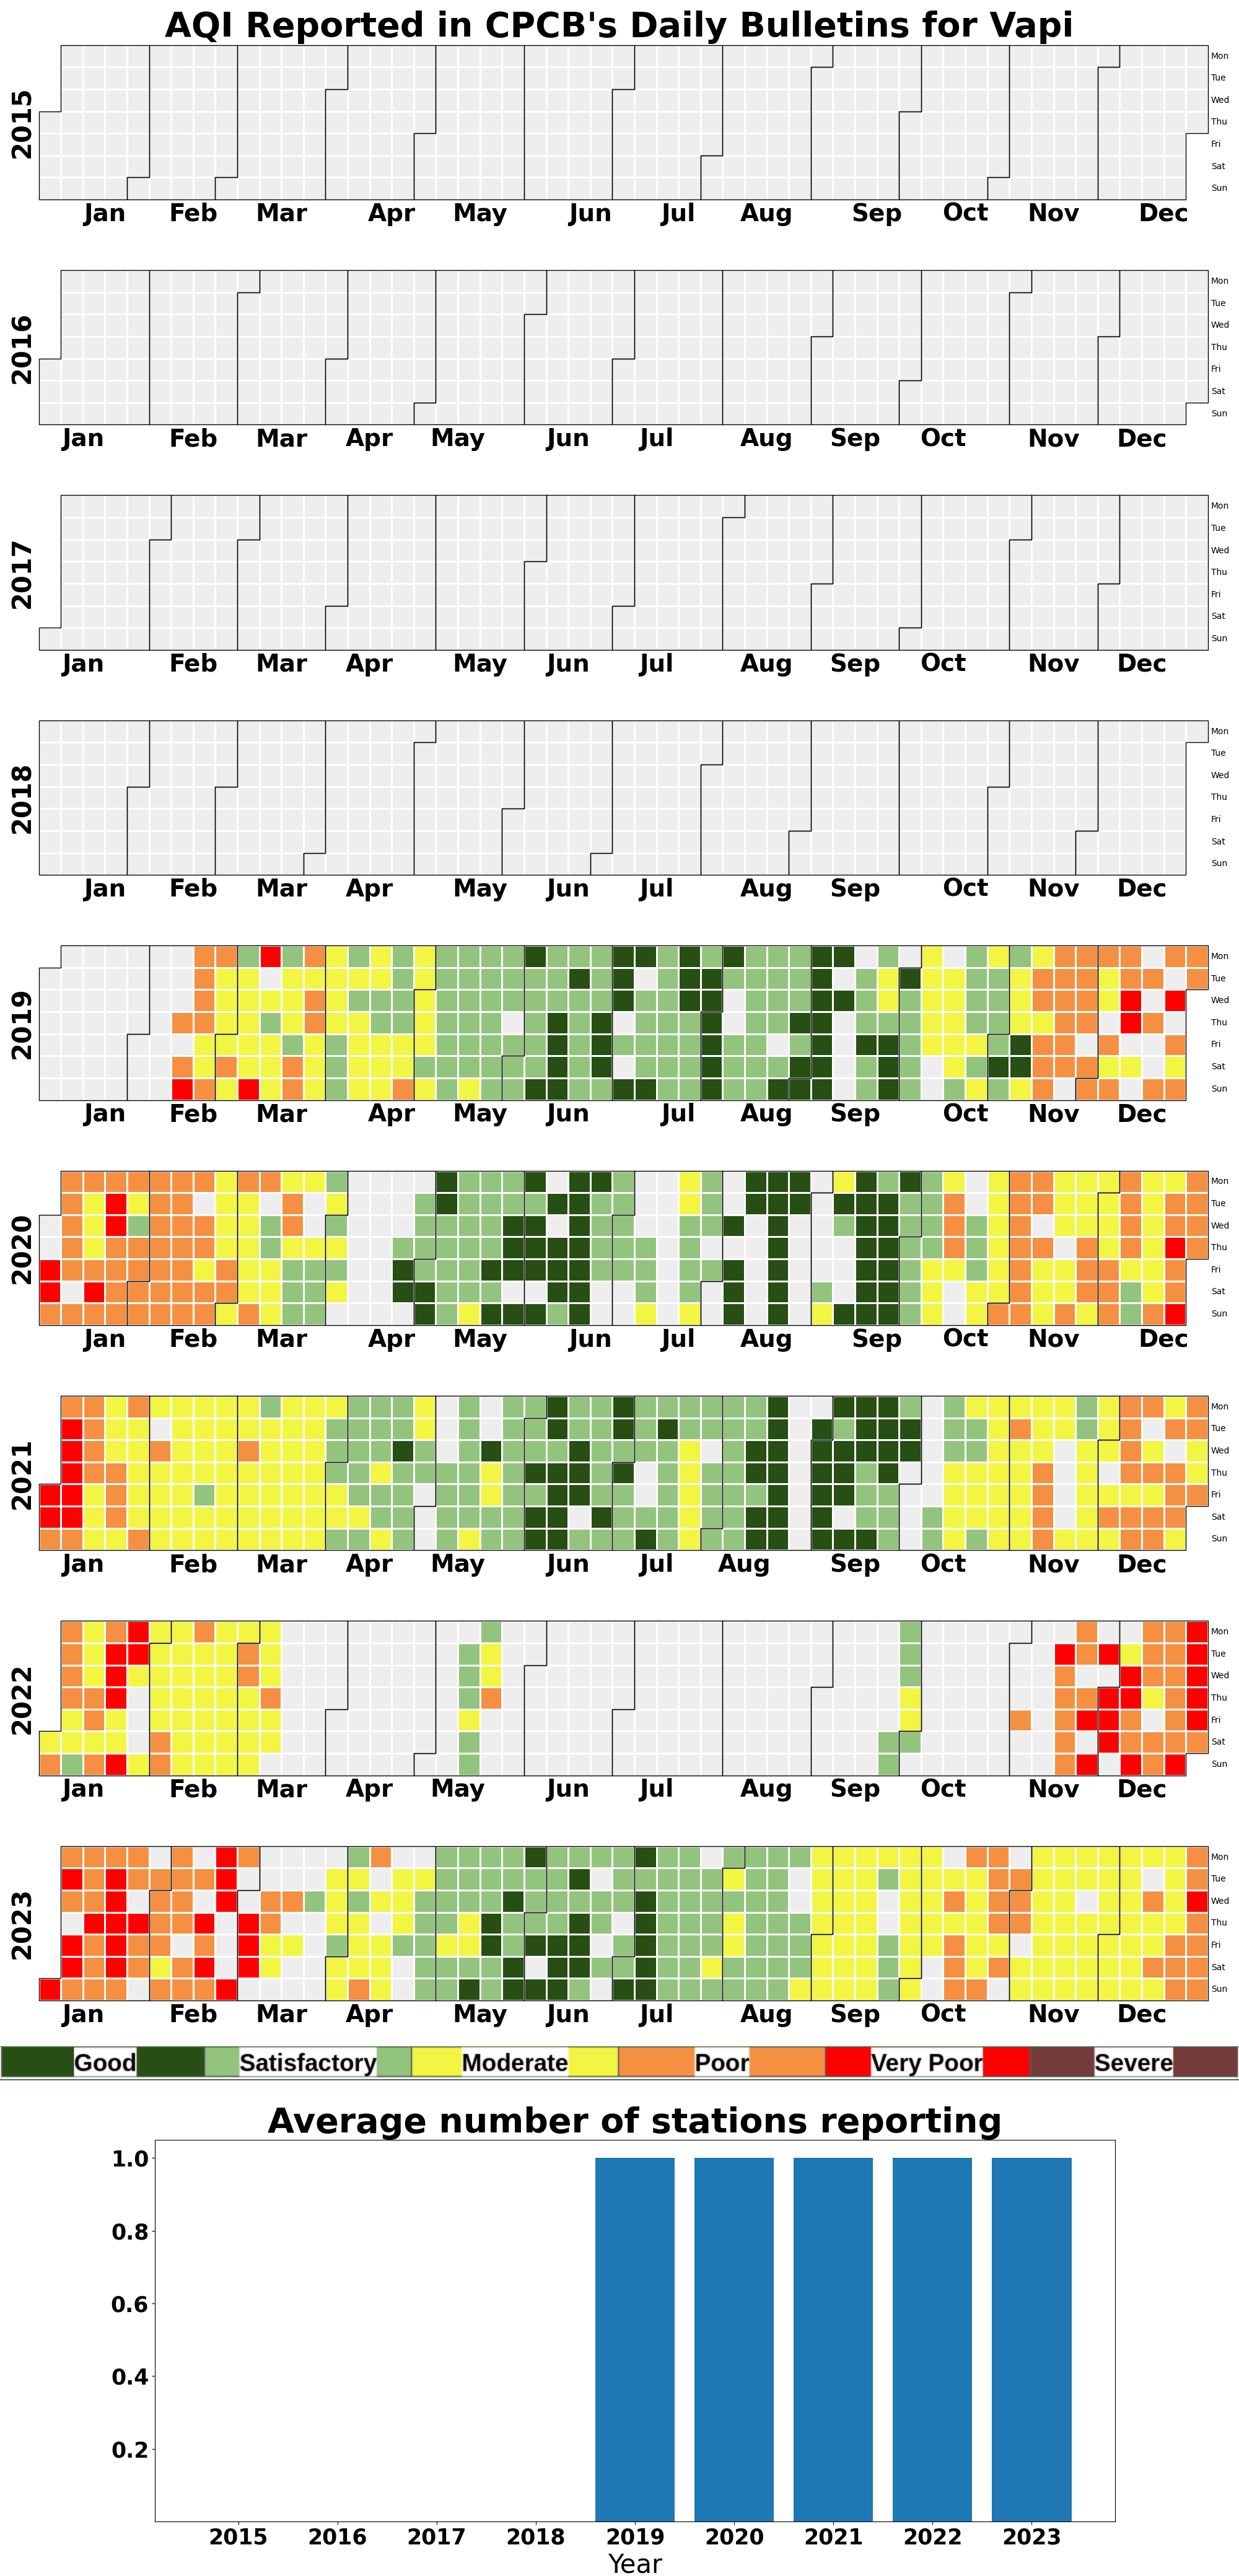
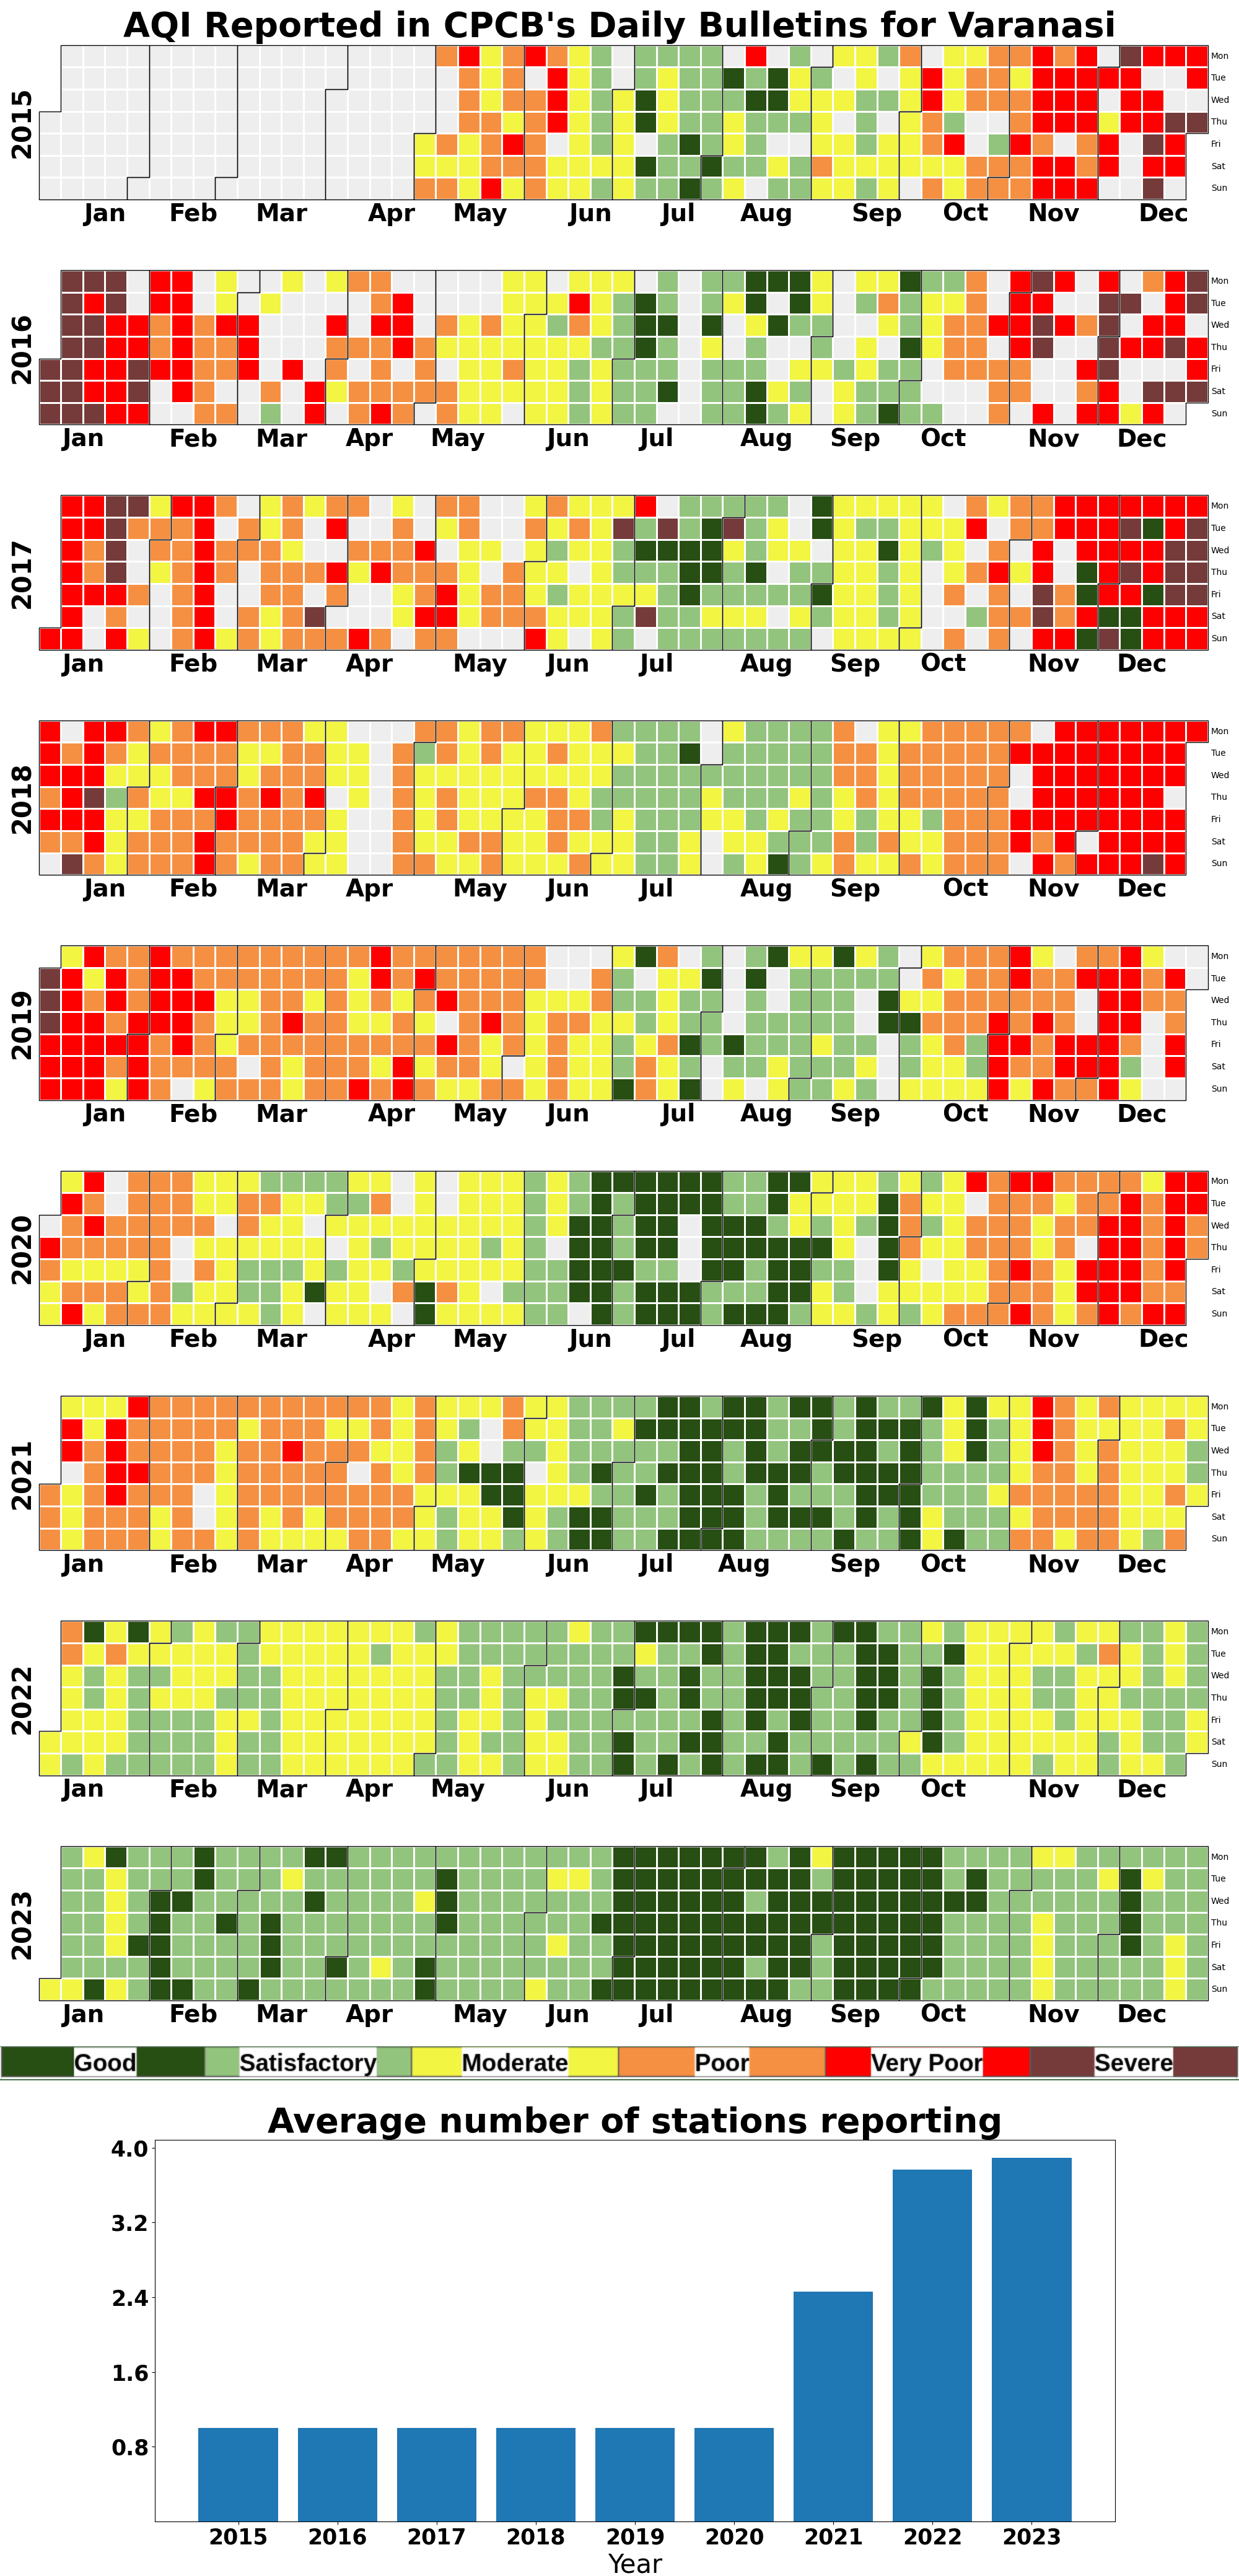
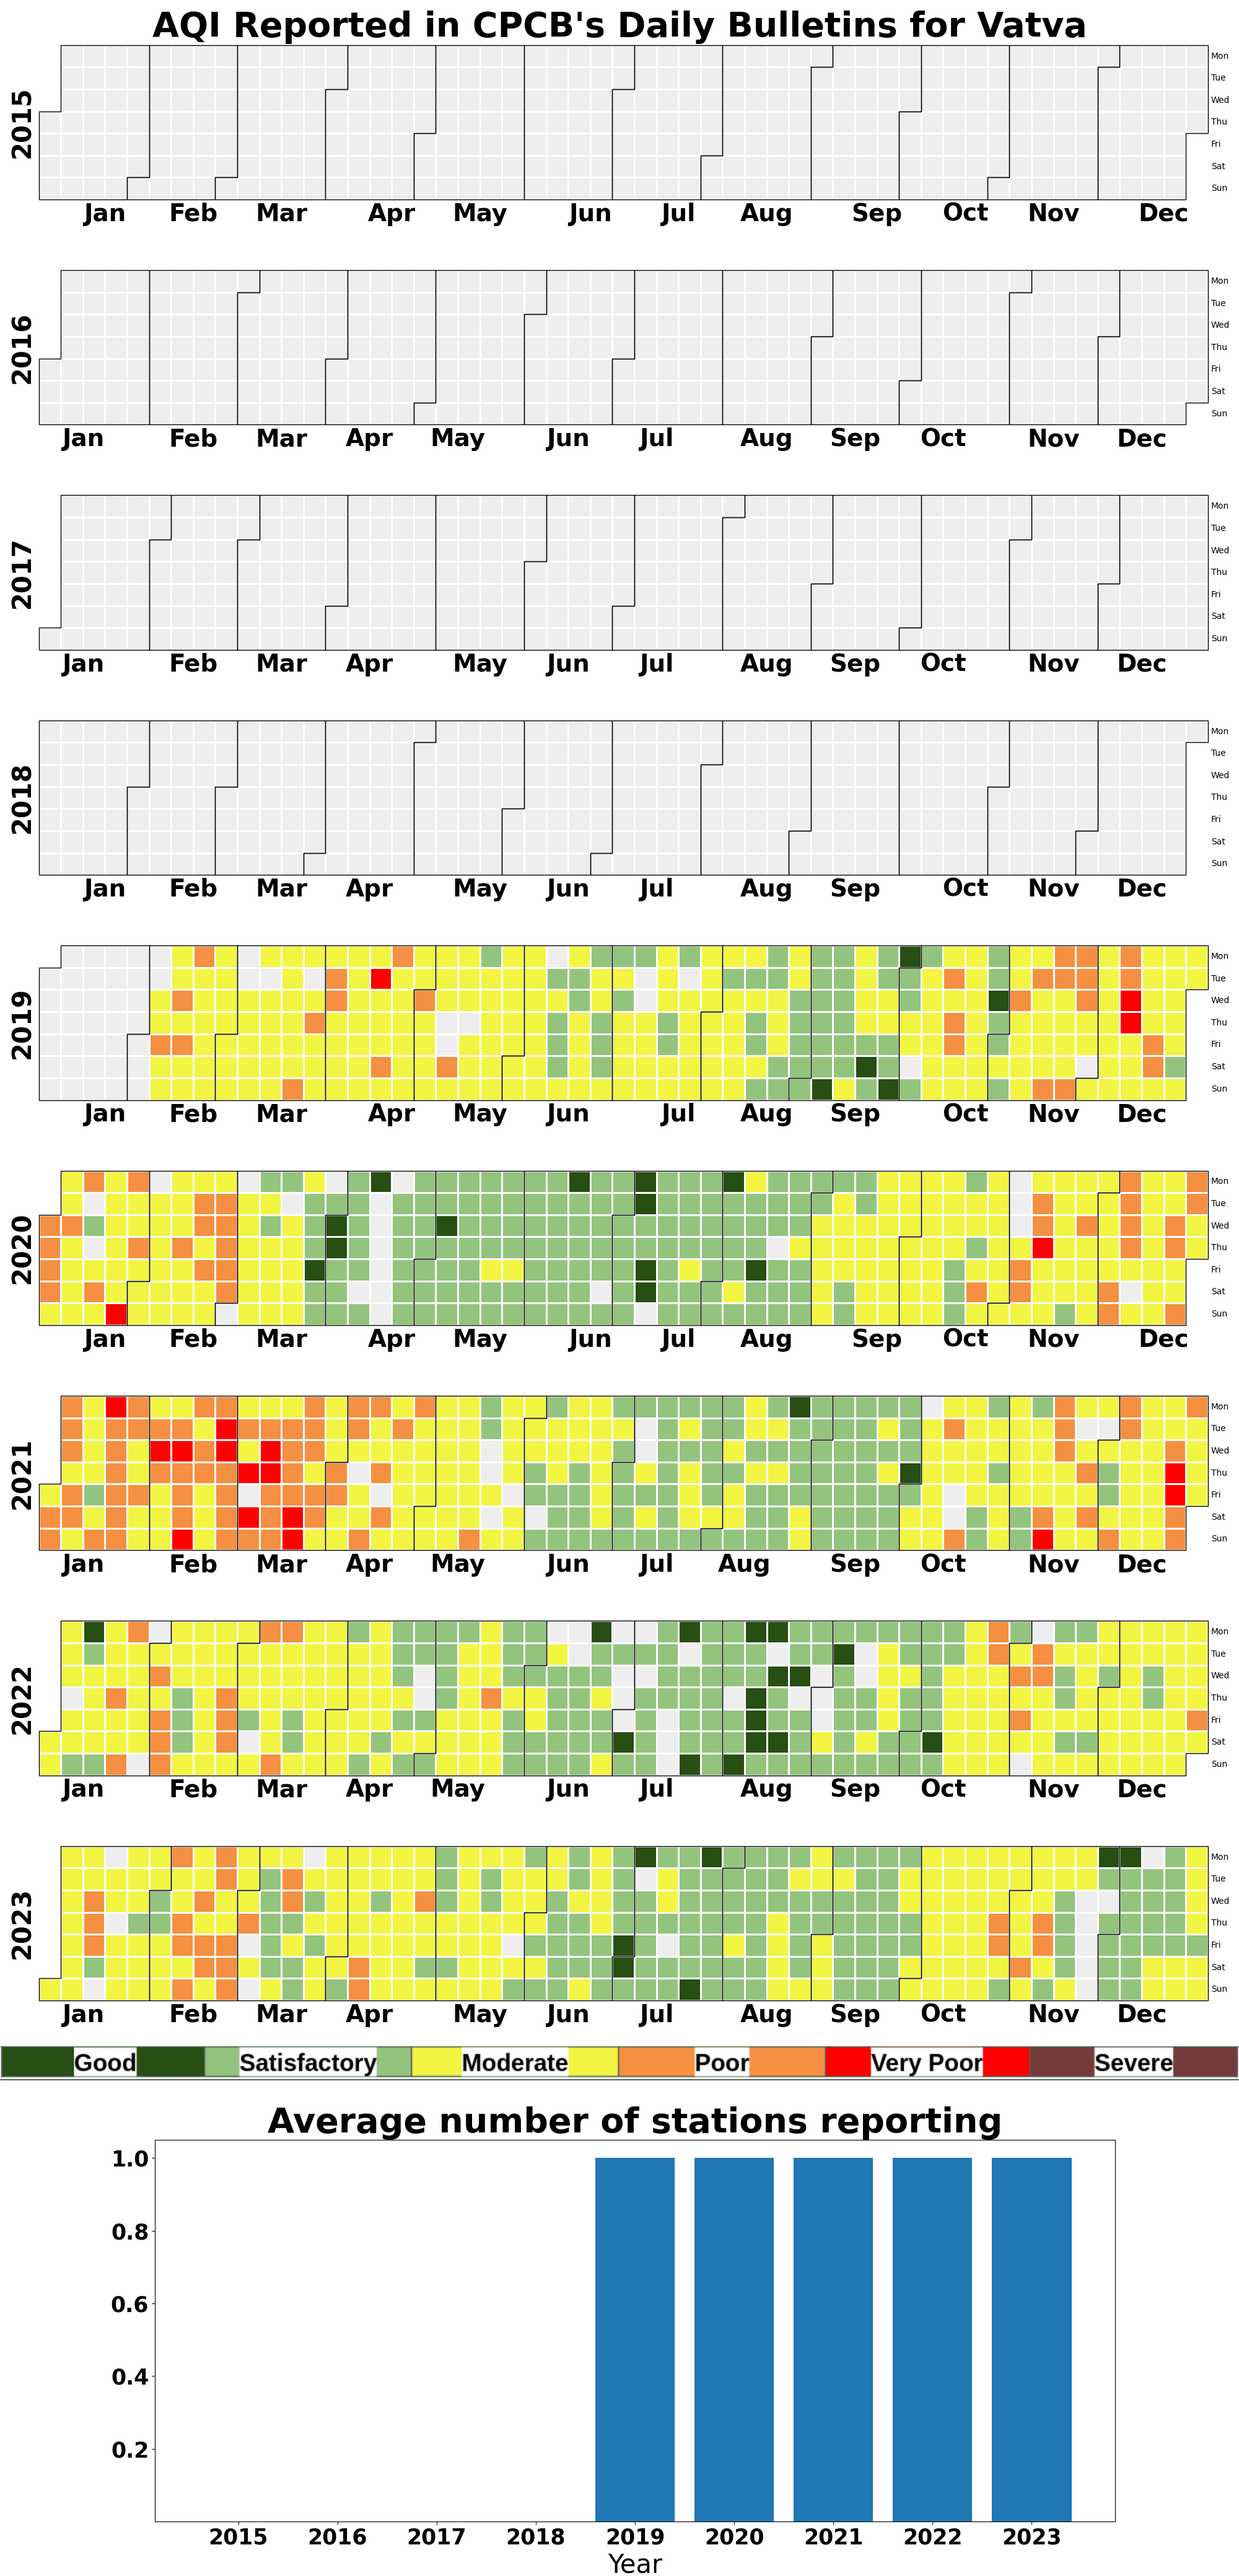
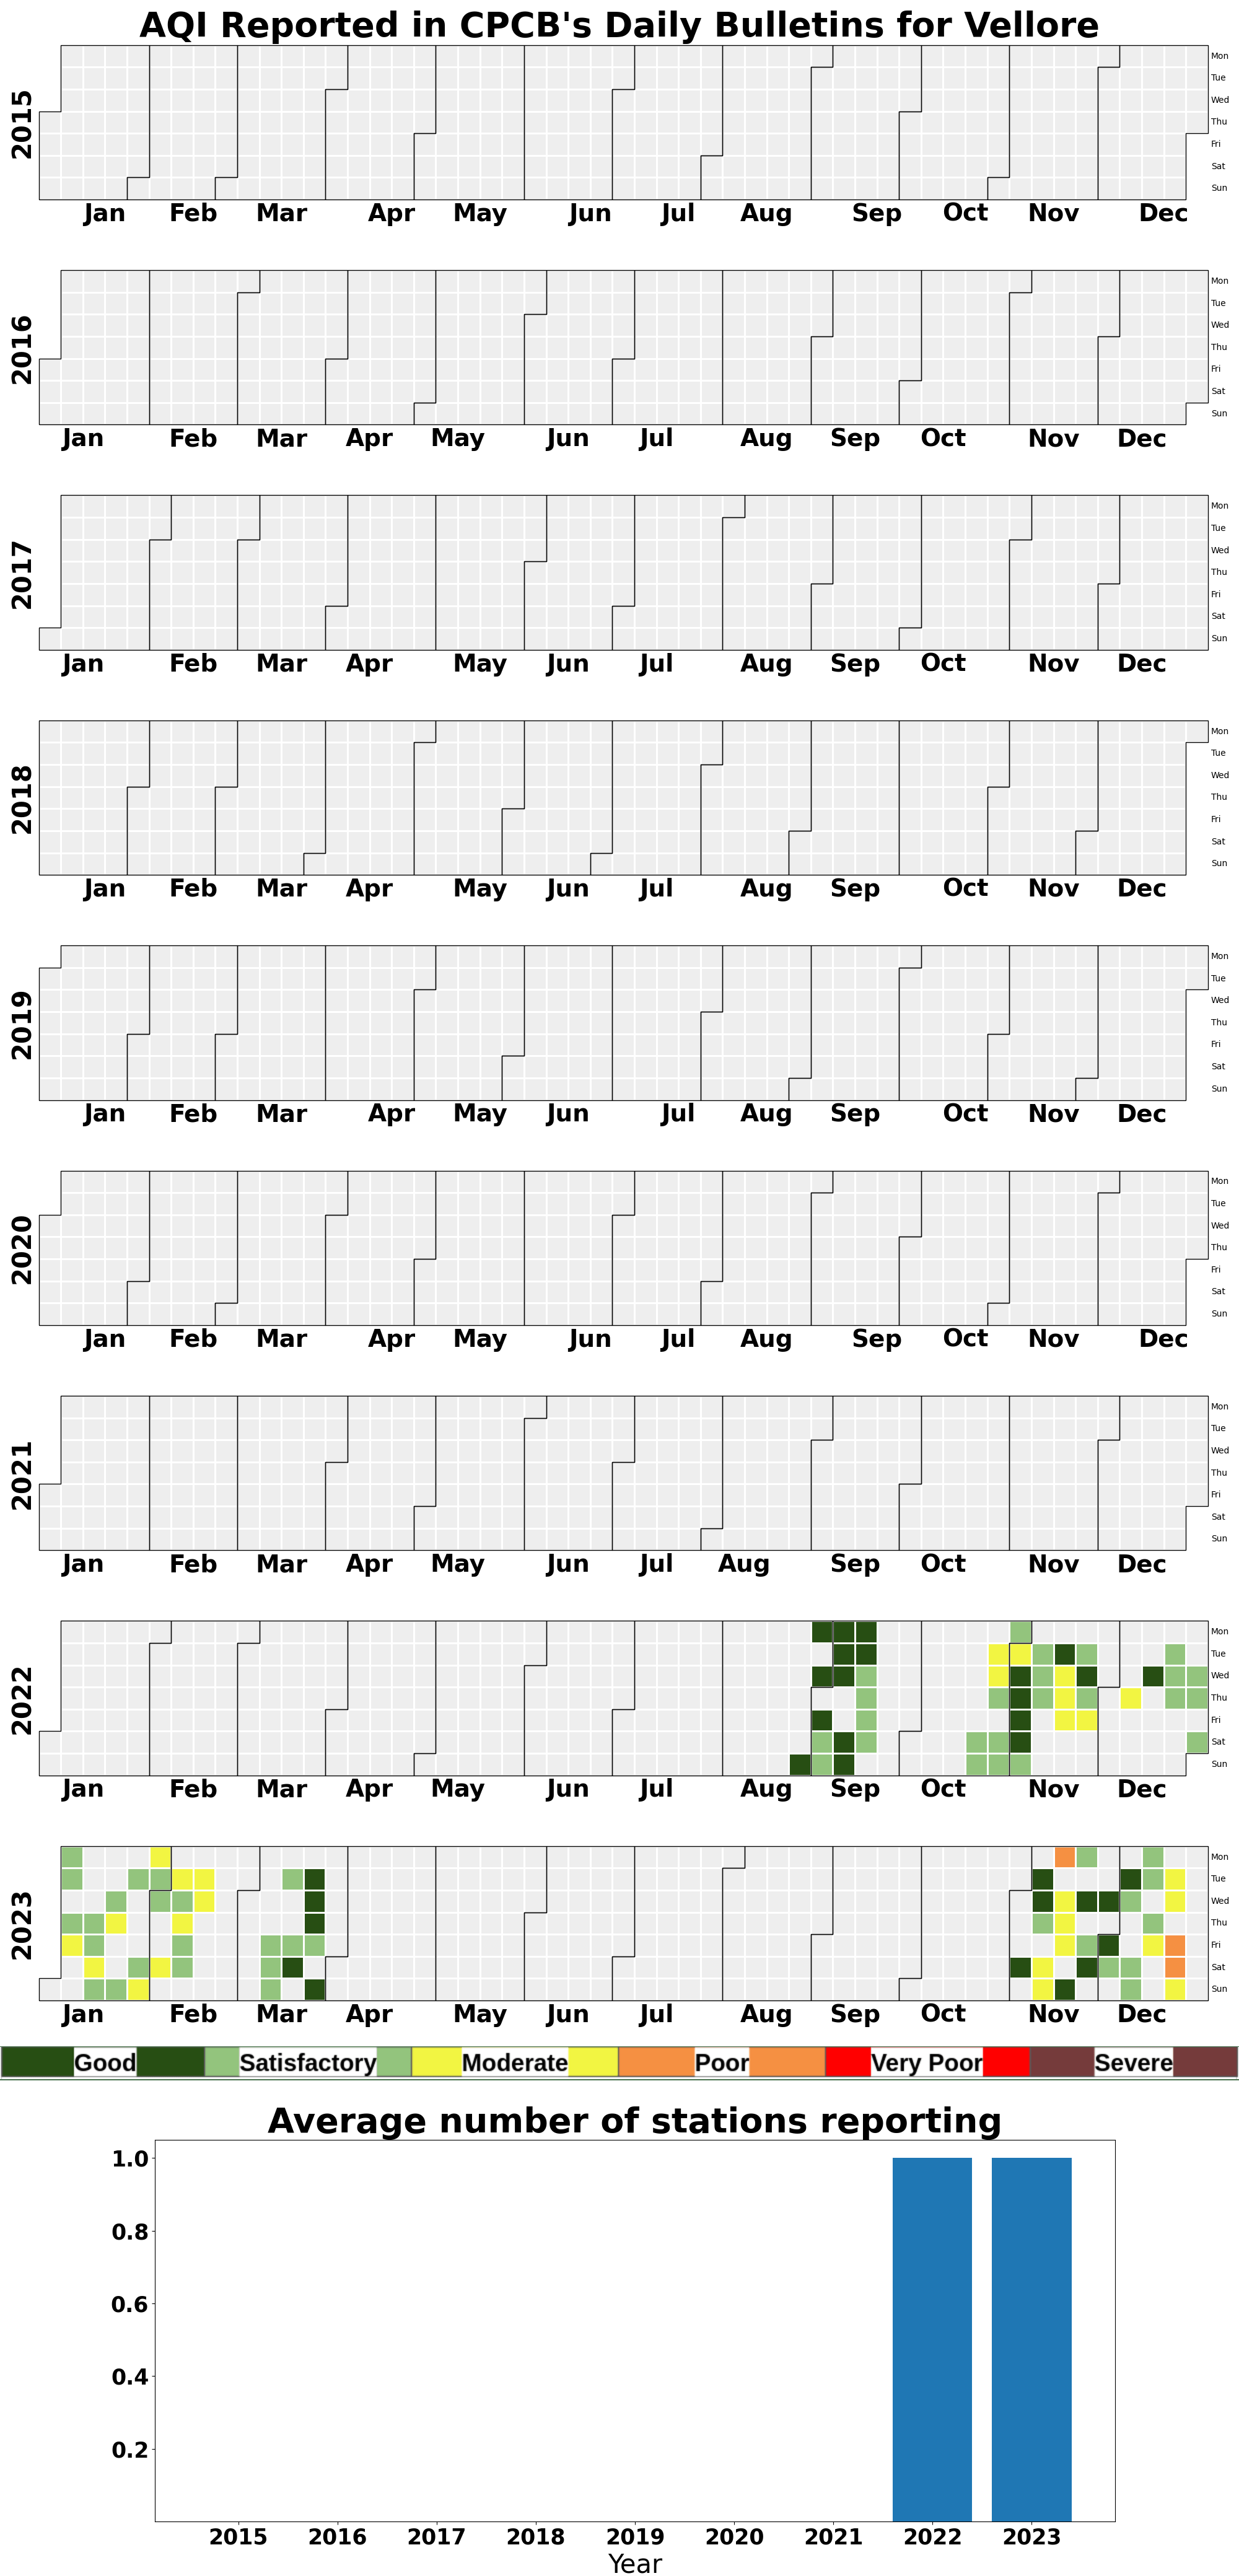
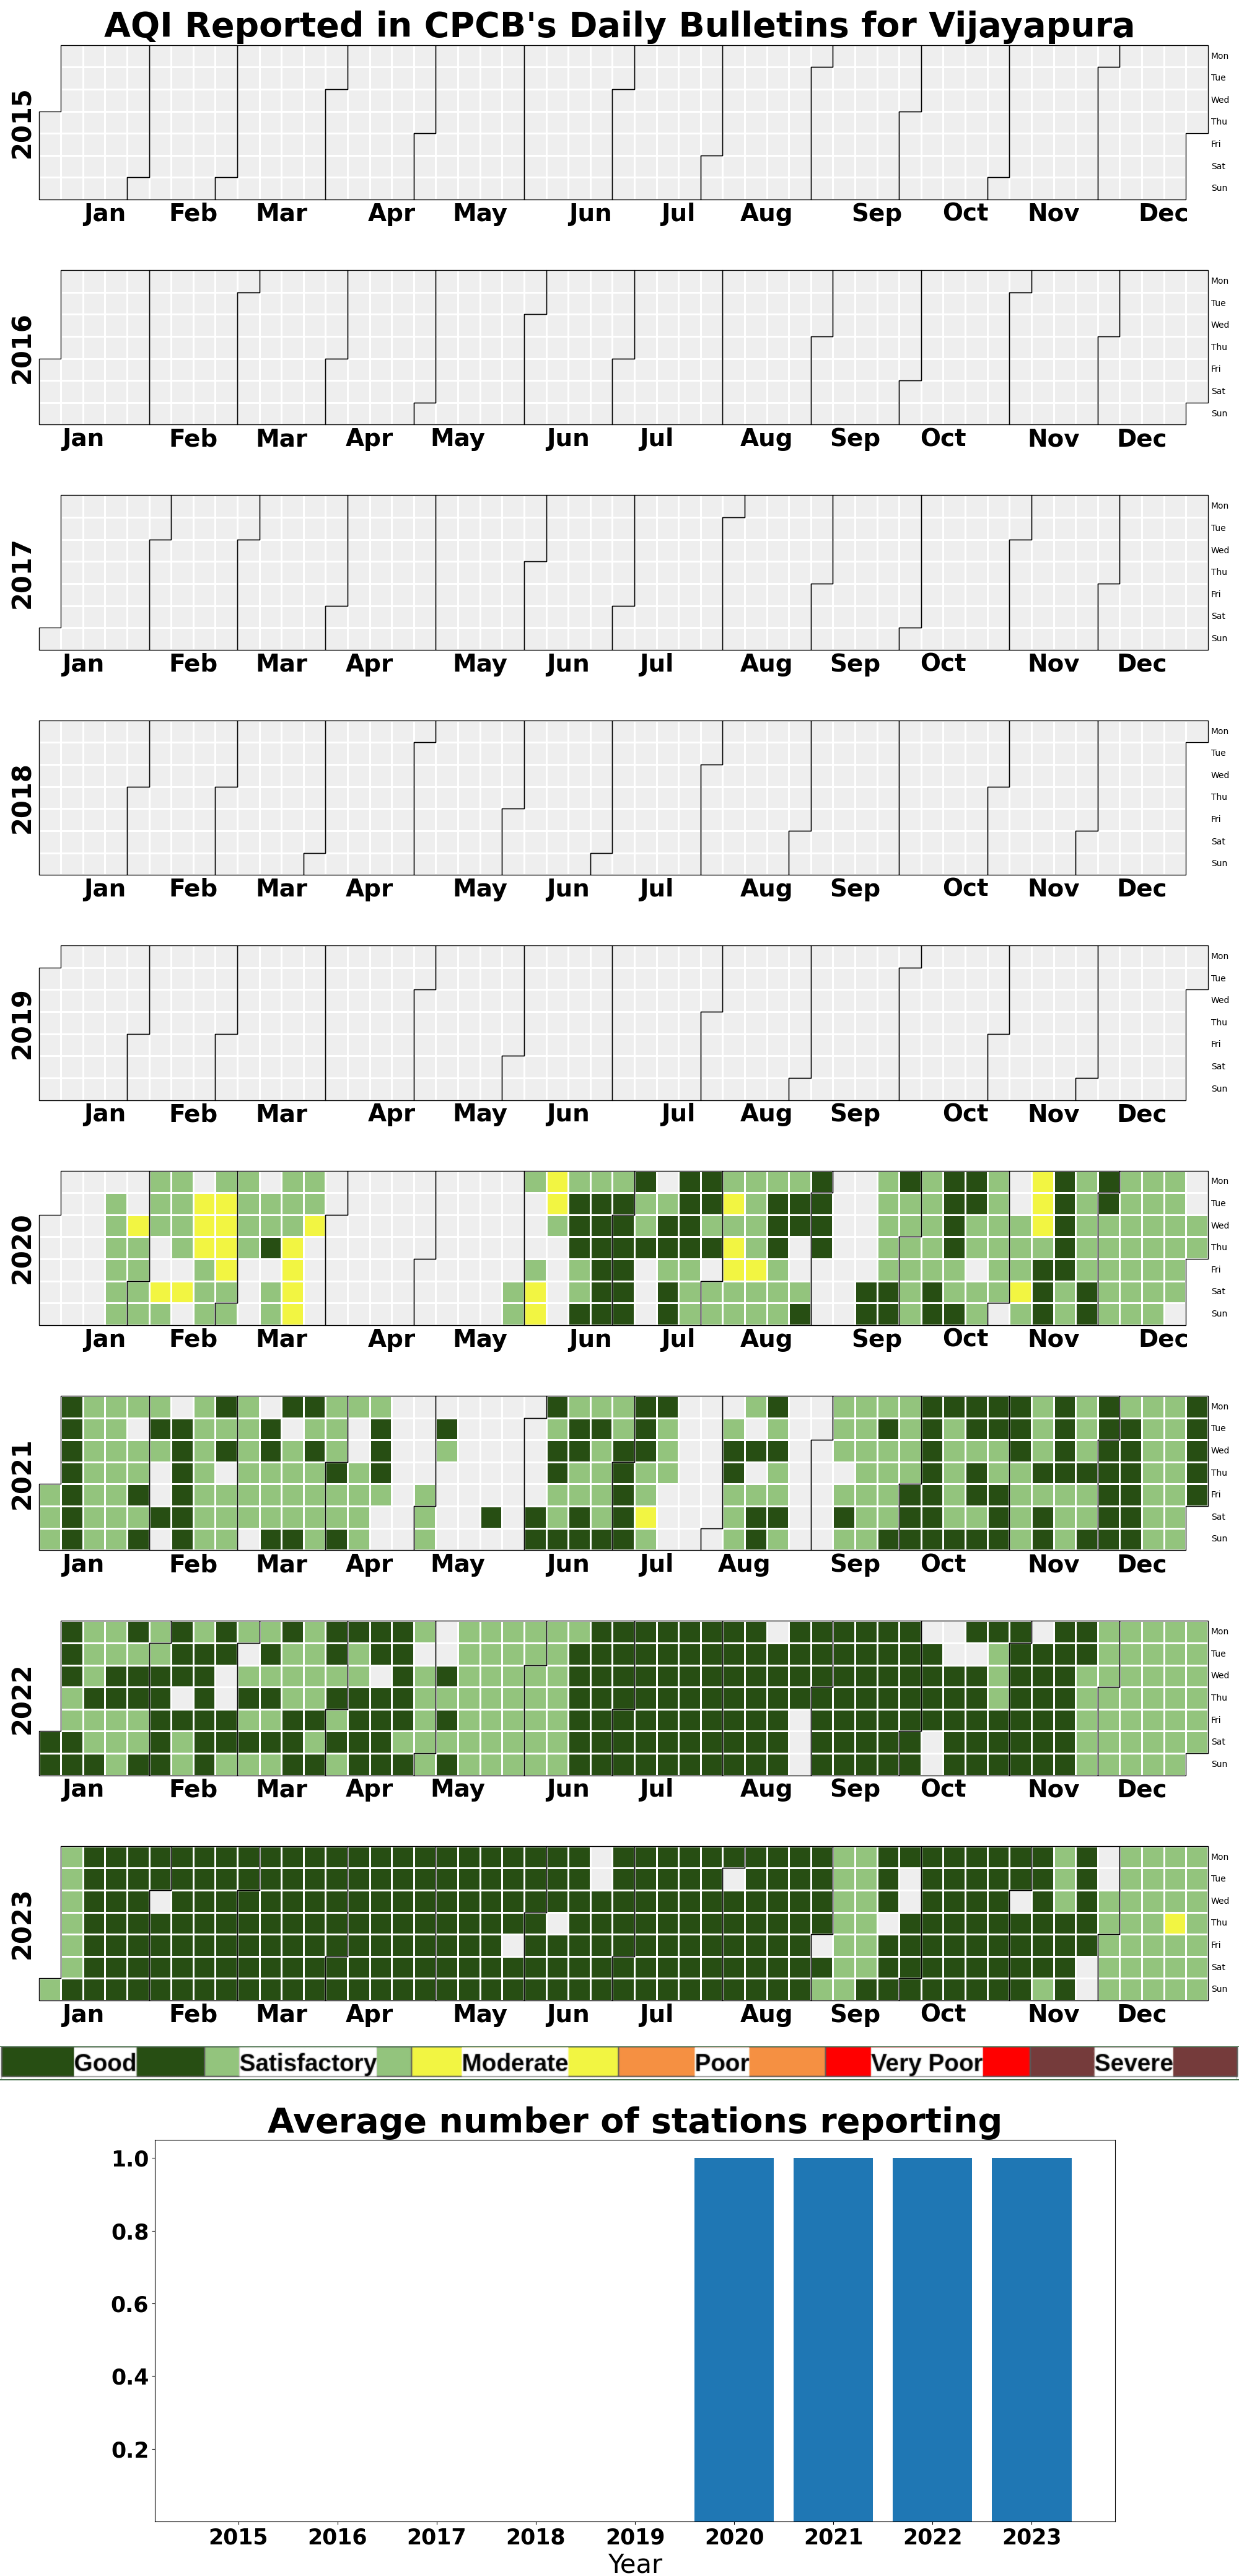
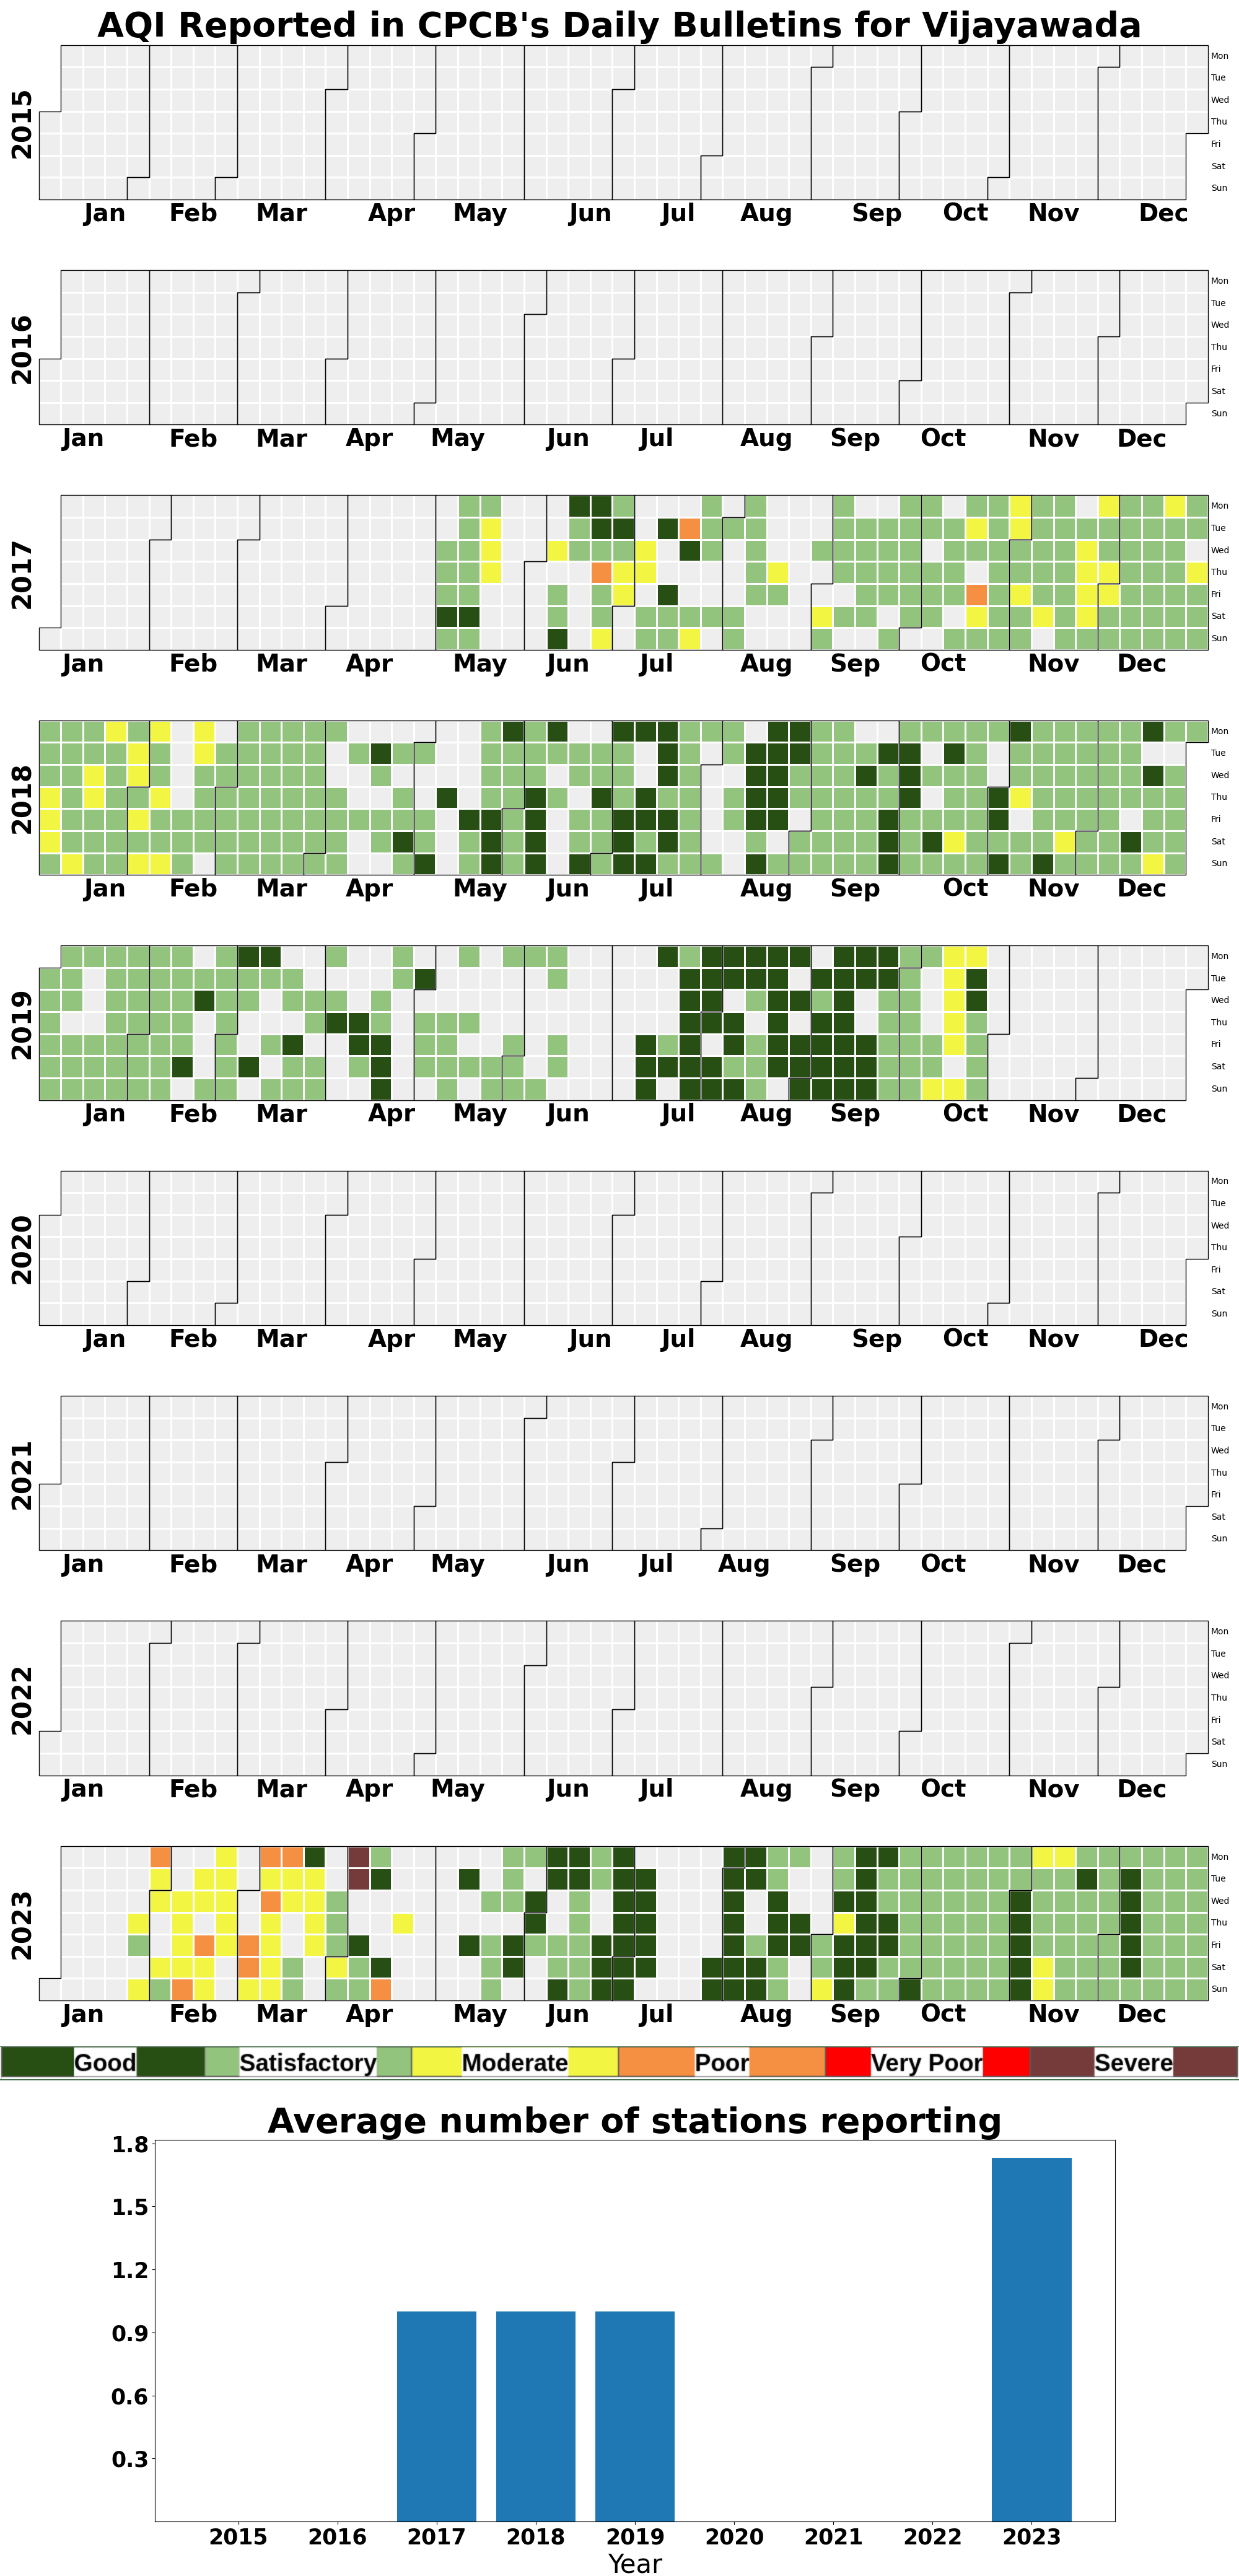
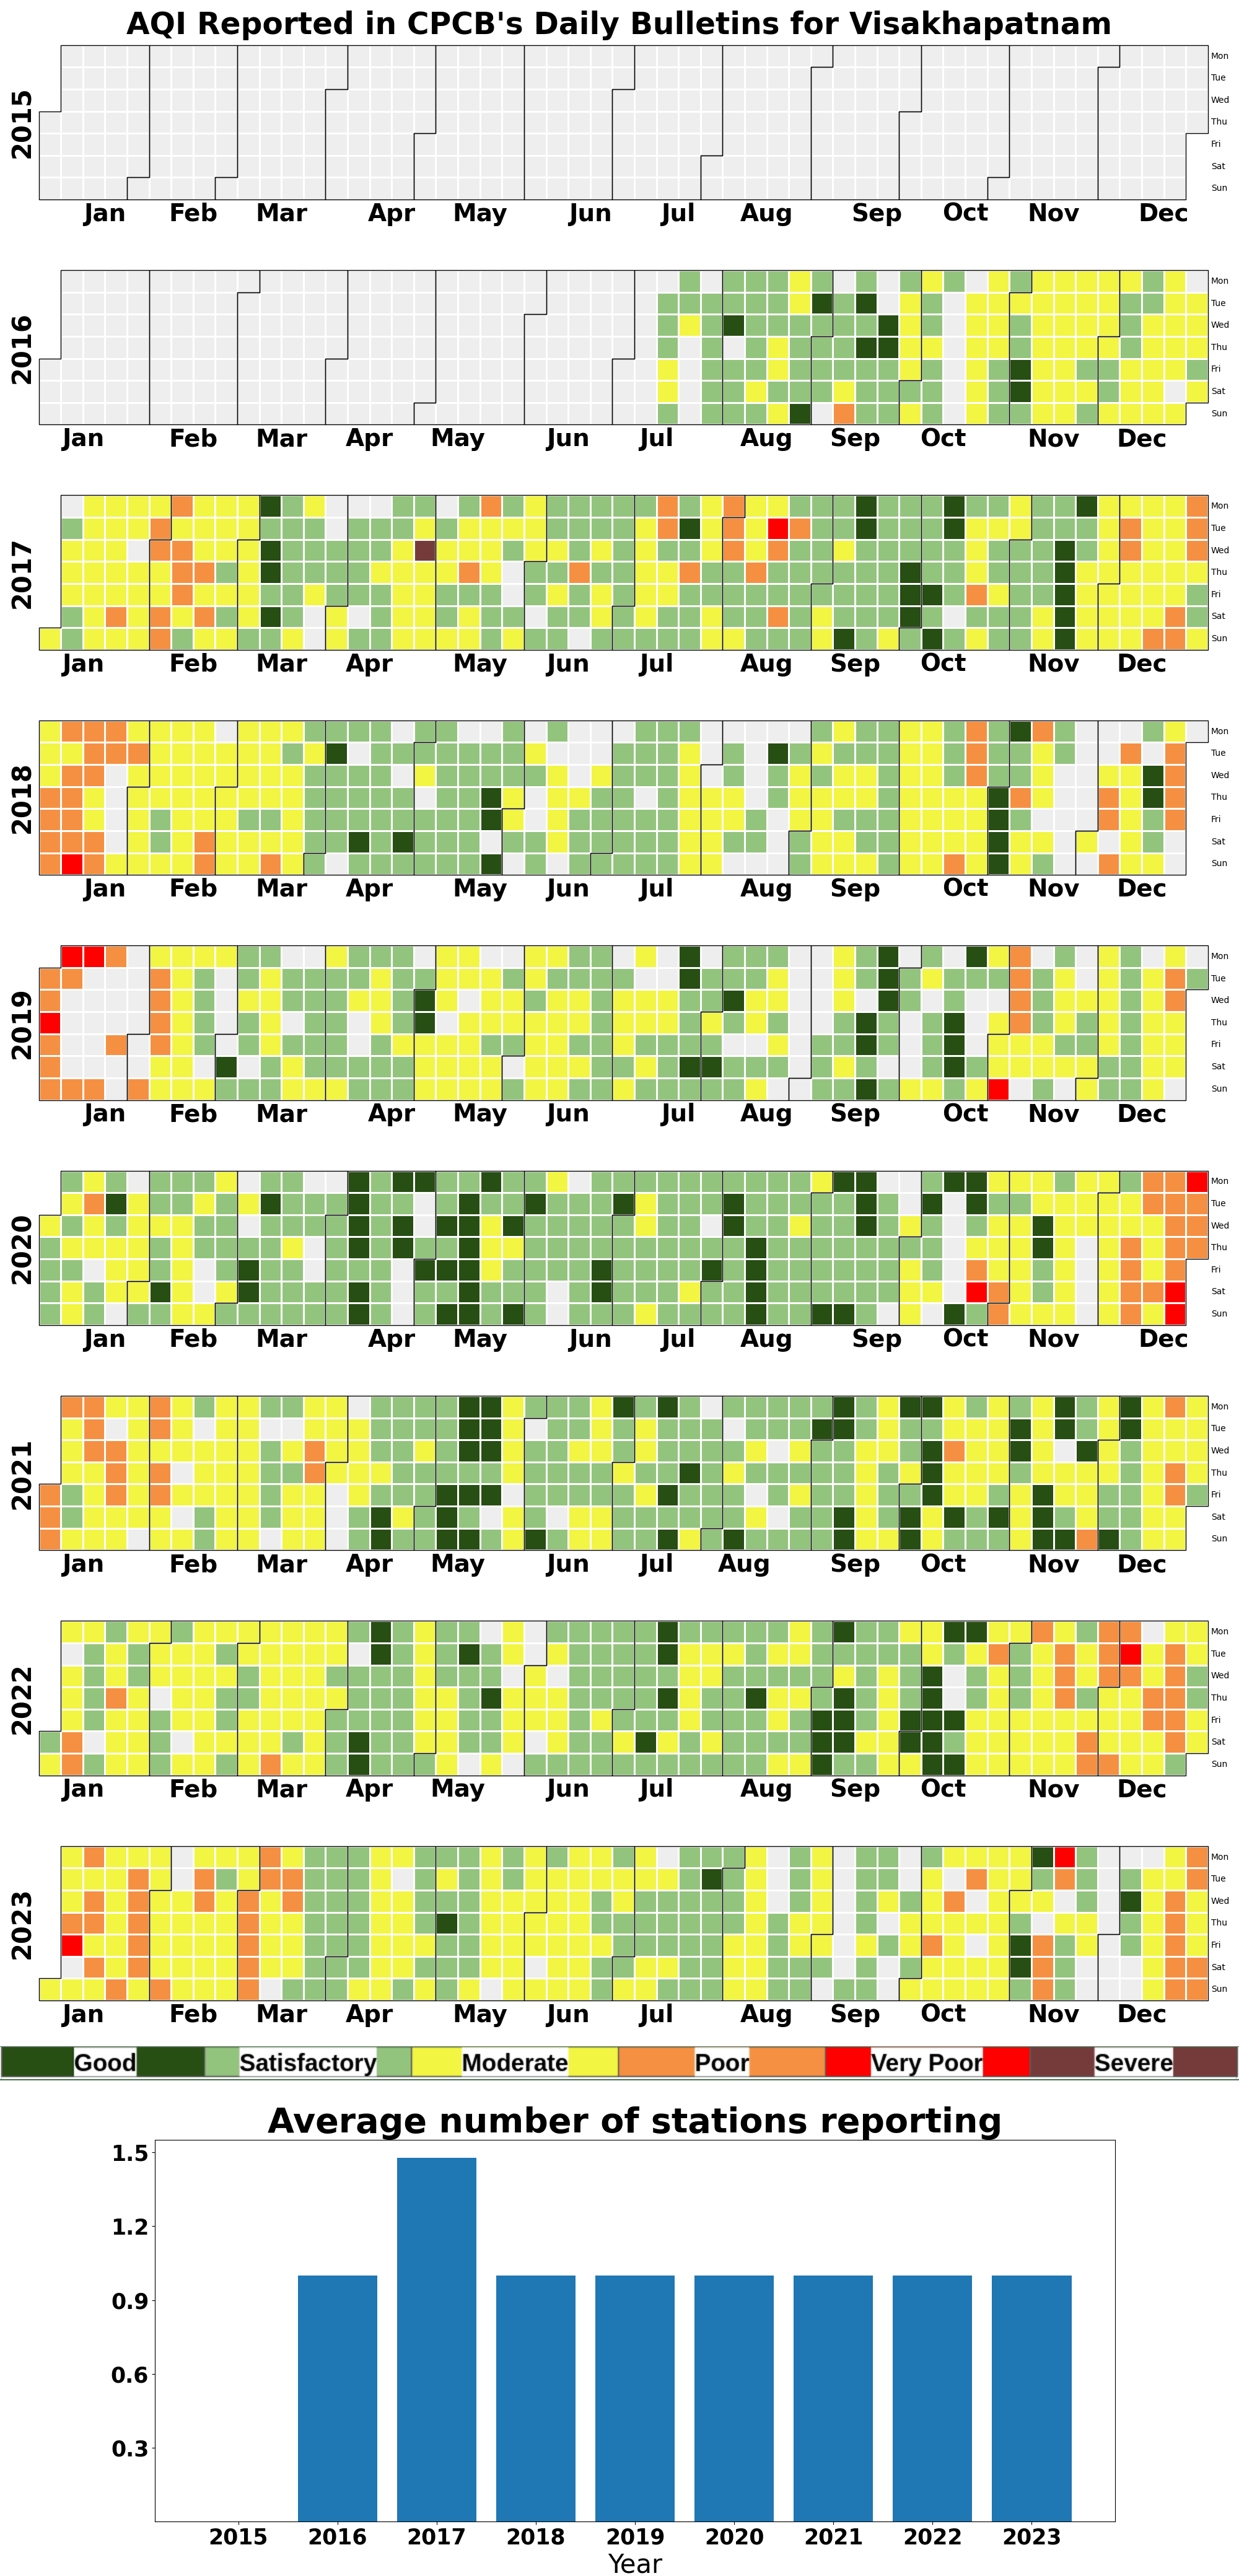
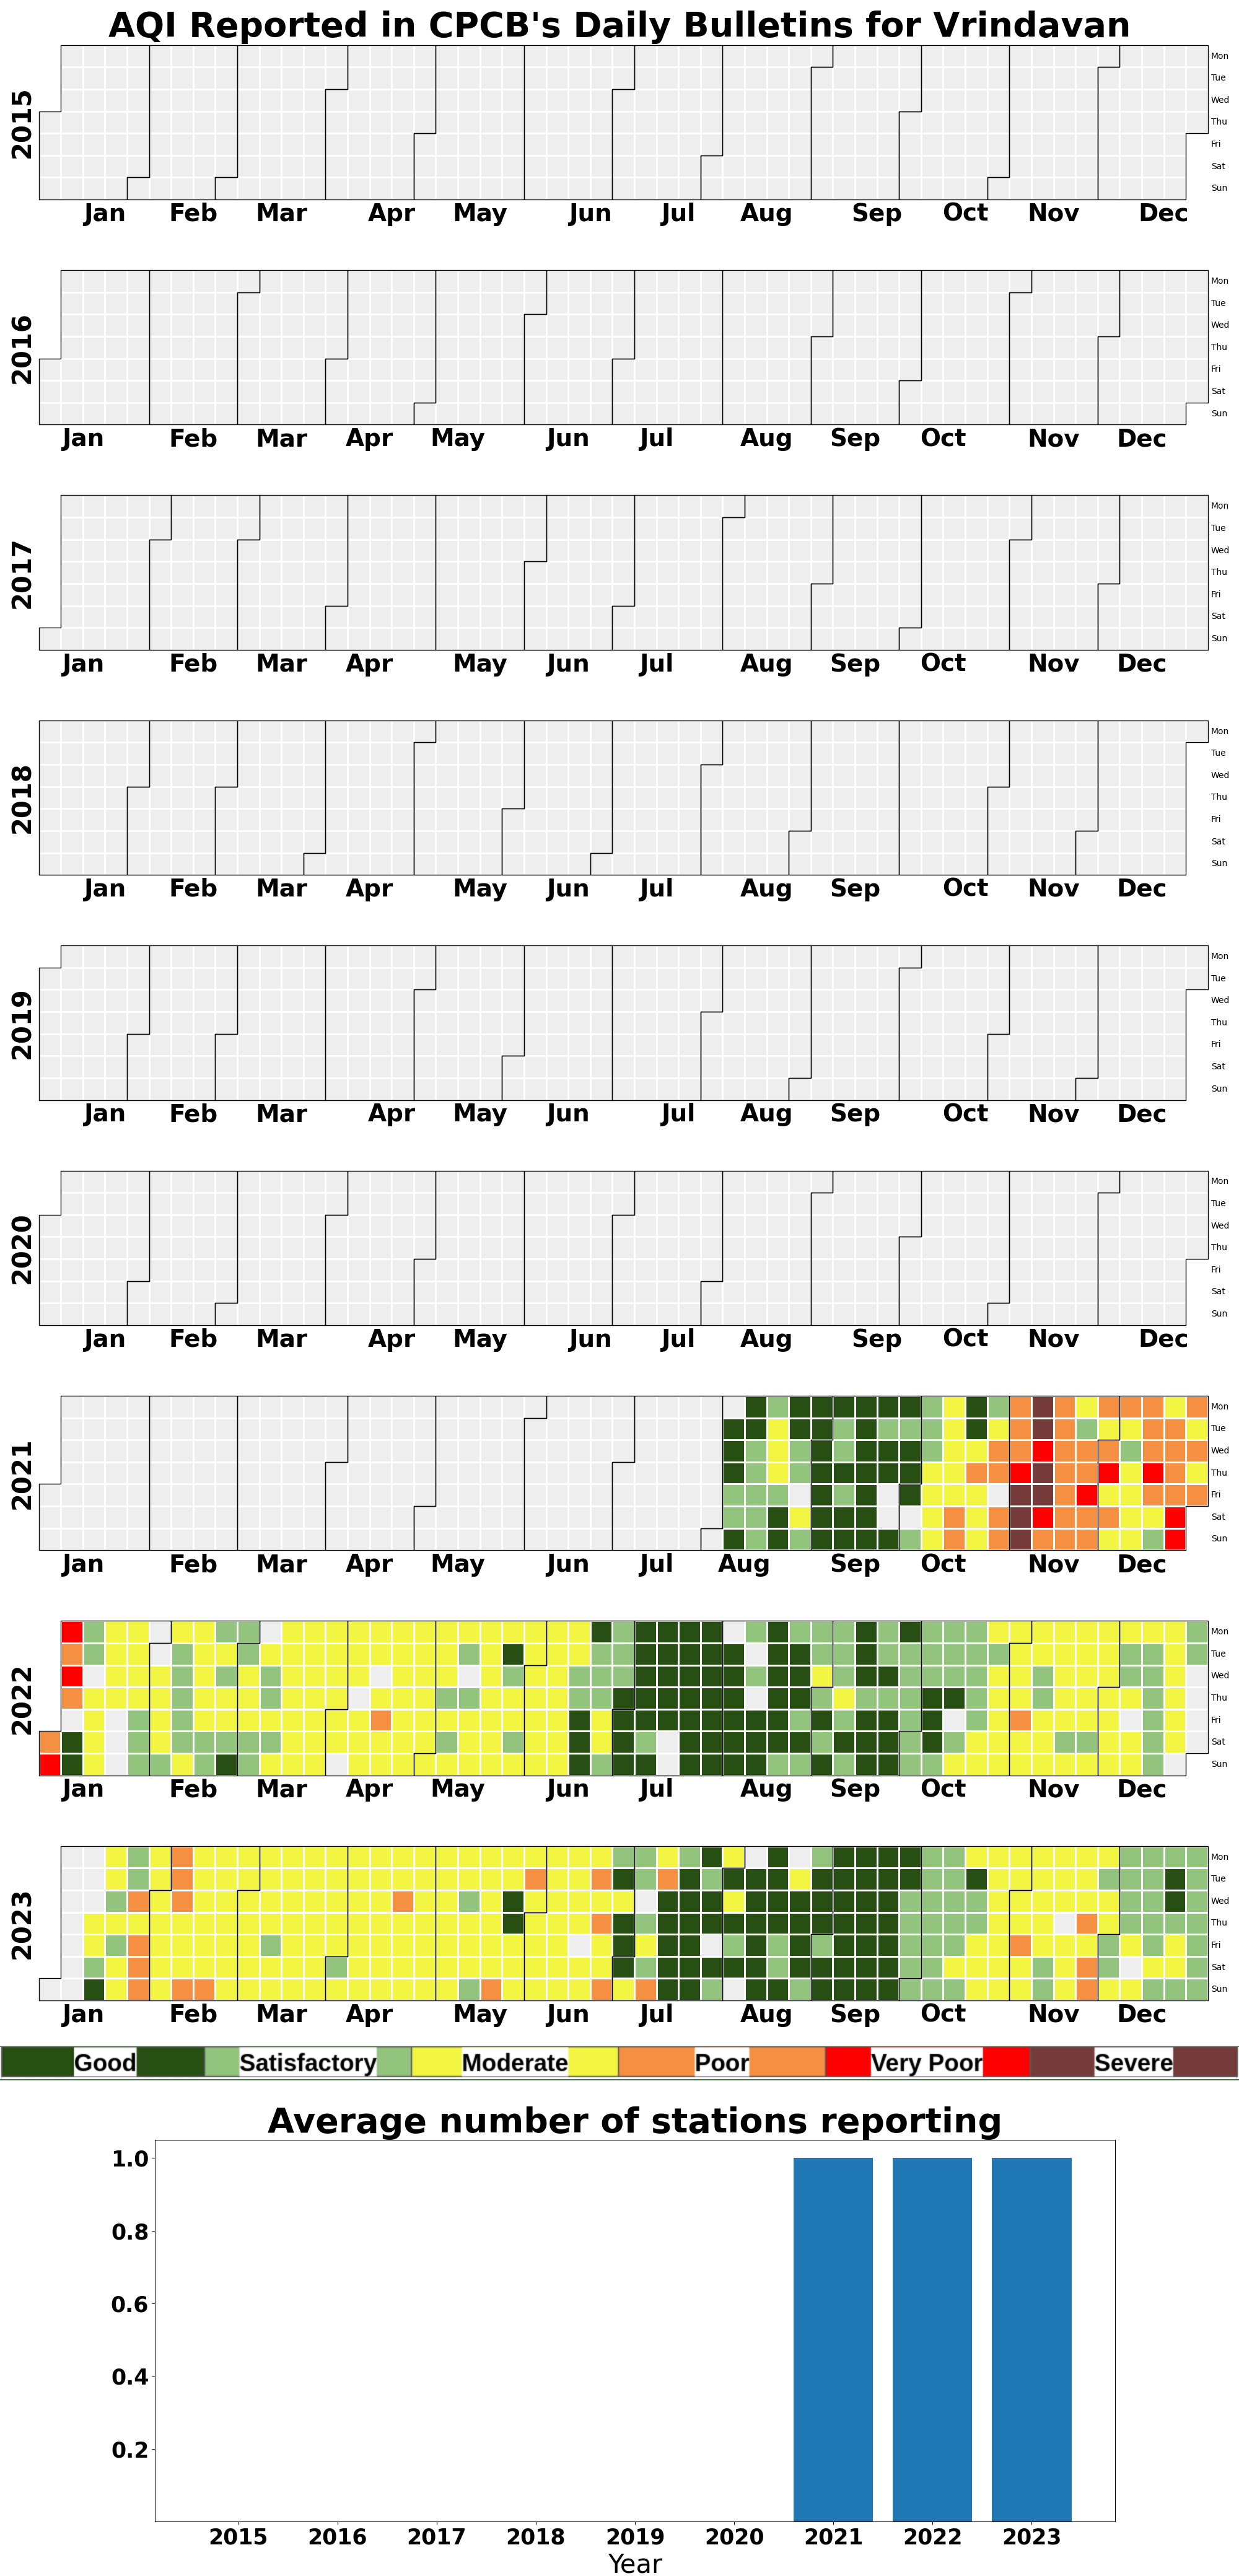
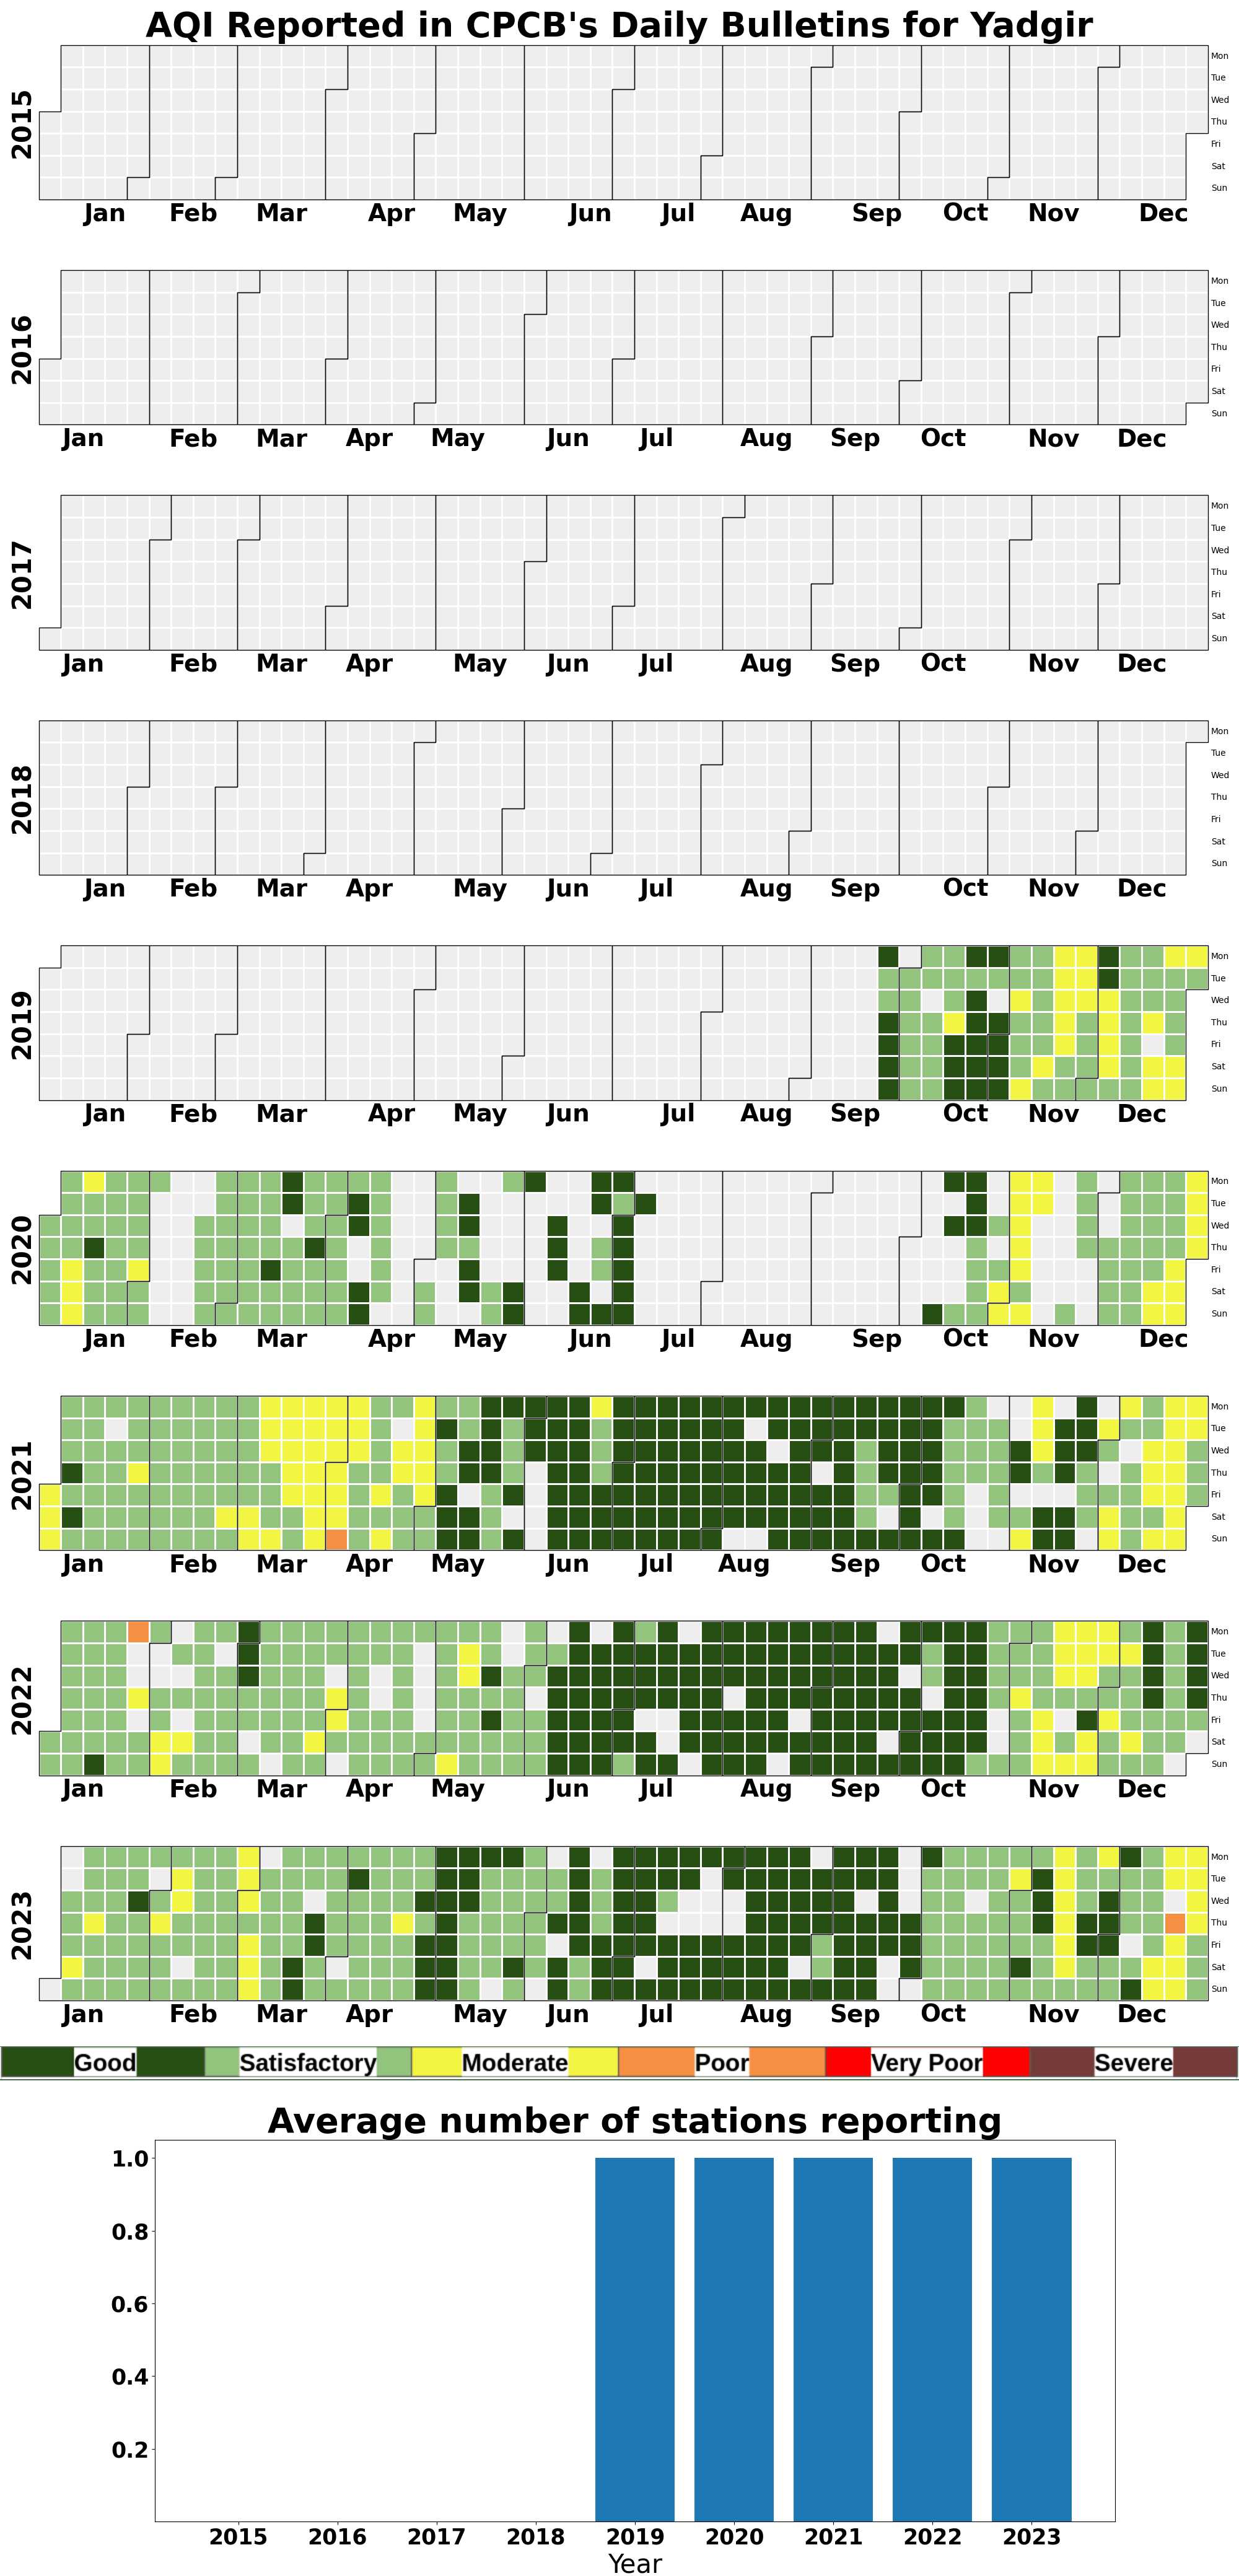
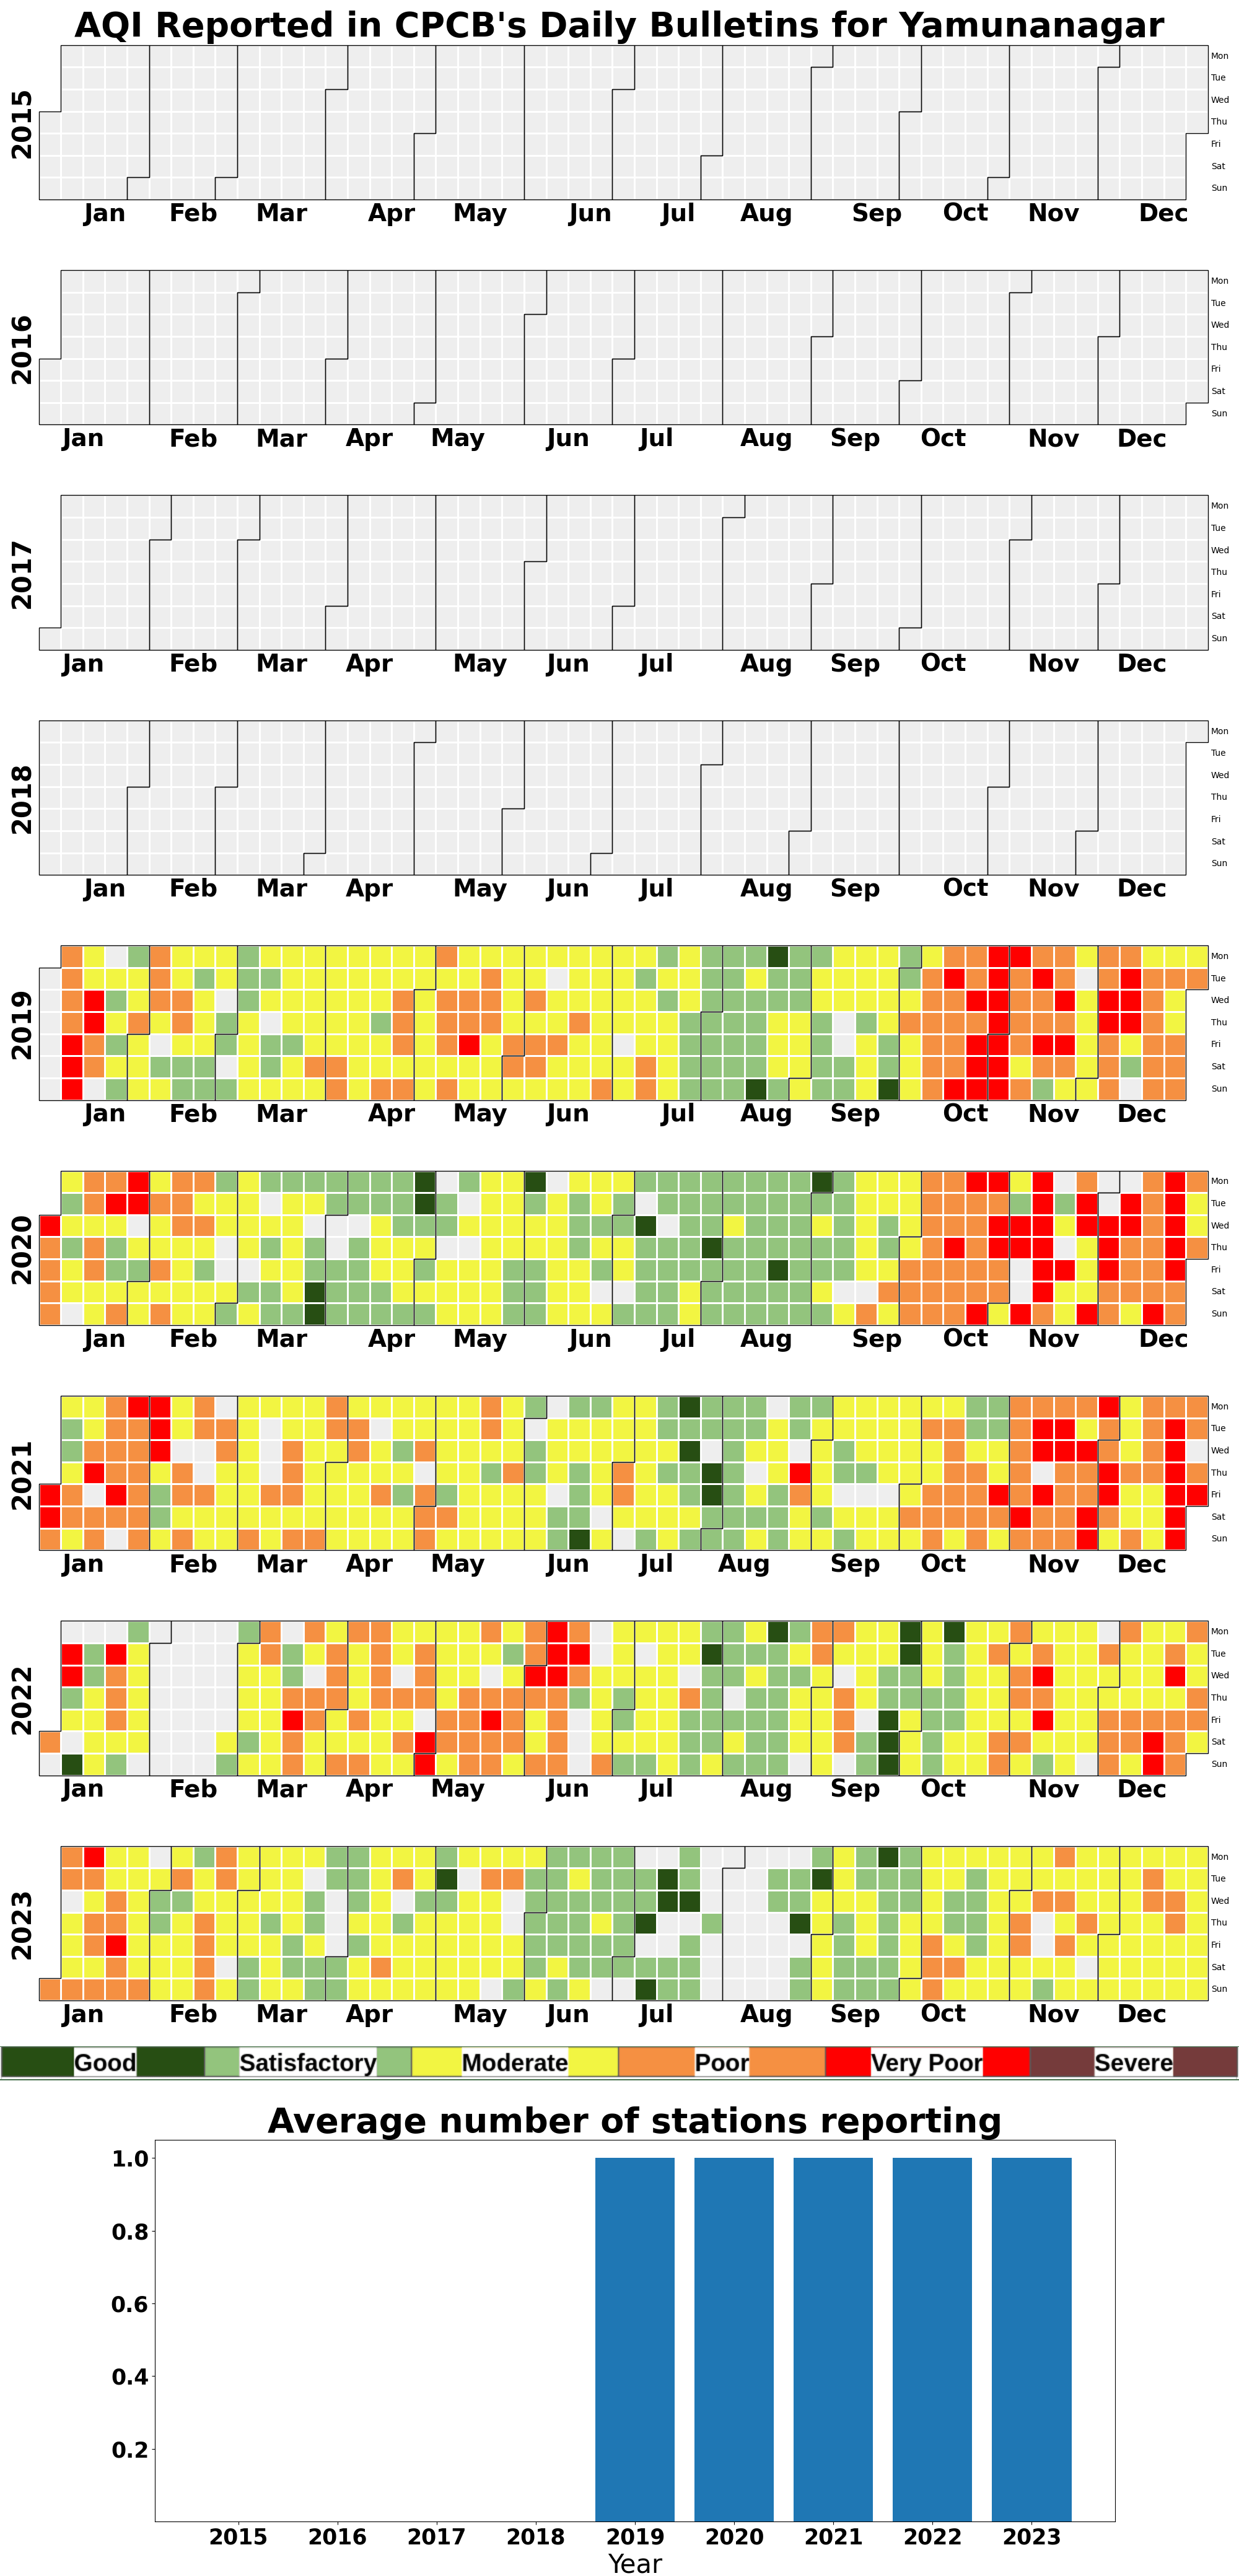
The table below presents a summary of AQI Daily bulletins released by the Central Pollution Control Board (CPCB) since 2015. The CSV file contains (available) day-wise city-average AQI value, AQI category, and conditional pollutant information and the image is a calendar plot of the AQI values, along with the average number of stations reporting AQI value in each year. Click on the image to access the full working paper.
- AQI methodology was notified in 2014
- Number of unique cities in the 2015 bulletins = 22
- Number of unique cities in the 2023 bulletins = 271
- CPCB AQI Daily Bulletins archive as PDFs (last accessed March 27, 2024)
- A calculator designed to use monitoring or modeling data to estimate either real time or archived or forecasted AQI — [Link] to download the code, instructions, and videos.
- Code for parsing PDFs and archiving the data is on [github]
- Working papers (click here for PDFs)
- Series #46-2021: 10 Frequently asked questions on air quality index (AQI)
- Series #47-2024: Air Quality Index Analysis for Indian Cities 2015-2023
- Series #48-2024: Data from small monitoring networks is unreliable: Case of Indian cities
- Series #49-2024: How to spot anomalies in data trends: Evaluating AQI data from Indian cities
- Media posts
- Are we going to be dogmatic about large sample sizes? (Medium)
- Can’t control what you can’t measure: Why India is losing to air pollution (India Today)
- Posters
- IGAC 2024 – Uncertainty of Operating Smaller Number of Ambient Monitoring Stations: Indian Cities from 2015 to 2023 (download)
- Presentation at IndiaFOSS 2025
Back to NCAP data repository.
Use the search window (on top-right of the table) to select specific city or state (for example: Assam)
Daily Air Quality Index (AQI) Data for Indian Cities 2015-2023
| Number | City | State | Calendar Plot | CSV Data |
|---|---|---|---|---|
| 1 | Agartala | Tripura | IMAGE | CSV |
| 2 | Agra | Uttar Pradesh | IMAGE | CSV |
| 3 | Ahmedabad | Gujarat | IMAGE | CSV |
| 4 | Aizawl | Mizoram | IMAGE | CSV |
| 5 | Ajmer | Rajasthan | IMAGE | CSV |
| 6 | Akola | Maharashtra | IMAGE | CSV |
| 7 | Alwar | Rajasthan | IMAGE | CSV |
| 8 | Amaravati | Andhra Pradesh | IMAGE | CSV |
| 9 | Ambala | Punjab | IMAGE | CSV |
| 10 | Amravati | Maharashtra | IMAGE | CSV |
| 11 | Amritsar | Punjab | IMAGE | CSV |
| 12 | Anantapur | Andhra Pradesh | IMAGE | CSV |
| 13 | Angul | Odisha | IMAGE | CSV |
| 14 | Ankleshwar | Gujarat | IMAGE | CSV |
| 15 | Araria | Bihar | IMAGE | CSV |
| 16 | Ariyalur | Tamil Nadu | IMAGE | CSV |
| 17 | Arrah | Bihar | IMAGE | CSV |
| 18 | Asansol | West Bengal | IMAGE | CSV |
| 19 | Aurangabad | Maharashtra | IMAGE | CSV |
| 20 | Aurangabad (Bihar) | Bihar | IMAGE | CSV |
| 21 | Baddi | Himachal Pradesh | IMAGE | CSV |
| 22 | Badlapur | Maharashtra | IMAGE | CSV |
| 23 | Bagalkot | Karnataka | IMAGE | CSV |
| 24 | Baghpat | Uttar Pradesh | IMAGE | CSV |
| 25 | Bahadurgarh | Haryana | IMAGE | CSV |
| 26 | Balasore | Odisha | IMAGE | CSV |
| 27 | Ballabgarh | Haryana | IMAGE | CSV |
| 28 | Banswara | Rajasthan | IMAGE | CSV |
| 29 | Baran | Rajasthan | IMAGE | CSV |
| 30 | Barbil | Odisha | IMAGE | CSV |
| 31 | Bareilly | Uttar Pradesh | IMAGE | CSV |
| 32 | Baripada | Odisha | IMAGE | CSV |
| 33 | Barmer | Rajasthan | IMAGE | CSV |
| 34 | Barrackpore | West Bengal | IMAGE | CSV |
| 35 | Bathinda | Punjab | IMAGE | CSV |
| 36 | Begusarai | Bihar | IMAGE | CSV |
| 37 | Belapur | Maharashtra | IMAGE | CSV |
| 38 | Belgaum | Karnataka | IMAGE | CSV |
| 39 | Bengaluru | Karnataka | IMAGE | CSV |
| 40 | Bettiah | Bihar | IMAGE | CSV |
| 41 | Bhagalpur | Bihar | IMAGE | CSV |
| 42 | Bharatpur | Rajasthan | IMAGE | CSV |
| 43 | Bhilai | Chhattisgarh | IMAGE | CSV |
| 44 | Bhilwara | Rajasthan | IMAGE | CSV |
| 45 | Bhiwadi | Rajasthan | IMAGE | CSV |
| 46 | Bhiwandi | Maharashtra | IMAGE | CSV |
| 47 | Bhiwani | Haryana | IMAGE | CSV |
| 48 | Bhopal | Madhya Pradesh | IMAGE | CSV |
| 49 | Bhubaneswar | Odisha | IMAGE | CSV |
| 50 | Bidar | Karnataka | IMAGE | CSV |
| 51 | Bihar Sharif | Bihar | IMAGE | CSV |
| 52 | Bikaner | Rajasthan | IMAGE | CSV |
| 53 | Bilaspur | Chhattisgarh | IMAGE | CSV |
| 54 | Bileipada | Odisha | IMAGE | CSV |
| 55 | Brajrajnagar | Odisha | IMAGE | CSV |
| 56 | Bulandshahr | Uttar Pradesh | IMAGE | CSV |
| 57 | Bundi | Rajasthan | IMAGE | CSV |
| 58 | Buxar | Bihar | IMAGE | CSV |
| 59 | Byasanagar | Odisha | IMAGE | CSV |
| 60 | Byrnihat | Meghalaya | IMAGE | CSV |
| 61 | Chamarajanagar | Karnataka | IMAGE | CSV |
| 62 | Chandigarh | Chandigarh | IMAGE | CSV |
| 63 | Chandrapur | Maharashtra | IMAGE | CSV |
| 64 | Charkhi Dadri | Haryana | IMAGE | CSV |
| 65 | Chengalpattu | Tamil Nadu | IMAGE | CSV |
| 66 | Chennai | Tamil Nadu | IMAGE | CSV |
| 67 | Chhal | Madhya Pradesh | IMAGE | CSV |
| 68 | Chhapra | Bihar | IMAGE | CSV |
| 69 | Chikkaballapur | Karnataka | IMAGE | CSV |
| 70 | Chikkamagaluru | Karnataka | IMAGE | CSV |
| 71 | Chittoor | Andhra Pradesh | IMAGE | CSV |
| 72 | Chittorgarh | Rajasthan | IMAGE | CSV |
| 73 | Churu | Rajasthan | IMAGE | CSV |
| 74 | Coimbatore | Tamil Nadu | IMAGE | CSV |
| 75 | Cuddalore | Tamil Nadu | IMAGE | CSV |
| 76 | Cuttack | Odisha | IMAGE | CSV |
| 77 | Damoh | Madhya Pradesh | IMAGE | CSV |
| 78 | Darbhanga | Bihar | IMAGE | CSV |
| 79 | Dausa | Rajasthan | IMAGE | CSV |
| 80 | Davanagere | Karnataka | IMAGE | CSV |
| 81 | Dehradun | Uttarakhand | IMAGE | CSV |
| 82 | Delhi | Delhi | IMAGE | CSV |
| 83 | Dewas | Madhya Pradesh | IMAGE | CSV |
| 84 | Dhanbad | Jharkhand | IMAGE | CSV |
| 85 | Dharuhera | Haryana | IMAGE | CSV |
| 86 | Dharwad | Karnataka | IMAGE | CSV |
| 87 | Dholpur | Rajasthan | IMAGE | CSV |
| 88 | Dhule | Maharashtra | IMAGE | CSV |
| 89 | Dindigul | Tamil Nadu | IMAGE | CSV |
| 90 | Durgapur | wea | IMAGE | CSV |
| 91 | Eloor | Kerala | IMAGE | CSV |
| 92 | Ernakulam | Kerala | IMAGE | CSV |
| 93 | Faridabad | Haryana | IMAGE | CSV |
| 94 | Fatehabad | Haryana | IMAGE | CSV |
| 95 | Firozabad | Uttar Pradesh | IMAGE | CSV |
| 96 | Gadag | Karnataka | IMAGE | CSV |
| 97 | GandhiNagar | Gujarat | IMAGE | CSV |
| 98 | Gangtok | Sikkim | IMAGE | CSV |
| 99 | Gaya | Bihar | IMAGE | CSV |
| 100 | Ghaziabad | Uttar Pradesh | IMAGE | CSV |
| 101 | Gorakhpur | Uttar Pradesh | IMAGE | CSV |
| 102 | Greater Noida | Uttar Pradesh | IMAGE | CSV |
| 103 | Gummidipoondi | Tamil Nadu | IMAGE | CSV |
| 104 | Gurugram | Haryana | IMAGE | CSV |
| 105 | Guwahati | Assam | IMAGE | CSV |
| 106 | Gwalior | Madhya Pradesh | IMAGE | CSV |
| 107 | Hajipur | Bihar | IMAGE | CSV |
| 108 | Haldia | West Bengal | IMAGE | CSV |
| 109 | Hanumangarh | Rajasthan | IMAGE | CSV |
| 110 | Hapur | Uttar Pradesh | IMAGE | CSV |
| 111 | Hassan | Karnataka | IMAGE | CSV |
| 112 | Haveri | Karnataka | IMAGE | CSV |
| 113 | Hisar | Haryana | IMAGE | CSV |
| 114 | Hosur | Tamil Nadu | IMAGE | CSV |
| 115 | Howrah | West Bengal | IMAGE | CSV |
| 116 | Hubballi | Karnataka | IMAGE | CSV |
| 117 | Hyderabad | Telangana | IMAGE | CSV |
| 118 | Imphal | Manipur | IMAGE | CSV |
| 119 | Indore | Madhya Pradesh | IMAGE | CSV |
| 120 | Jabalpur | Madhya Pradesh | IMAGE | CSV |
| 121 | Jaipur | Rajasthan | IMAGE | CSV |
| 122 | Jaisalmer | Rajasthan | IMAGE | CSV |
| 123 | Jalandhar | Punjab | IMAGE | CSV |
| 124 | Jalgaon | Maharashtra | IMAGE | CSV |
| 125 | Jalna | Maharashtra | IMAGE | CSV |
| 126 | Jalore | Rajasthan | IMAGE | CSV |
| 127 | Jhalawar | Rajasthan | IMAGE | CSV |
| 128 | Jhansi | Uttar Pradesh | IMAGE | CSV |
| 129 | Jharsuguda | Odisha | IMAGE | CSV |
| 130 | Jhunjhunu | Rajasthan | IMAGE | CSV |
| 131 | Jind | Haryana | IMAGE | CSV |
| 132 | Jodhpur | Rajasthan | IMAGE | CSV |
| 133 | Jorapokhar | Jharkhand | IMAGE | CSV |
| 134 | Kadapa | Andhra Pradesh | IMAGE | CSV |
| 135 | Kaithal | Haryana | IMAGE | CSV |
| 136 | Kalaburagi | Karnataka | IMAGE | CSV |
| 137 | Kalyan | Maharashtra | IMAGE | CSV |
| 138 | Kanchipuram | Tamil Nadu | IMAGE | CSV |
| 139 | Kannur | Kerala | IMAGE | CSV |
| 140 | Kanpur | Uttar Pradesh | IMAGE | CSV |
| 141 | Karauli | Rajasthan | IMAGE | CSV |
| 142 | Karnal | Haryana | IMAGE | CSV |
| 143 | Karwar | Karnataka | IMAGE | CSV |
| 144 | Kashipur | Uttarakhand | IMAGE | CSV |
| 145 | Katihar | Bihar | IMAGE | CSV |
| 146 | Katni | Madhya Pradesh | IMAGE | CSV |
| 147 | Keonjhar | Odisha | IMAGE | CSV |
| 148 | Khanna | Punjab | IMAGE | CSV |
| 149 | Khurja | Uttar Pradesh | IMAGE | CSV |
| 150 | Kishanganj | Bihar | IMAGE | CSV |
| 151 | Kochi | Kerala | IMAGE | CSV |
| 152 | Kohima | Nagaland | IMAGE | CSV |
| 153 | Kolar | Karnataka | IMAGE | CSV |
| 154 | Kolhapur | Maharashtra | IMAGE | CSV |
| 155 | Kolkata | West Bengal | IMAGE | CSV |
| 156 | Kollam | Kerala | IMAGE | CSV |
| 157 | Koppal | Karnataka | IMAGE | CSV |
| 158 | Korba | Chhattisgarh | IMAGE | CSV |
| 159 | Kota | Rajasthan | IMAGE | CSV |
| 160 | Kozhikode | Kerala | IMAGE | CSV |
| 161 | Kunjemura | Odisha | IMAGE | CSV |
| 162 | Kurukshetra | Haryana | IMAGE | CSV |
| 163 | Latur | Maharashtra | IMAGE | CSV |
| 164 | Loni_Dehat | Uttar Pradesh | IMAGE | CSV |
| 165 | Loni_Ghaziabad | Uttar Pradesh | IMAGE | CSV |
| 166 | Lucknow | Uttar Pradesh | IMAGE | CSV |
| 167 | Ludhiana | Punjab | IMAGE | CSV |
| 168 | Madikeri | Karnataka | IMAGE | CSV |
| 169 | Mahad | Maharashtra | IMAGE | CSV |
| 170 | Maihar | Madhya Pradesh | IMAGE | CSV |
| 171 | Mandi Gobindgarh | Punjab | IMAGE | CSV |
| 172 | Mandideep | Madhya Pradesh | IMAGE | CSV |
| 173 | Mandikhera | Haryana | IMAGE | CSV |
| 174 | Manesar | Haryana | IMAGE | CSV |
| 175 | Mangalore | Karnataka | IMAGE | CSV |
| 176 | Manguraha | Uttar Pradesh | IMAGE | CSV |
| 177 | Medikeri | Karnataka | IMAGE | CSV |
| 178 | Meerut | Uttar Pradesh | IMAGE | CSV |
| 179 | Milupara | Chhattisgarh | IMAGE | CSV |
| 180 | Moradabad | Uttar Pradesh | IMAGE | CSV |
| 181 | Motihari | Bihar | IMAGE | CSV |
| 182 | Mumbai | Maharashtra | IMAGE | CSV |
| 183 | Munger | Bihar | IMAGE | CSV |
| 184 | Muzaffarnagar | Uttar Pradesh | IMAGE | CSV |
| 185 | Muzaffarpur | Bihar | IMAGE | CSV |
| 186 | Mysuru | Karnataka | IMAGE | CSV |
| 187 | Nagaon | Assam | IMAGE | CSV |
| 188 | Nagaur | Rajasthan | IMAGE | CSV |
| 189 | Nagpur | Maharashtra | IMAGE | CSV |
| 190 | Naharlagun | Arunachal Pradesh | IMAGE | CSV |
| 191 | Nalbari | Assam | IMAGE | CSV |
| 192 | Nanded | Maharashtra | IMAGE | CSV |
| 193 | Nandesari | Gujarat | IMAGE | CSV |
| 194 | Narnaul | Haryana | IMAGE | CSV |
| 195 | Nashik | Maharashtra | IMAGE | CSV |
| 196 | Navi Mumbai | Maharashtra | IMAGE | CSV |
| 197 | Nayagarh | Odisha | IMAGE | CSV |
| 198 | Noida | Uttar Pradesh | IMAGE | CSV |
| 199 | Ooty | Tamil Nadu | IMAGE | CSV |
| 200 | Pali | Rajasthan | IMAGE | CSV |
| 201 | Palkalaiperur | Tamil Nadu | IMAGE | CSV |
| 202 | Palwal | Haryana | IMAGE | CSV |
| 203 | Panchkula | Haryana | IMAGE | CSV |
| 204 | Panipat | Haryana | IMAGE | CSV |
| 205 | Parbhani | Maharashtra | IMAGE | CSV |
| 206 | Patiala | Punjab | IMAGE | CSV |
| 207 | Patna | Bihar | IMAGE | CSV |
| 208 | Pimpri Chinchwad | Maharashtra | IMAGE | CSV |
| 209 | Pithampur | Madhya Pradesh | IMAGE | CSV |
| 210 | Pratapgarh | Uttar Pradesh | IMAGE | CSV |
| 211 | Prayagraj | Uttar Pradesh | IMAGE | CSV |
| 212 | Puducherry | Puducherry | IMAGE | CSV |
| 213 | Pune | Maharashtra | IMAGE | CSV |
| 214 | Purnia | Bihar | IMAGE | CSV |
| 215 | Raichur | Karnataka | IMAGE | CSV |
| 216 | Raipur | Chhattisgarh | IMAGE | CSV |
| 217 | Rairangpur | Odiha | IMAGE | CSV |
| 218 | Rajamahendravaram | Andhra Pradesh | IMAGE | CSV |
| 219 | Rajgir | Bihar | IMAGE | CSV |
| 220 | Rajsamand | Rajasthan | IMAGE | CSV |
| 221 | Ramanagara | Karnataka | IMAGE | CSV |
| 222 | Ramanathapuram | Tamil Nadu | IMAGE | CSV |
| 223 | Ratlam | Madhya Pradesh | IMAGE | CSV |
| 224 | Rishikesh | Uttarakhand | IMAGE | CSV |
| 225 | Rohtak | Haryana | IMAGE | CSV |
| 226 | Rourkela | Odisha | IMAGE | CSV |
| 227 | Rupnagar | Punjab | IMAGE | CSV |
| 228 | Sagar | Madhya Pradesh | IMAGE | CSV |
| 229 | Saharsa | Bihar | IMAGE | CSV |
| 230 | Salem | Tamil Nadu | IMAGE | CSV |
| 231 | Samastipur | Bihar | IMAGE | CSV |
| 232 | Sangli | Maharashtra | IMAGE | CSV |
| 233 | Sasaram | Bihar | IMAGE | CSV |
| 234 | Satna | Madhya Pradesh | IMAGE | CSV |
| 235 | Sawai Madhopur | Rajasthan | IMAGE | CSV |
| 236 | Shillong | Meghalaya | IMAGE | CSV |
| 237 | Shivamogga | Karnataka | IMAGE | CSV |
| 238 | Sikar | Rajasthan | IMAGE | CSV |
| 239 | Silchar | Assam | IMAGE | CSV |
| 240 | Siliguri | West Bengal | IMAGE | CSV |
| 241 | Singrauli | Madhya Pradesh | IMAGE | CSV |
| 242 | Sirohi | Rajasthan | IMAGE | CSV |
| 243 | Sirsa | Haryana | IMAGE | CSV |
| 244 | Sivasagar | Assam | IMAGE | CSV |
| 245 | Siwan | Bihar | IMAGE | CSV |
| 246 | Solapur | Maharashtra | IMAGE | CSV |
| 247 | Sonipat | Haryana | IMAGE | CSV |
| 248 | Sri Ganganagar | Rajasthan | IMAGE | CSV |
| 249 | Srinagar | Jammu Kashmir | IMAGE | CSV |
| 250 | Suakati | West Bengal | IMAGE | CSV |
| 251 | Surat | Gujarat | IMAGE | CSV |
| 252 | Talcher | Odisha | IMAGE | CSV |
| 253 | Tensa | Odisha | IMAGE | CSV |
| 254 | Thane | Maharashtra | IMAGE | CSV |
| 255 | Thiruvananthapuram | Kerala | IMAGE | CSV |
| 256 | Thoothukudi | Tamil Nadu | IMAGE | CSV |
| 257 | Thrissur | Kerala | IMAGE | CSV |
| 258 | Tiruchirappalli | Tamil Nadu | IMAGE | CSV |
| 259 | Tirupati | Andhra Pradesh | IMAGE | CSV |
| 260 | Tirupur | Tamil Nadu | IMAGE | CSV |
| 261 | Tonk | Rajasthan | IMAGE | CSV |
| 262 | Tumakuru | Karnataka | IMAGE | CSV |
| 263 | Tumidih | Jharkhand | IMAGE | CSV |
| 264 | Udaipur | Rajasthan | IMAGE | CSV |
| 265 | Udupi | Karnataka | IMAGE | CSV |
| 266 | Ujjain | Madhya Pradesh | IMAGE | CSV |
| 267 | Ulhasnagar | Maharashtra | IMAGE | CSV |
| 268 | Vapi | Gujarat | IMAGE | CSV |
| 269 | Varanasi | Uttar Pradesh | IMAGE | CSV |
| 270 | Vatva | Gujarat | IMAGE | CSV |
| 271 | Vellore | Tamil Nadu | IMAGE | CSV |
| 272 | Vijayapura | Karnataka | IMAGE | CSV |
| 273 | Vijayawada | Andhra Pradesh | IMAGE | CSV |
| 274 | Visakhapatnam | Andhra Pradesh | IMAGE | CSV |
| 275 | Vrindavan | Uttar Pradesh | IMAGE | CSV |
| 276 | Yadgir | Karnataka | IMAGE | CSV |
| 277 | Yamunanagar | Haryana | IMAGE | CSV |
_calendarhm_stations.png)