January 2026
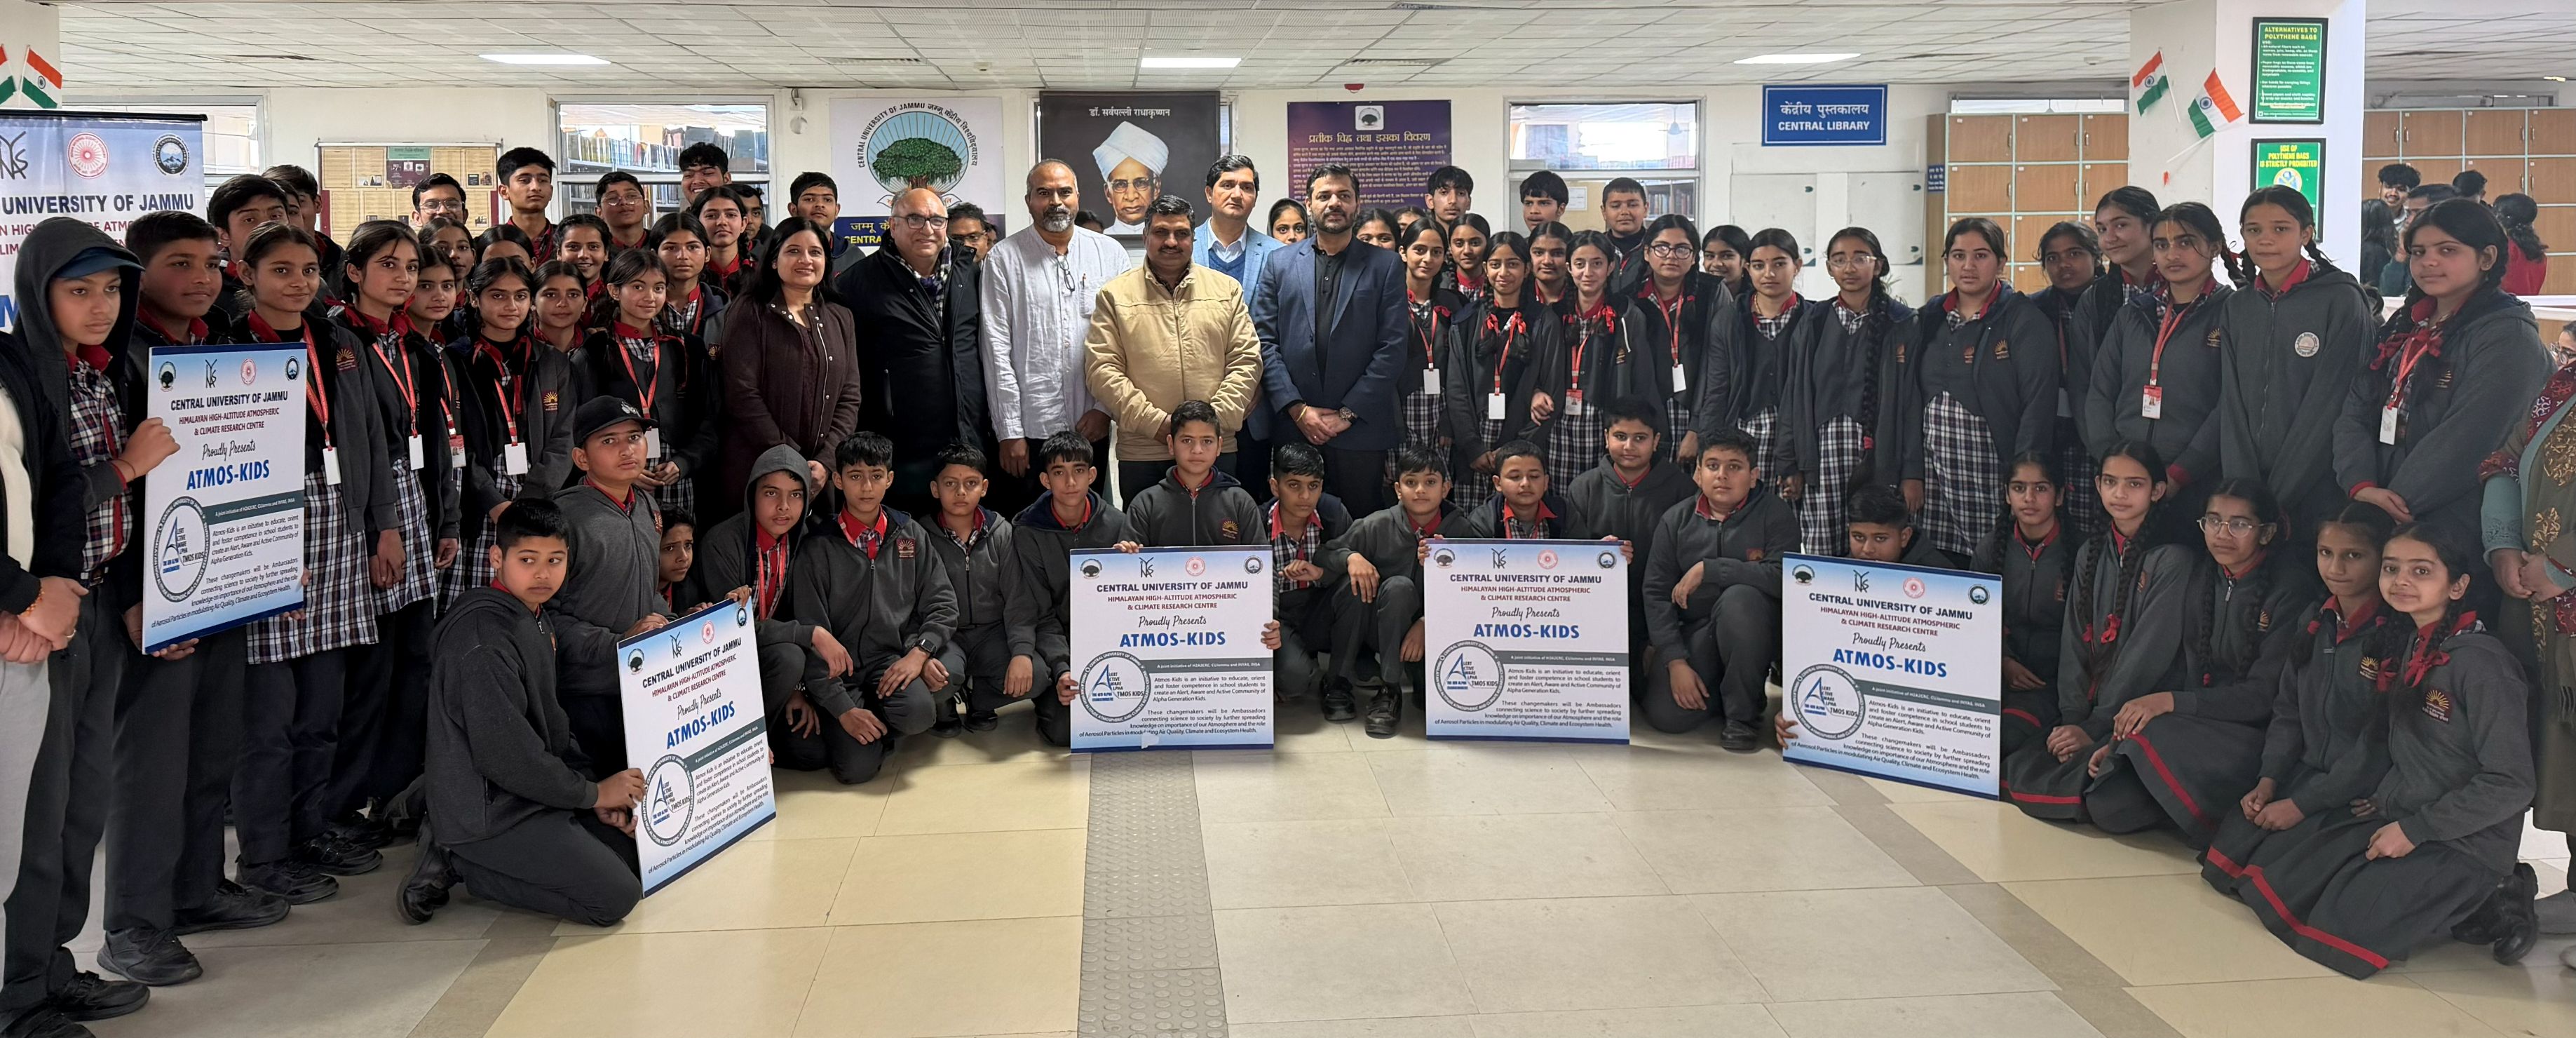
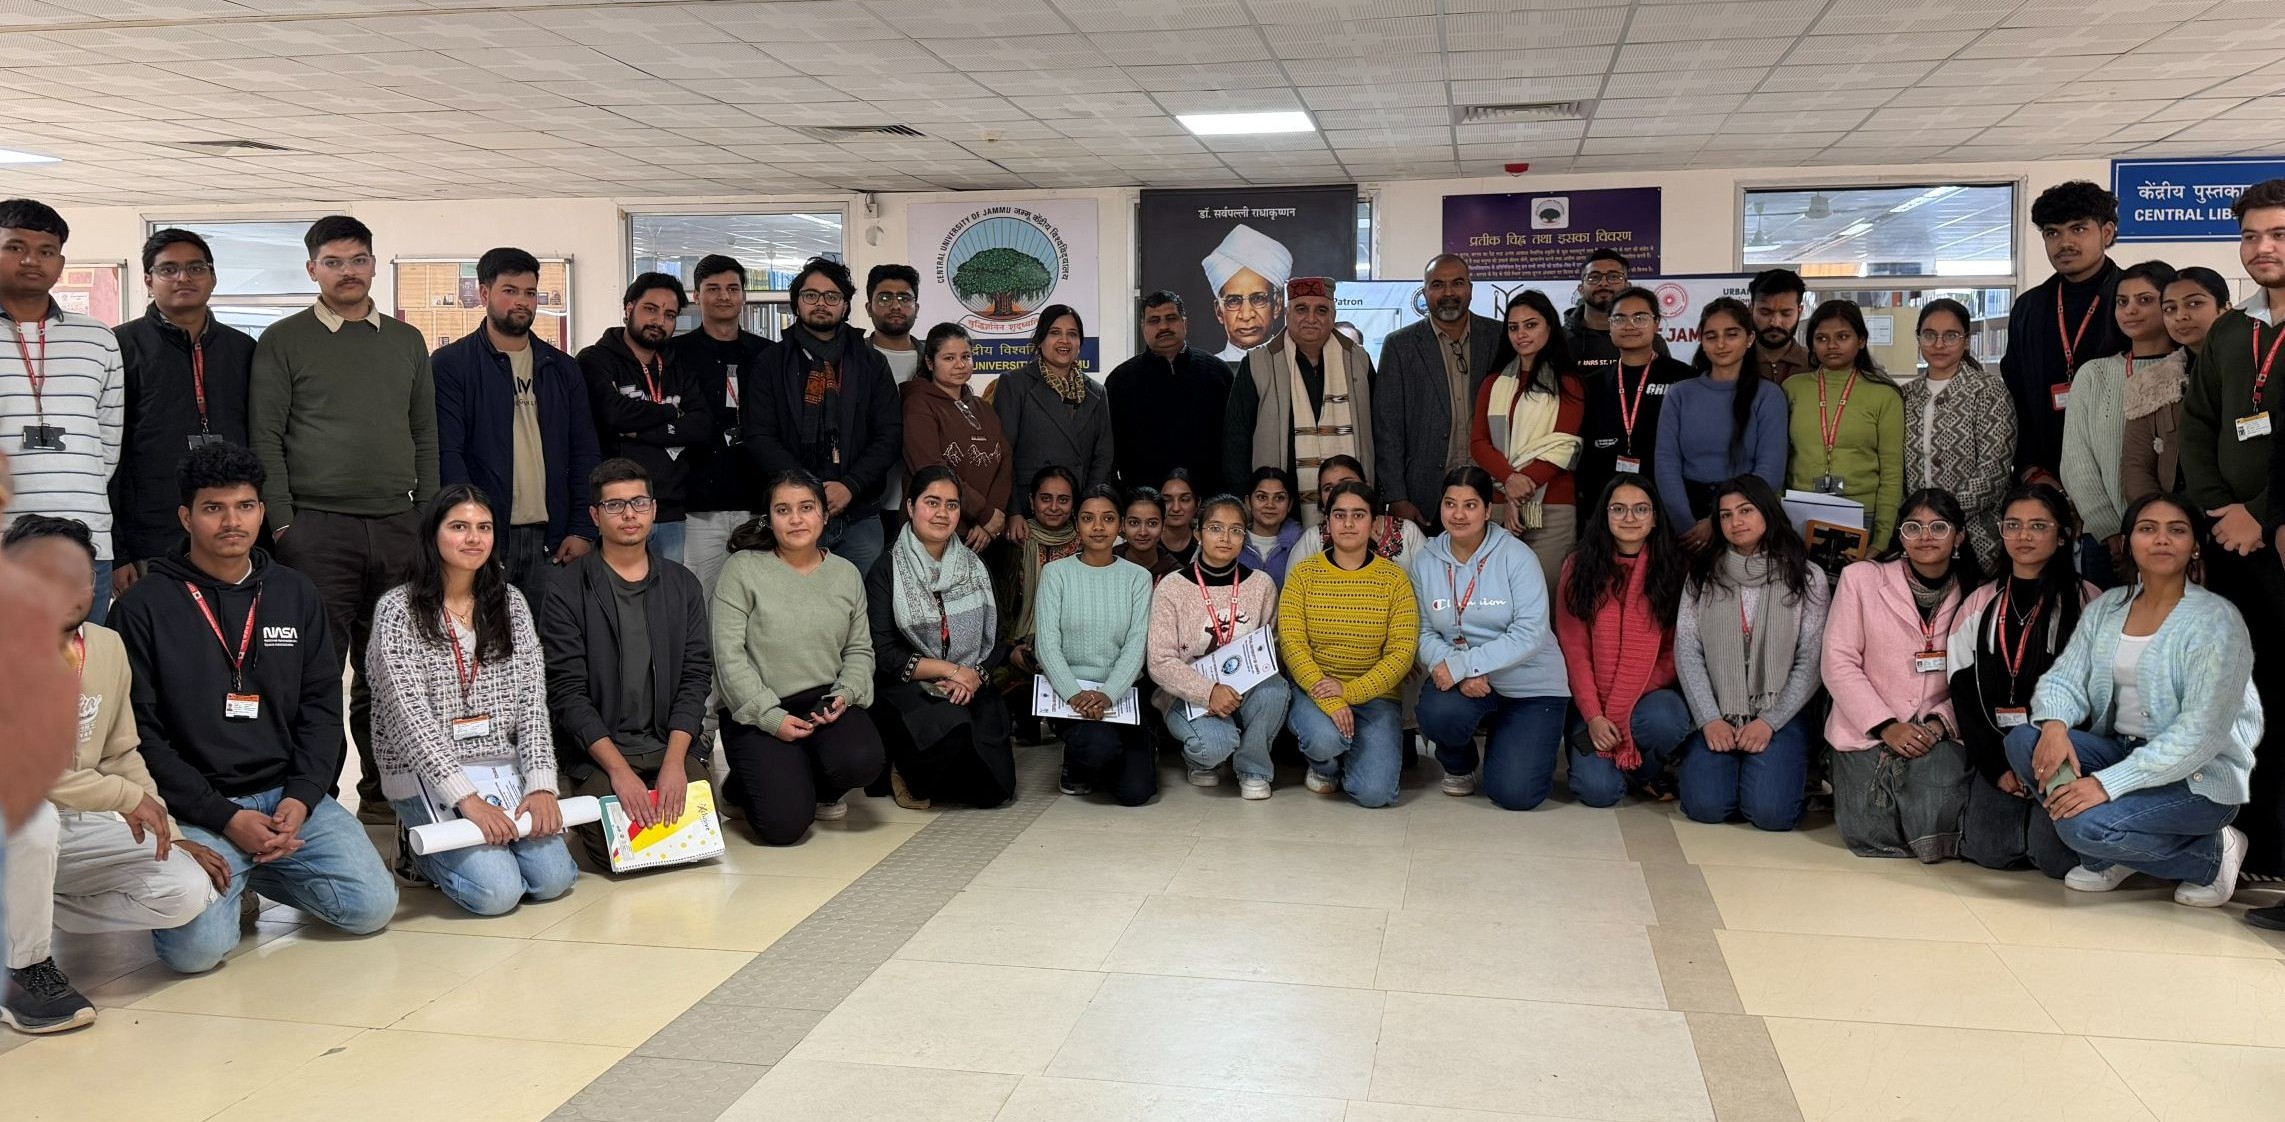
This 2-day event covered high-school students on day-one and UG/PG students on day-two. This is an awareness course, showing students how information can be used for emissions and pollution modeling. This 101-style course connects the-dots work on air quality management, basics, all without using PowerPoints — we used quizzes, games, and hands-on exercises to ensure that the content is not just accepted, but truly understood by the end.
For example, Jeopardy game was customized for the audience. Here is one we used for the high-school event. https://jeopardylabs.com/play/ueinfo-hs1
 |
 |
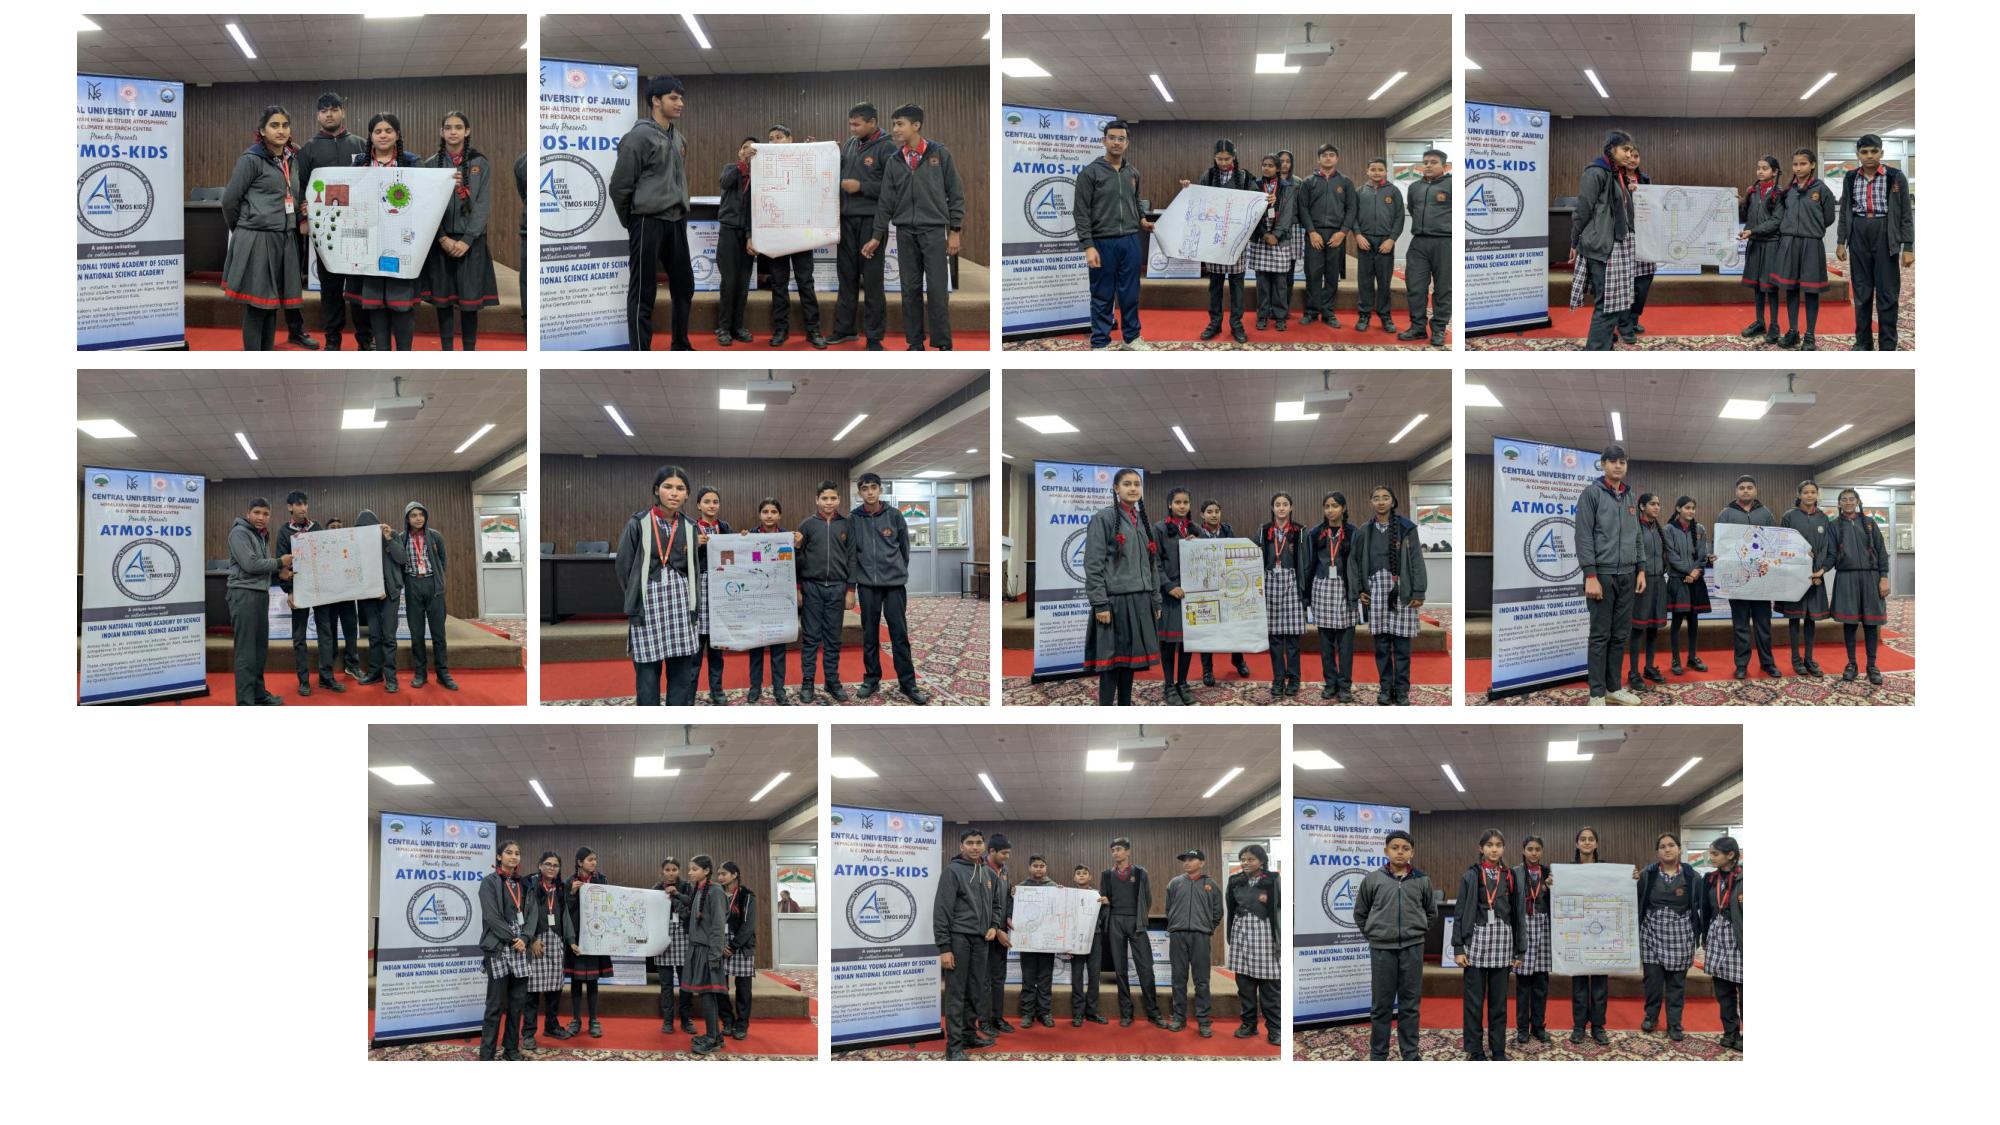
One of the exercises we did was “Map Your Community”. The kids can map anything: their school, their commute from school to home, a park they hang out at, or a lake they visit. At the end of the drawing, they have to tell us two things they don’t like about what they’ve mapped, and how they would address it. So, if 10 people come up with 10 maps, identify 10 problems, and list solutions — or at least what they want changed — that, at its core, is urban planning. We are trying to make that case without lecturing them on urban planning. The main point is teaching them what goes into it: identifying problems at the community level and addressing them in a way that benefits everybody.
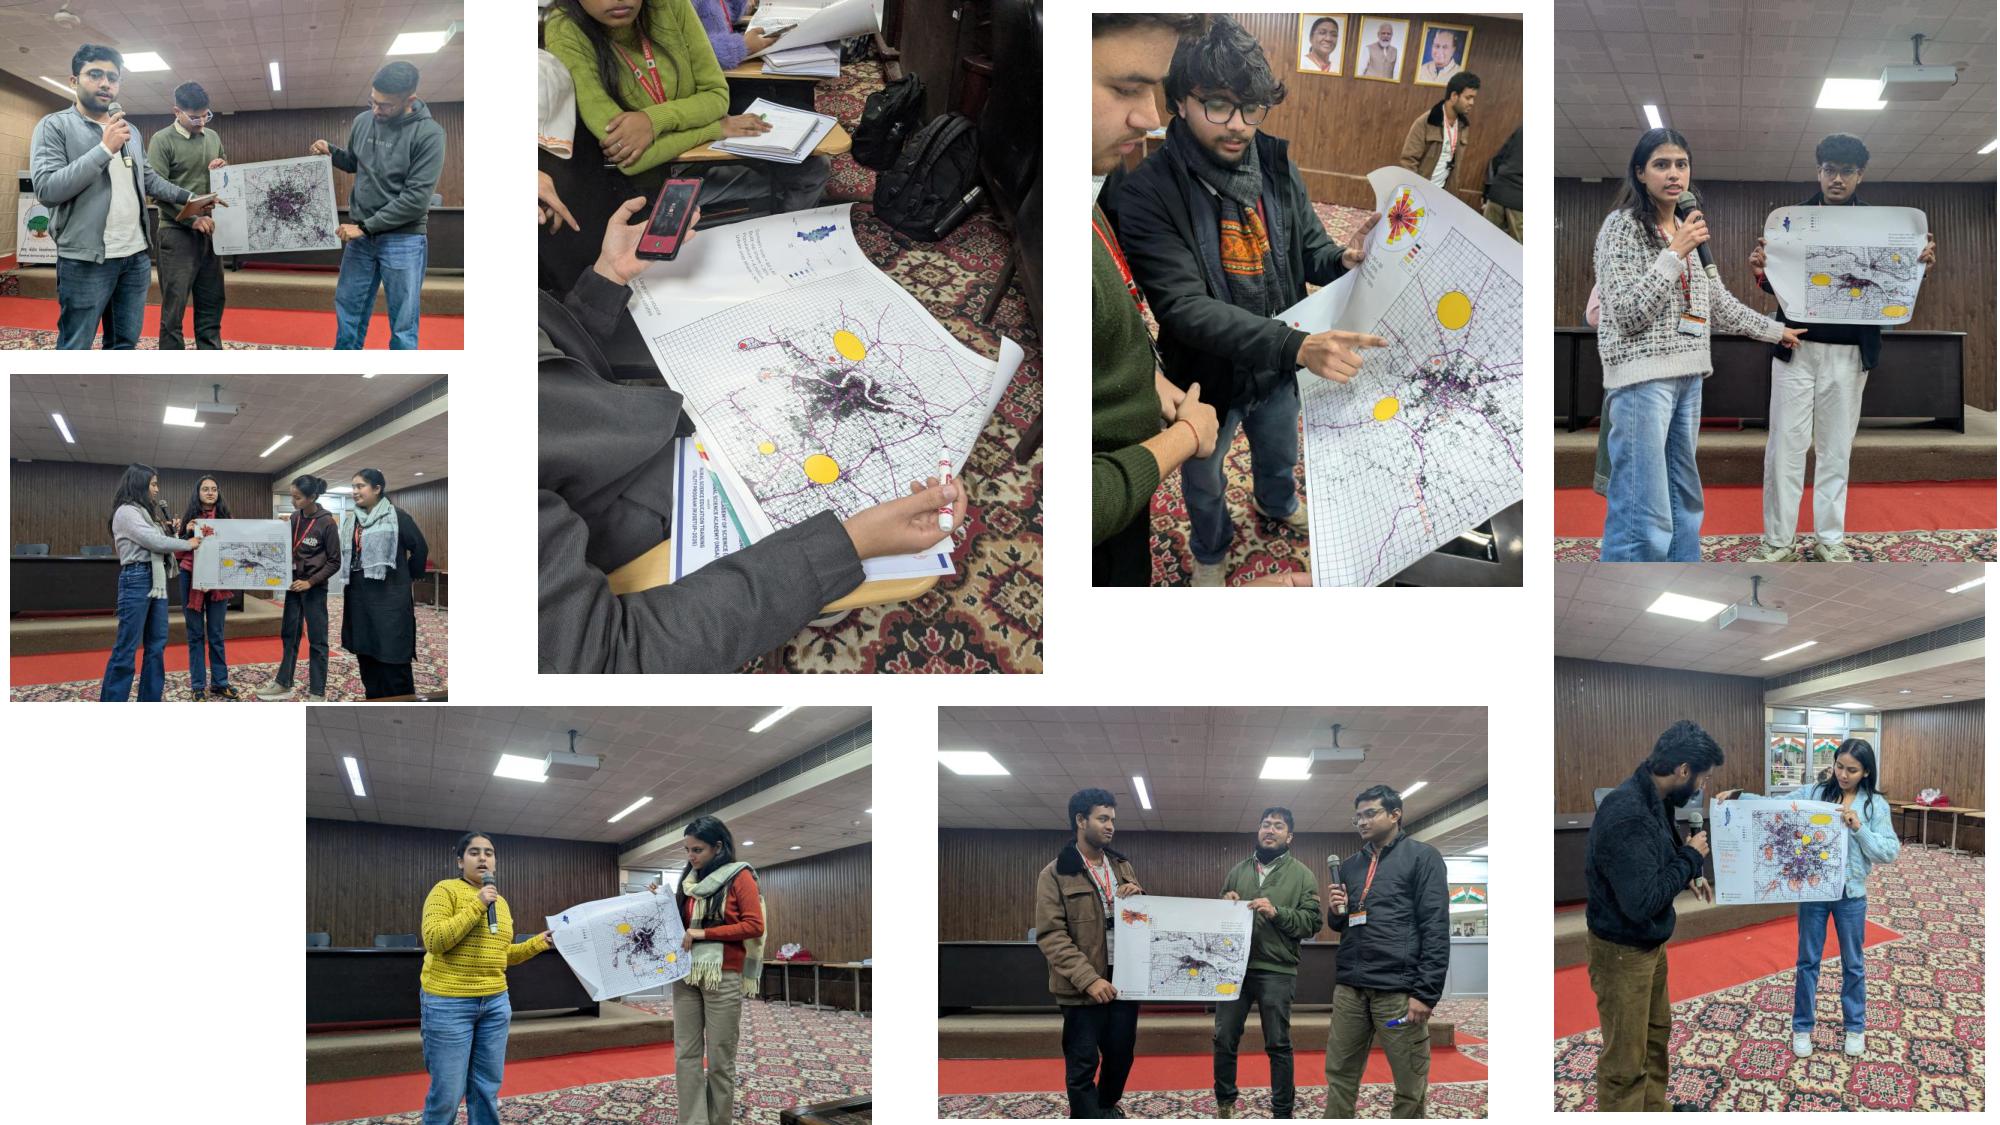
Another mapping exercise with the advanced students, we gave everyone a city map along with the statistics associated with that city. They were then given two problems. First, with a budget constraint and only two monitoring stations, where would they place them to get adequate representativeness? Second, if they had 10 stations, where would they place them for good spatial and temporal resolution of the problem? Before this exercise, students are given a primer on the thumb rules of monitoring — where to place stations, how to place them, what constitutes a representative sample, and so on. So we do go through that material first.
 |
 |