
 Release Date: 2026.08.20
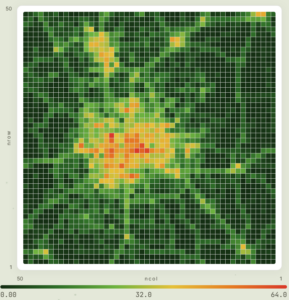
Multiplying three numbers to get total emissions for a city, region, or country is a straightforward process, though it includes some uncertainties. At the block level, we can access activity data and apply emission factors, then multiply them to get a total emissions number. Distributing these emissions spatially across a grid is where the process gets complicated. AQ-MESH uses proxies to visualize this spatial allocation, and with these options, one can evaluate the uncertainty of the spatial weights while identifying pollution hotspots and eventually their policy implications.
Tool repository on github — https://urbanemissionsinfo.github.io/AQMESH
Tools repository in excel form — https://urbanemissions.info/tools
These tools are concept-building components of AQ-AWARE: Air Quality Awareness, Readiness, and Education modules.
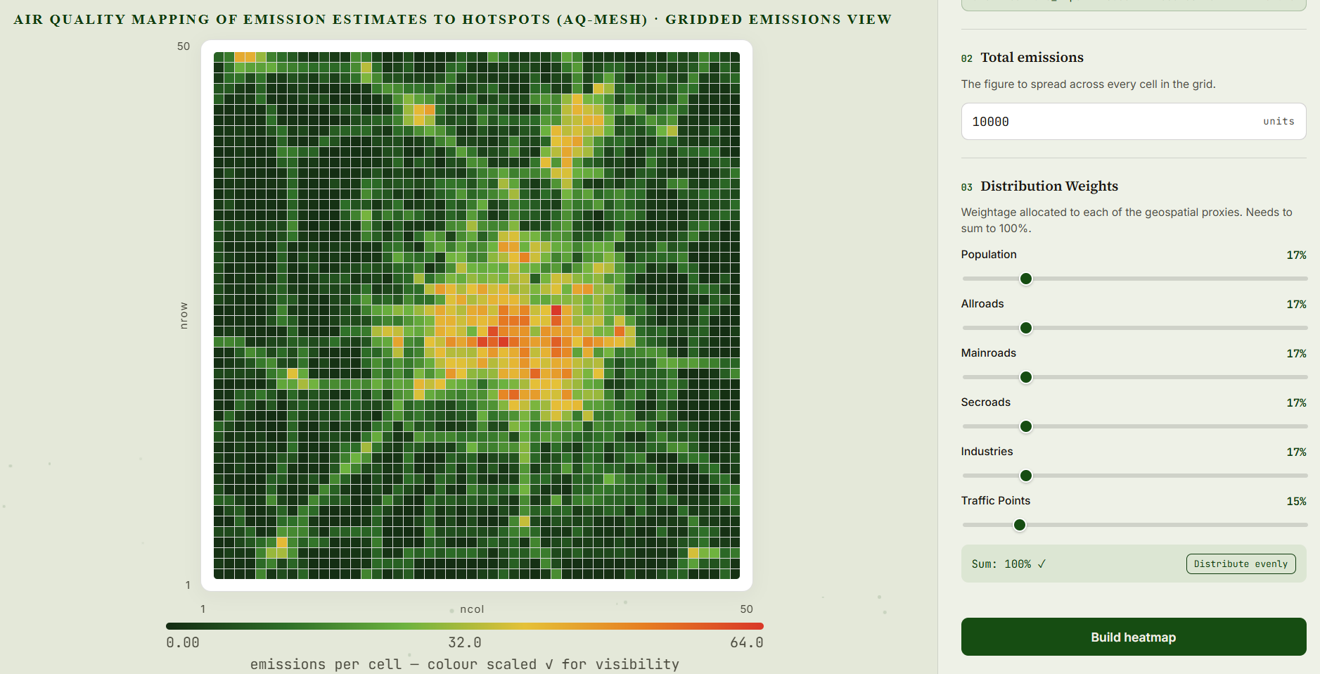
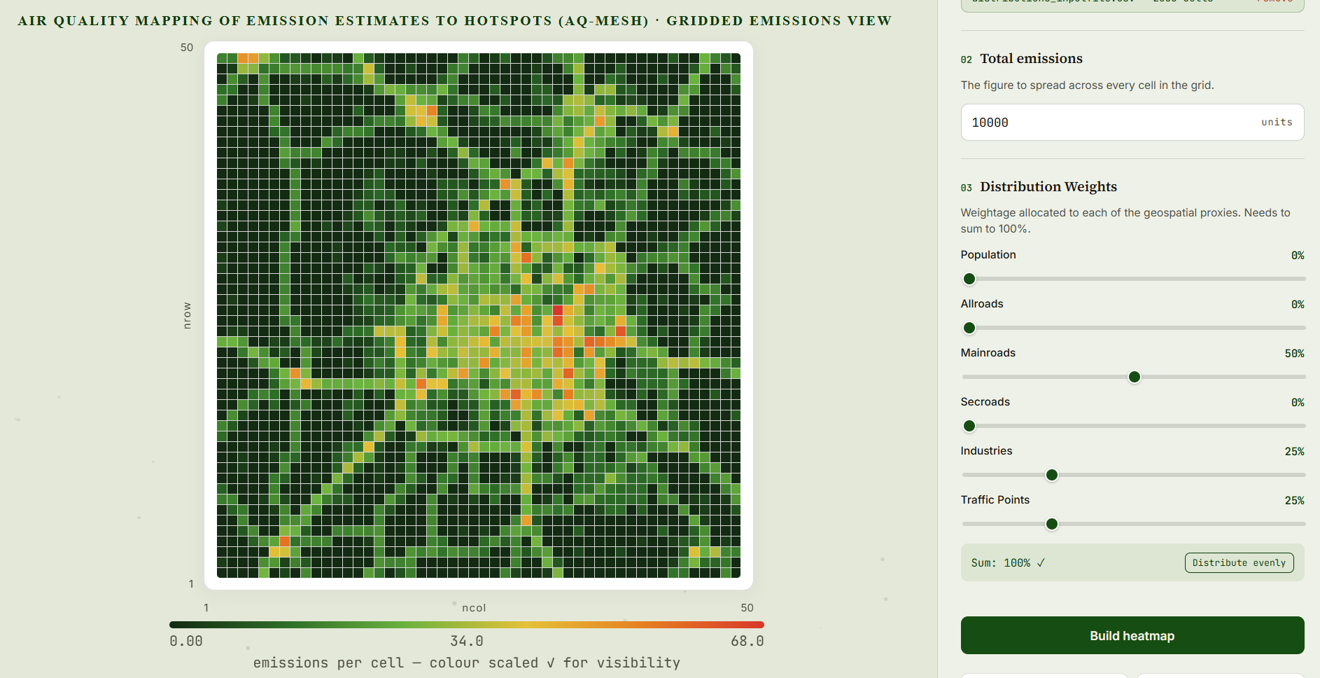
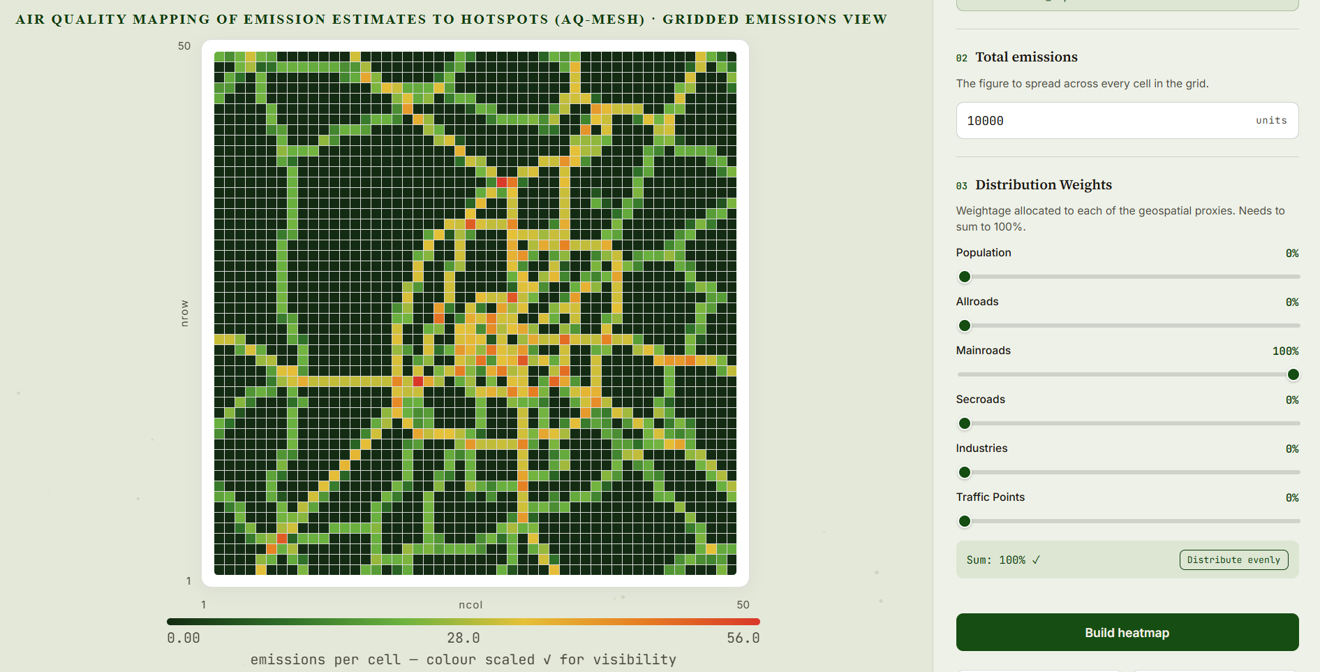
Example Screenshots from the tool
What is the variation in the gridded emissions presentation, when three sets of weights are used to spatially represent the same total emissions over the airshed. This example file is available for download on the portal. The efficacy of these distributions needs to be tested through a chemical transport model to know if we need to use 10 proxies or the results okay with using 2 or 3 representative proxies. More is always helpful in explaining the methods; which also means more time spent in preparing the inputs in the desired formats.
 |
 |
 |
Files to use as proxies for Indian cities for various layers like roads and population, are available here. Other resource links are available here.