Vehicle Stock Numbers and Survival Functions for On-road Exhaust Emissions Analysis in India: 1993-2018
Journal Article in Sustainability (2024) Download
[Repository of vehicle stock numbers and supporting information @ zenodo]
Fuel Station Survey (FuSS) to Profile In-Use Vehicle Characteristics for a City’s Vehicle Exhaust Emissions Inventory
Under peer-review – Preprints (2024)
[Repository of data @ zenodo]
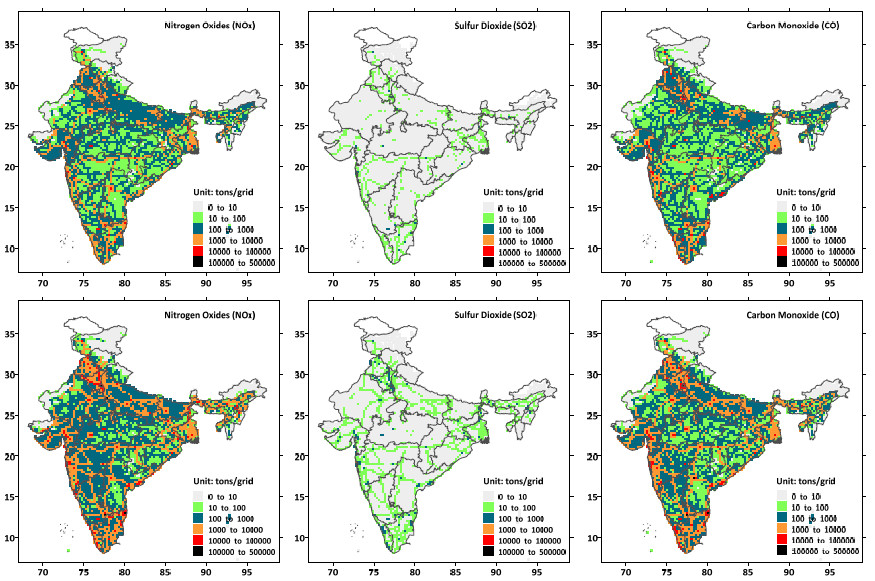
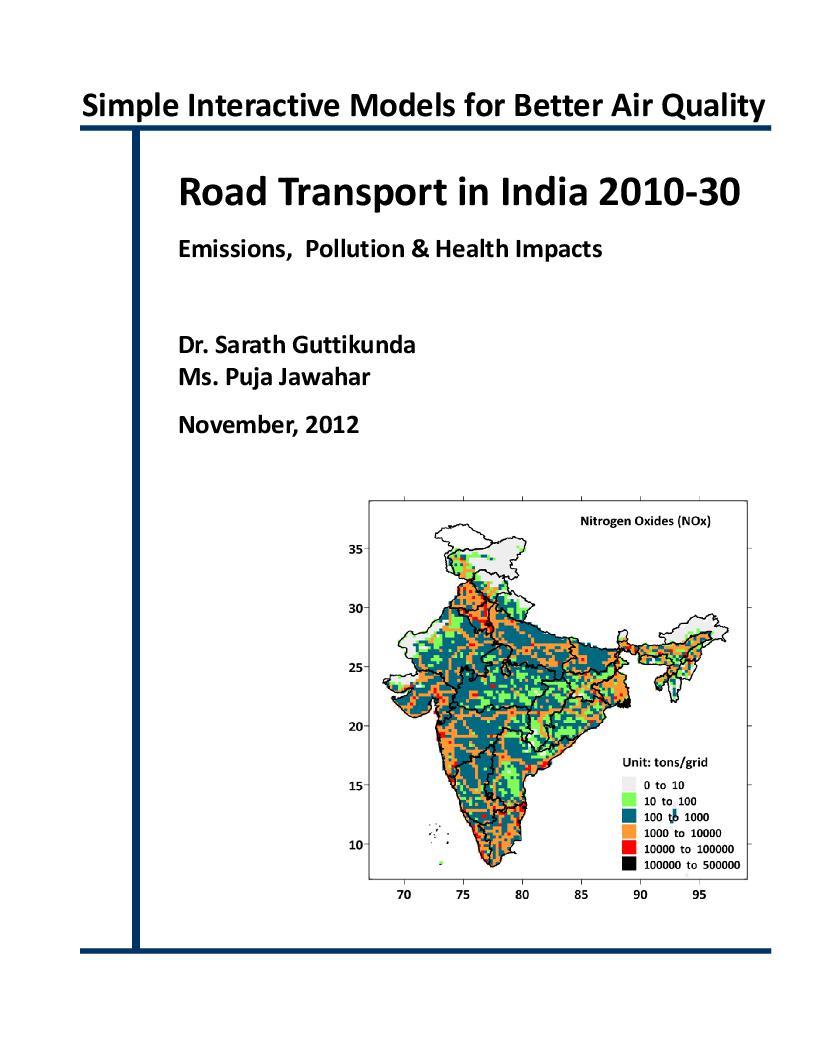 The road transport emissions vary both in space and time. The modeling domain considered for this exercise is very diverse (covering 640 districts, 36 states, and 22 cities (as subsets to some of the states)), with a combination of residential, industrial, commercial, agricultural, barn lands, and water bodies. Each of the vehicle modes (2Ws, 3Ws, 4Ws, buses, and trucks) also behave differently, which makes the spatial disaggregation of the estimated total emissions a challenging task (maps for 2012 and projected 2030 are presented below). Results from this road transport emissions study were published as a journal article in Energy Policy, looking at the anticipated growth rate in the vehicle sales, what that means to the urban air quality, and a road map for what is needed in the urban transport sector for better air quality. The findings are also part of the Planning Commission’s National Transport Development Policy Committee (NTDPC) report.
An animation of the gridded PM2.5 emissions for year 2015, is based on physical surveys (conducted with support and help from IIT-Delhi) and online data surveillance for multiple cities. We assume that this diurnal cycle is prevalent throughout the year, unless special events are in effect, which will be adjusted for manually.

For the road transport, multiple sources of information was utilized in building this spatially and temporally varying emissions inventory – GIS databases of the highways, main road, arterial roads, smaller roads, commercial and residential activities, industrial estates (including brick kilns and power plants), and online surveillance data (like below). A useful database is the information on road congestion, available from the google maps (shown below is the real time congestion map). While it is difficult to tell which vehicle is in the red zone, this is extremely useful in understanding the vehicle flow in the urban areas. A series of GPS unit were also utilized, traveling in 4Ws, 3Ws, 2Ws, and Buses, to understand how often each of the modes are idling (traveling under 4 kmph). Details of this survey are presented in a journal article.
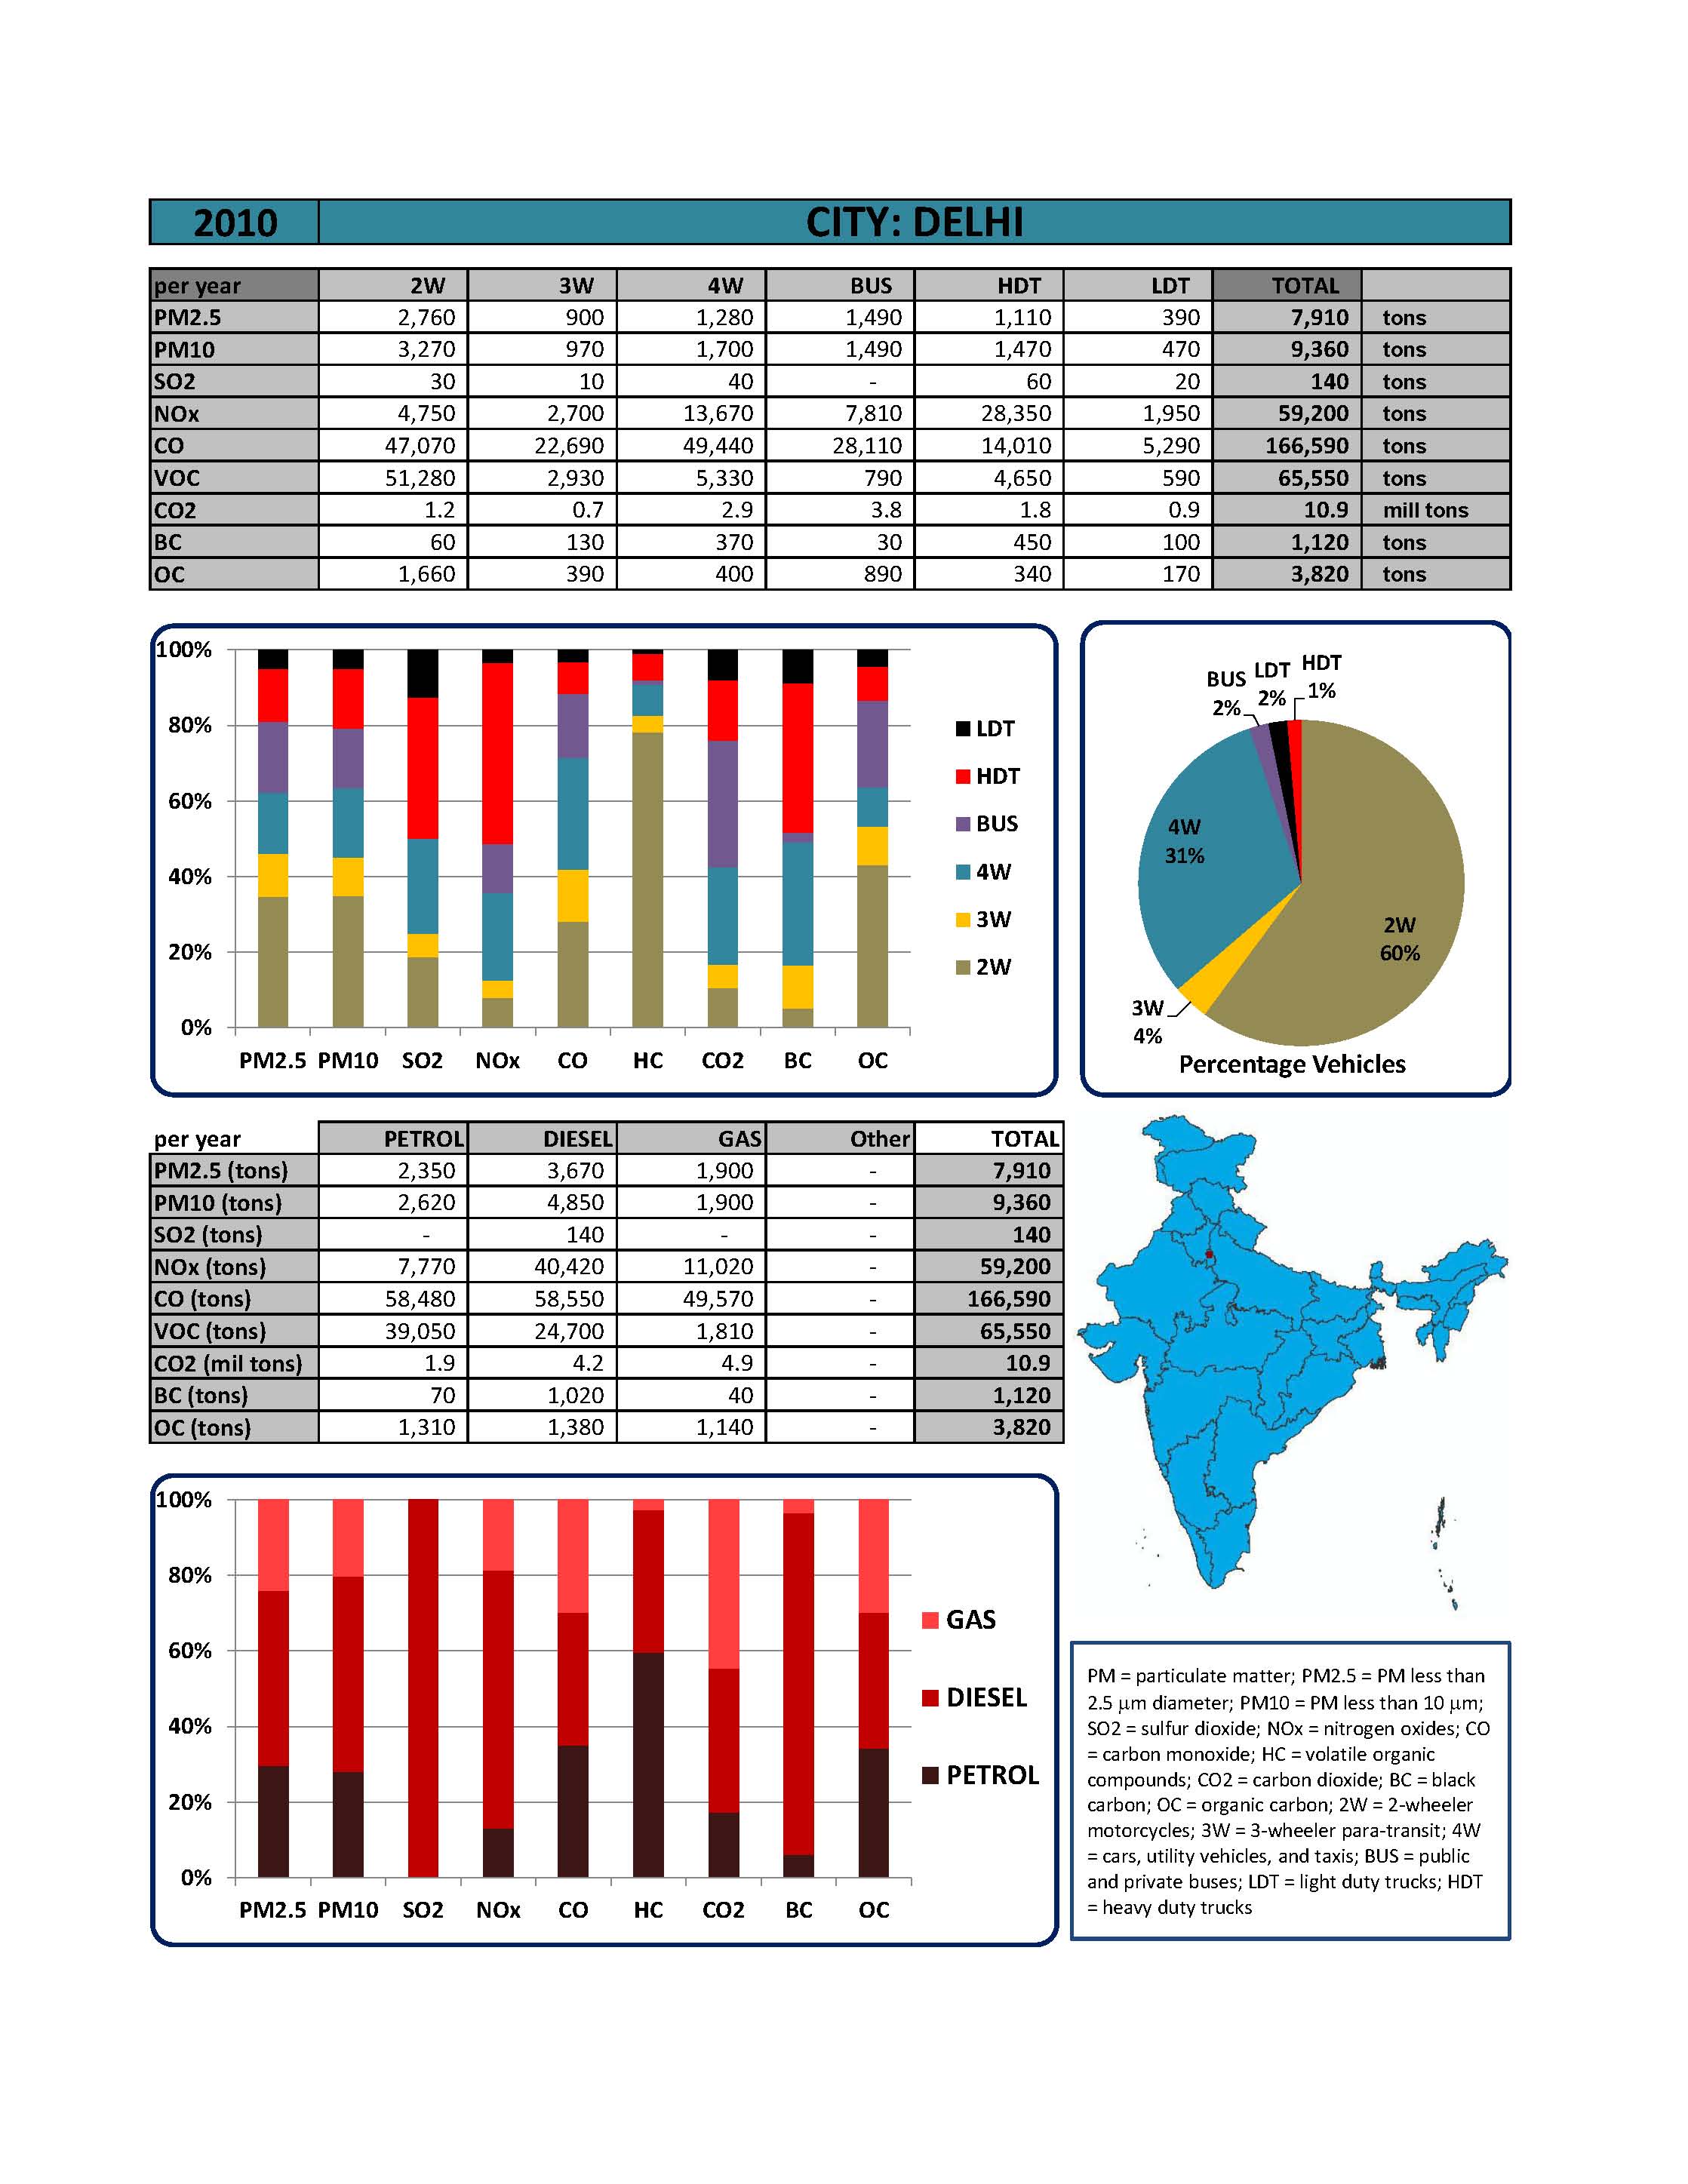
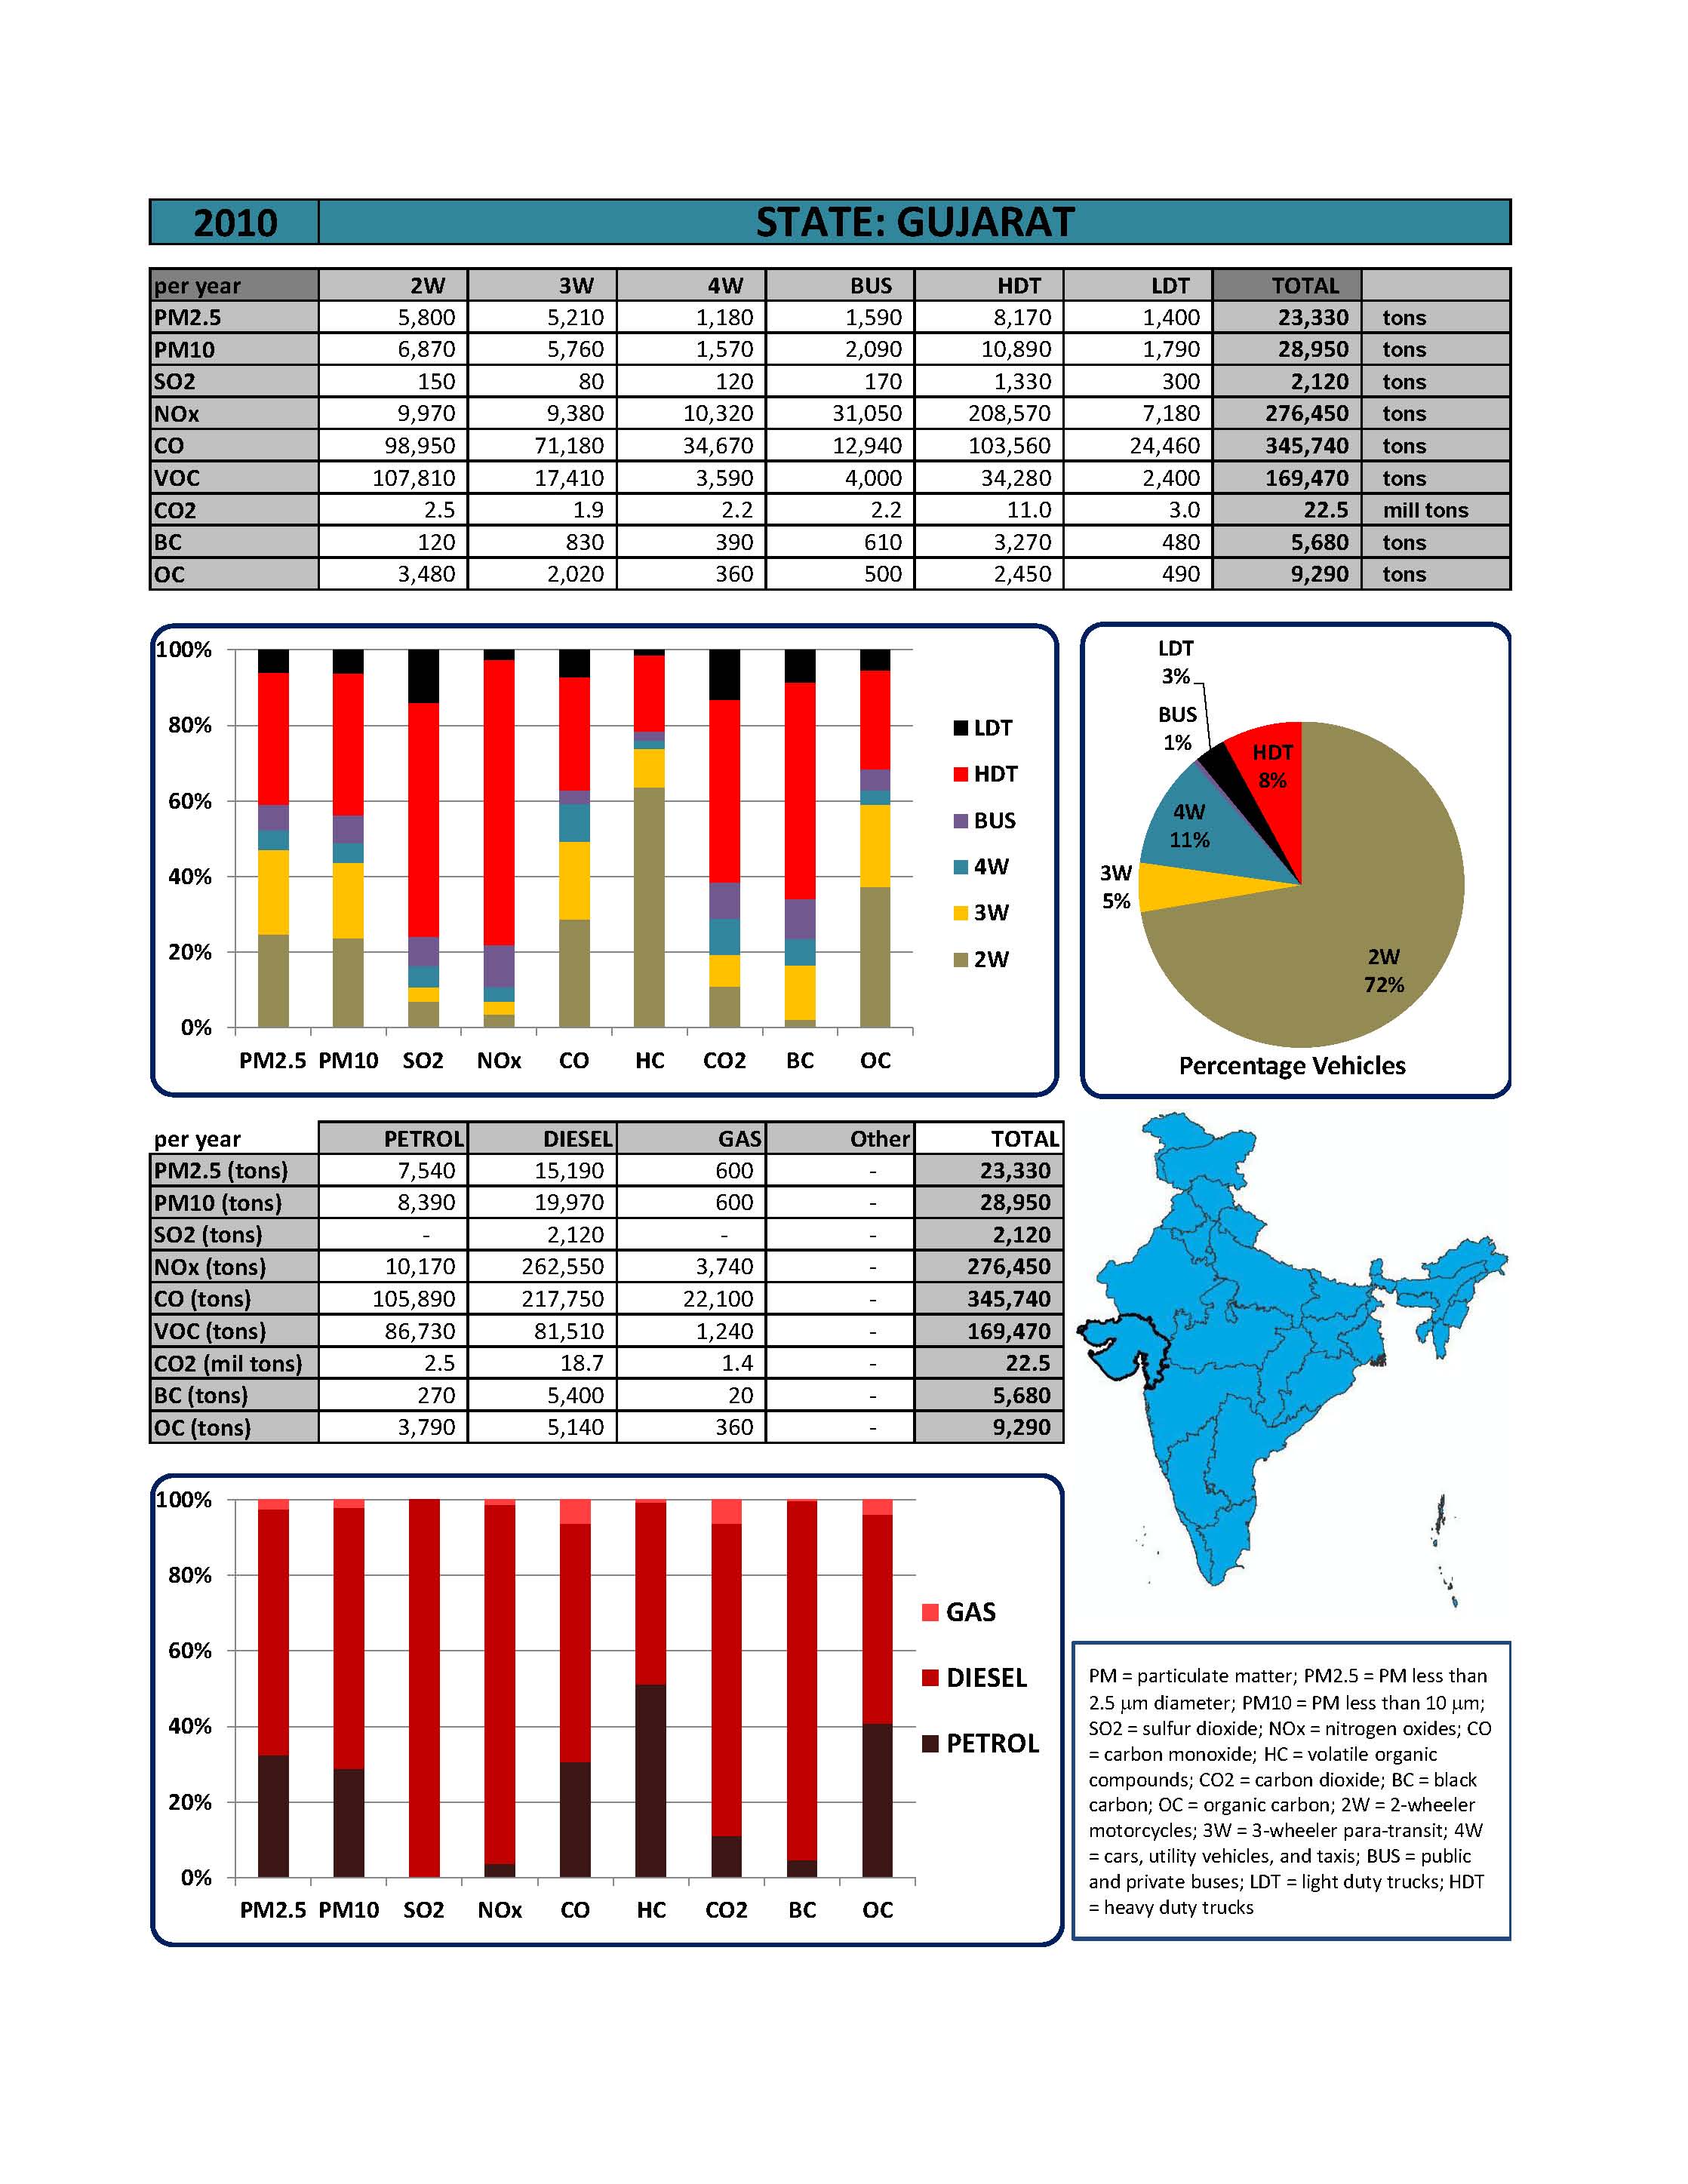
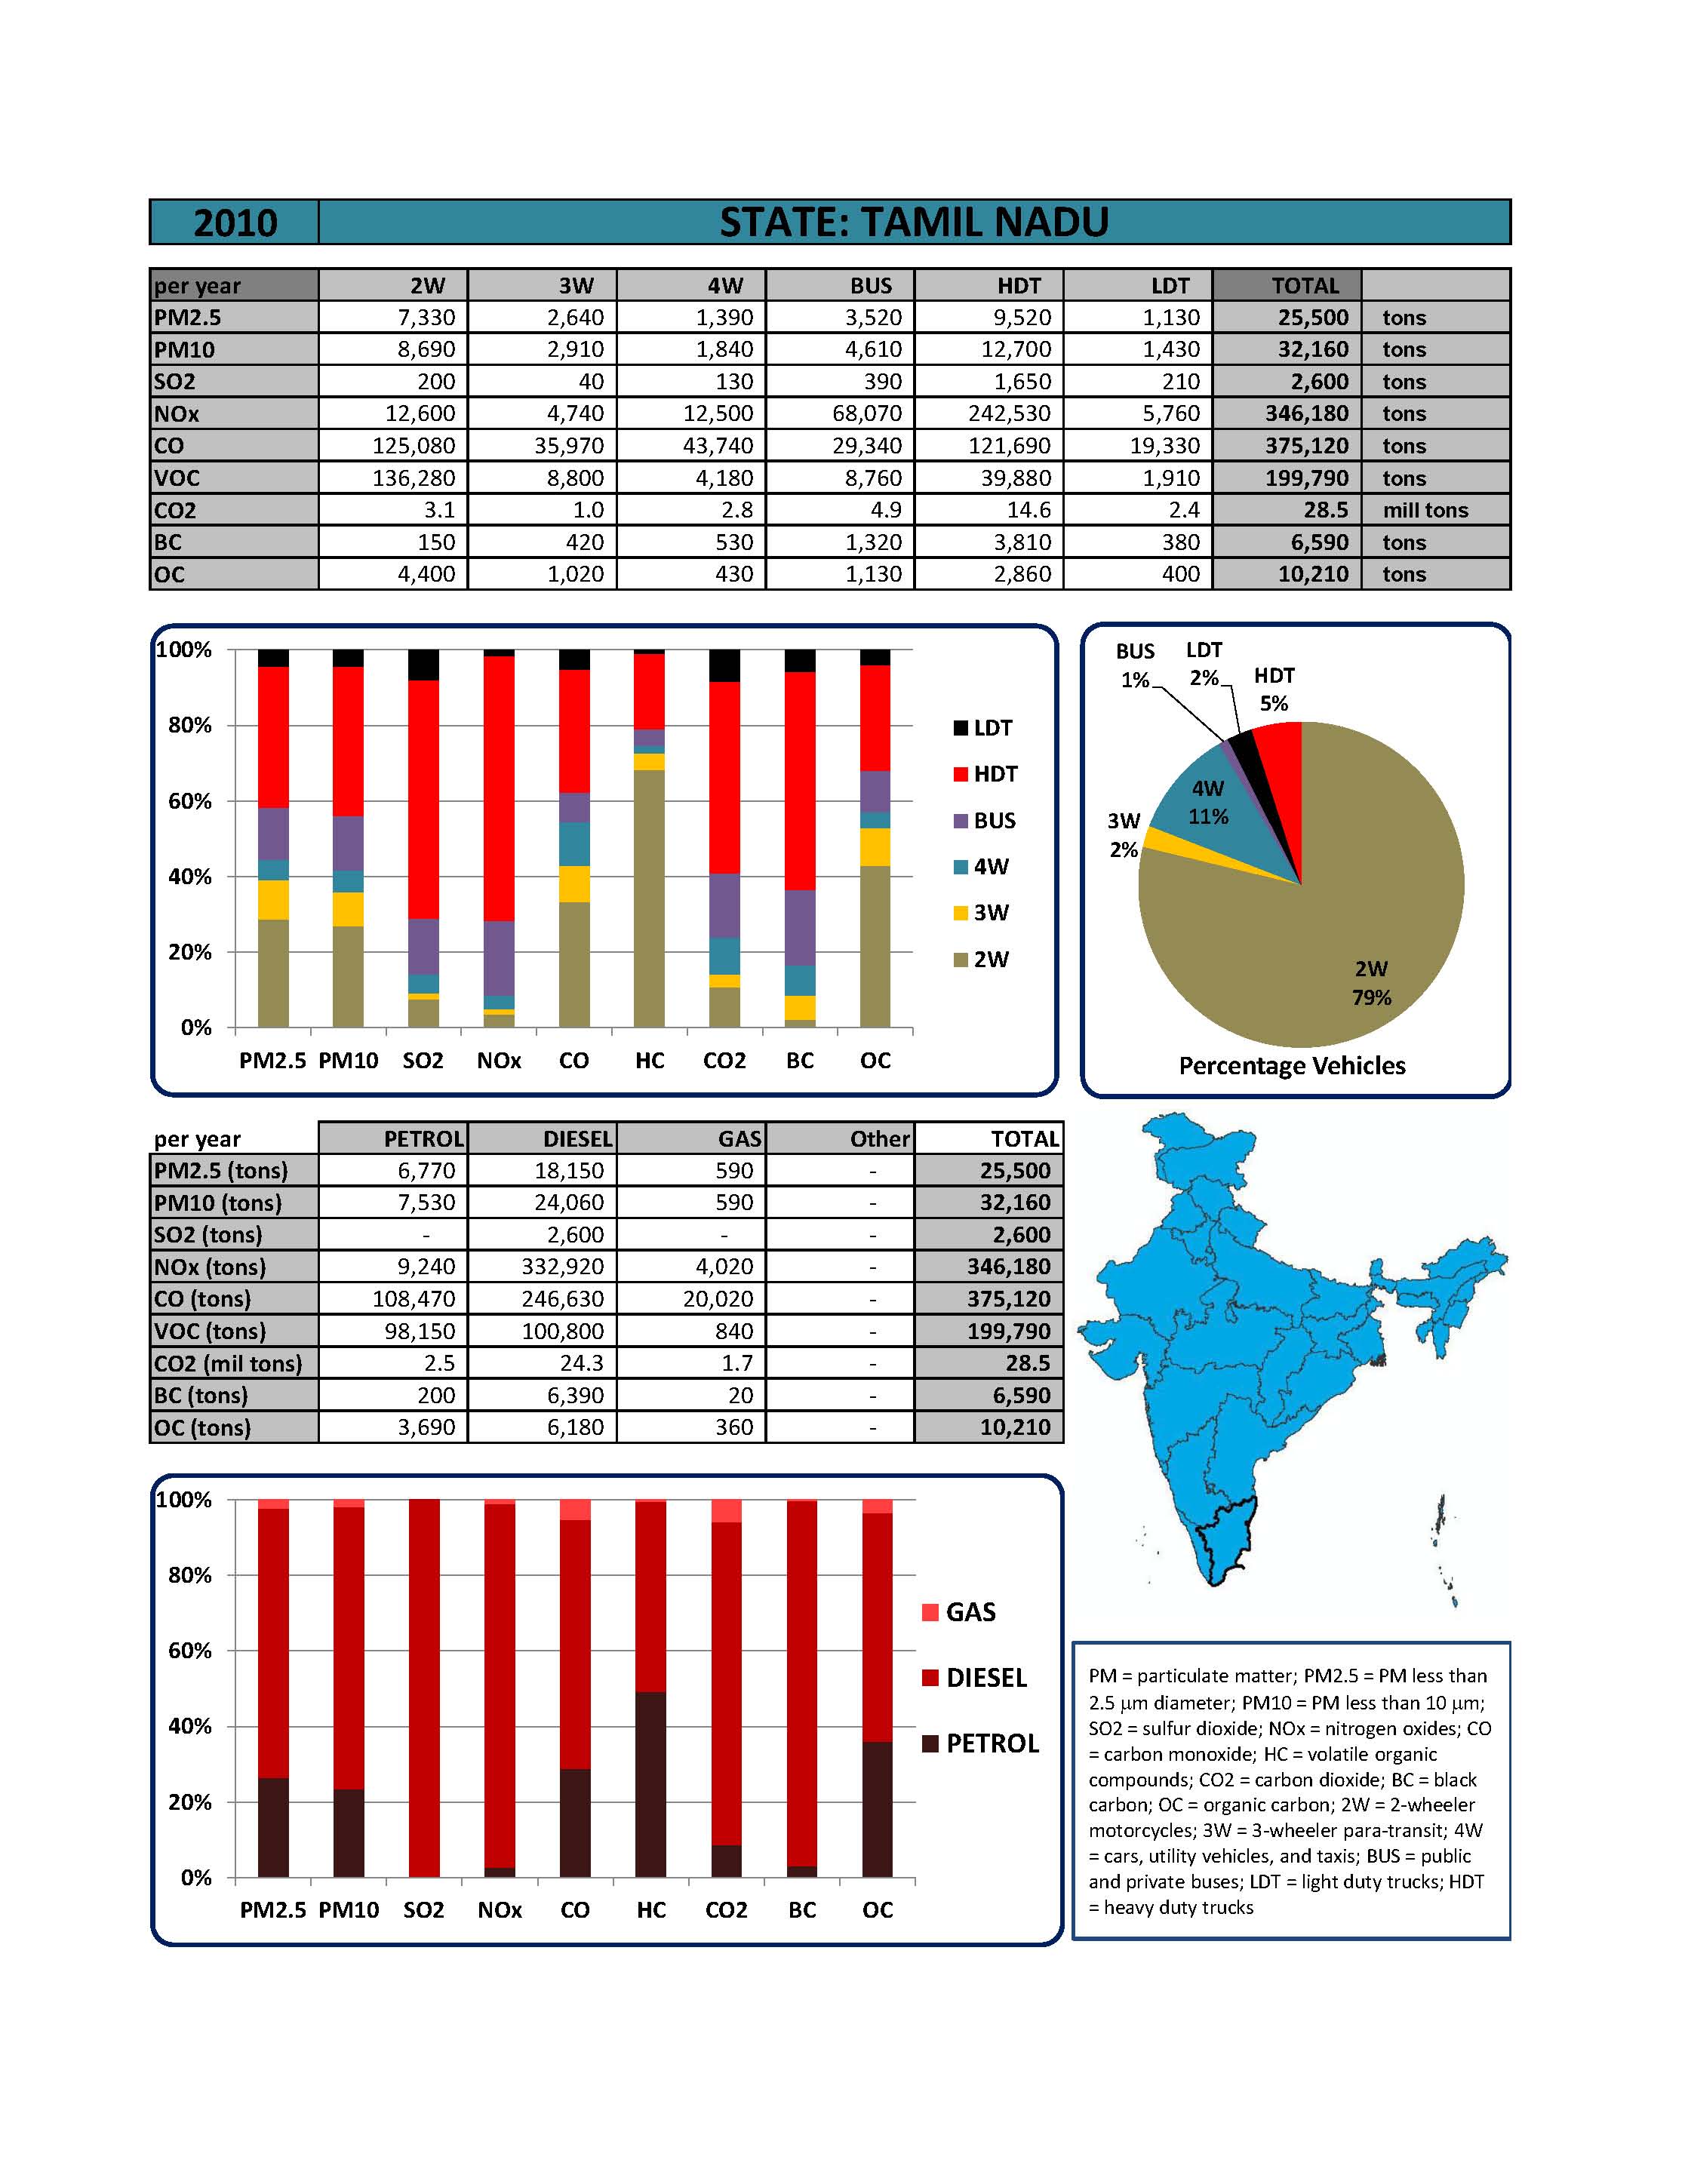
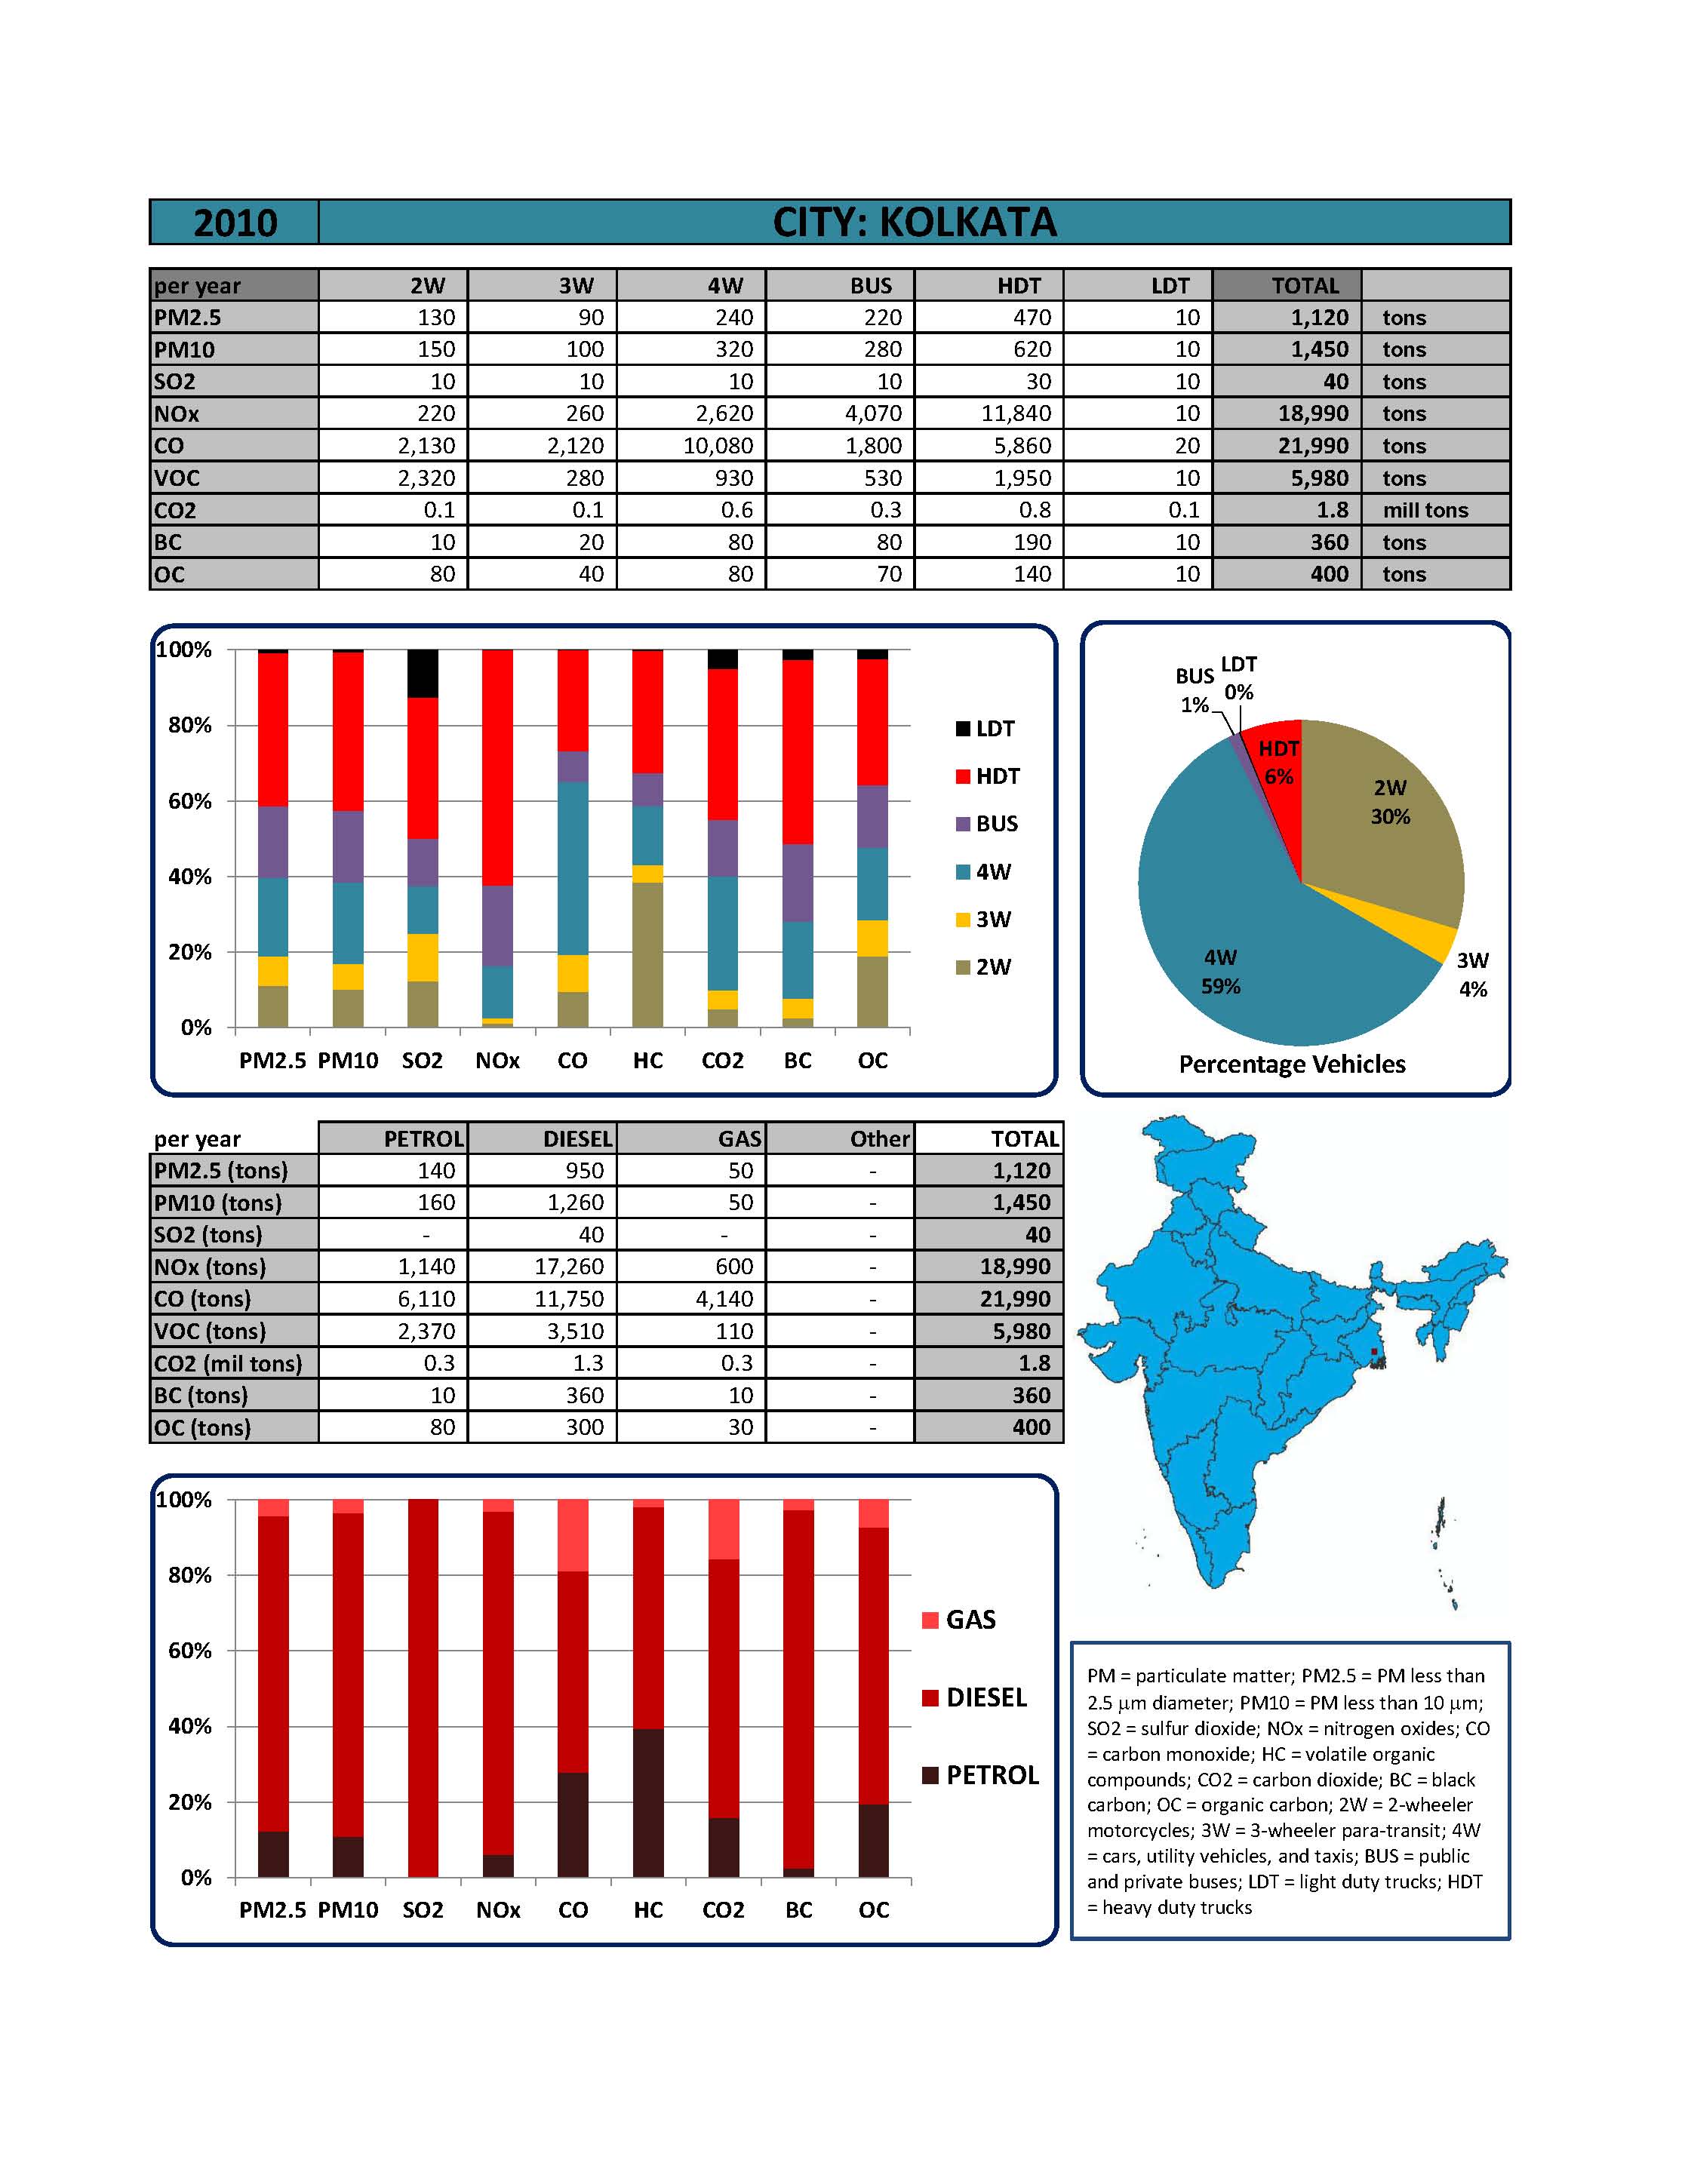
The road transport emissions are also available as summary sheets for each state and the subset cities (below).
 |
 |
 |
 |
Additional resource material
- Full report (without annexes)
- Binder of emission summary sheets by state
- Binder of emission summary sheets by city
- An infographic explaining the evolution of the road transport emissions in Delhi
- An infographic explaining the possible benefits of banning older vehicles in Delhi
- Re-fueling road transport for better air quality in Indian cities. Journal article in Energy Policy (2014)
- Role of urban growth, technology, and judicial interventions on vehicle exhaust emissions in Delhi for 1991-2014 and 2014-2030 periods. Journal article in Environment Development (2015)
- Evolution of on-road vehicle exhaust emissions in Delhi. Journal article in Atmospheric Environment (2015)
- Benchmarking vehicle and passenger travel characteristics in Delhi for on-road emissions analysis. Journal article in Travel Behaviour and Society (2015)
- Assessment of motor vehicle use characteristics in three Indian cities. Journal article in the Transportation Research – Part D (2015)
Email your questions to simair@urbanemissions.info