
Below are composites of PM2.5 and PM10 concentrations (in ug/m3) between October and February, since 2015. Plots are updated twice everyday.
 |
 |
Raw data is from CPCB portal and graph is collated and designed by EnviroCatalysts. Running mean of 48 hours is used since GRAP uses this to decide on the activity restrictions for the city and the region.
Annual composites can be viewed here
 |
 |
For all Indian cities, summary from the CPCB AQI bulletins is available here.
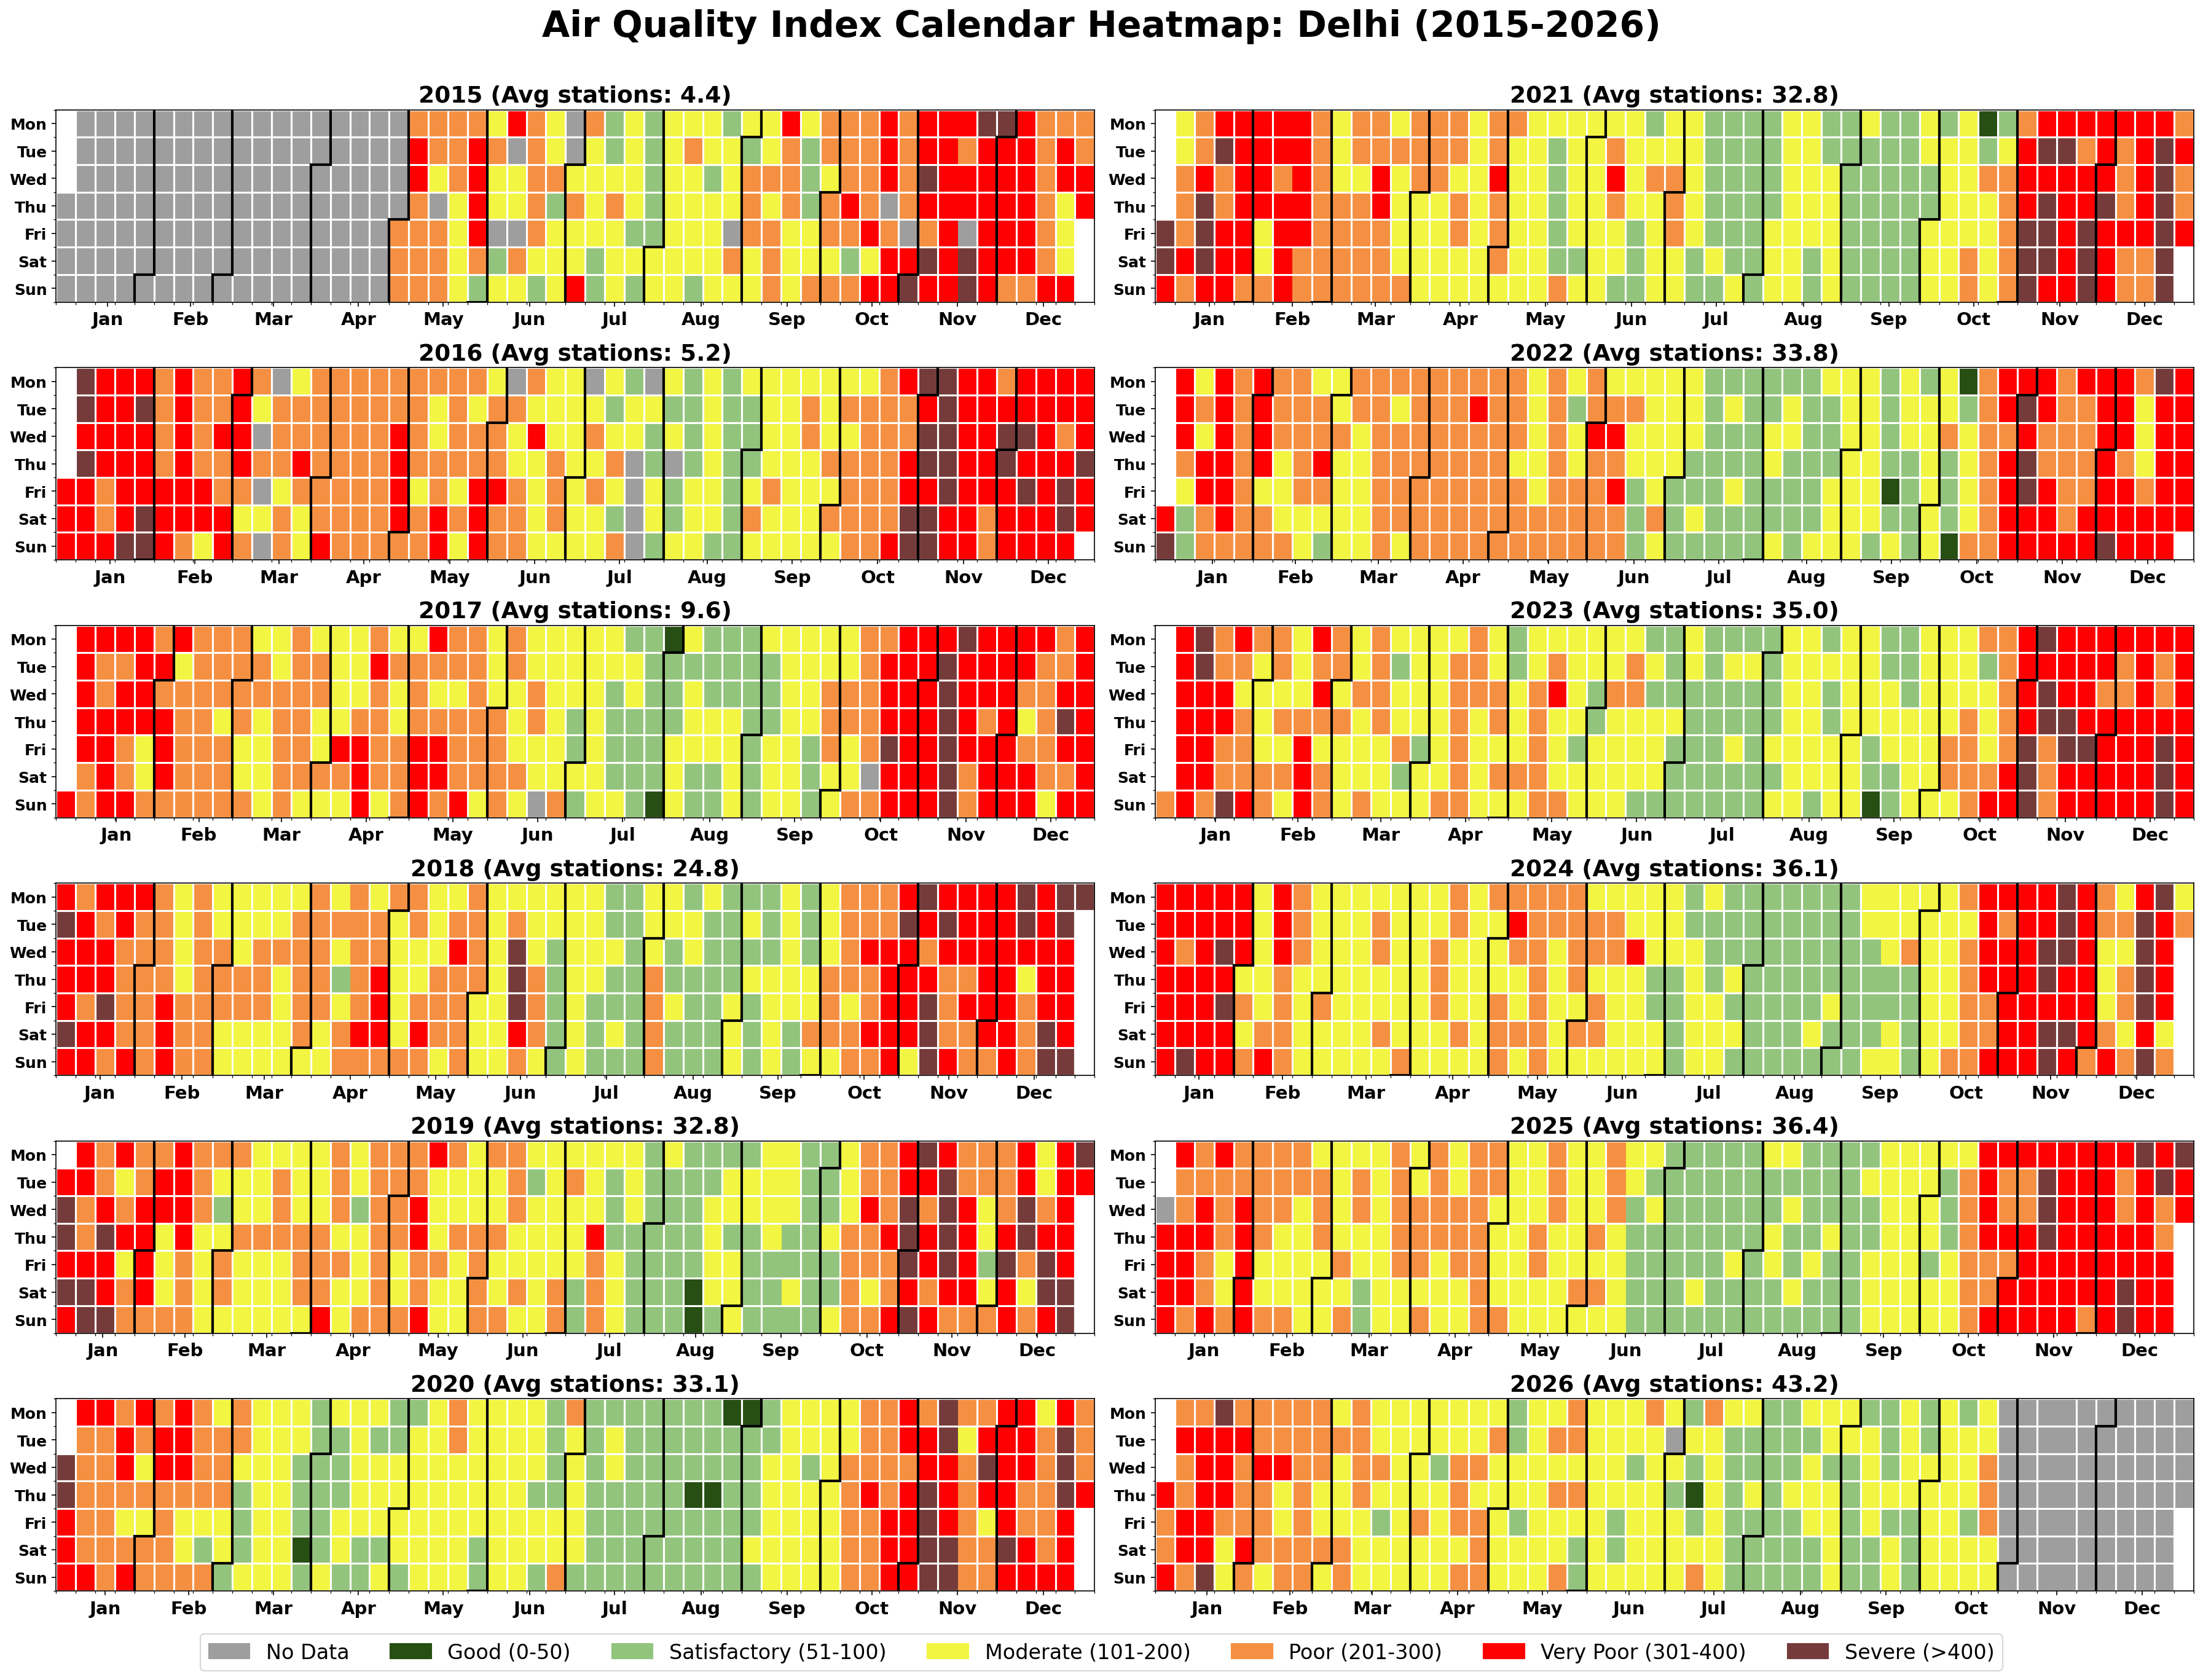
Review of “What’s polluting Delhi’s air” is available here.

Some interesting posts around Delhi’s air pollution
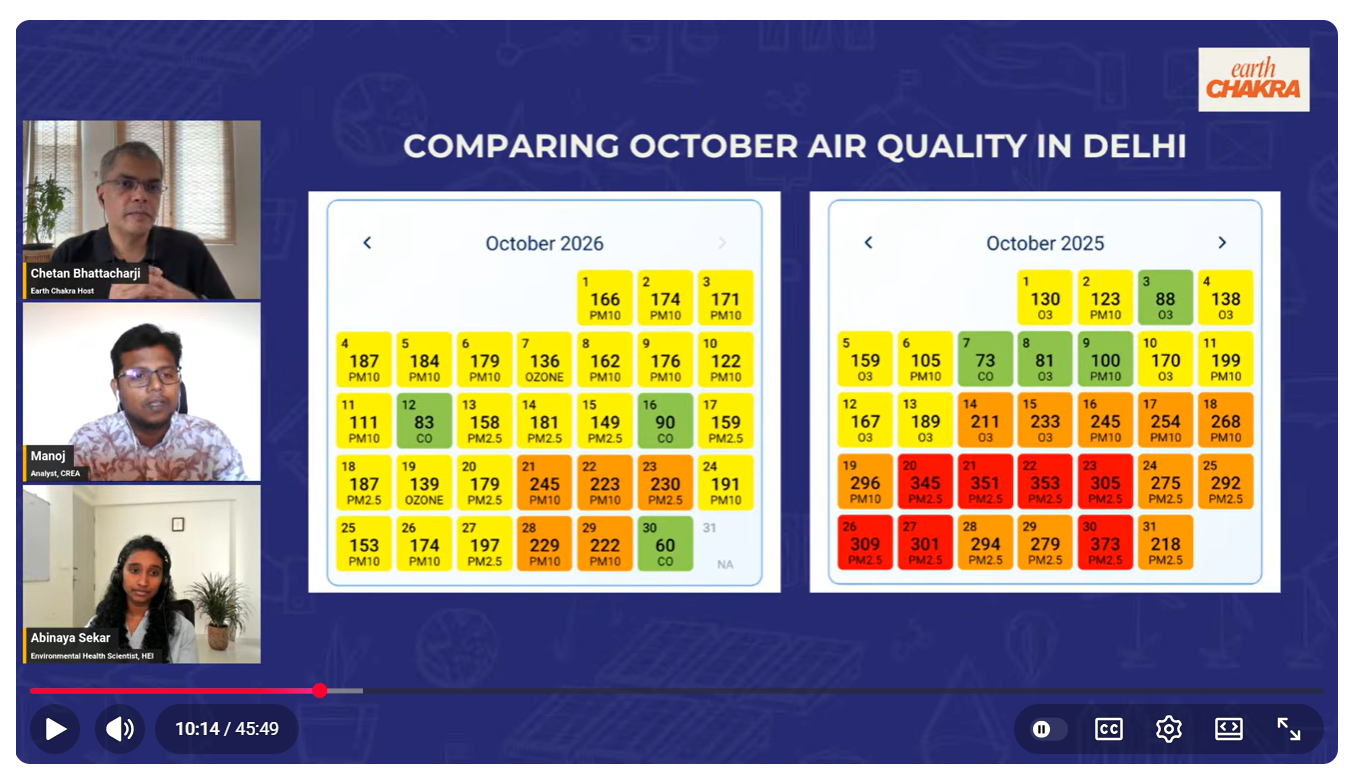
Why October 2026 is better than the previous years — according to CREA, it is because of meteorology, a delay in the stubble fires, and a late coming of Diwali in November [Article link] [Video interview link]
 |
 |
Weather and Long-Term Particulate Matter Trend Assessment [Source CEEW, link]

Toxi-cities – Air pollution is not just a Delhi problem [Source Caravan Magazine, link]

Delhi’s winter restrictions [Source Raahgiri Foundation, link]
