This is a list of published journal articles, reports and editorials (authored/co-authored/contributed/commented) by UEinfo on Household emissions
We need to fix household cooking and heating emissions to beat air pollution
Op-Ed in the WIRE (2019)
Indian annual ambient standard is achievable by completely mitigating emissions from household sector
Journal article in Proceedings of the National Academy of Sciences (2019) Download
[Supplementary material for the article]
[Repository of methods and information on household emissions in India]
[Press releases @Hindustan-Times @The-Hindu @UC-Berkeley @Phys.Org]
Contribution of household air pollution to ambient air pollution in Ghana – Using available evidence to prioritize future action
Policy Brief (HEI/19) by Health Effects Institute (2019) Download
The contribution of household fuels to ambient air pollution in India – A comparison of recent estimates
Policy Brief (CCAPC/2019/01) by the Collaborative Clean Air Policy Centre (2019) Download
[Press releases @Times-of-India ]
The global burden of disease assessments, listed outdoor air pollution among the top 10 health risks in India. The study estimated 695,000 premature deaths and loss of 18.2 million healthy life years due to outdoor PM2.5 and ozone pollution for year 2010-11. Among the health risk factors studied, outdoor air pollution was ranked 5th in mortality and 7th in overall health burden in India. Household (indoor) air pollution from burning of solid fuels was responsible for an additional one million premature deaths. The issue of household energy consumption (HEC) and its contribution to indoor and outdoor air pollution is critical to India, because of the high magnitude of population exposed to such pollution every day.
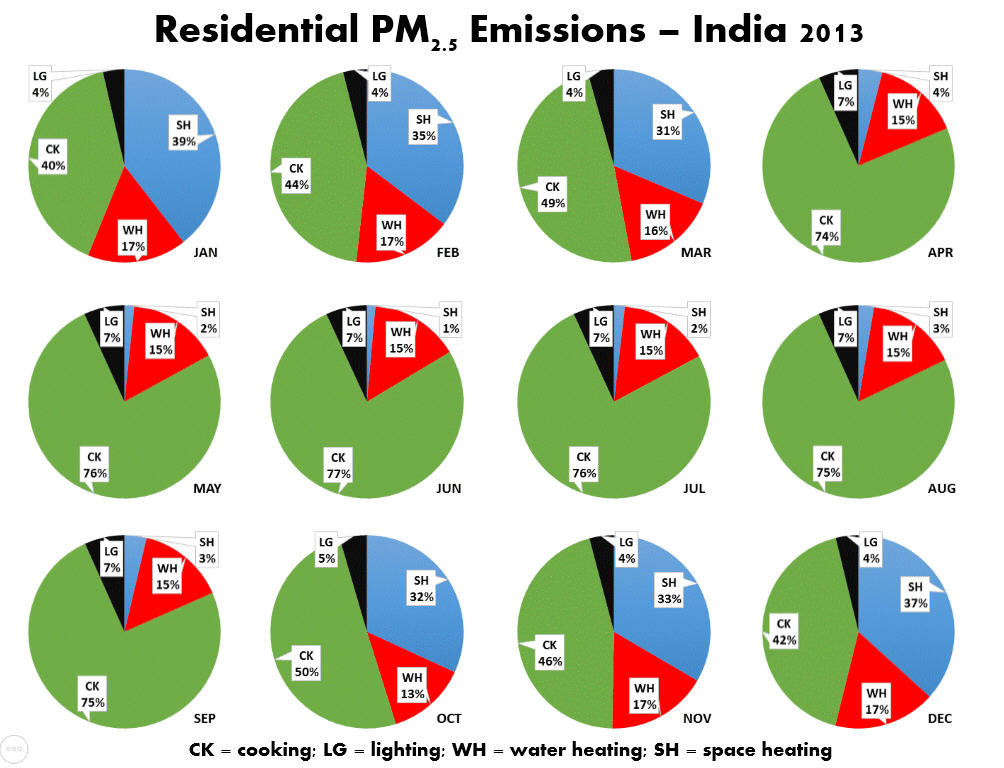
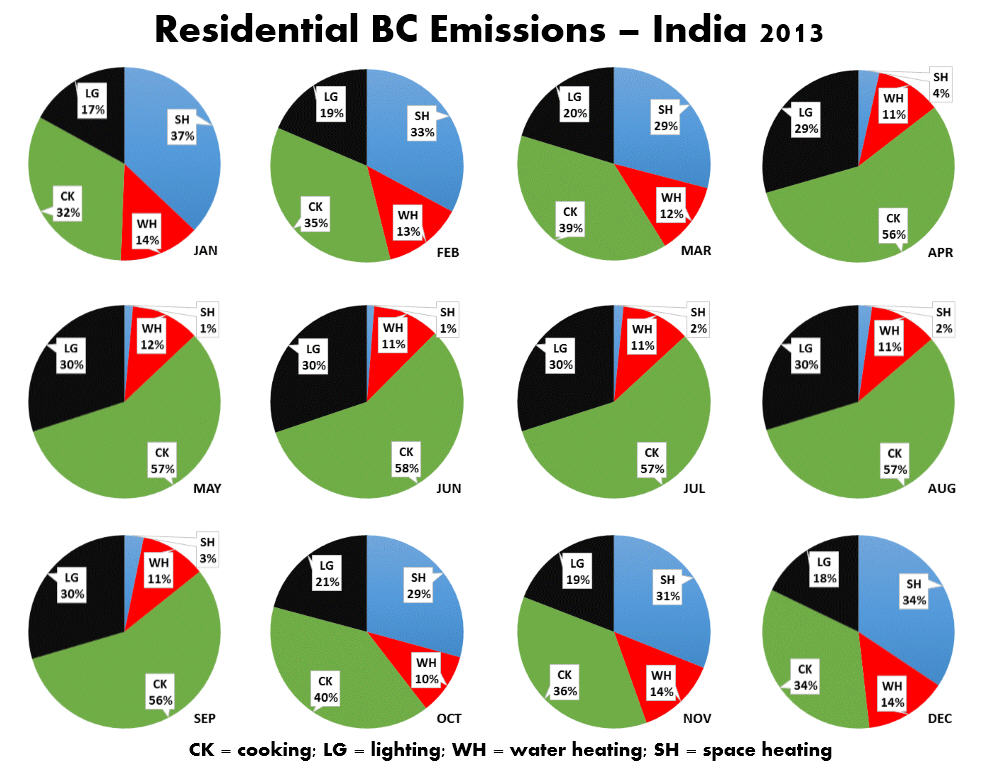
With that in mind, the HEC was studied in detail, to estimate its contribution to the ambient air pollution via source modeling approach – emissions and dispersion modeling. The HEC emissions are broken down into four categories (a) cooking (b) lighting (c) space heating and (d) water heating. The emission factors for the fuel categories are obtained from studies collated by the Indian Institute of Technology Bombay, Mumbai. No new lab tests for the emission factors or surveys to ascertain the HEC patterns were conducted. A summary report for each of the 640 districts can be viewed below (and download the same as a pdf document by clicking it). The summary sheet includes information from census-India on share of cooking fuels in use, total emissions from cooking and heating, share of the emissions in comparison with national shares, percent contribution of HEC to the ambient PM2.5 pollution (based on WRF-CAMx modeling with all emissions), and health impacts that can be linked to HEC in each district.
Emissions inventory from the energy consumed at the household level is available from the global programs such GAINS and EDGAR. These and other regional emissions inventories are based on data collected or segregated at the national or at the state level, and then distributed to the desired grid size using proxies. It is our opinion, this allows for underestimating or overestimating of emissions at the grid level. For example, most of the proxies for spatial distribution are based on population and often the hot spots end up being the urban centers with the most population. However, most of the non-LPG and the non-electric emissions are from the non-urban sectors. To overcome the spatial representation issue and some under-reporting of emissions from HEC, the methodology to estimate emissions was modified accordingly. The improvements made in the cooking and heating emissions estimation methodology are the following
- All the emissions were calculated at the grid level. Grids are designated at 0.25° resolution (~25 km) and spread over a working domain covering the Indian subcontinent
- Each of the districts are mapped to the 640 districts, as listed in the Census-India. This also allows for fractional mapping. For example, if a grid is covering multiple districts, then the area of the overlap is taken into consideration for appropriate mapping of the grid
- The total number of households in each district is calculated based on the total population and the household size for each district (varies from state and state)
- Each of the districts and grids are further broken down into urban and rural areas – based on the urban build-up maps retrieved from MODIS landuse databases
- The urban and rural split within the district, linked to the gridded population, allowed to not overestimate the emissions over the urban grids and not underestimate the emissions over the rural grids, especially for the cooking sector
- Each of the districts is mapped to the data fields from the Census-India – HH10 for the HEC for cooking and heating and HH7 for lighting; where the data is further segregated at the district level into urban and rural cooking; and inside and outside cooking
- The HH10 database allows analysis for nine fuel categories (including electric) – this was utilized for cooking and heating categories. The assumption here is that the fuel used for cooking on a daily basis, is also utilized for heating. The electric share of households are listed as zero emissions. The survey records only one fuel per household, but it is not true that a household will use only one fuel category. In the calculations, the share of the households from the survey is used as a proxy, assuming that a mix of the fuels are being used by all the households in a district. These shares are updated every year using the MoPNG reports on number of new connections and refill rates available at the state level (also see ACCESS survey reports by CEEW).
- Fuels included in the cooking and heating emission estimation are crop residue, wood, coal, cow dung, kerosene, coal and charcoal, LPG, biogas, and others (a small share of unknown fuel types)
- Average energy consumed by household for cooking is calculated based on NSSO survey database, which lists amount of food varieties cooked at the state level. Within the state, this is assumed constant for all the districts. The lowest averages are observed in the Northeastern states
- The HH7 database allows analysis for four fuel categories (including solar and electric) – this was utilized for lighting category. The solar and electric share of household are listed as zero emissions. The most of the rural lighting needs are met via kerosene
- The dynamic temperature profiles (from the WRF meteorological model) and correction based on the age groups, allowed to not underestimate the emissions in the Southern states (for all months) and in the Northern and Northeastern states (during the summer months). For example, the Western Ghats in the Southern states are known to be cold and in need of space heating even in the summer months, which would be assumed zero, if a state average temperature is assumed for the region (a summary of the daytime and nighttime average temperatures for the next three days is presented below)
- The cooking and lighting emissions are considered constant, on a daily basis, through the year. The water heating and space heating emissions vary by month.
A report is underway, with interesting features observed during the emissions and pollution calculations.
We would like to acknowledge the support of Global Alliance for Clean Cookstoves (Washington DC, USA) and the guidance of Dr. Chandra Venkatraman and her team @ the Indian Institute of Technology (Mumbai, India) in establishing this new dynamic emissions methodology for India’s household energy sector. The emissions inventory is in use on everyday forecasting of air pollution for the 640 districts in India.
Methodology references
- Trends in multi-pollutant emissions from a technology-linked inventory for India: II. Residential, agricultural and informal industry sectors (Atmospheric Environment, 2014)
- The Indian National Initiative for Advanced Biomass Cookstoves: The benefits of clean combustion (Energy for Sustainable Development, 2010)
- New methodology for estimating biofuel consumption for cooking: Atmospheric emissions of black carbon and sulfur dioxide from India (Global Biogeochemical Cycles, 2004)
Send your queries to simair@urbanemissions.info
Surface Temperature – Day Time Average
 |
 |
 |
 |
Surface Temperature – Night Time Average
 |
 |
 |
 |