
Air pollution has emerged as a major environmental challenge in Indian cities and across the states. Complexity of the problem is due to multiplicity of emission sources, such as, industries, automobiles, generator sets, domestic fuel burning, road side dusts, construction activities, etc and a vibrant meteorology across climatic zones. Our India air quality forecasting system interjects contributions of pollution for national, regional and urban areas, to better support a long-term air quality management plan and a short-term health alert system. Various products from the forecasting system summarized below.
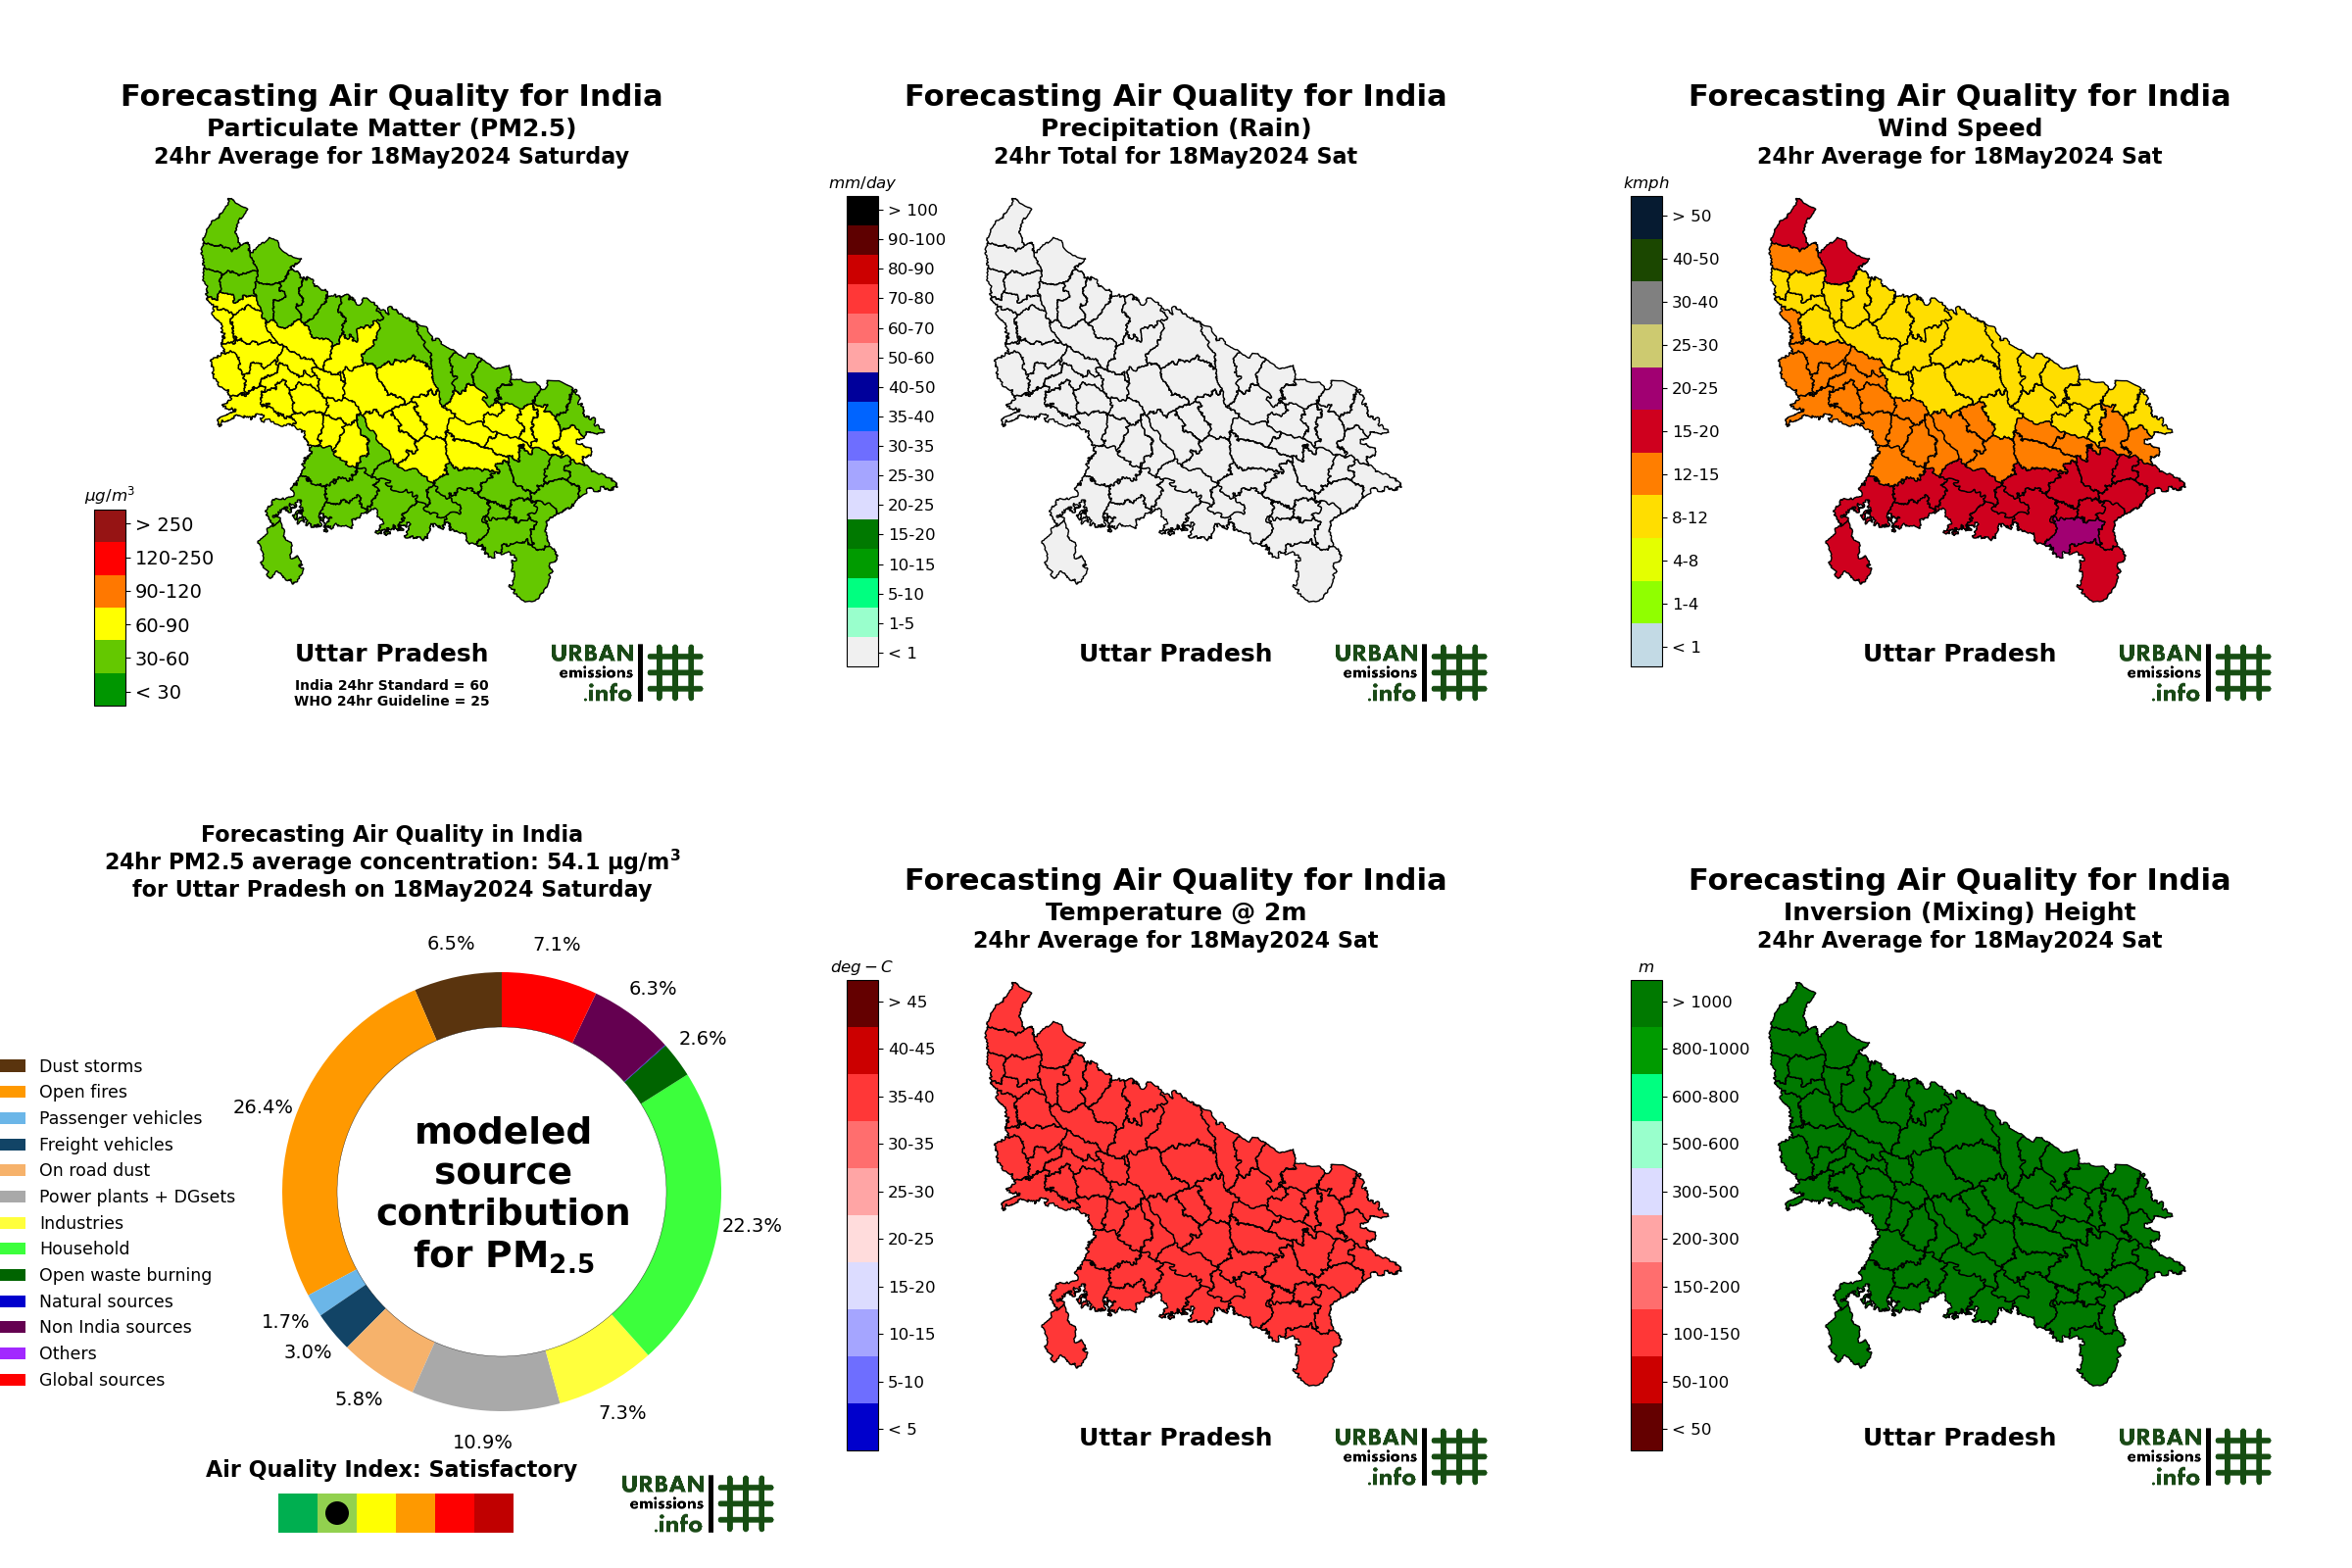
Pollutant concentrations (for example, PM2.5 in the above panel) are based on simulations using CAMx chemical transport model and meteorology reconstructed using the WRF model at 0.25° resolution covering the Indian sub-continent. The emission fields also include natural sources, such as dust storms, fires, sea salt, lighting activities, updated every day along with the WRF simulations.
- Click here for day (24h) average PM2.5 maps for next three days
- Click here for day (24h) average PM10 maps for next three days
- Click here for day (24h) average SO2 maps for next three days
- Click here for day (24h) average NO2 maps for next three days
- Click here for day (24h) average CO maps for next three days
- Click here for anime of hourly average PM2.5 maps for next three days
- Click here for anime of hourly average PM10 maps for next three days
- Click here for anime of hourly average SO2 maps for next three days
- Click here for anime of hourly average NO2 maps for next three days
- Click here for anime of hourly average CO maps for next three days
- Click here for anime of hourly average O3 maps for next three days
Meteorological Forecasts
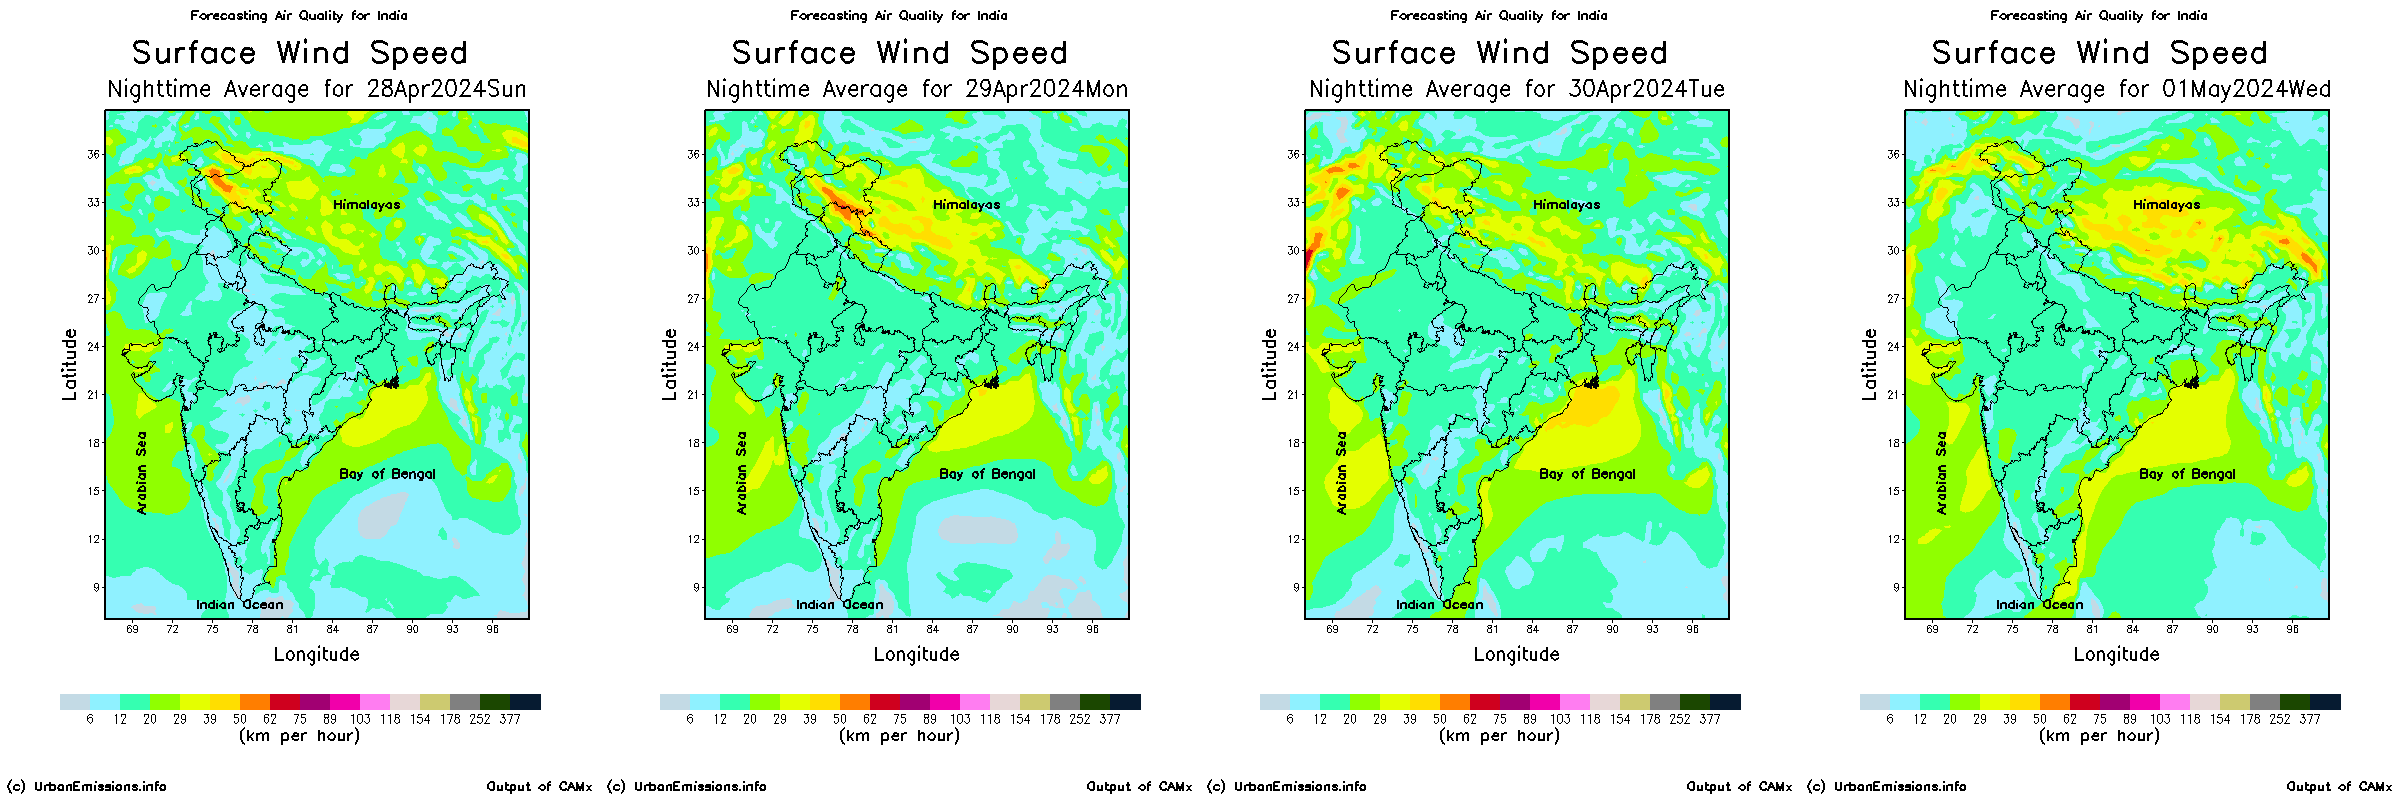
Our forecasting system also includes a high-resolution medium-range meteorological system for the next 72-hours, processed through 3D-WRF meteorological model and the GFS meteorological fields . The modeling domain covers the Indian subcontinent at a temporal resolution of 1 hour. All the simulation fields are updated everyday at ~17:00 local time. WRF model simulated summary of these meteorological parameters by district for the year 2015, is available for browsing and downloading here. A link to the forecast fields as netcdf files are available upon request (caution: very large).

- Click here for daily total precipitation maps for the next 3 days
- Click here for day-time average wind-speeds maps for the next 3 days
- Click here for night-time average wind-speeds maps for the next 3 days
- Click here for day-time average surface temperature maps for the next 3 days
- Click here for night-time average surface temperature maps for the next 3 days
- Click here for day-time average 2m-temperature maps for the next 3 days
- Click here for night-time average 2m-temperature maps for the next 3 days
- Click here for day-time average mixing layer (inversion) height maps for the next 3 days
- Click here for night-time average mixing layer (inversion) height maps for the next 3 days
- Click here to browse hourly average precipitation maps for the next 3 days
- Click here to browse hourly average 2m-temperature maps for the next 3 days
- Click here to browse hourly average wind speeds maps for the next 3 days
- Click here for anime of hourly average precipitation maps for the next days
- Click here for anime of hourly average wind-speeds and directions maps for the next 3 days
- Click here for anime of hourly average 2m-temperature maps for the next 3 days
- Click here for anime of hourly average mixing layer (inversion) height maps for the next 3 days
Met Anime
72-hr animations for surface wind speeds and direction, precipitation, surface temperature, and mixing layer height
 hourly snaps hourly snaps |
 hourly snaps hourly snaps |
 hourly snaps hourly snaps |
 |
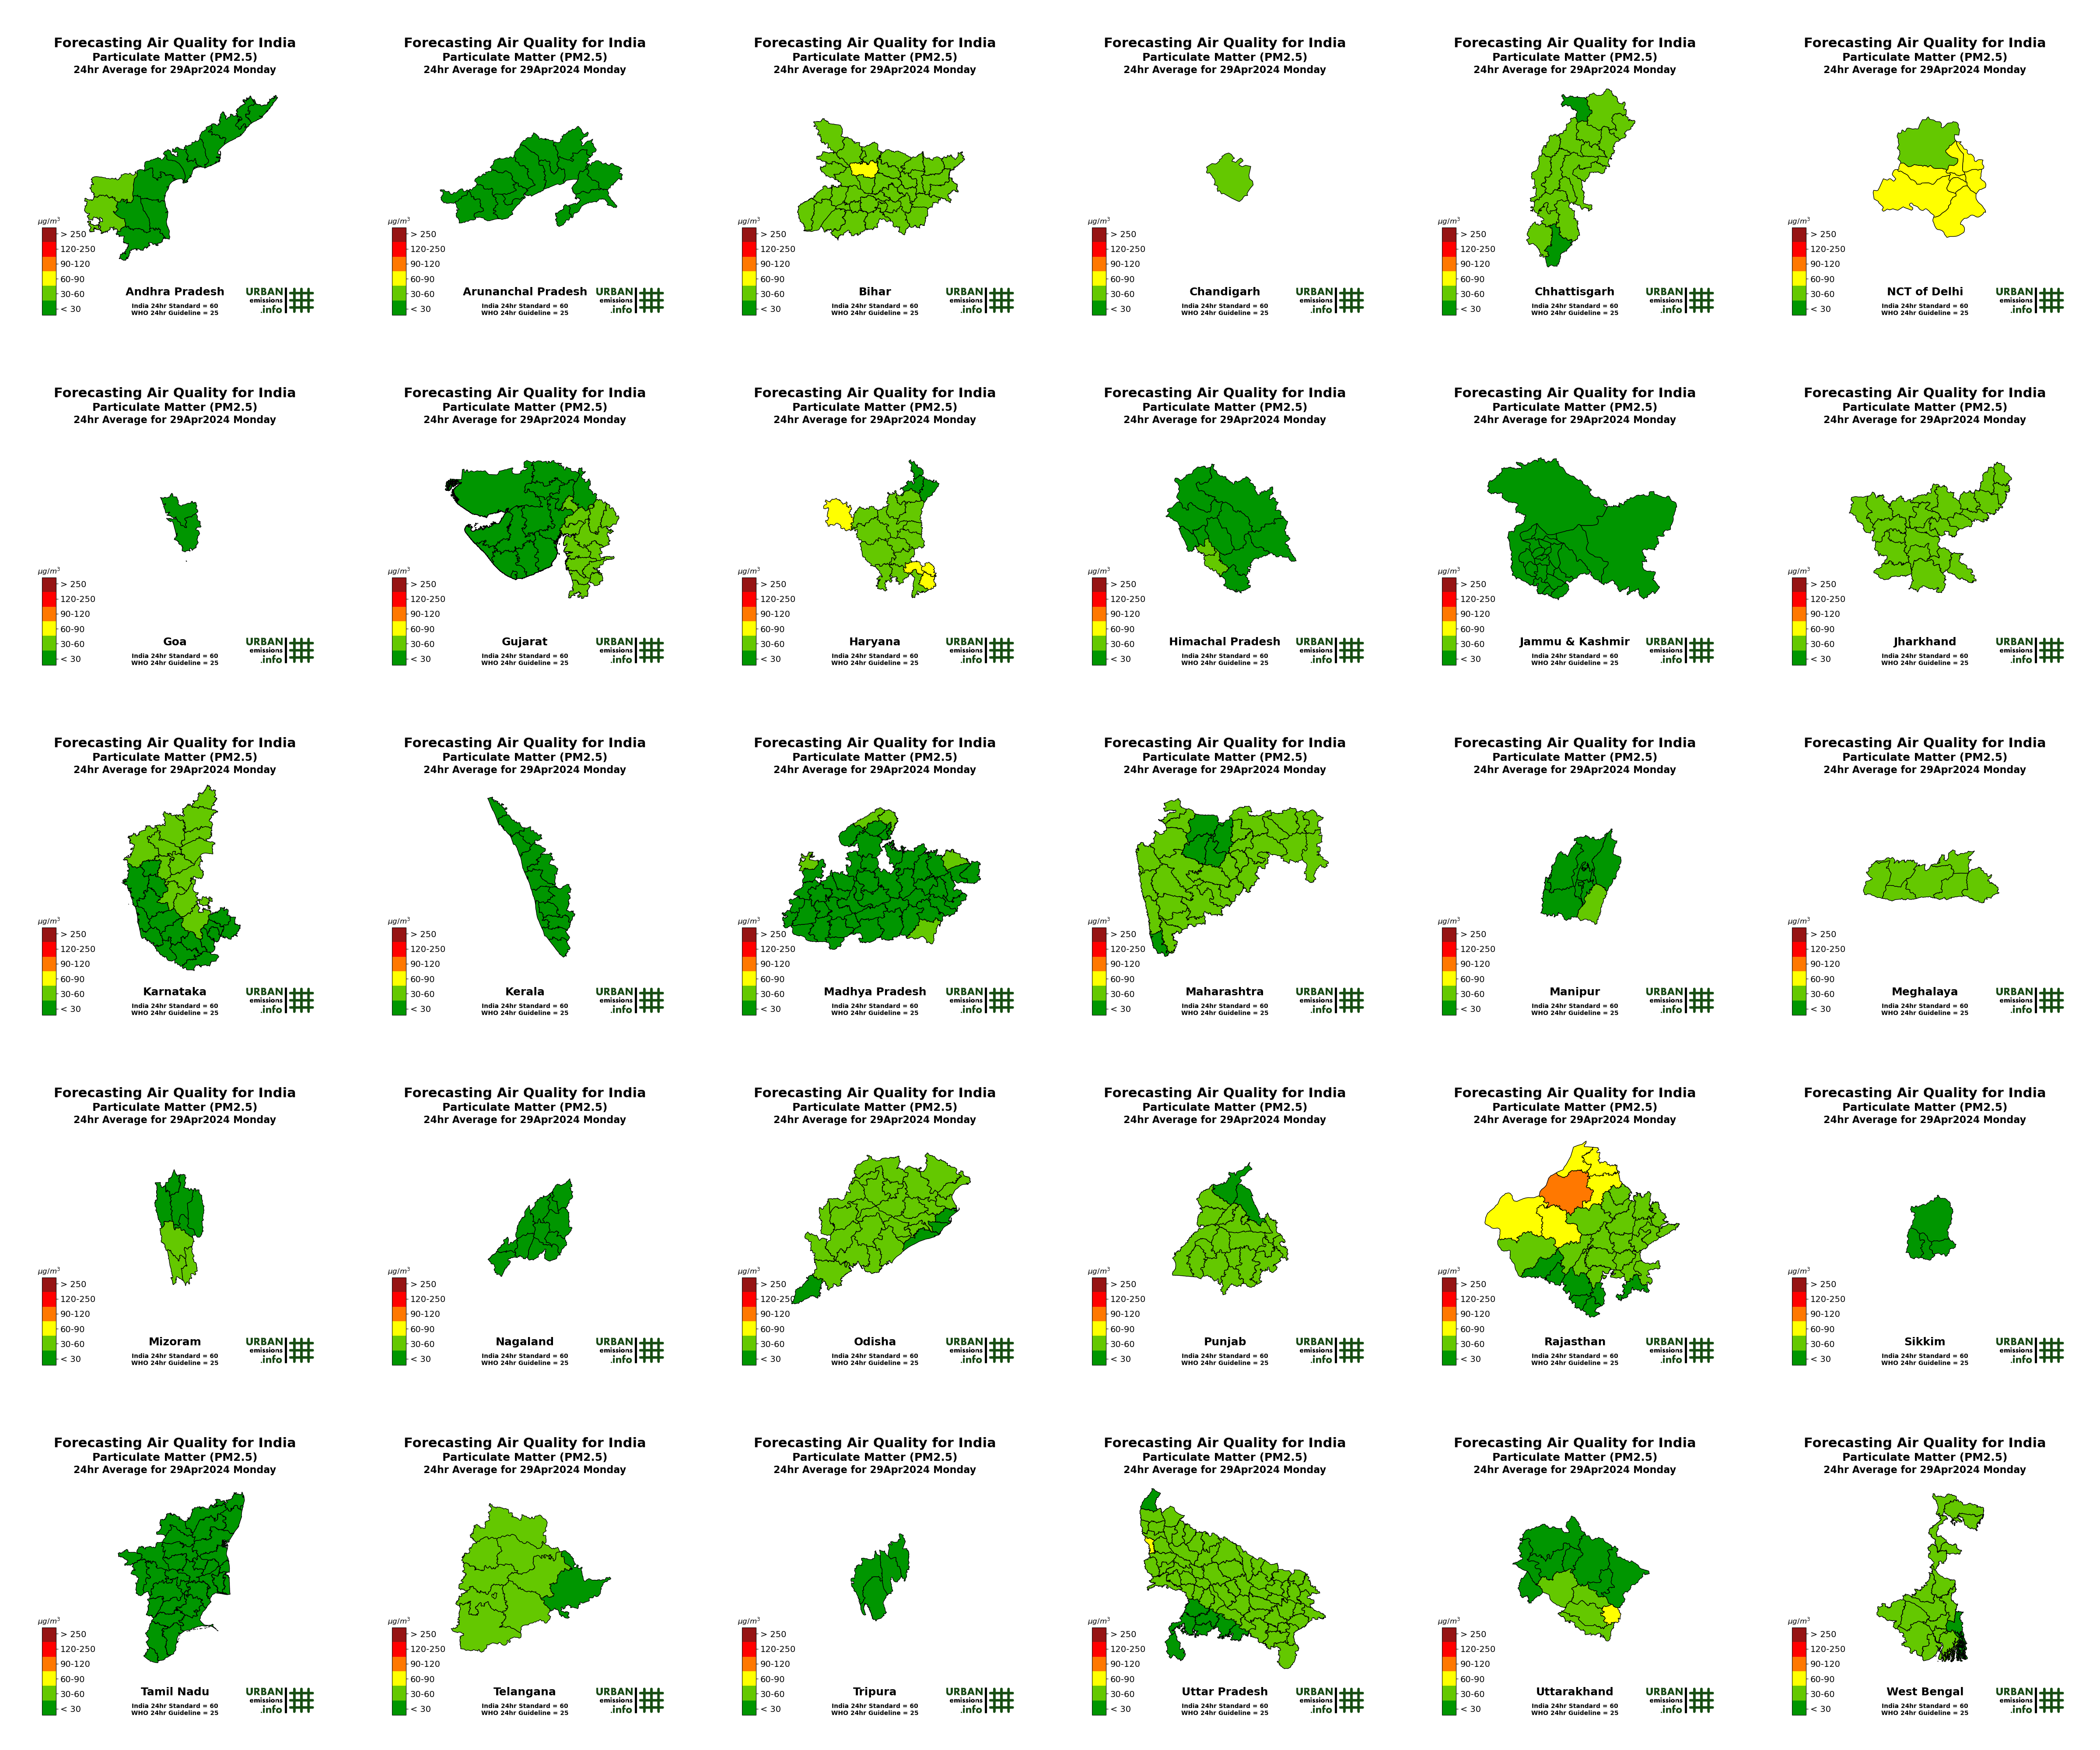
State-level Air Quality Forecast Summaries
All India forecasting results are also summarized at the state level. A composite of the 30-large states is available here.
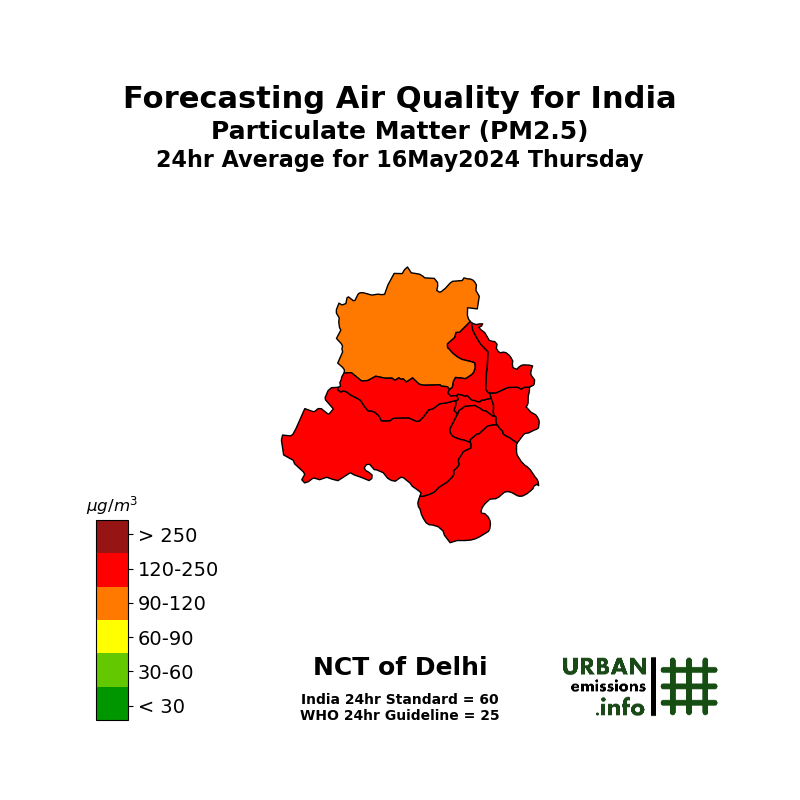
Modeled PM2.5 concentrations by State (browse here for forecast days)
 |
 |
 |
 |
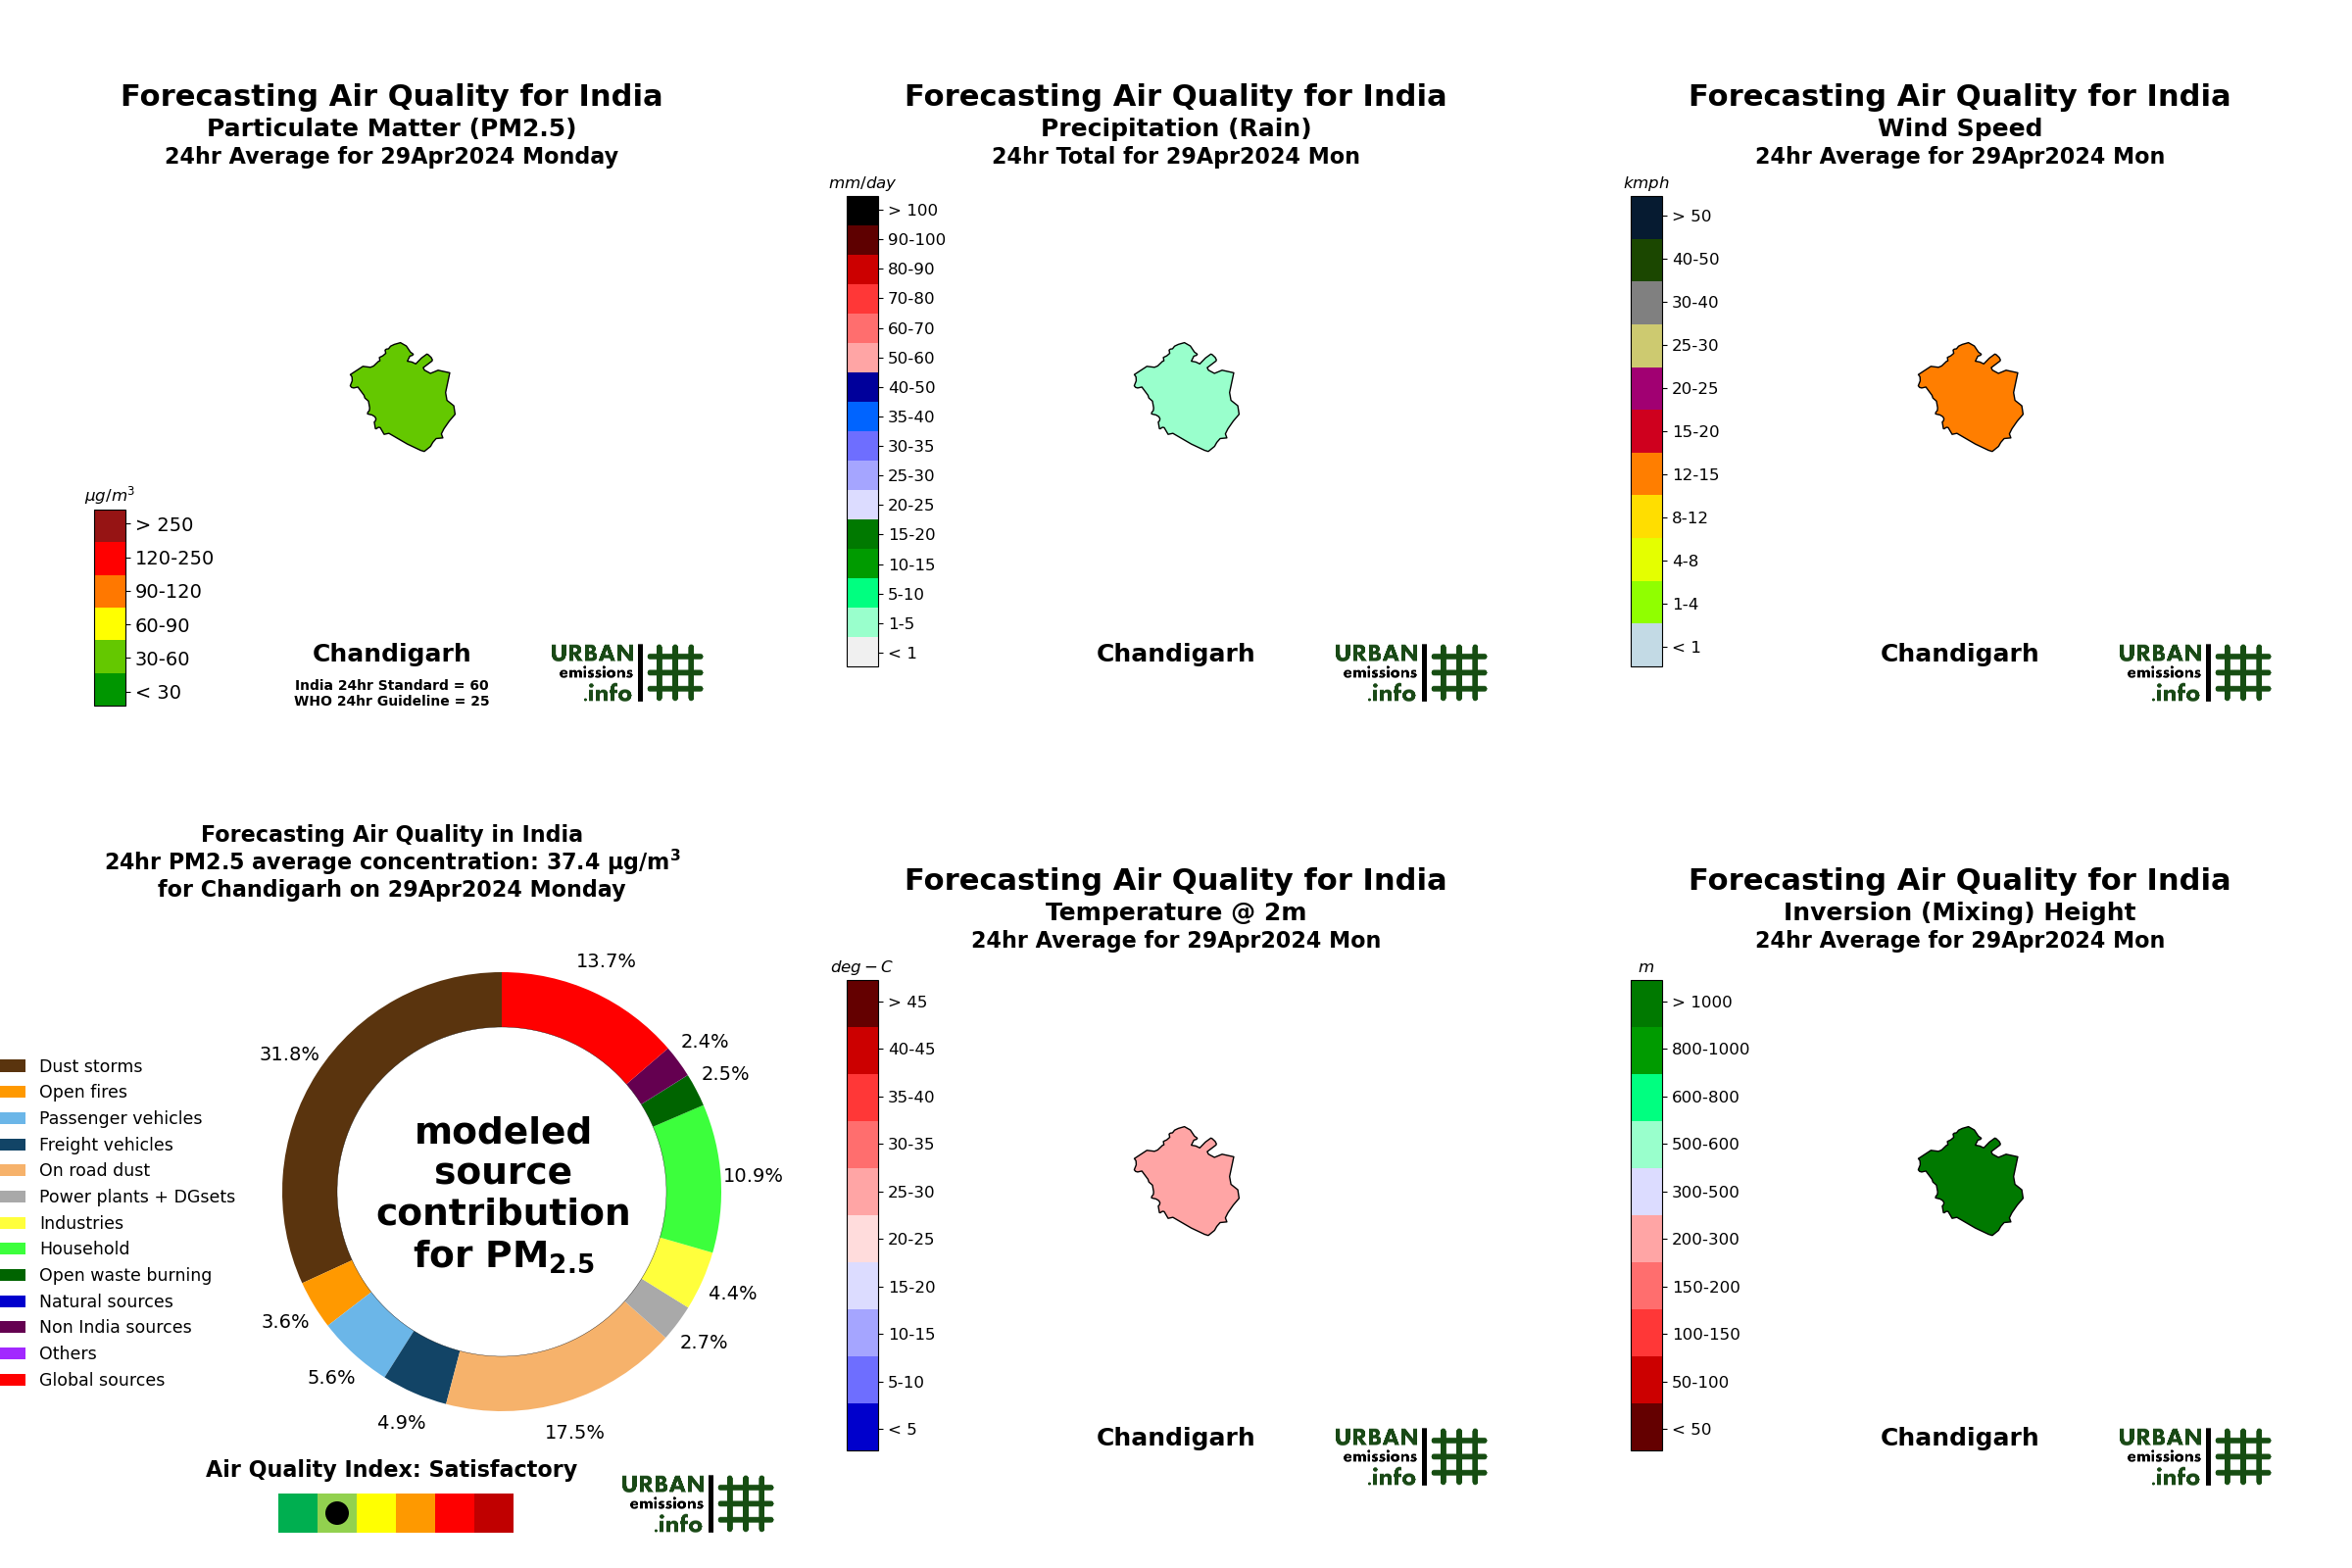
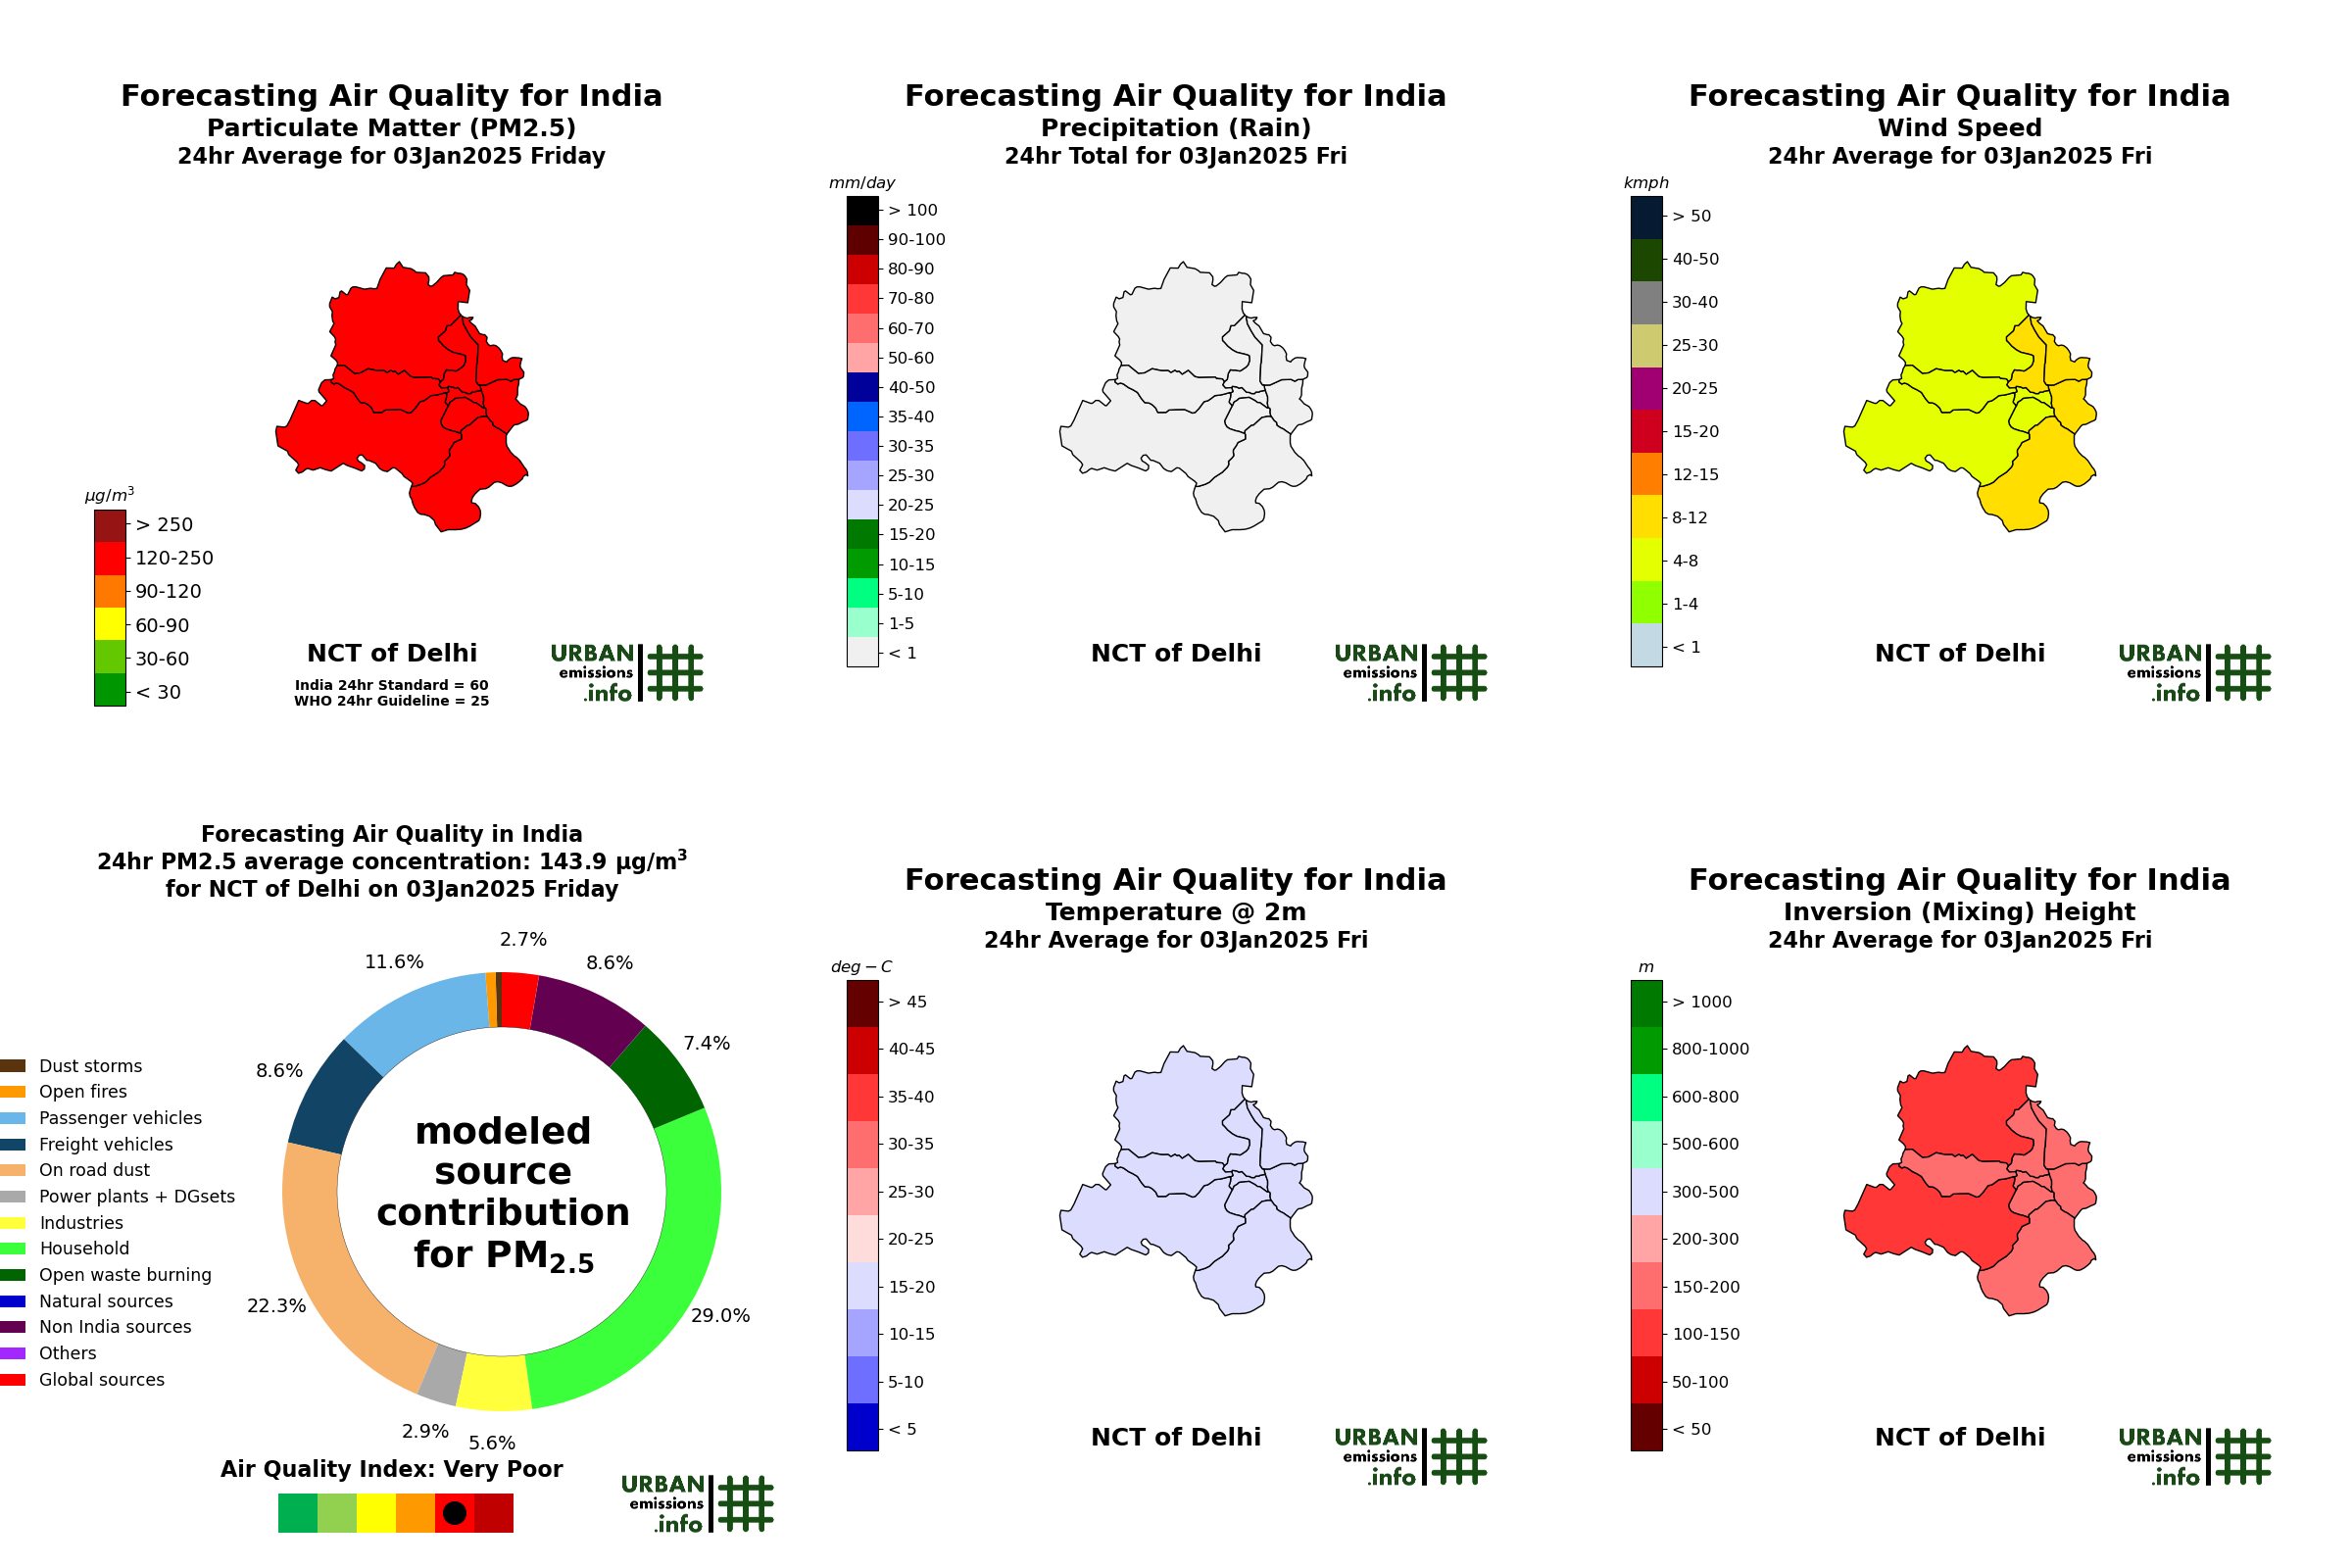
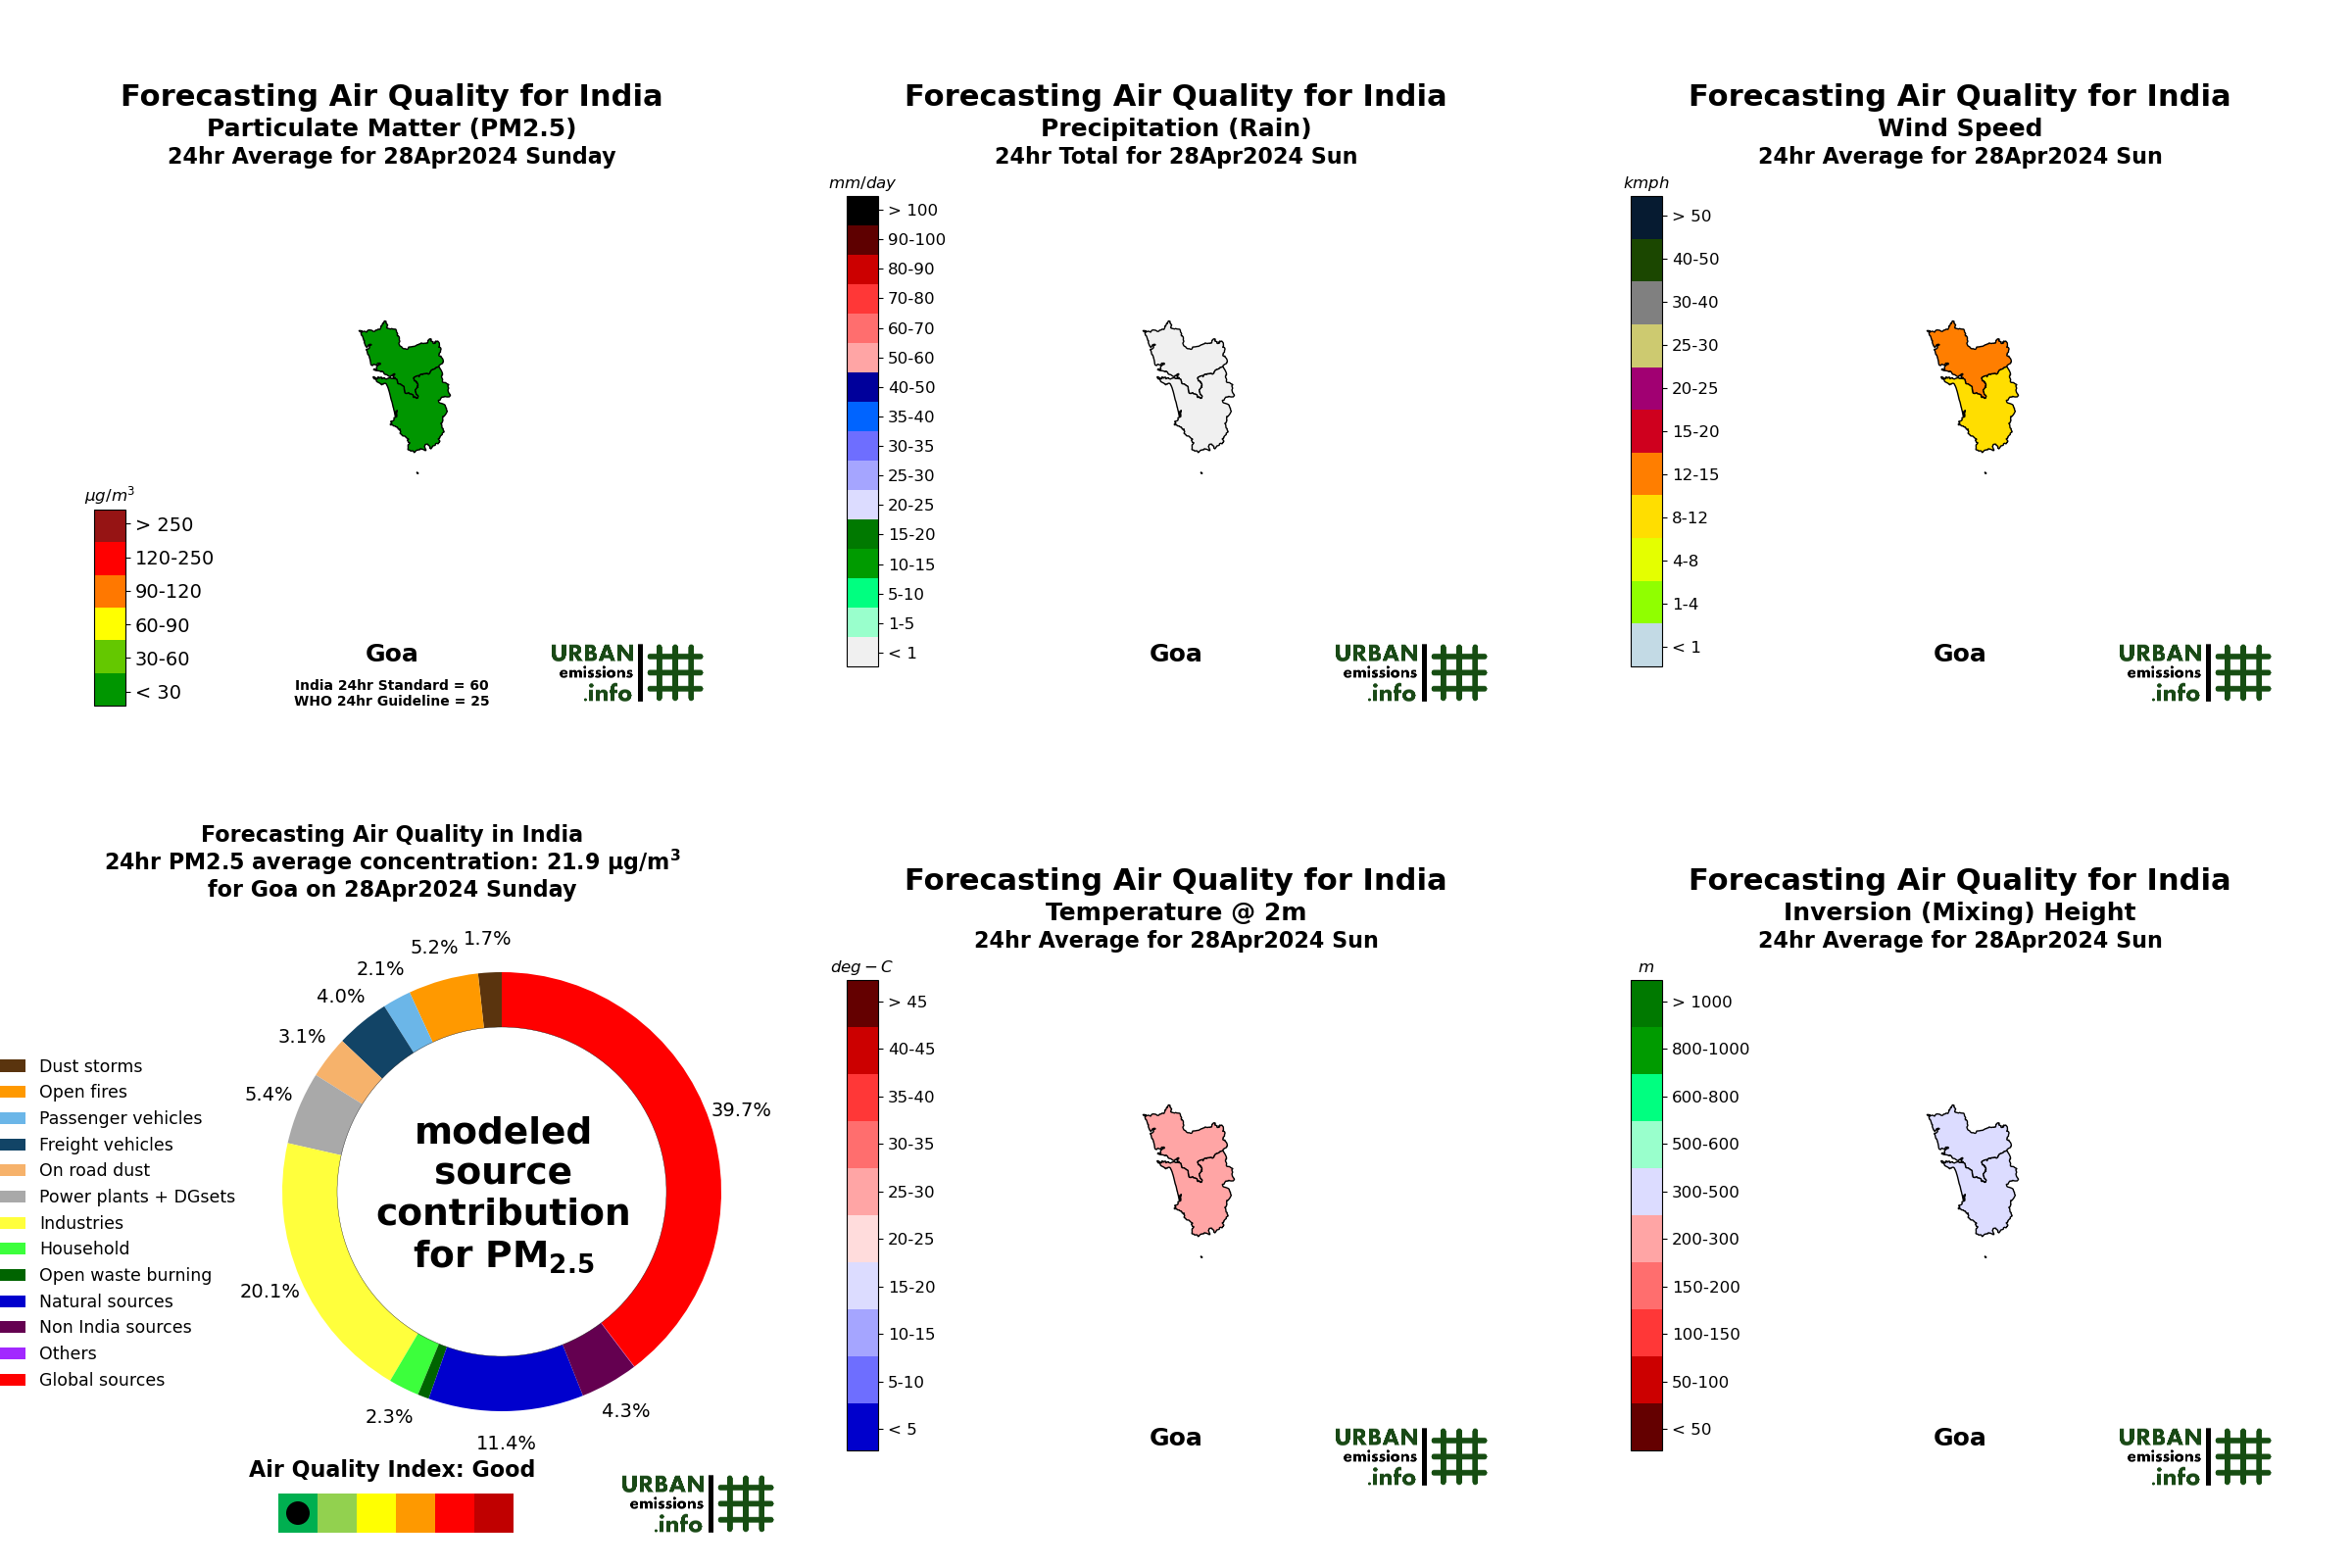
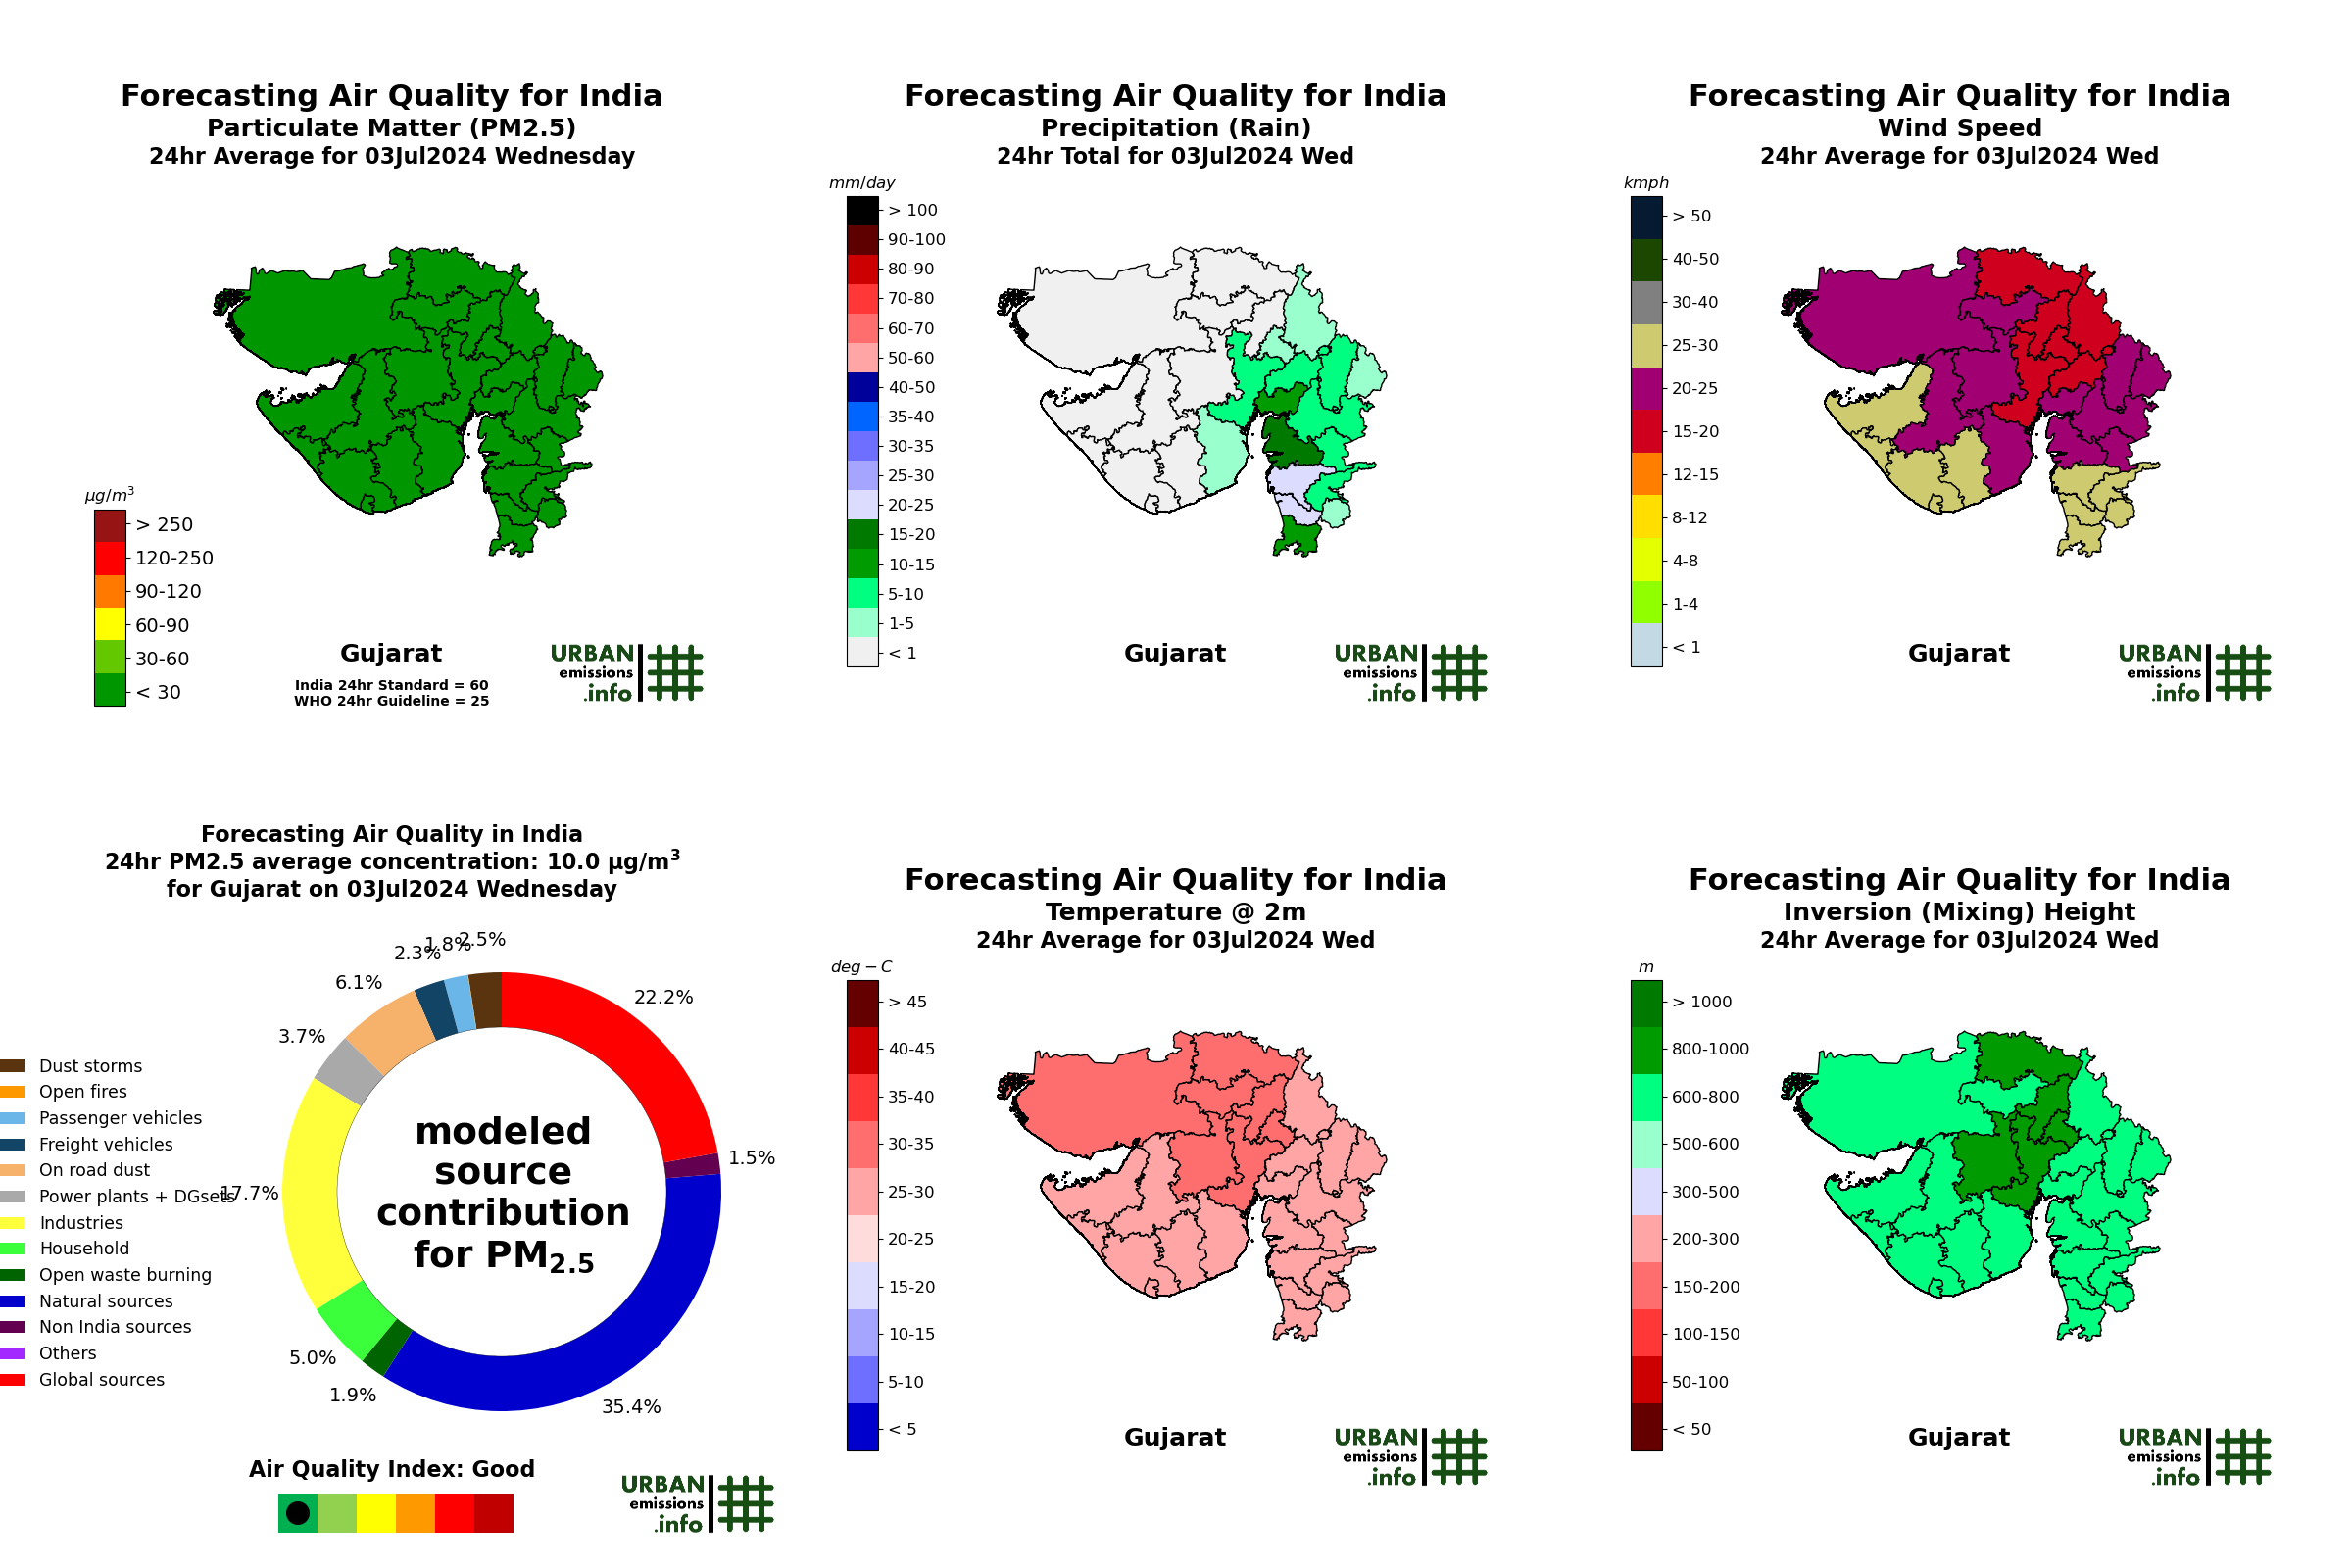
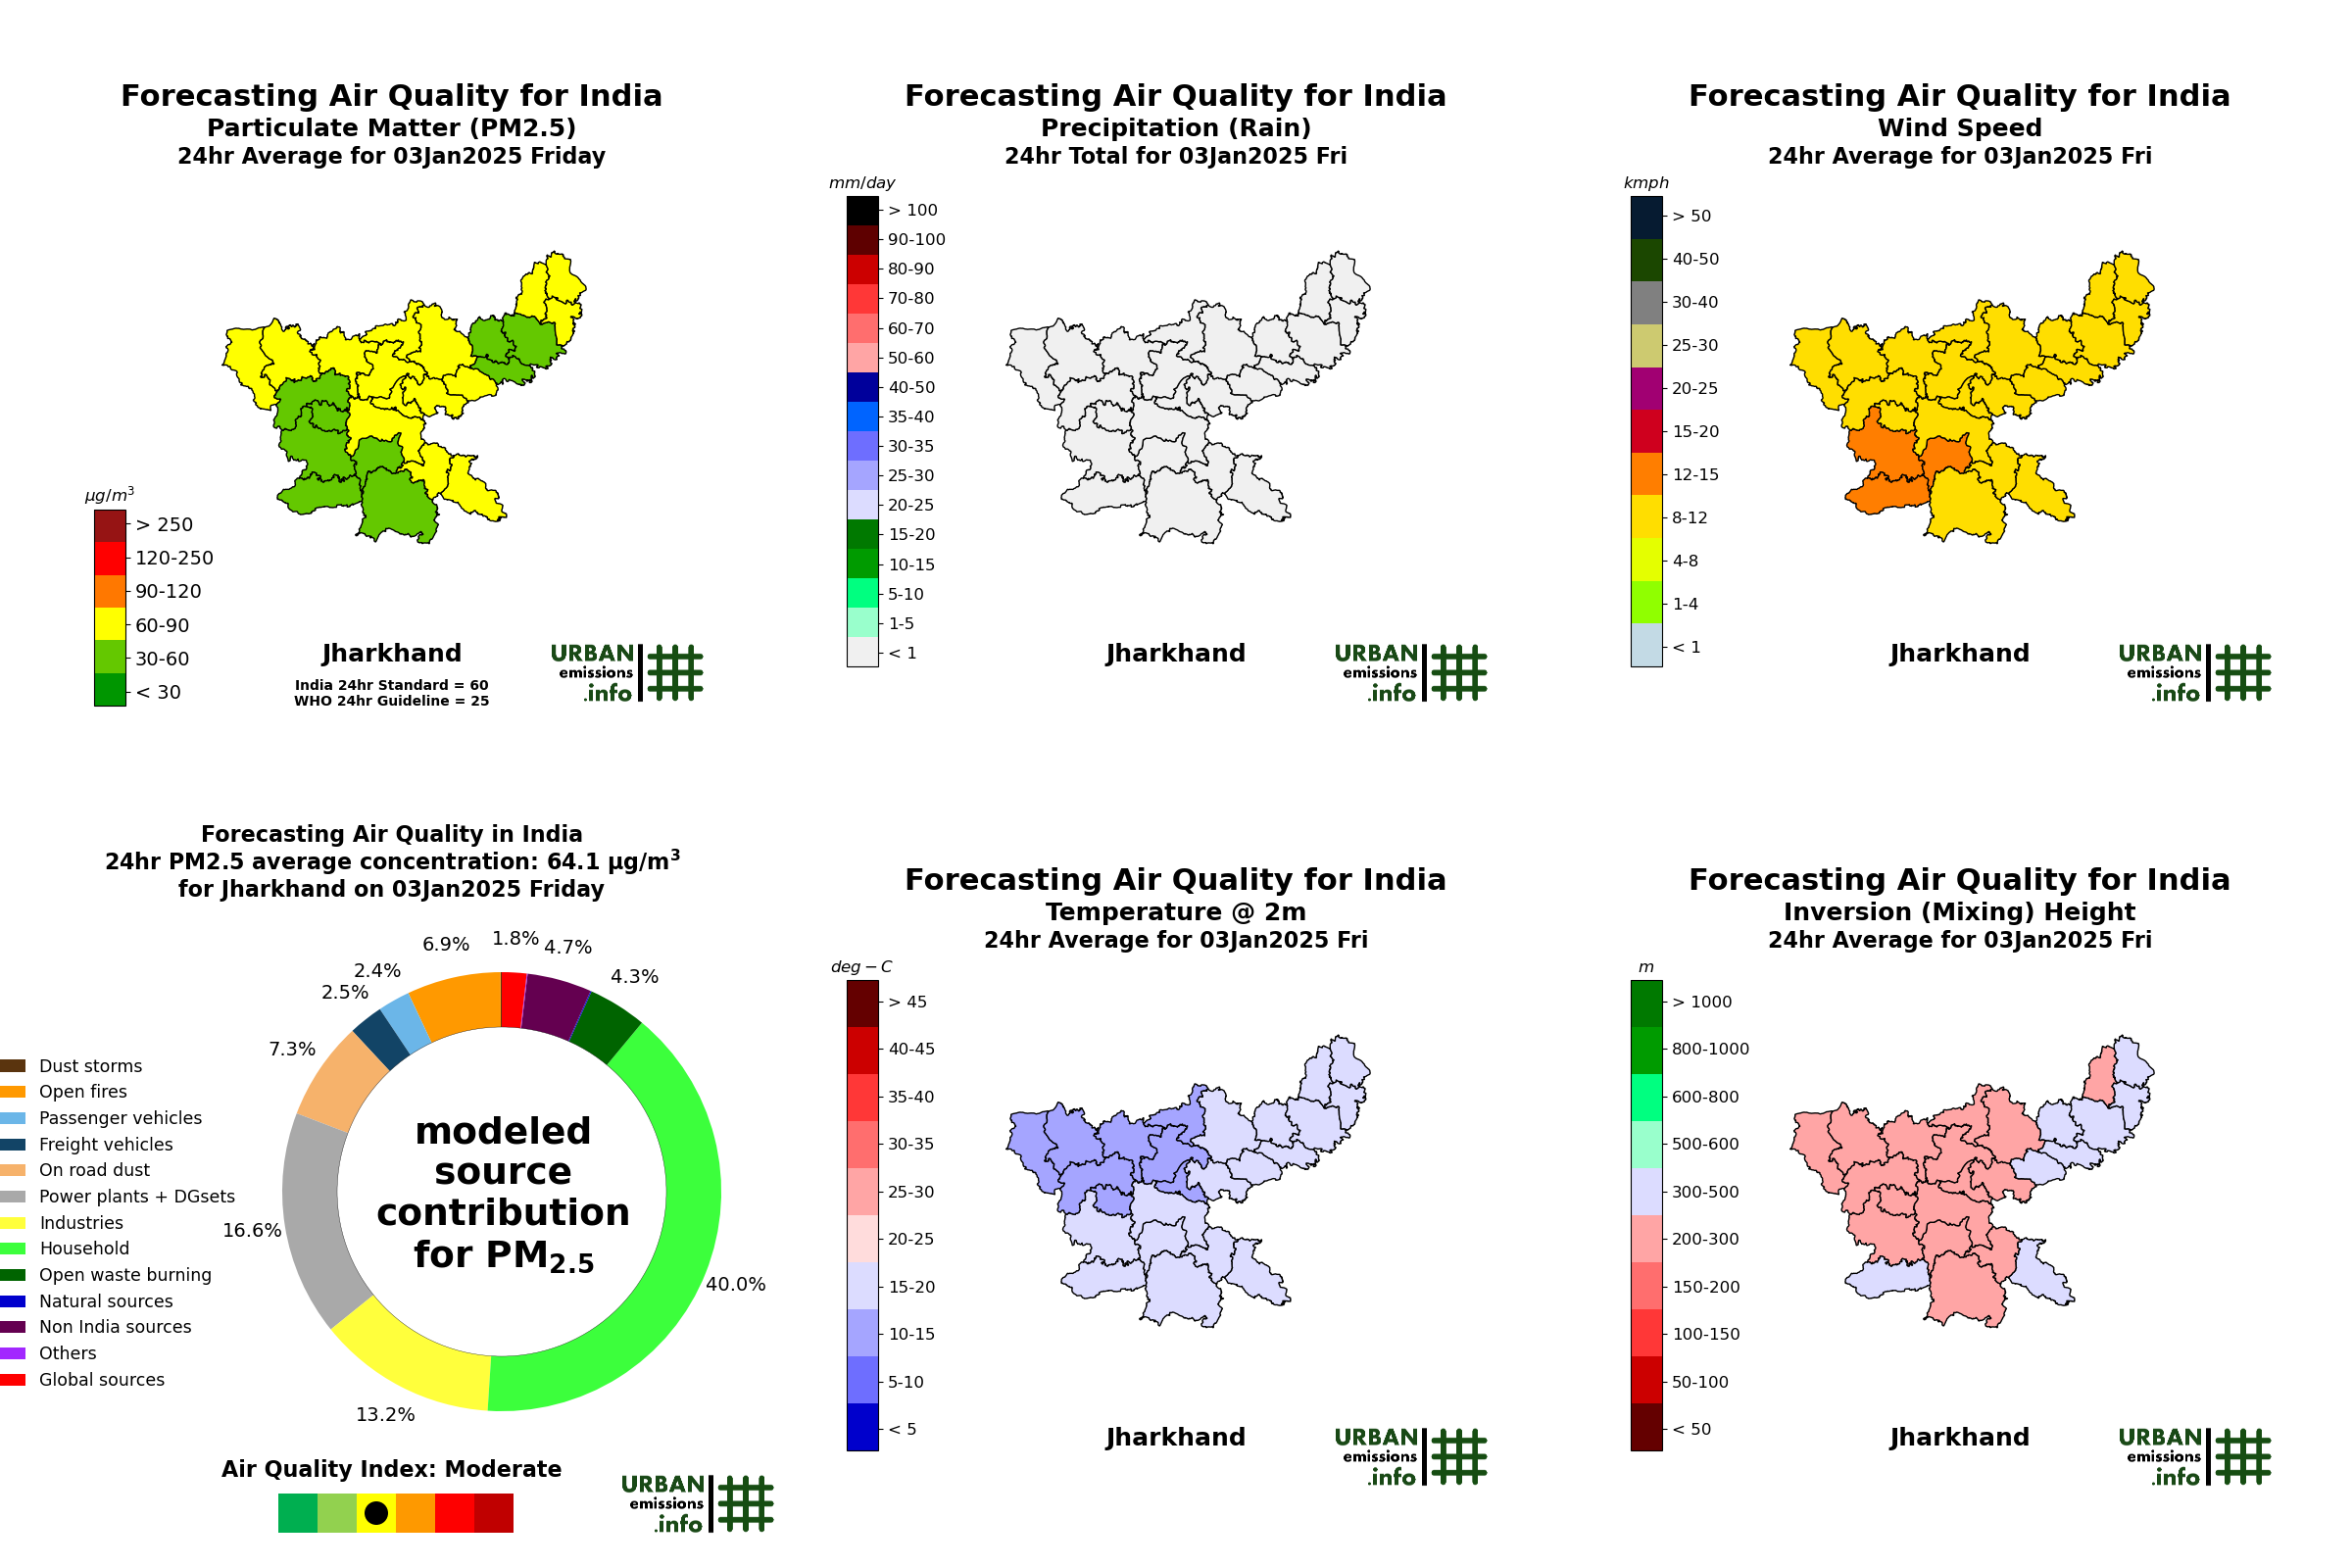
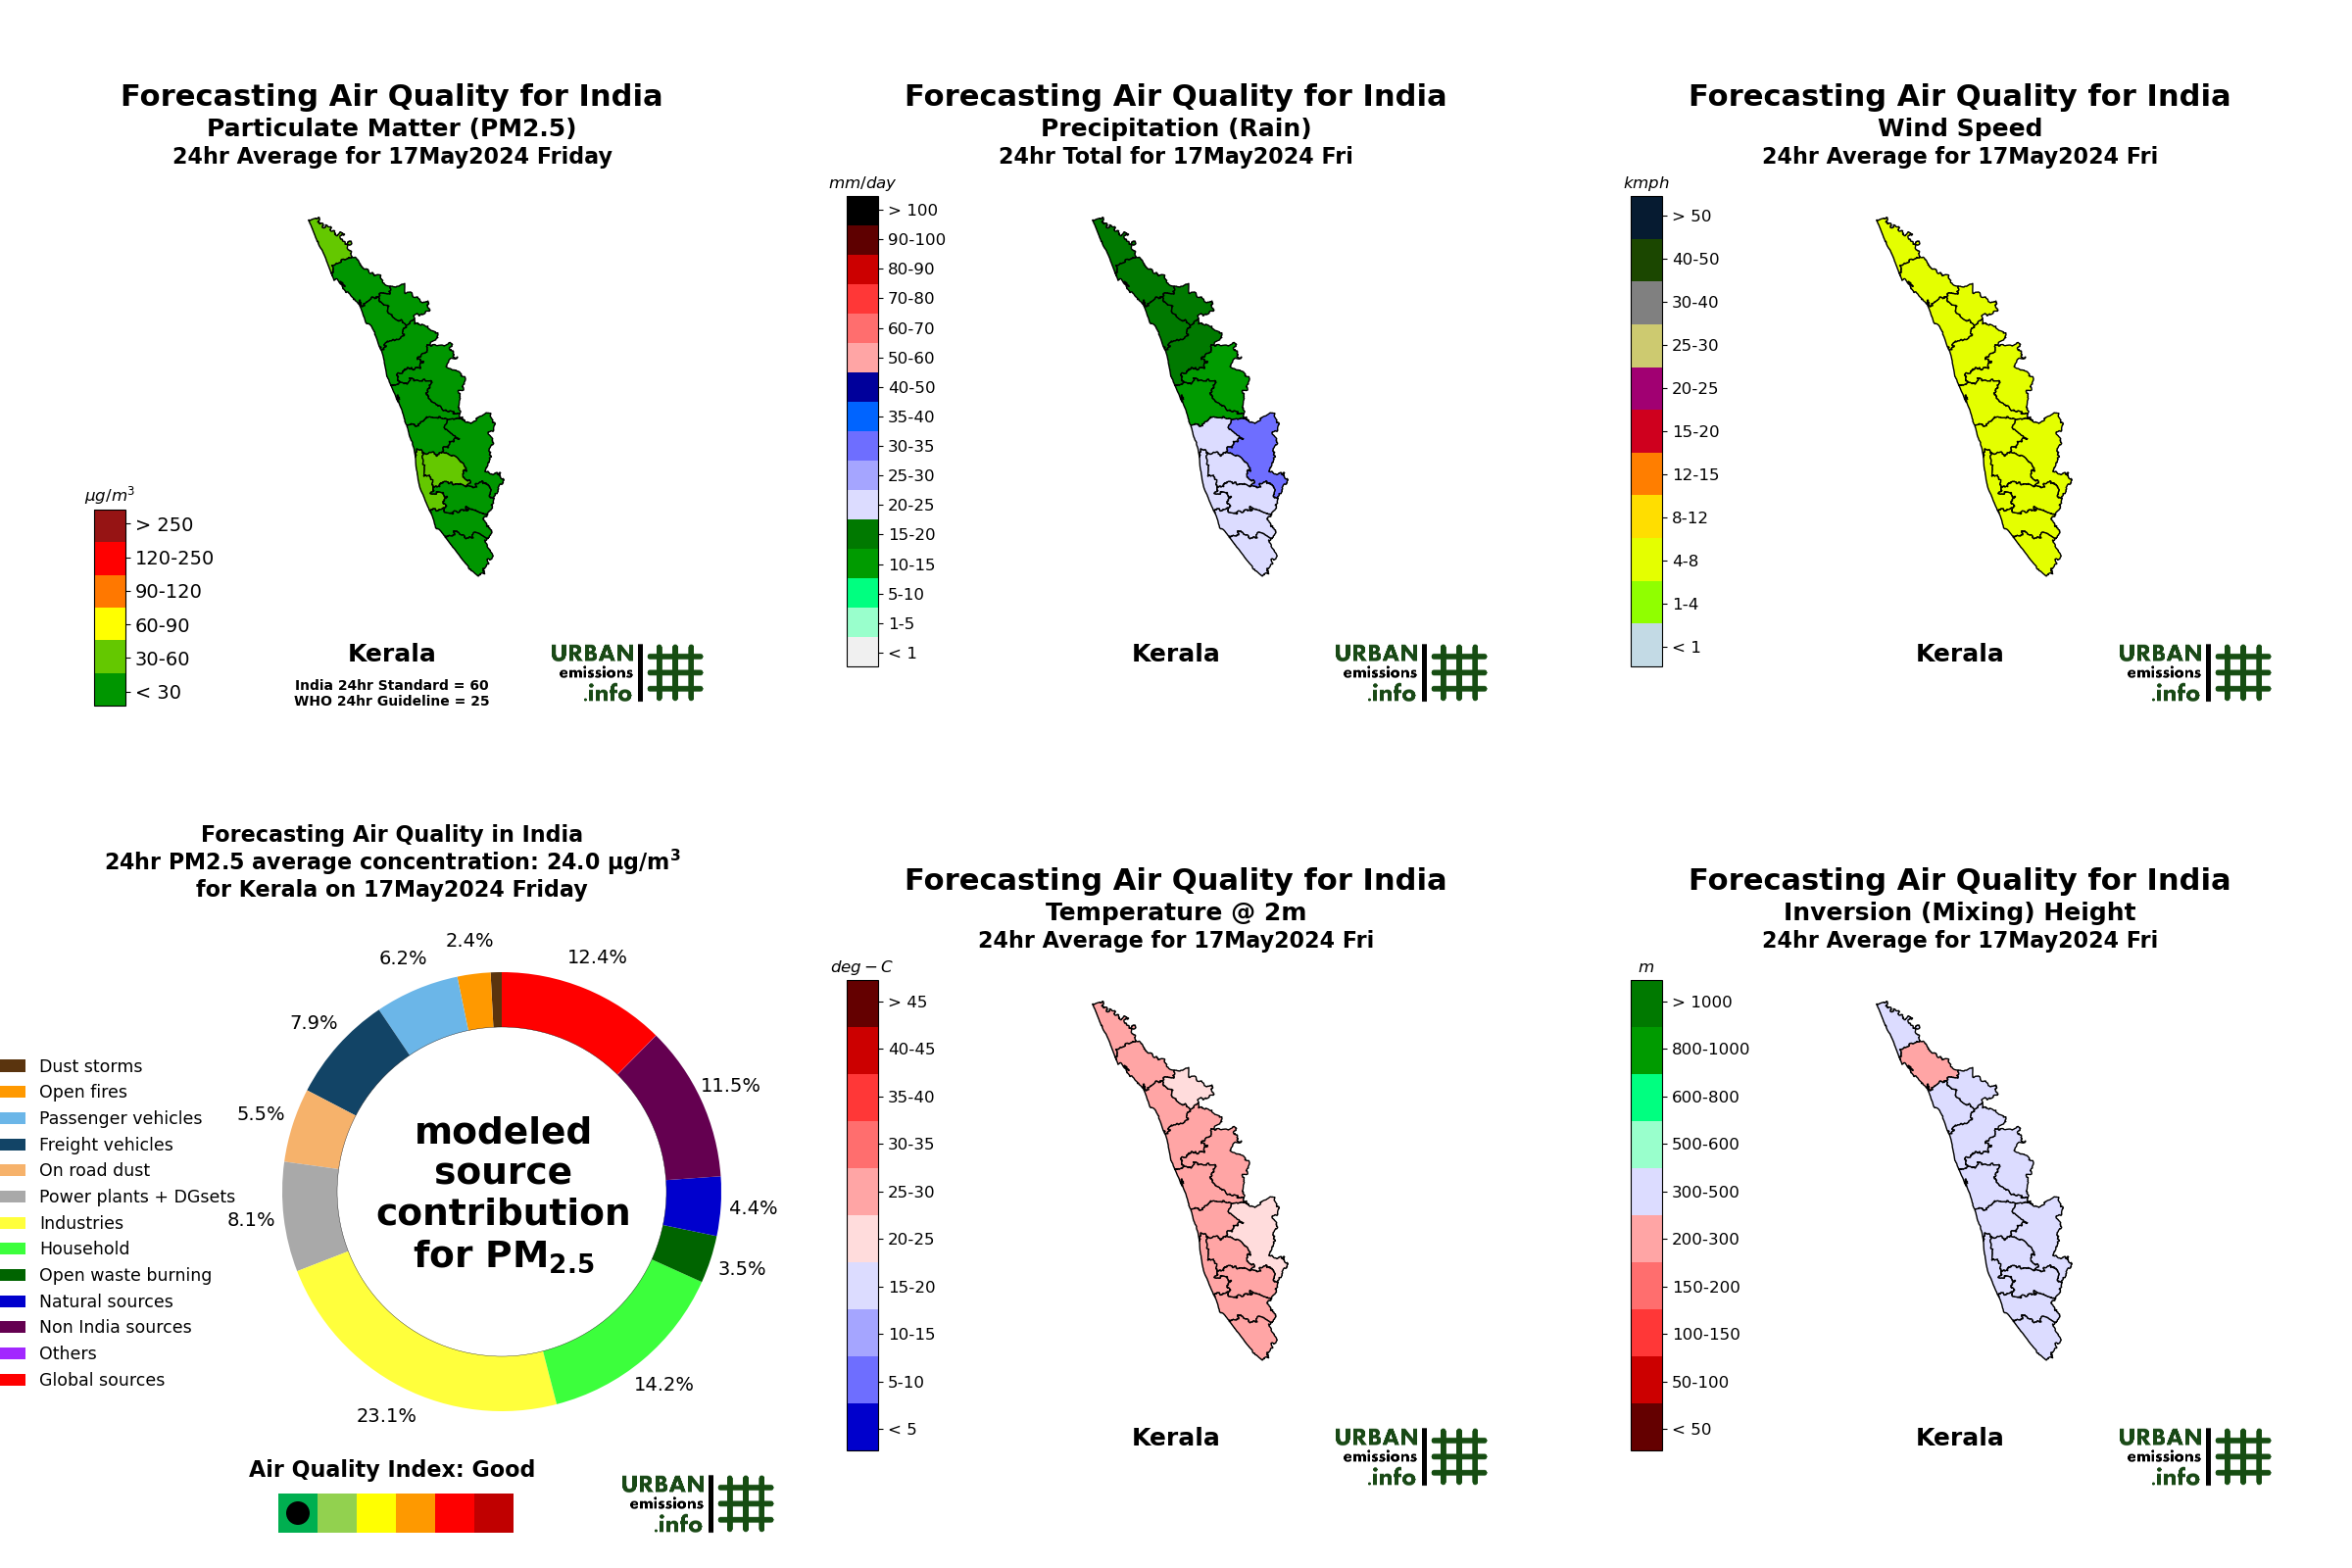
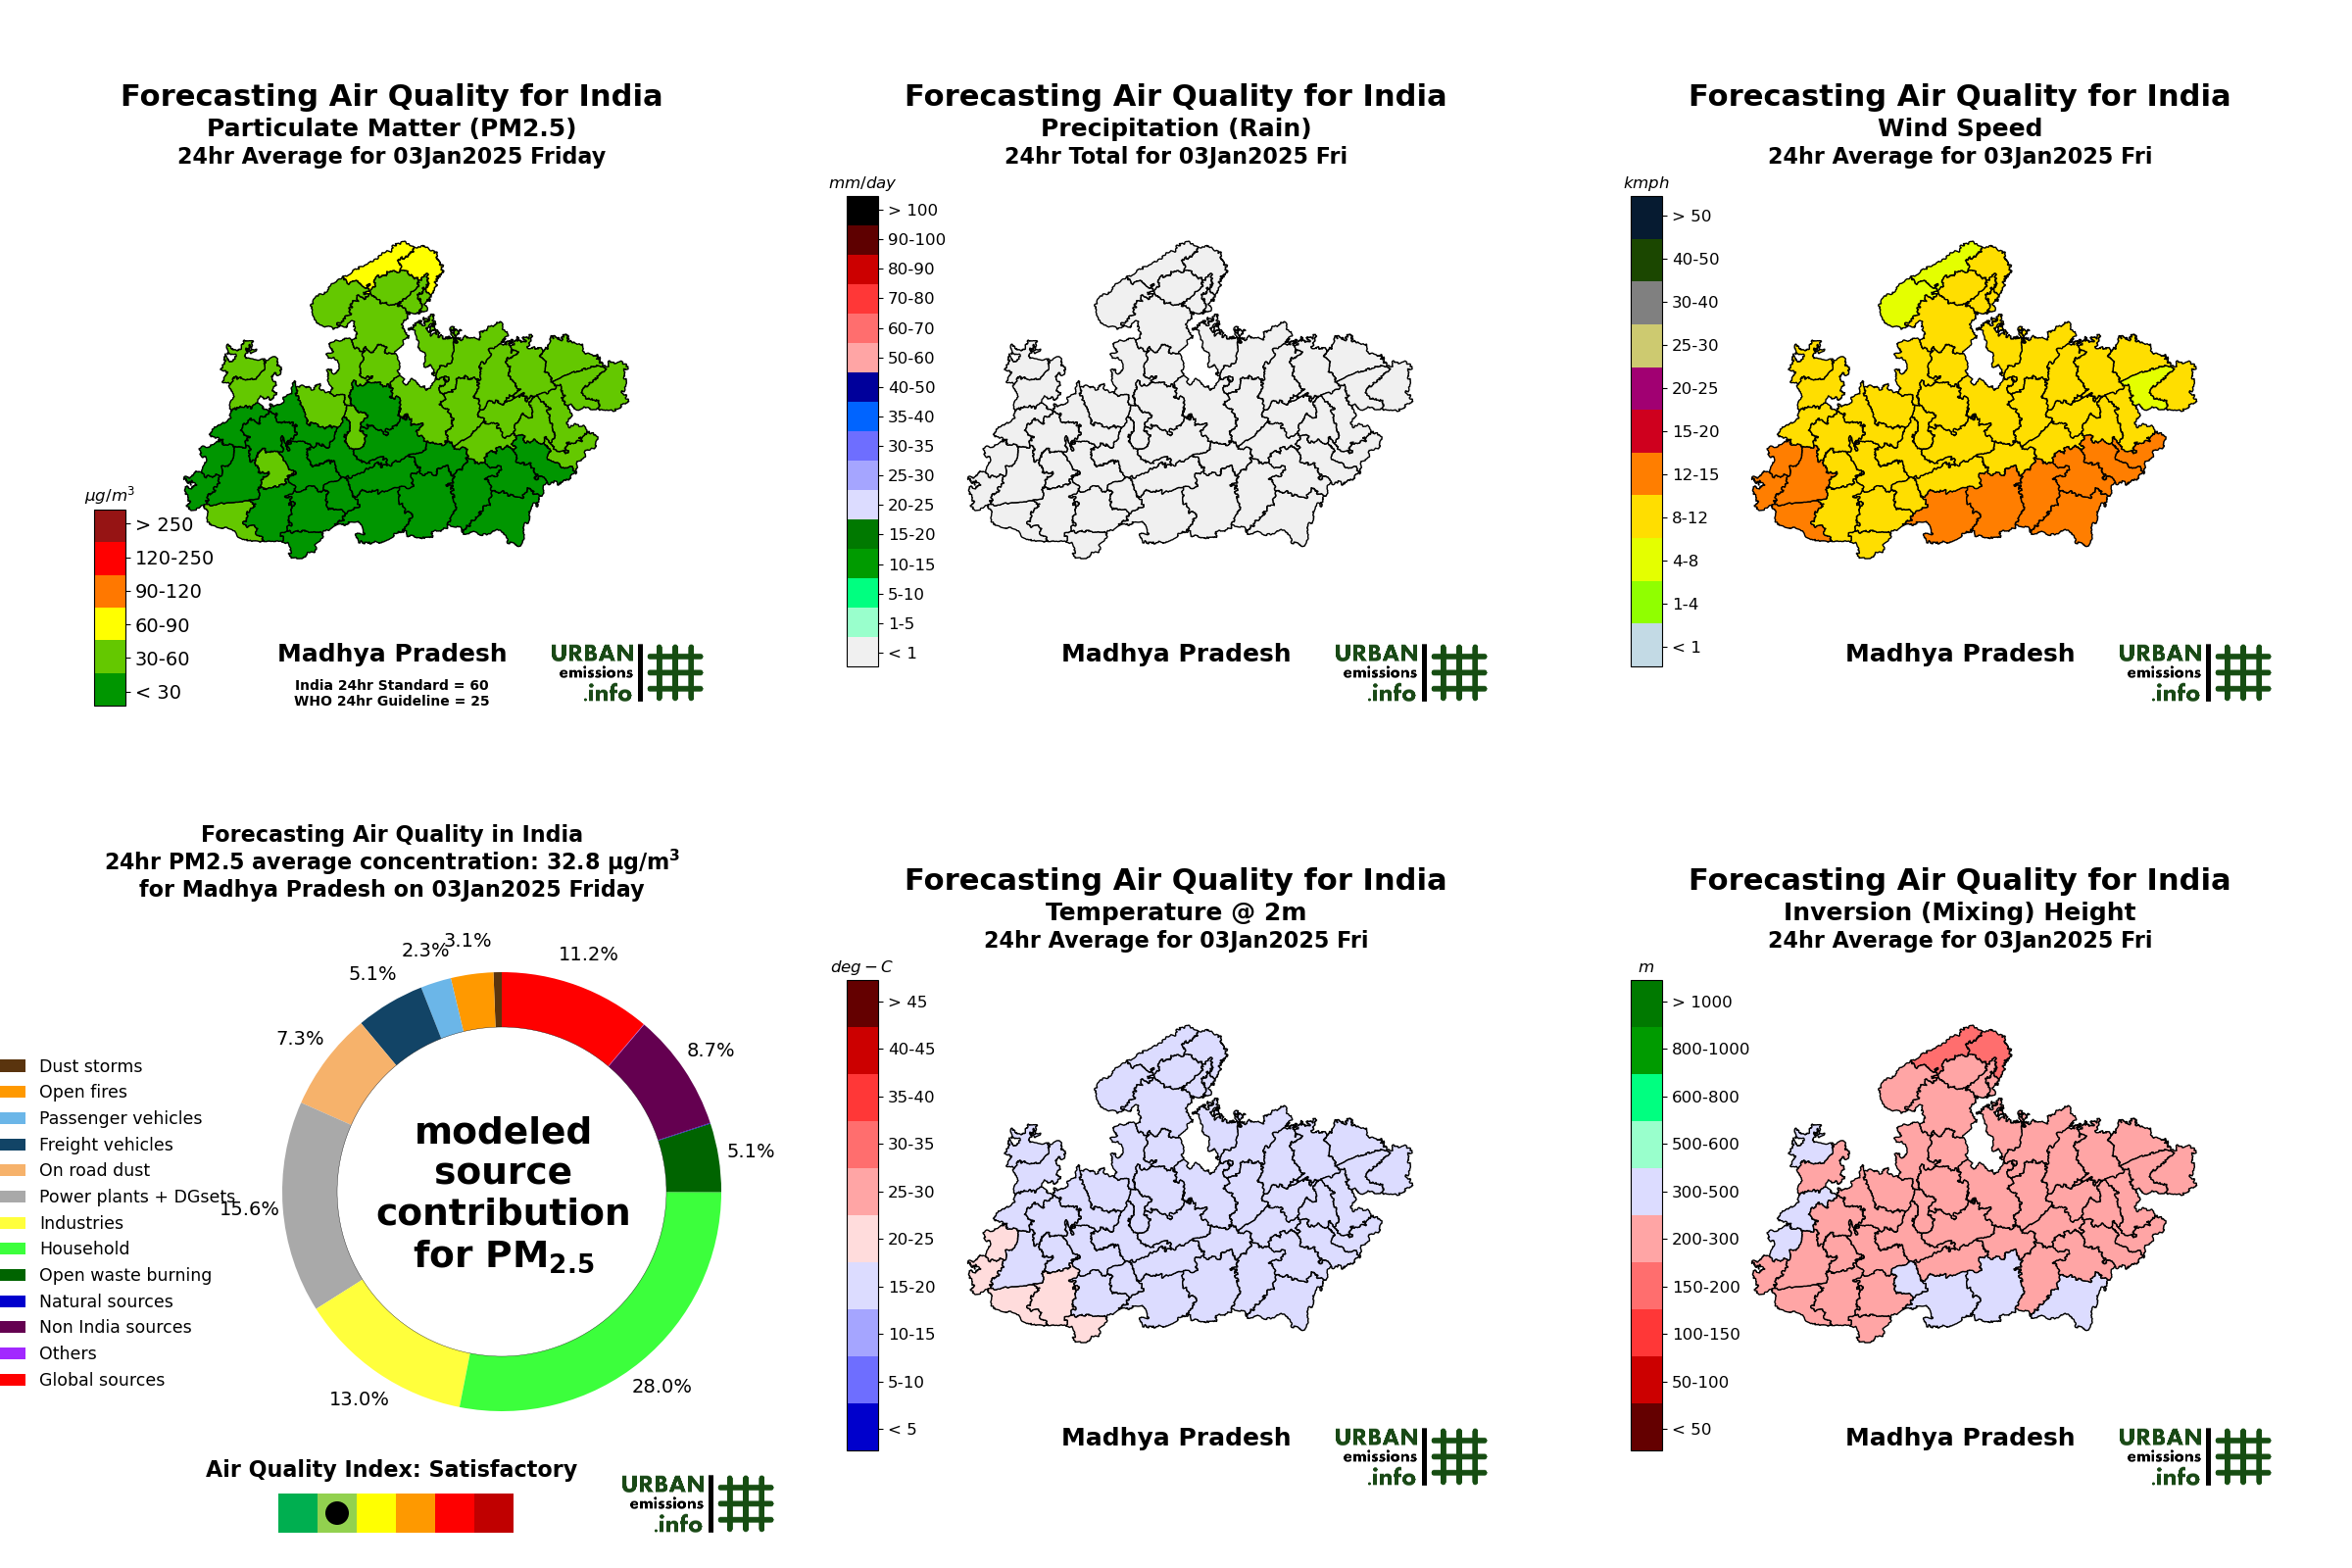
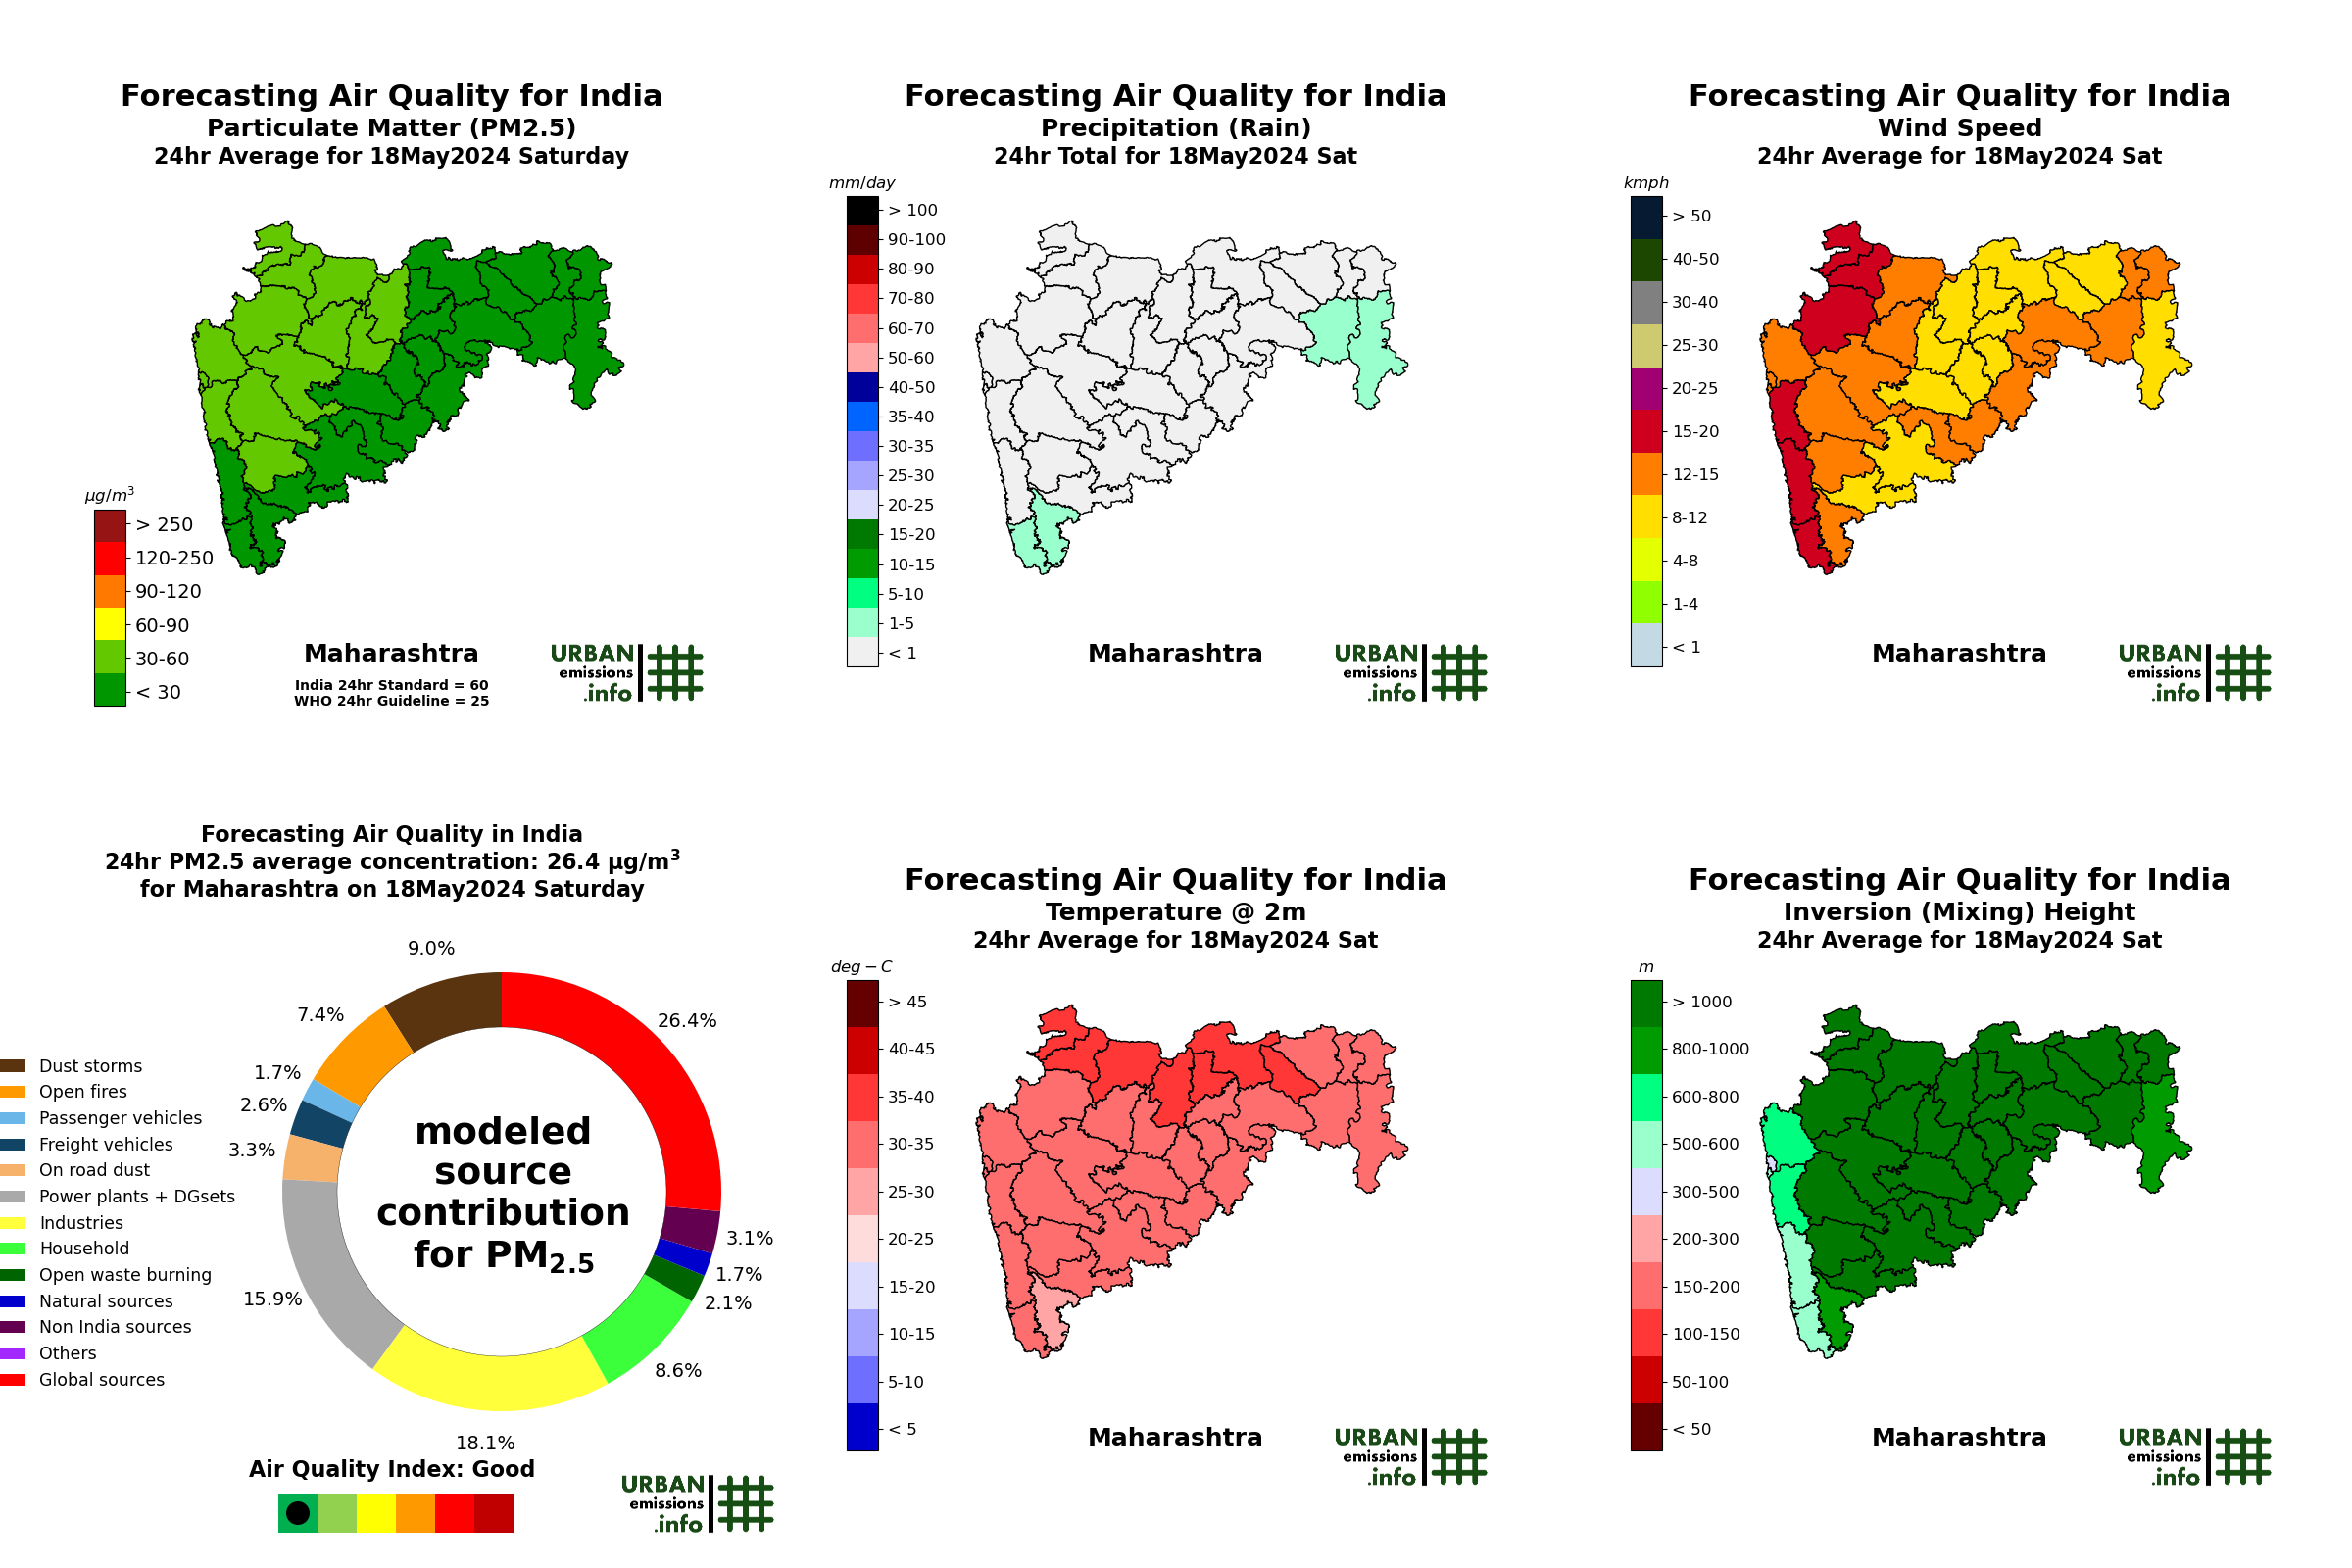
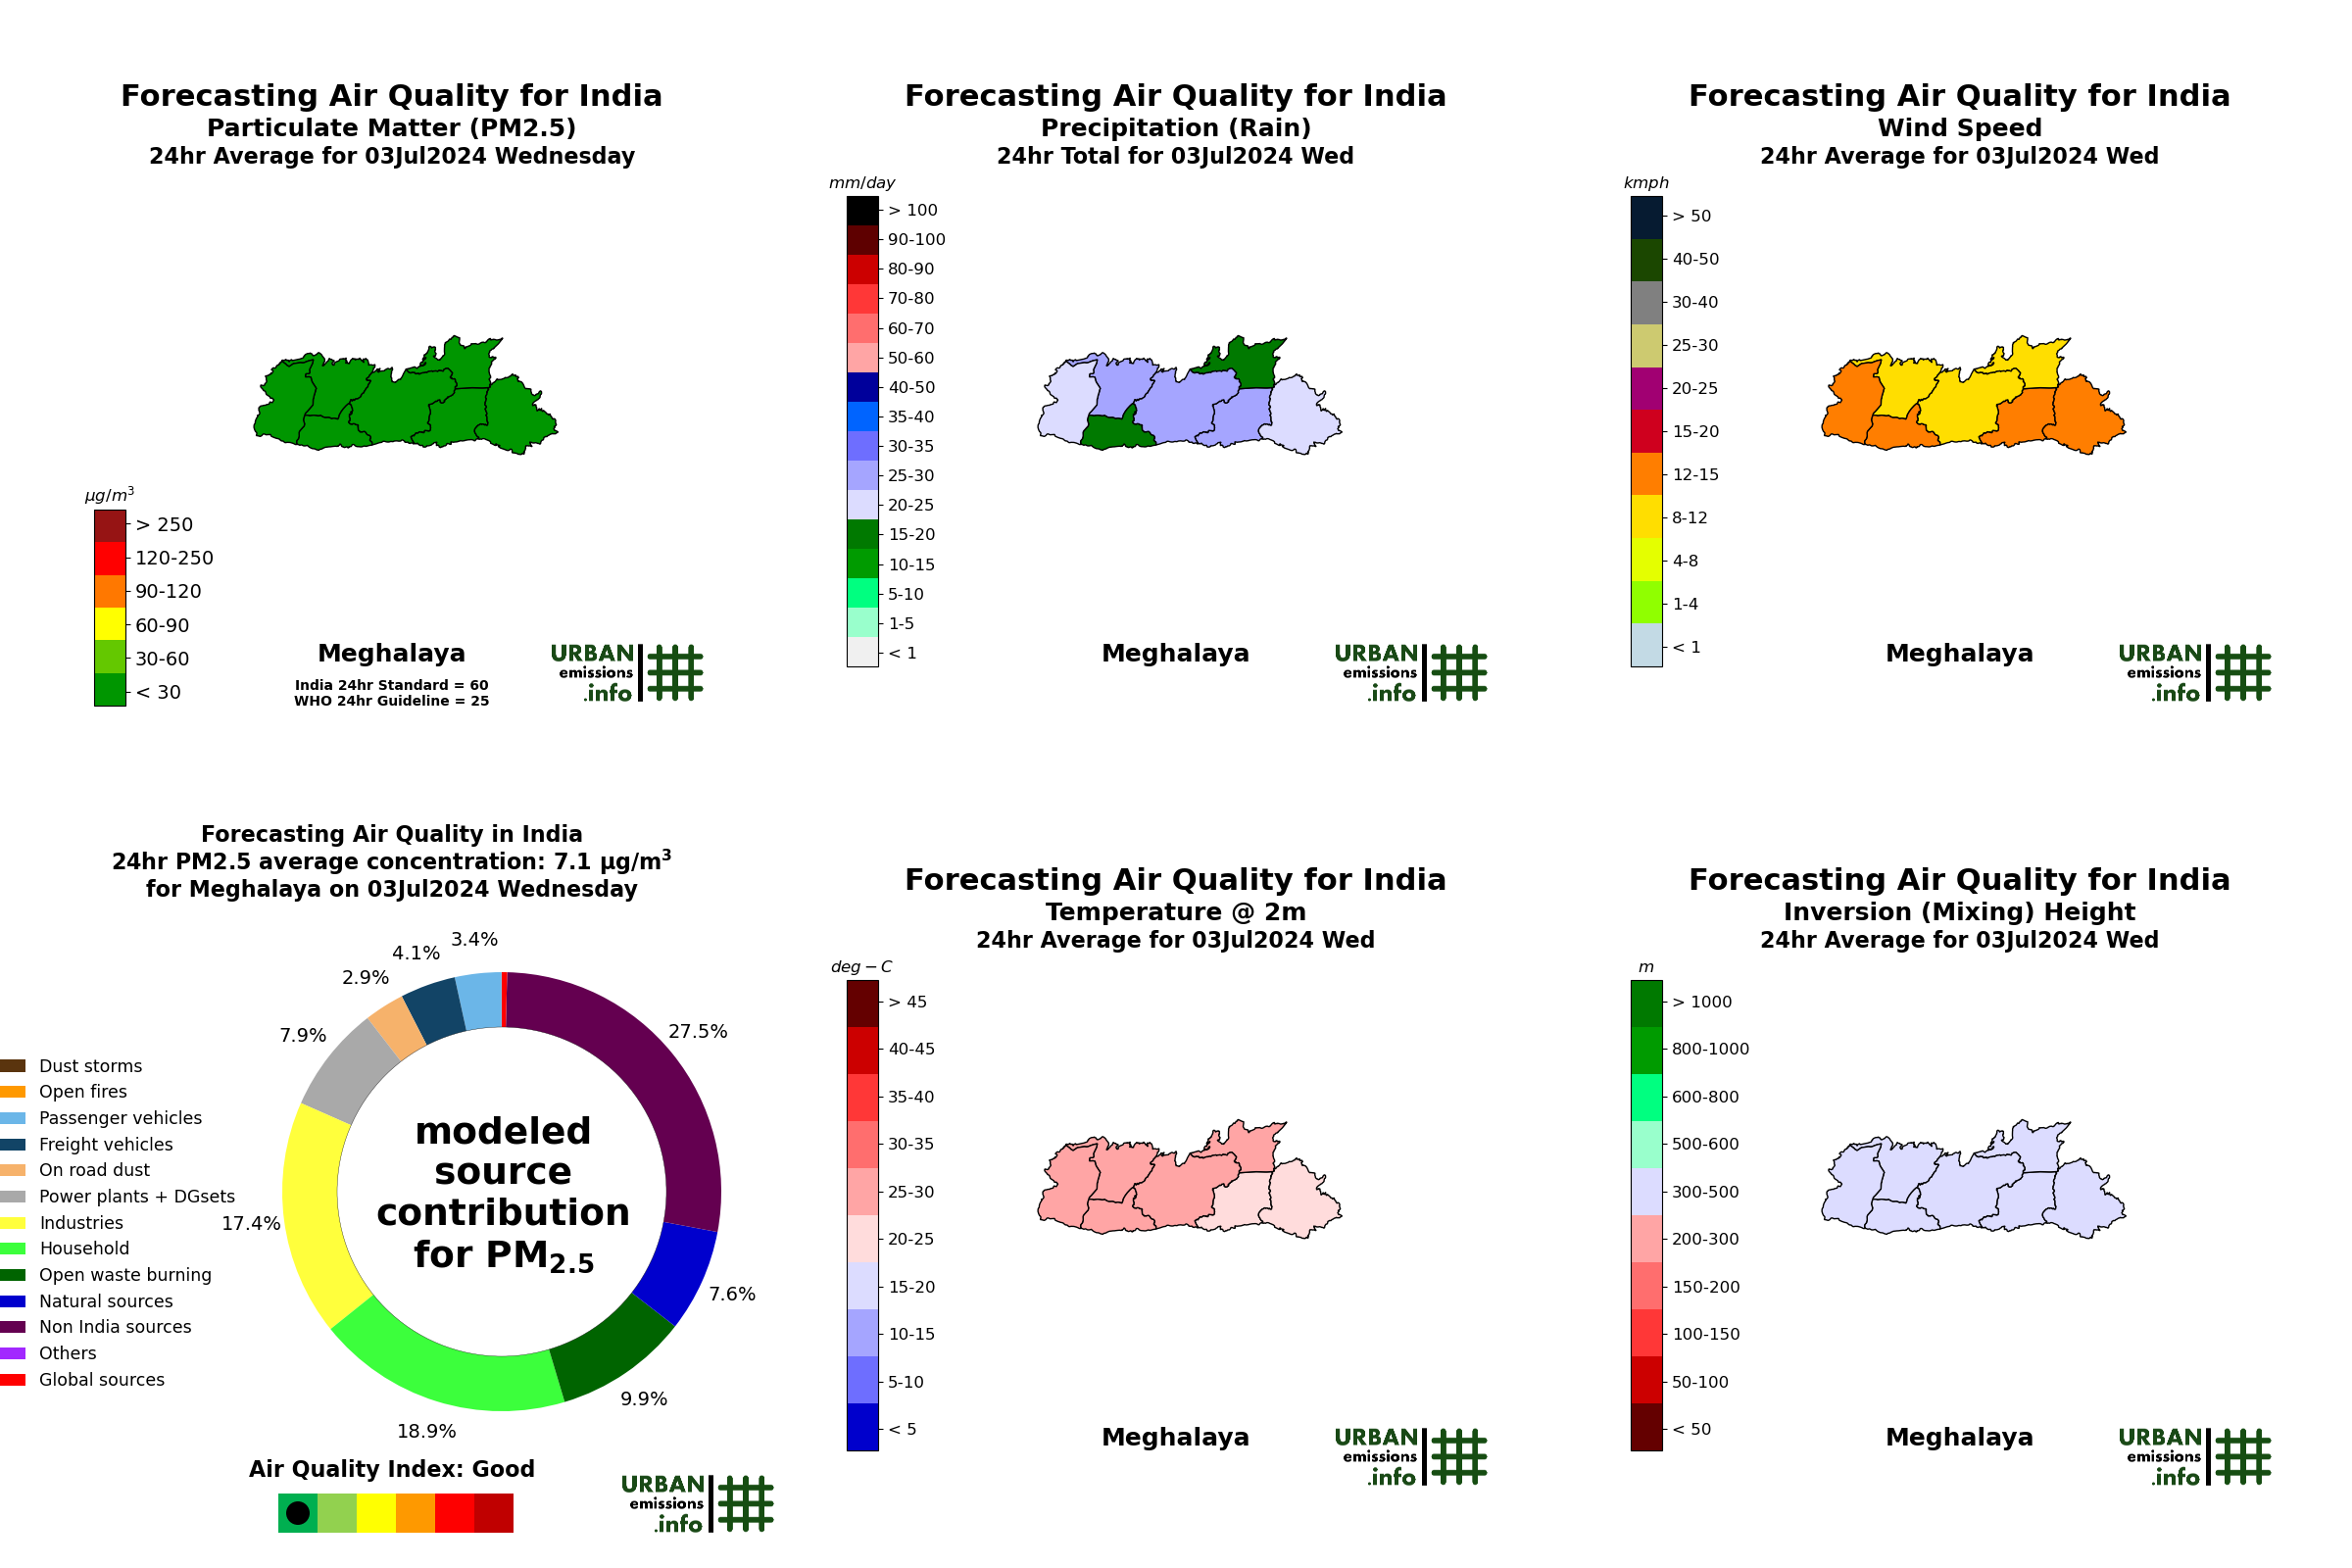
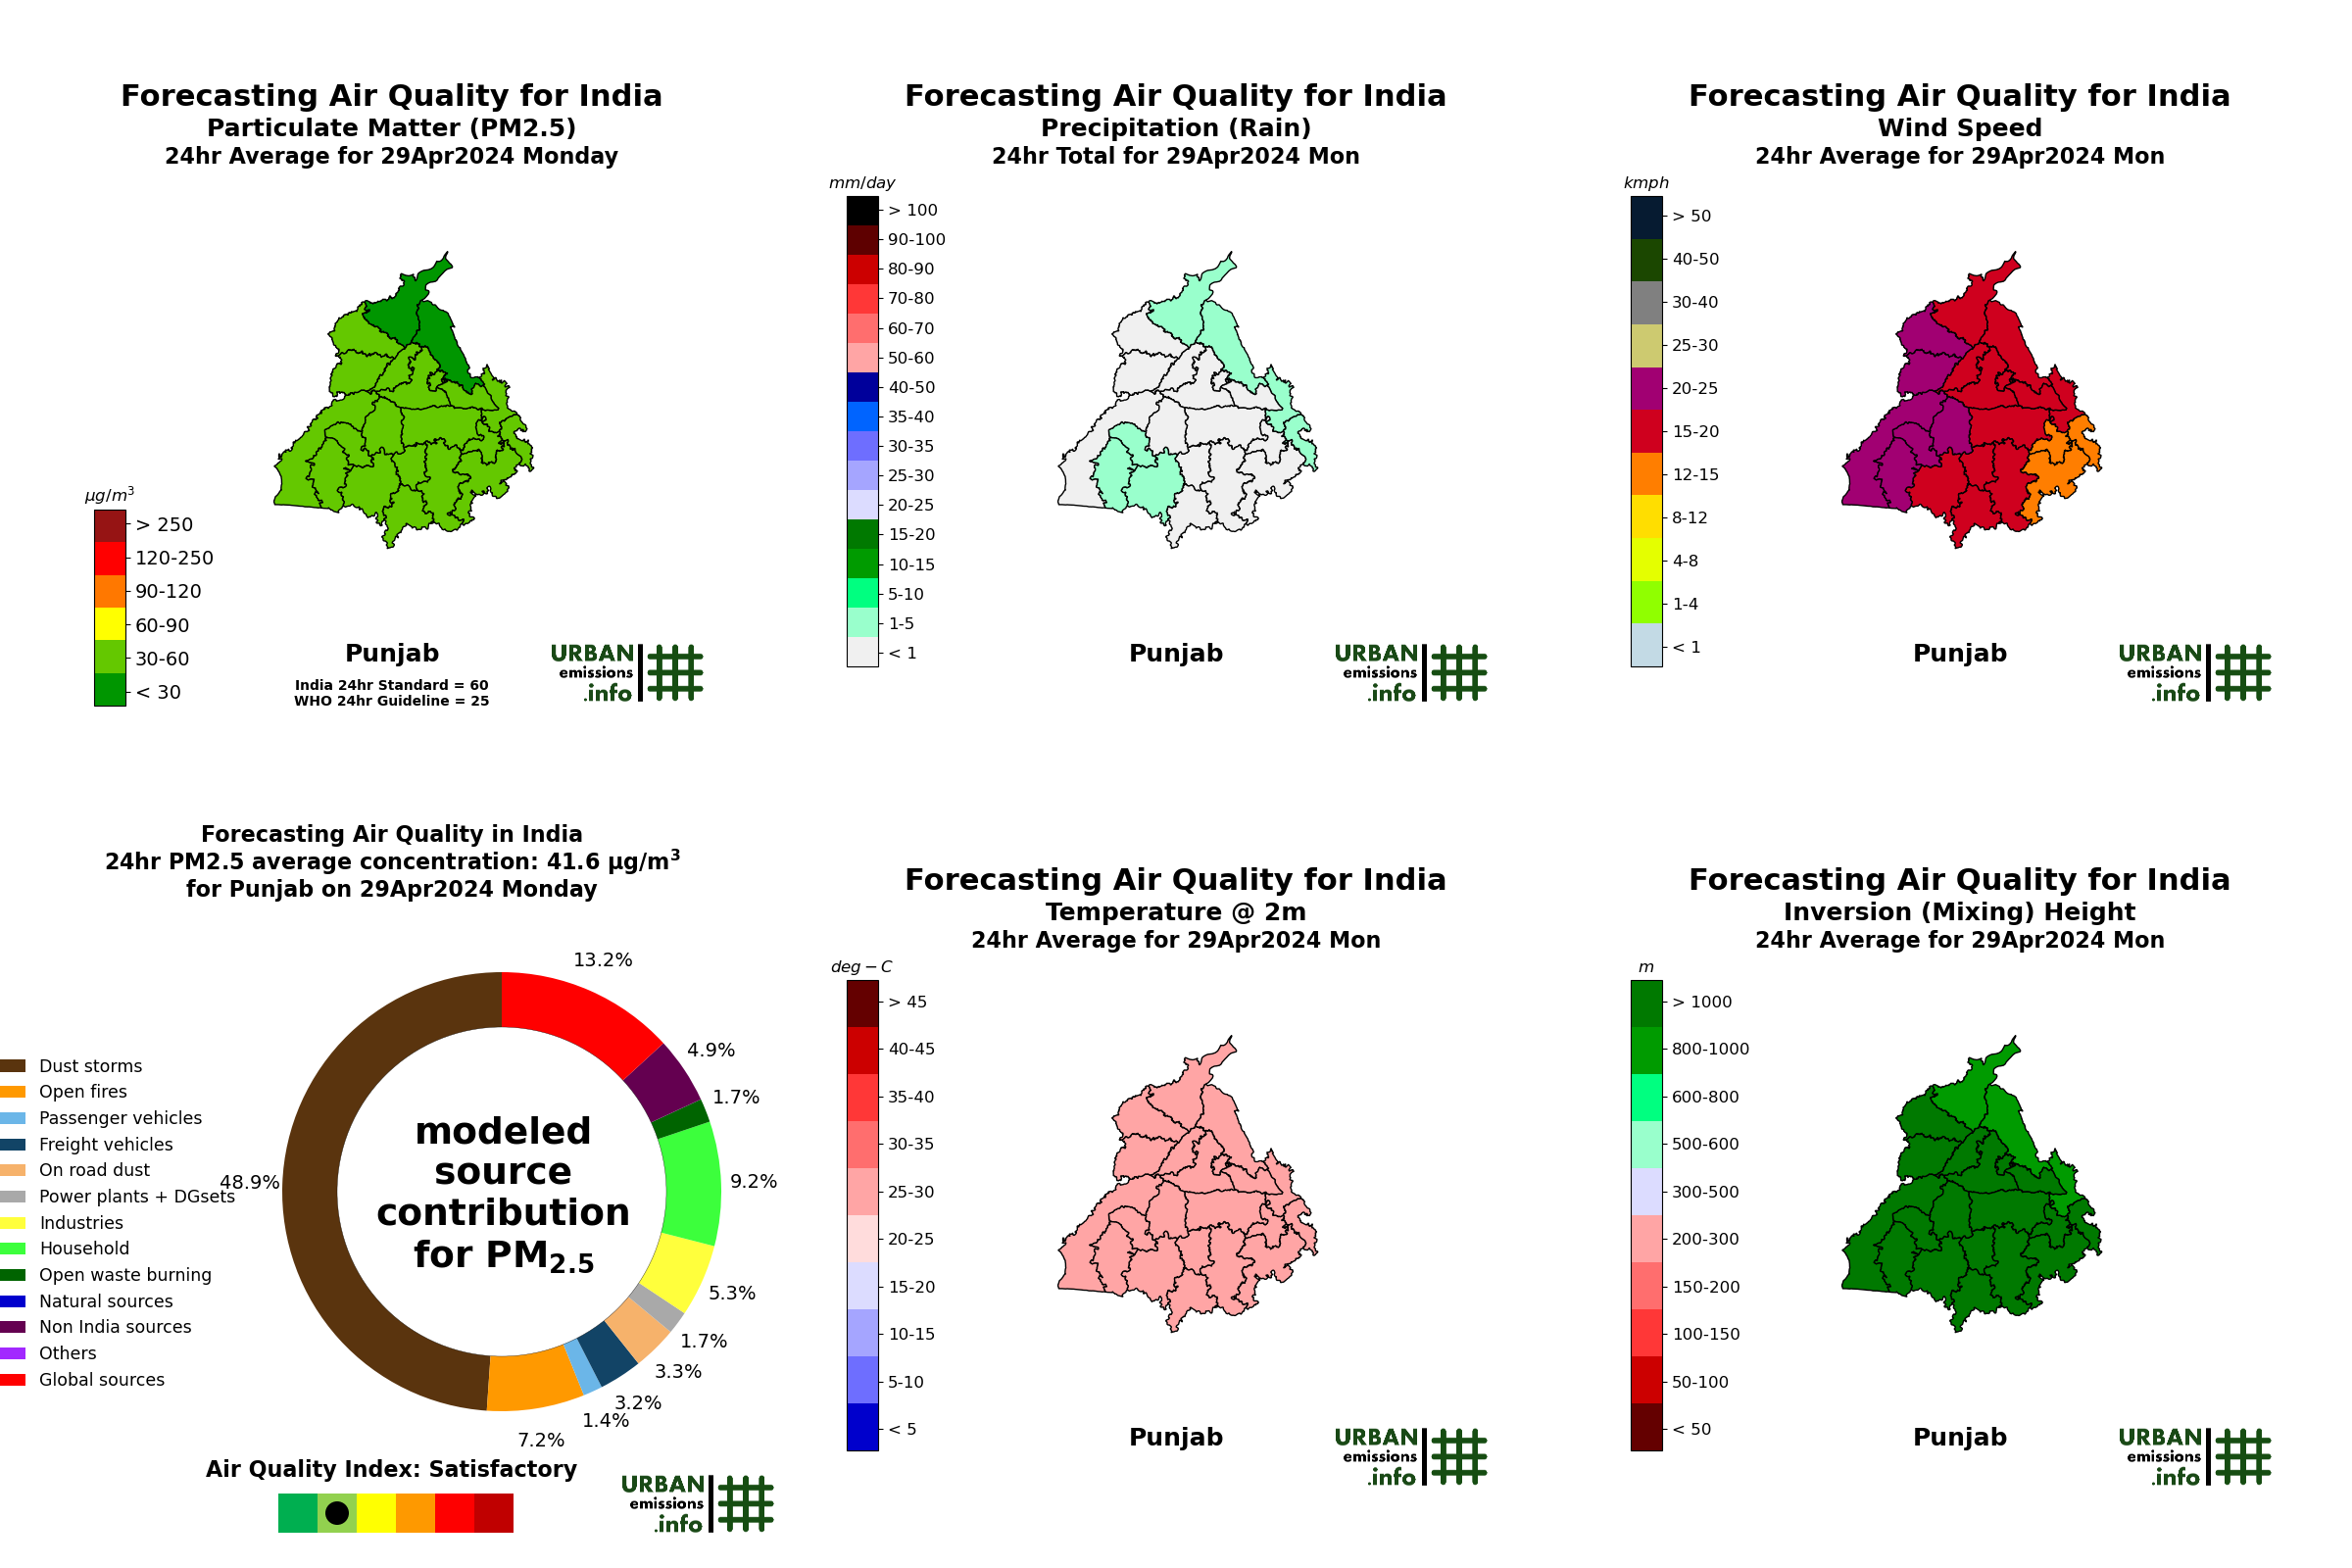
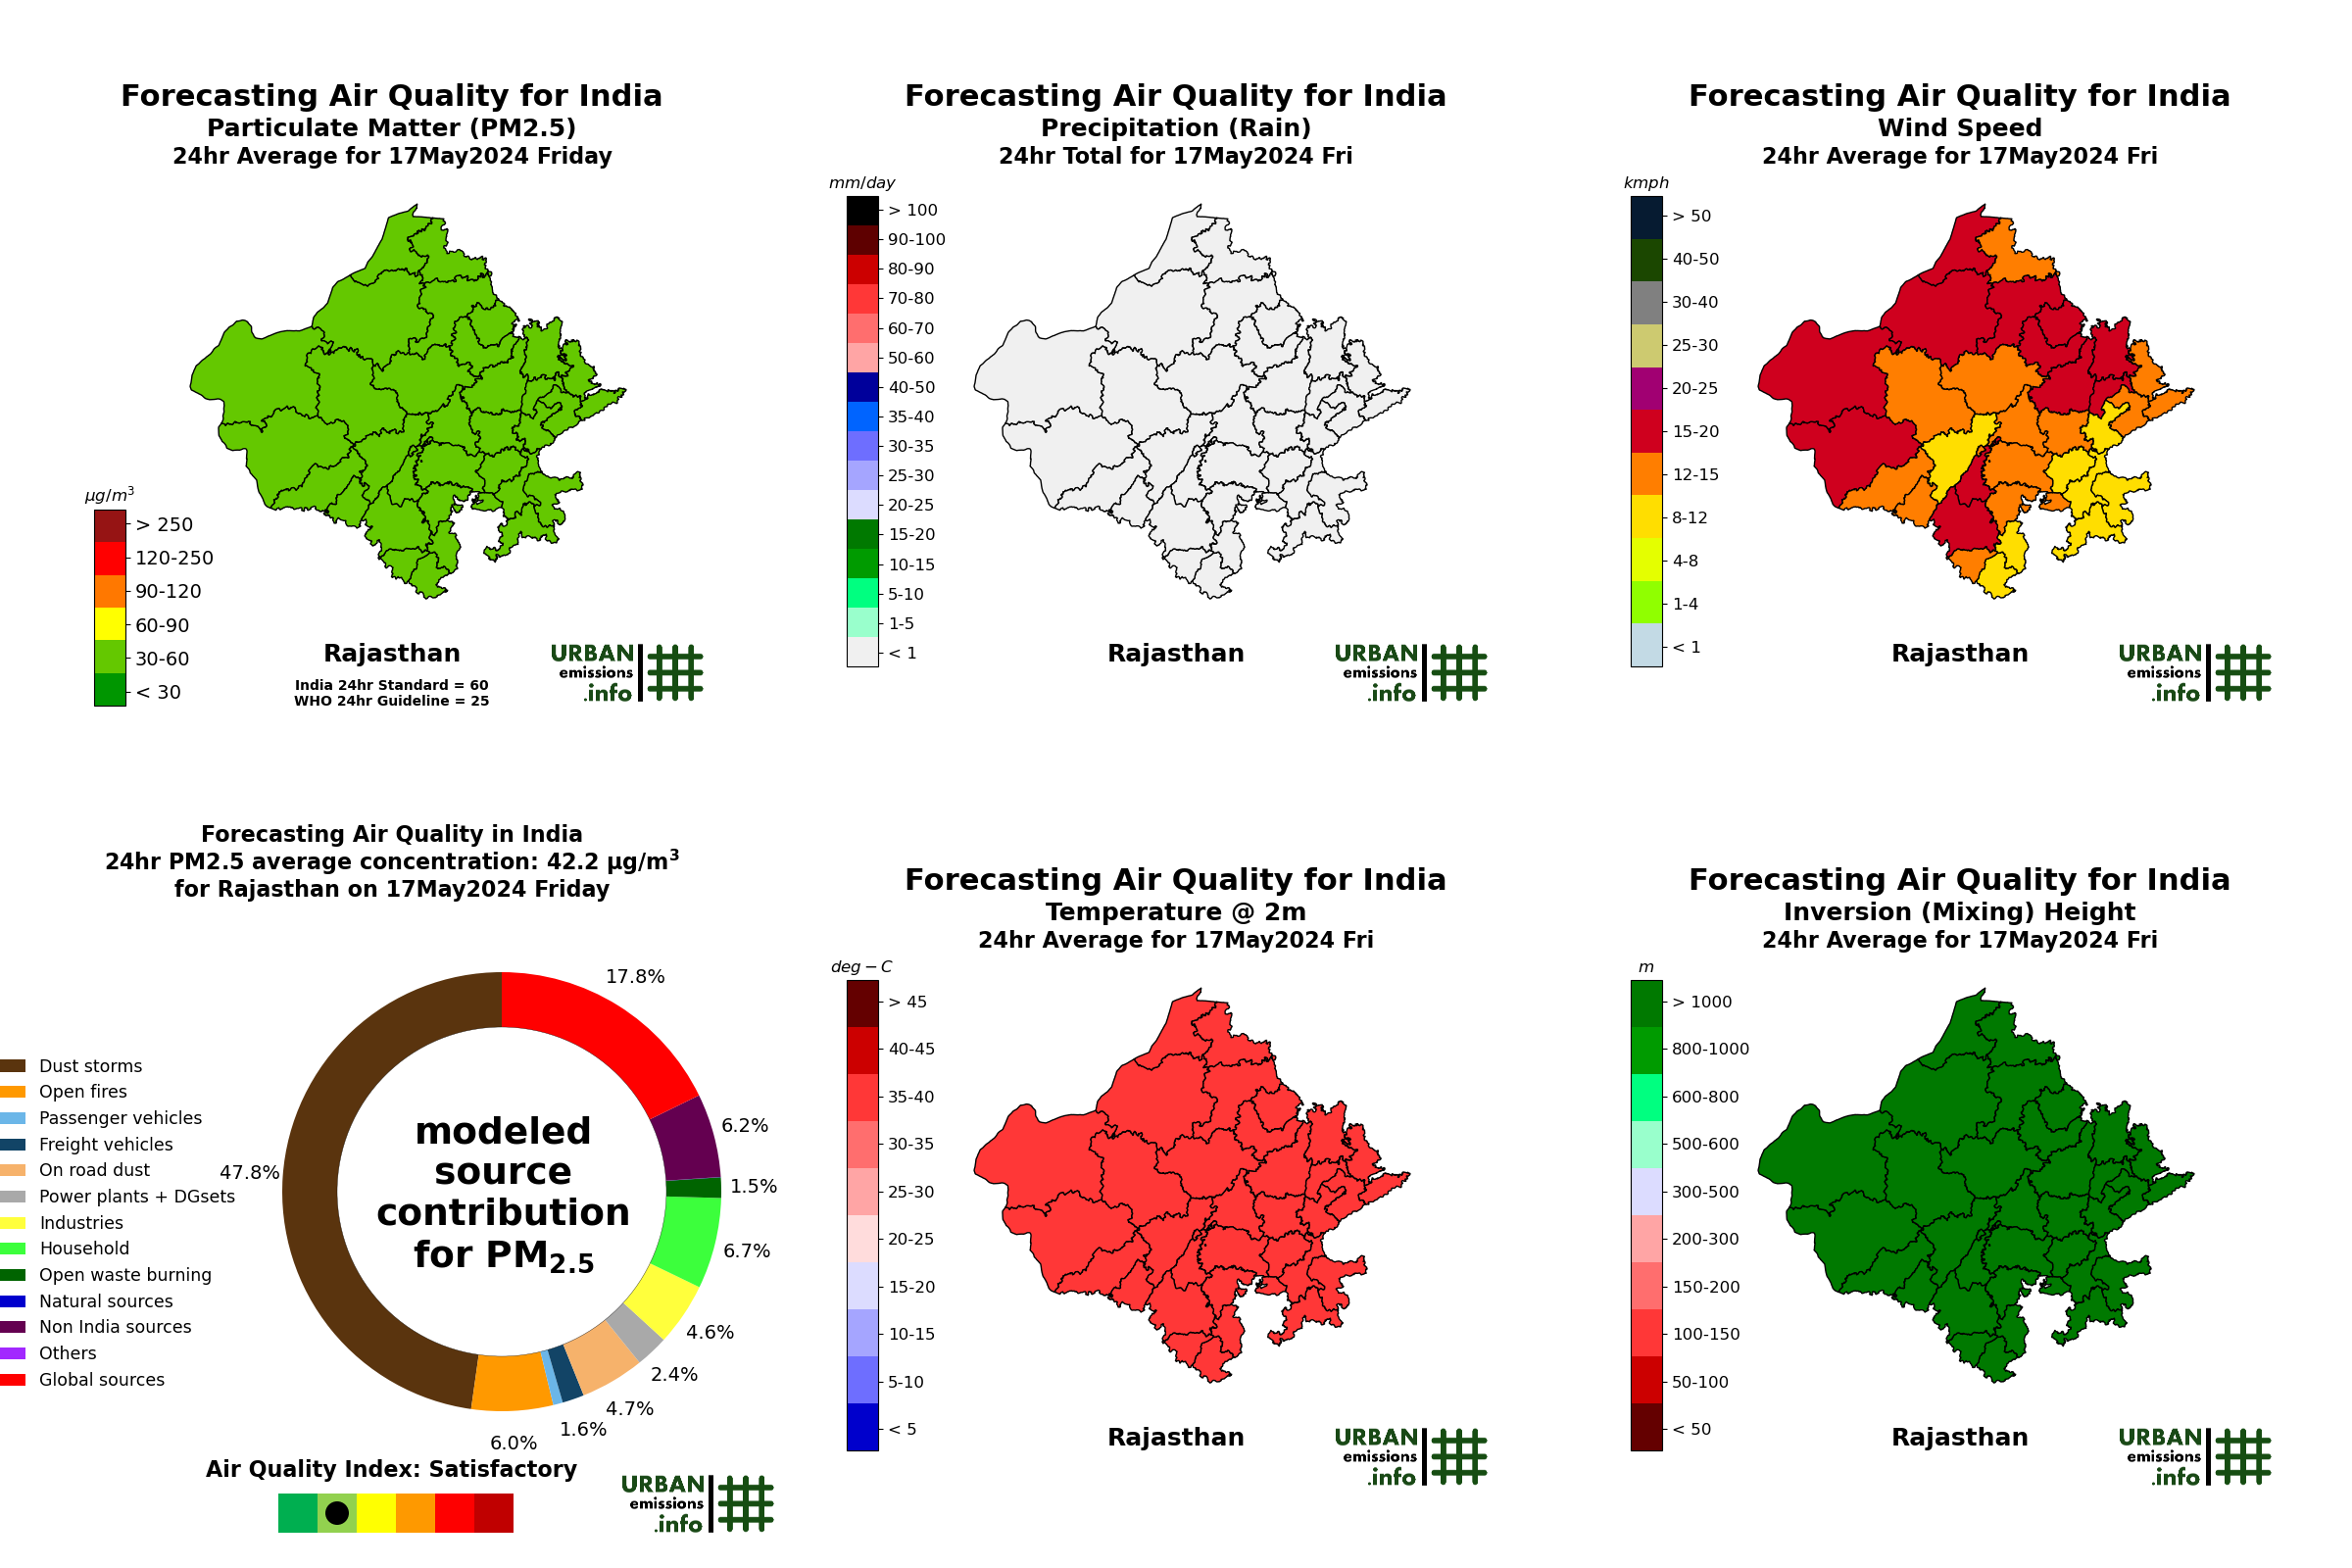
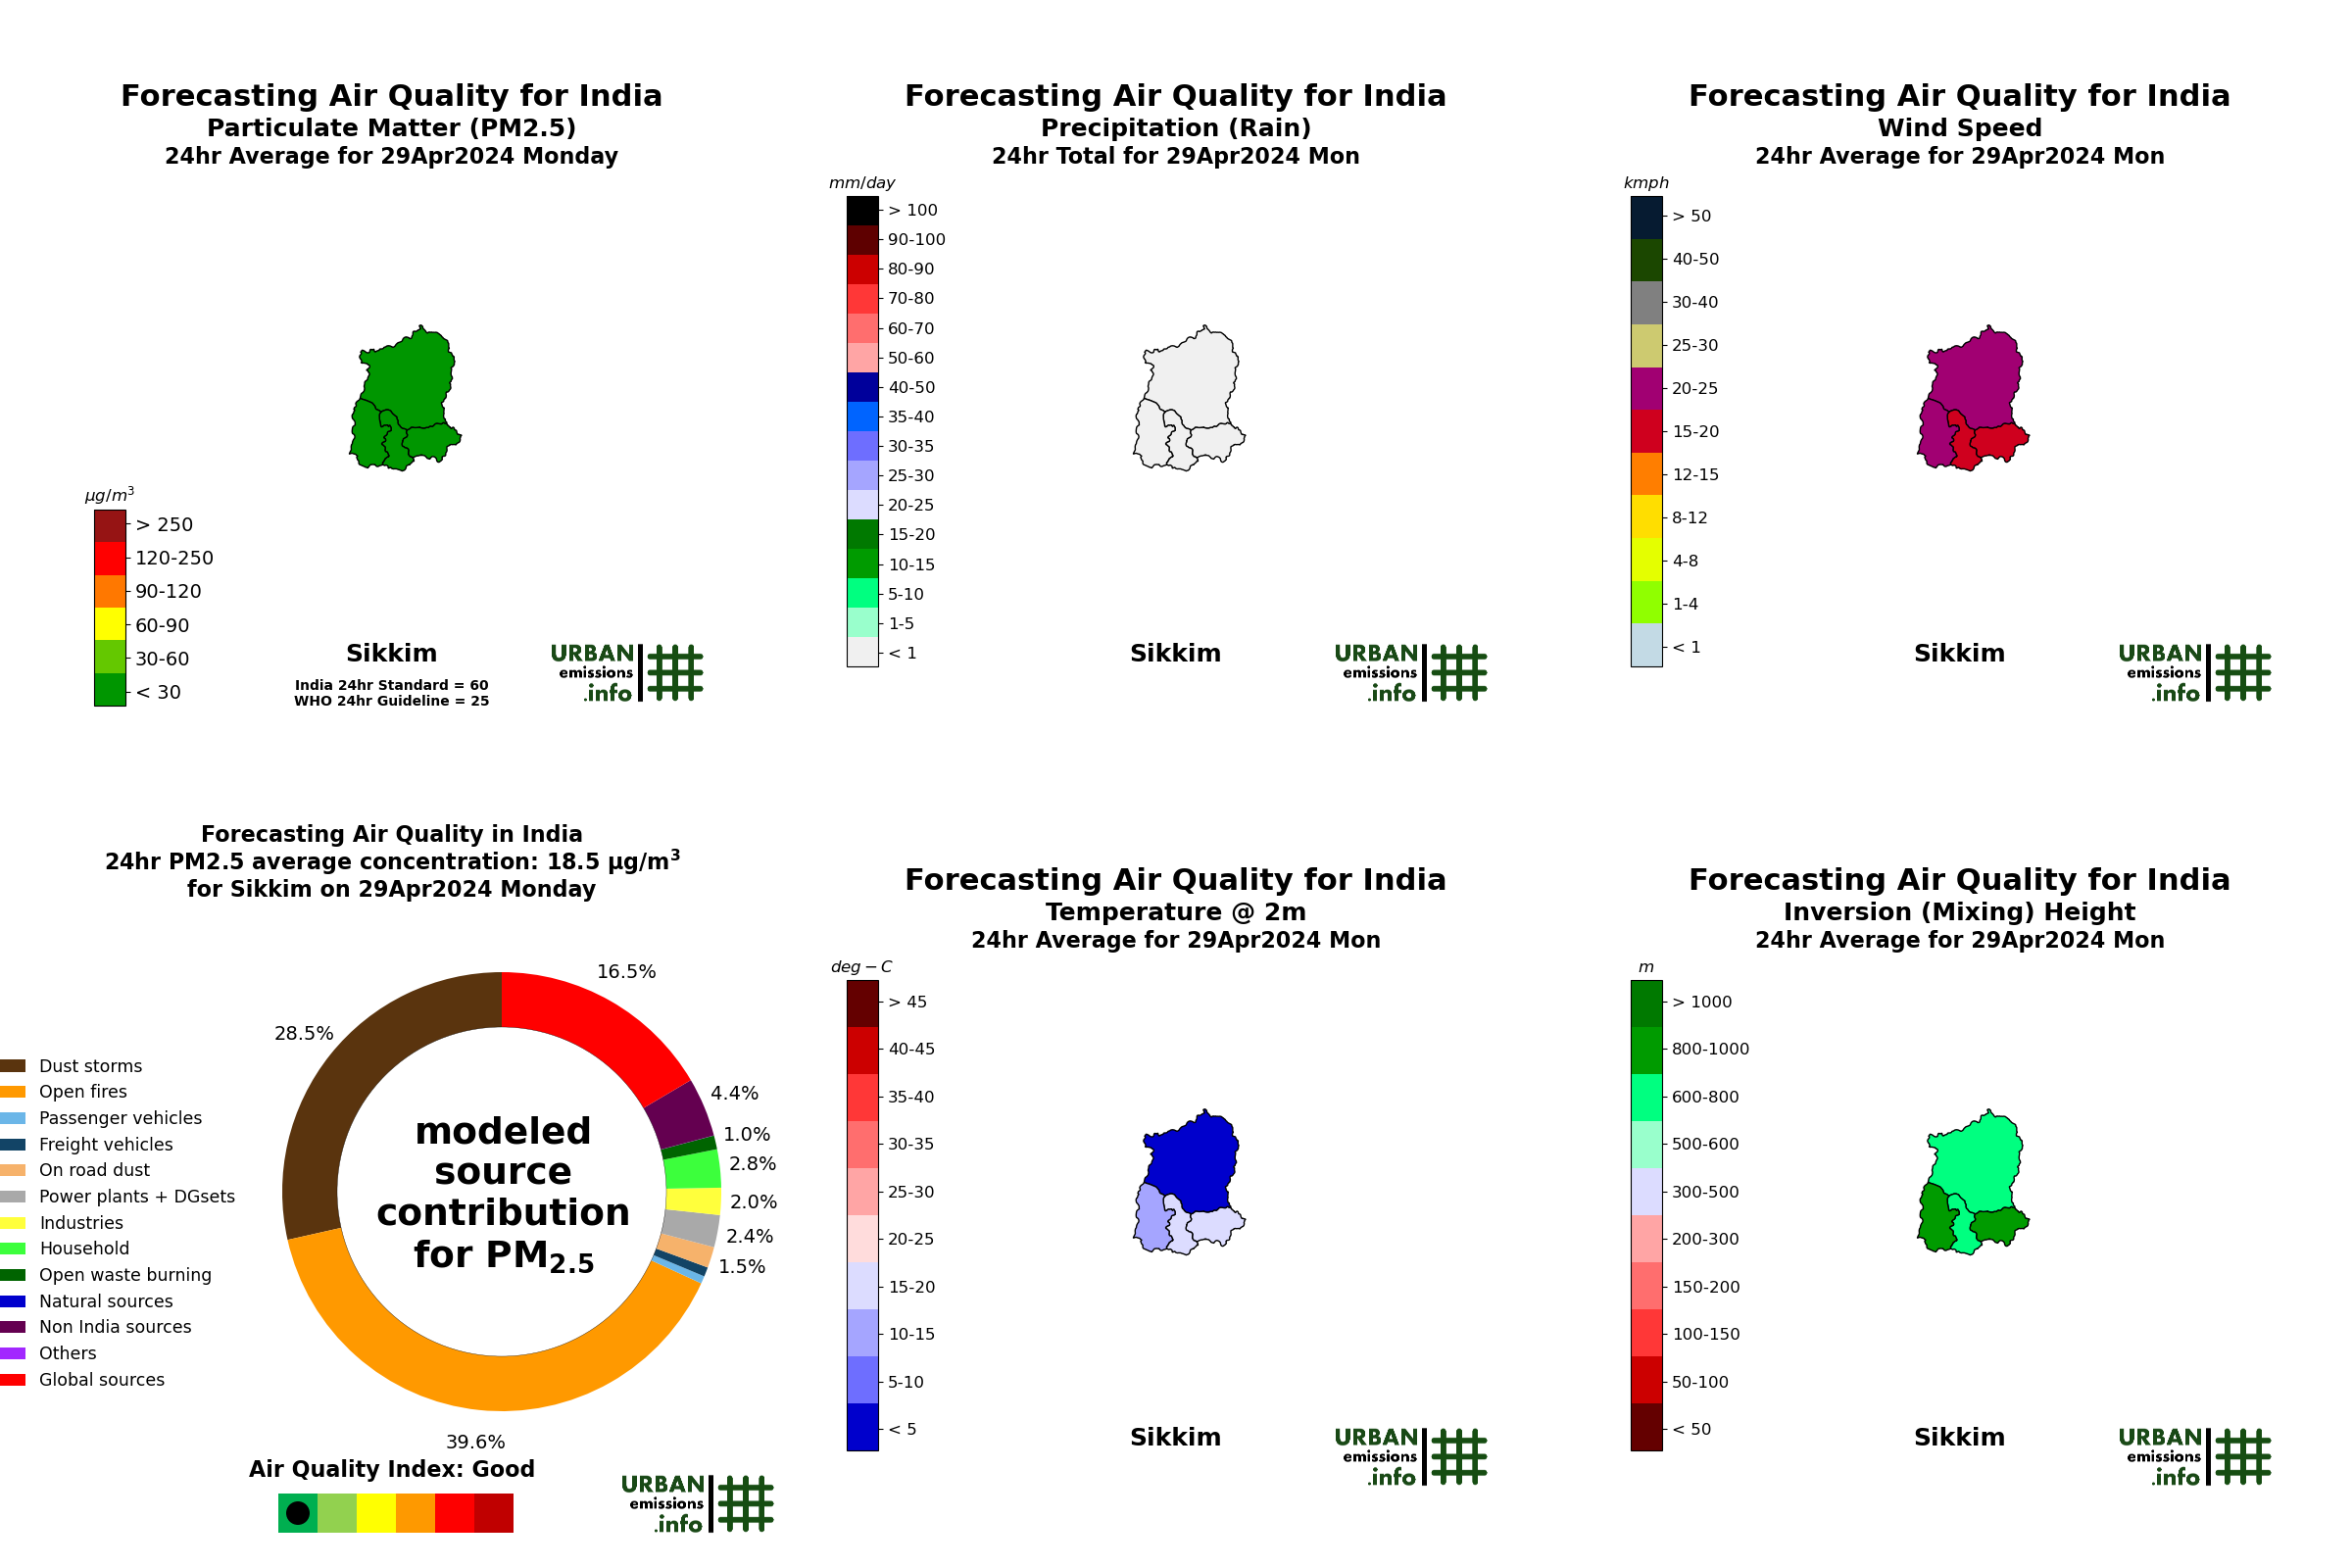
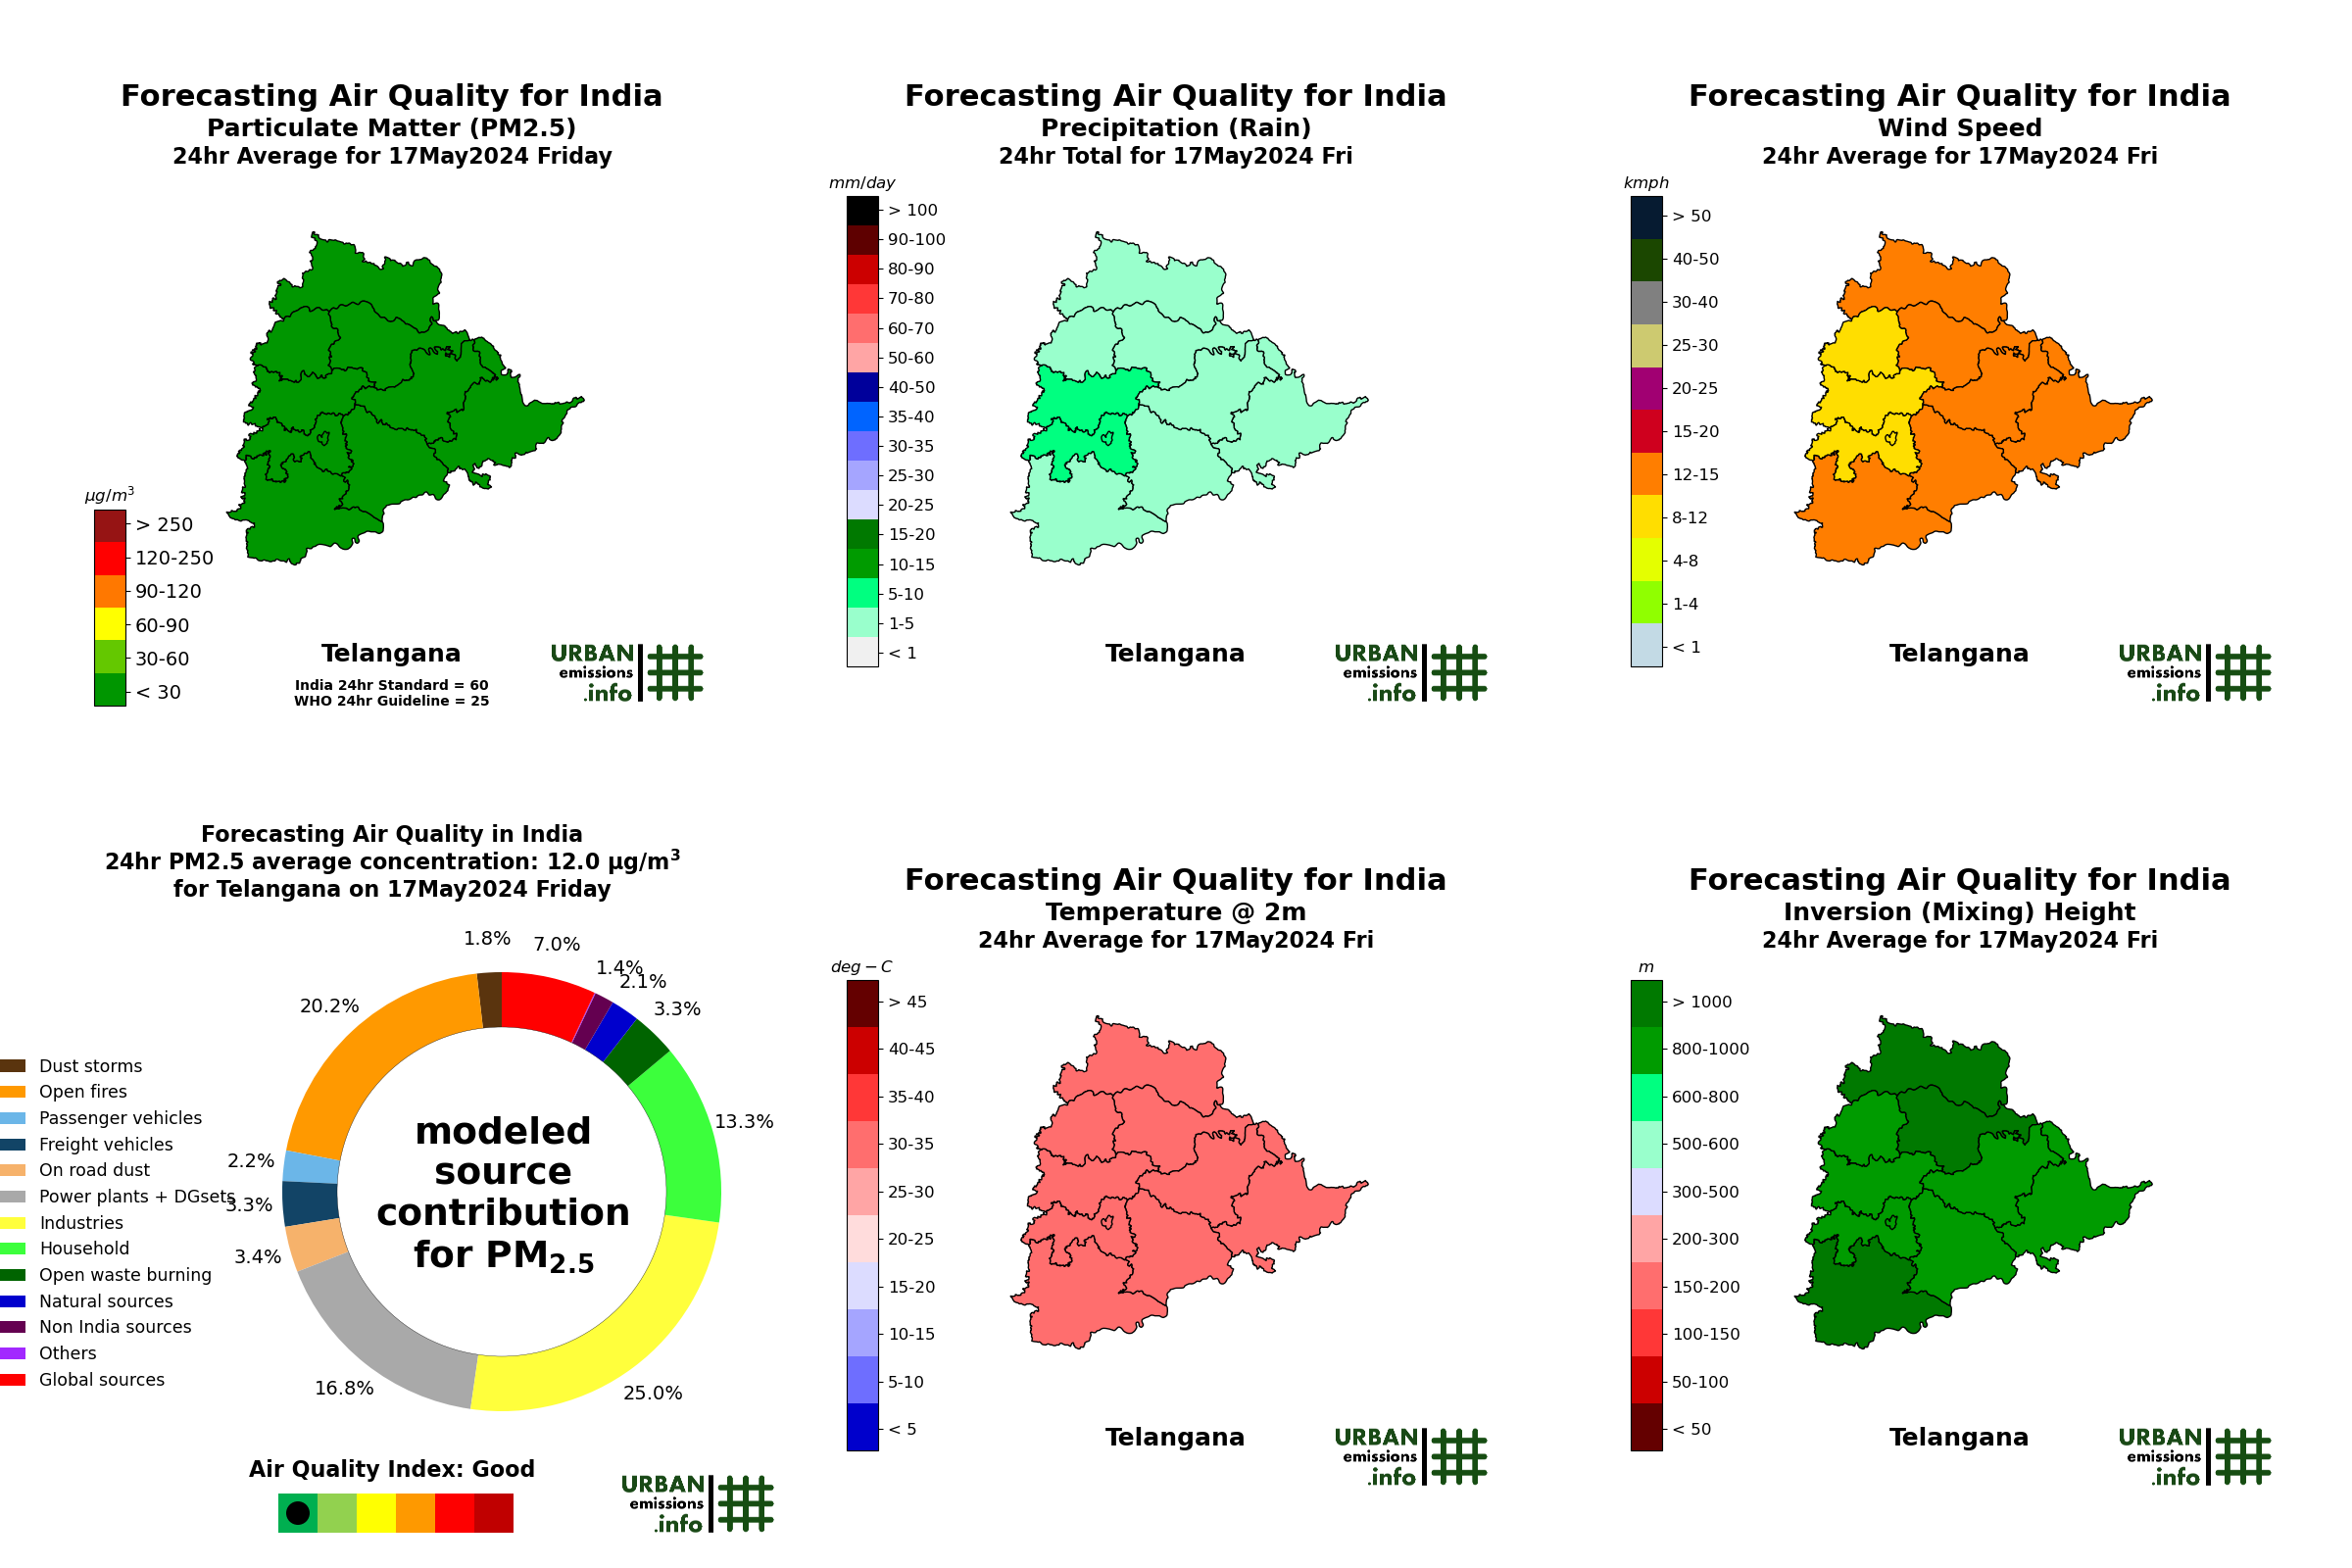
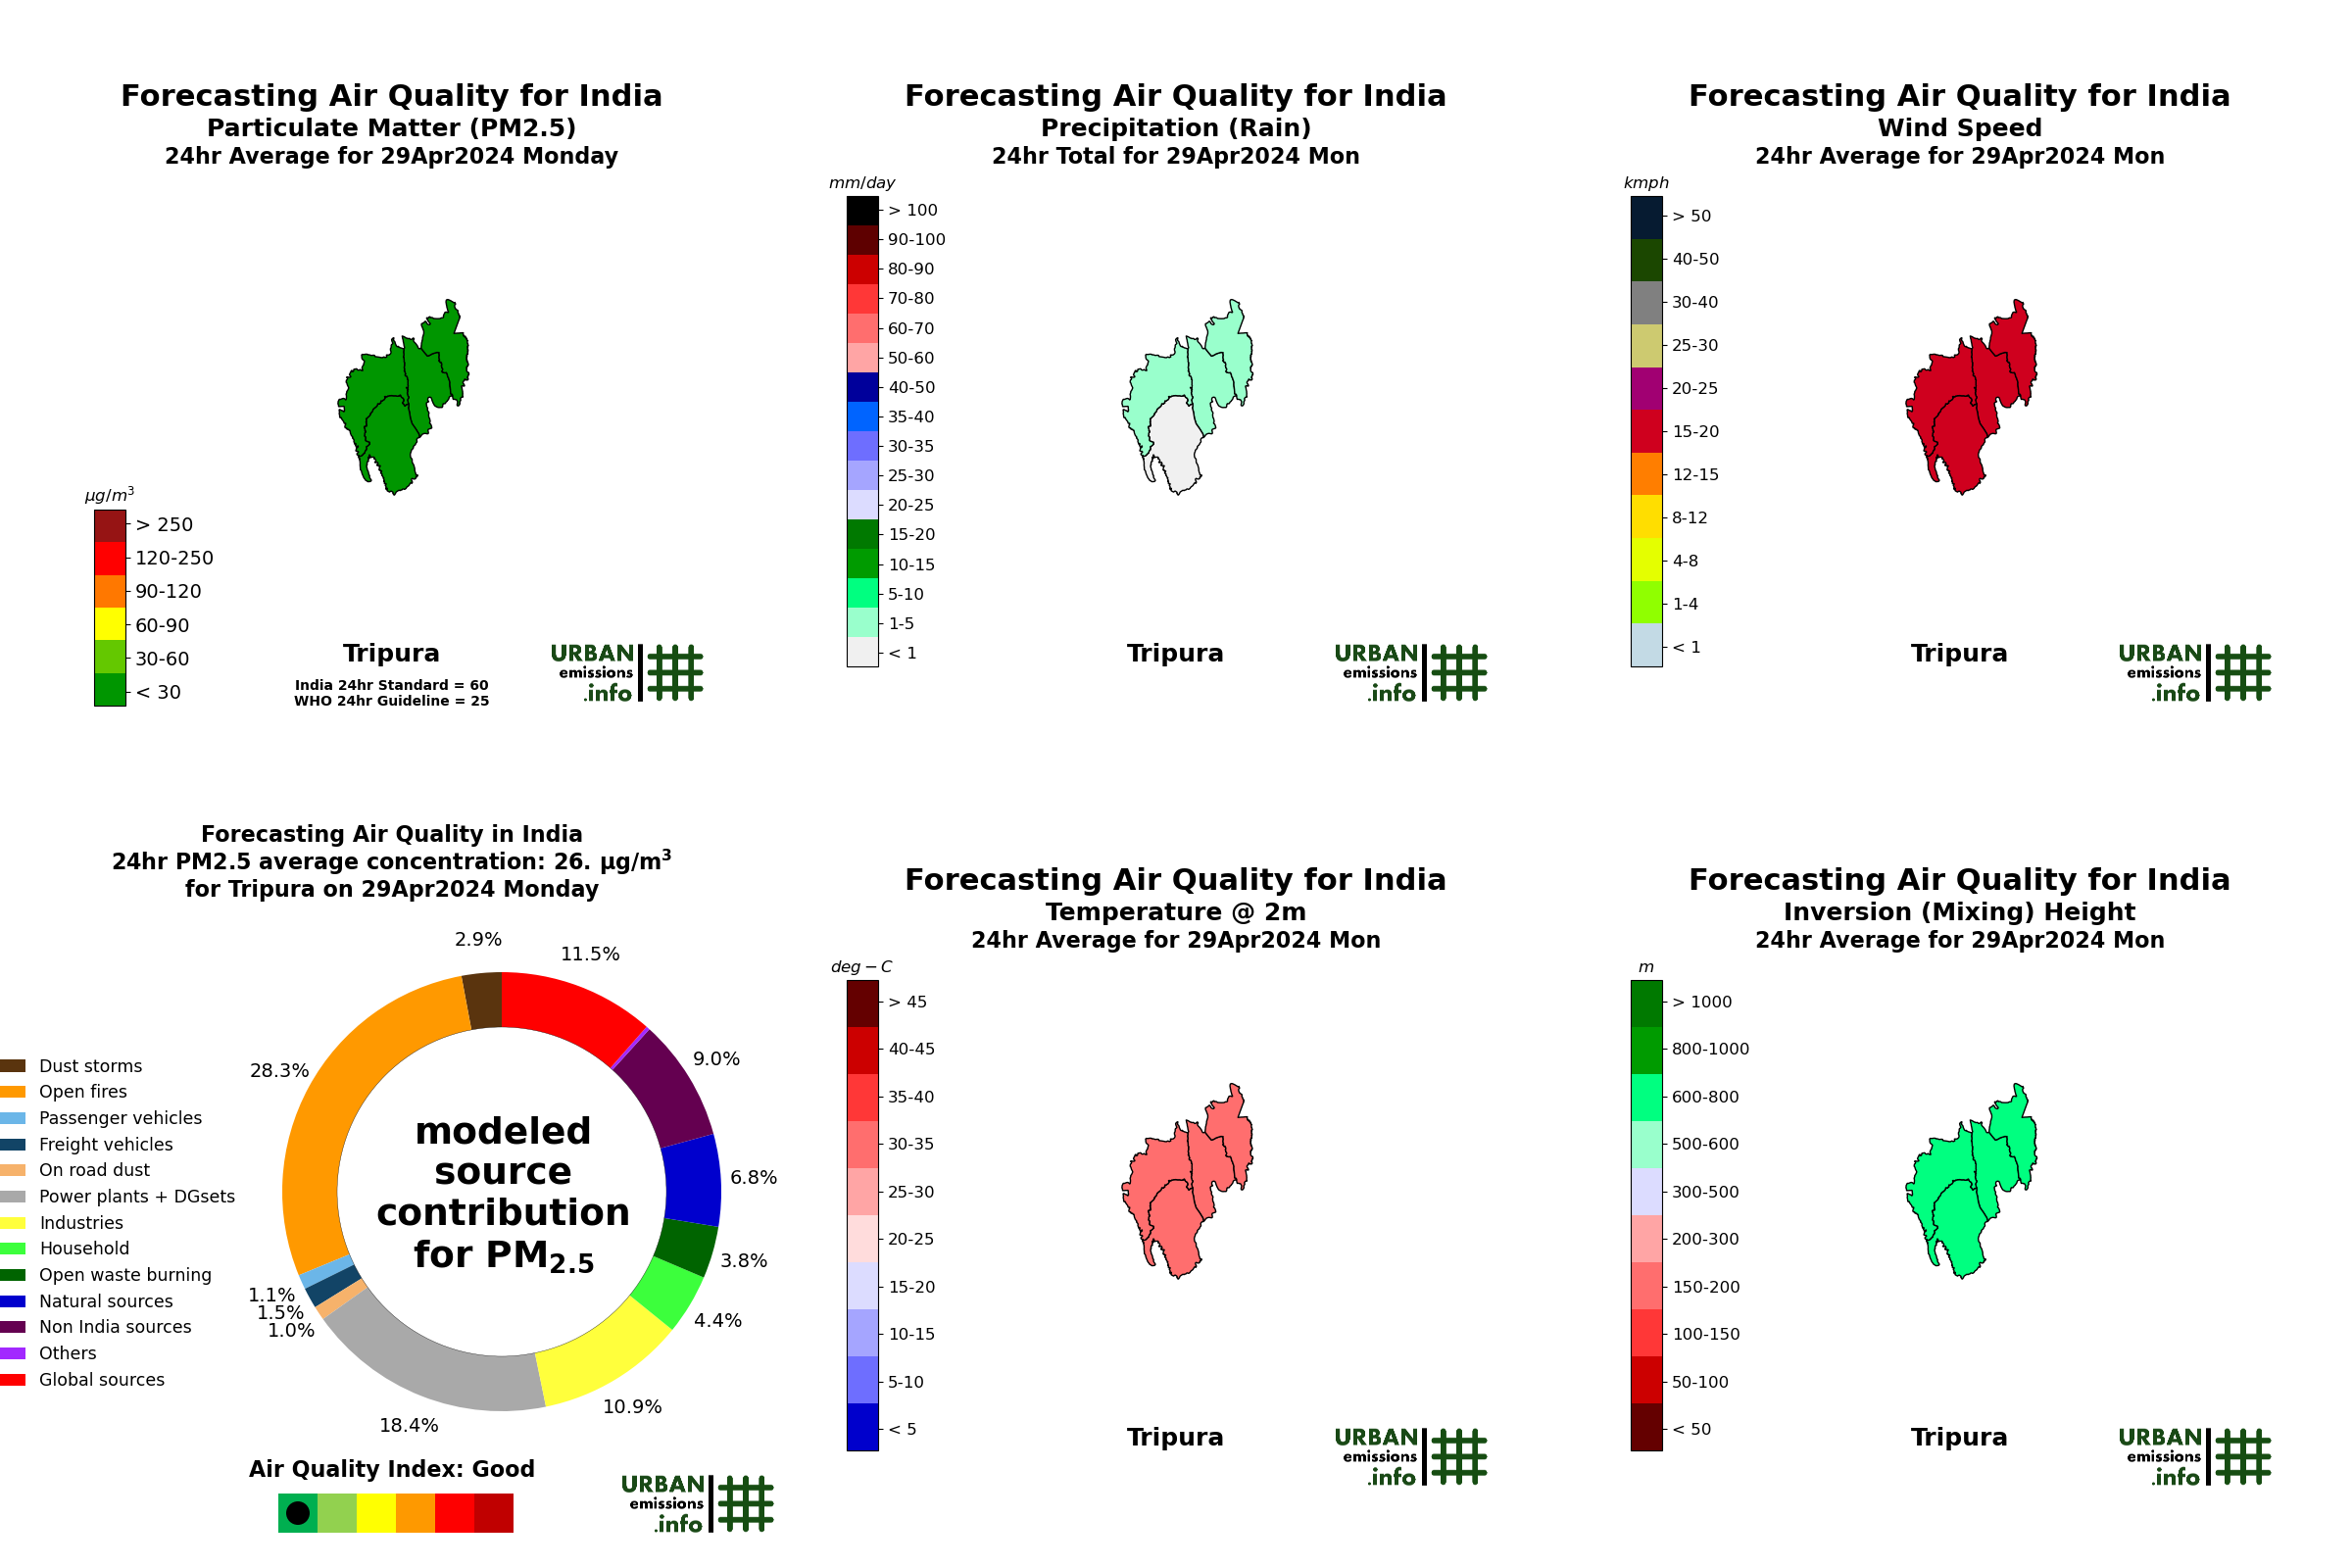
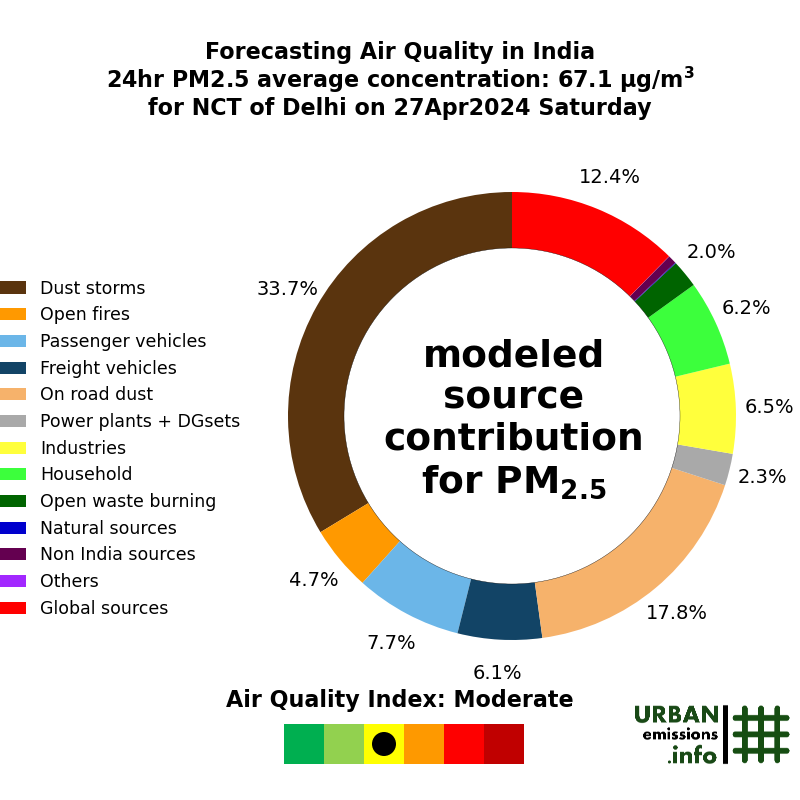
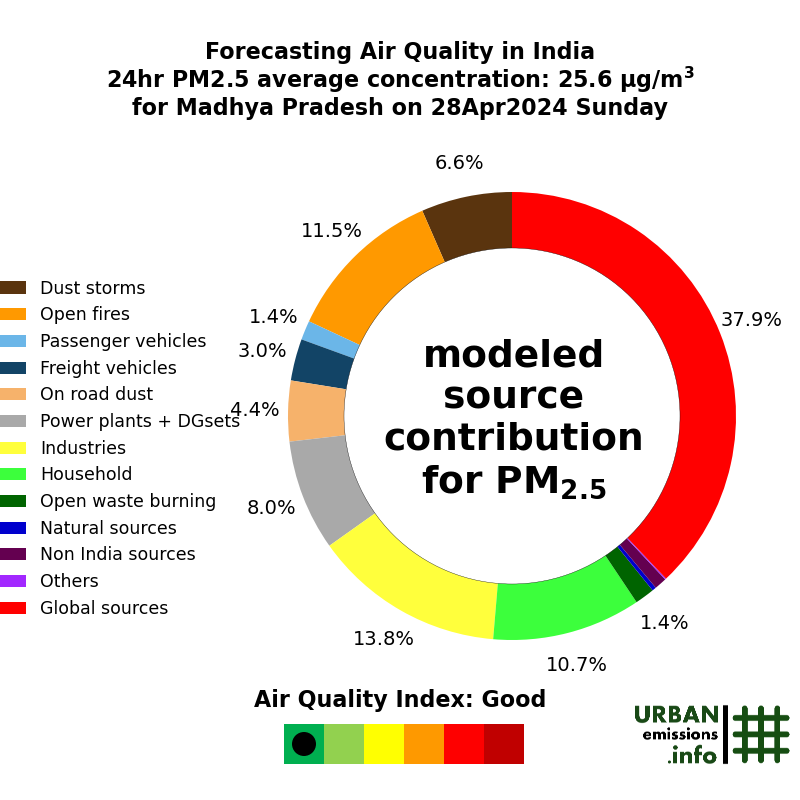
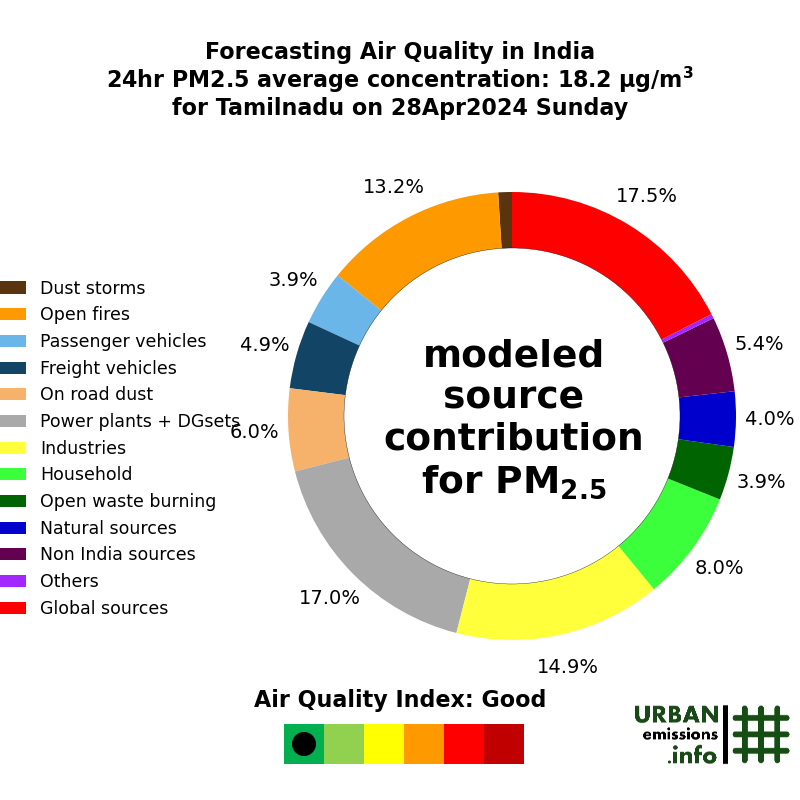
A composite of PM2.5 concentrations, source contributions, and meteorological parameters for today can be browsed by state below.
Modeled PM2.5 source contributions by State for Day 1 (browse here for forecast days)
 |
 |
 |
 |
District-level Air Quality Forecast Summaries
All India forecasting results are also summarized at the district level.
An interactive map of the (current) day average forecasts is presented below. Use the search box to locate a city or a district in the region. Hovering over the district will display the (forecast) modeled day average concentrations.
For select cities, AQI using India’s methodology is calculated and summarized below.

A sample of the results are displayed below with more details in the individual pages.
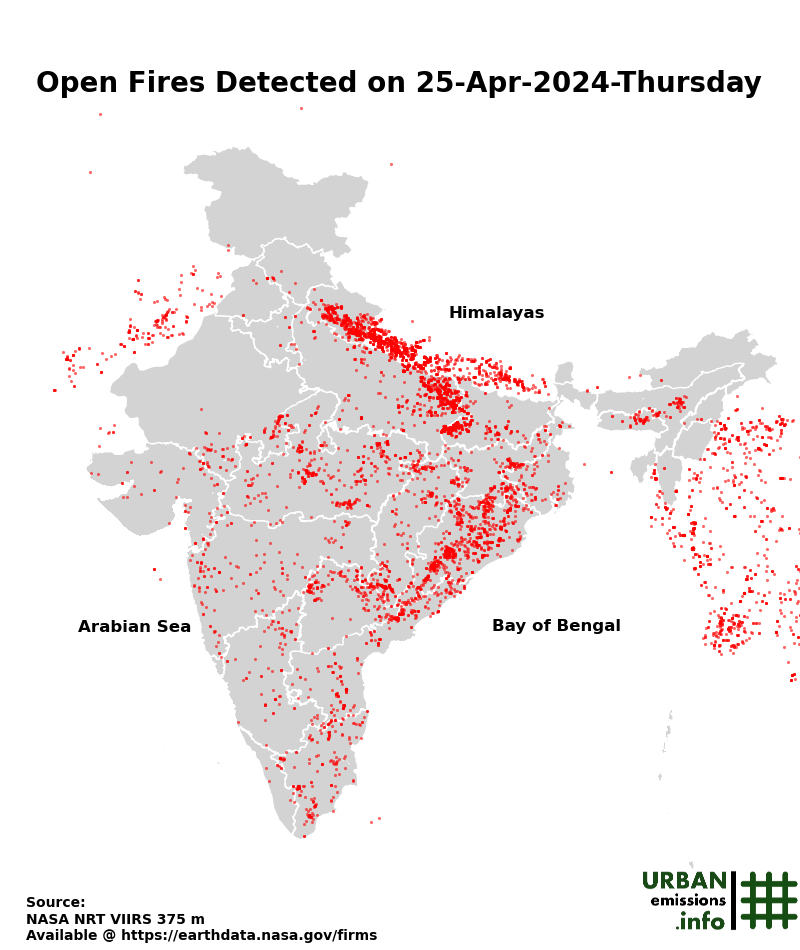
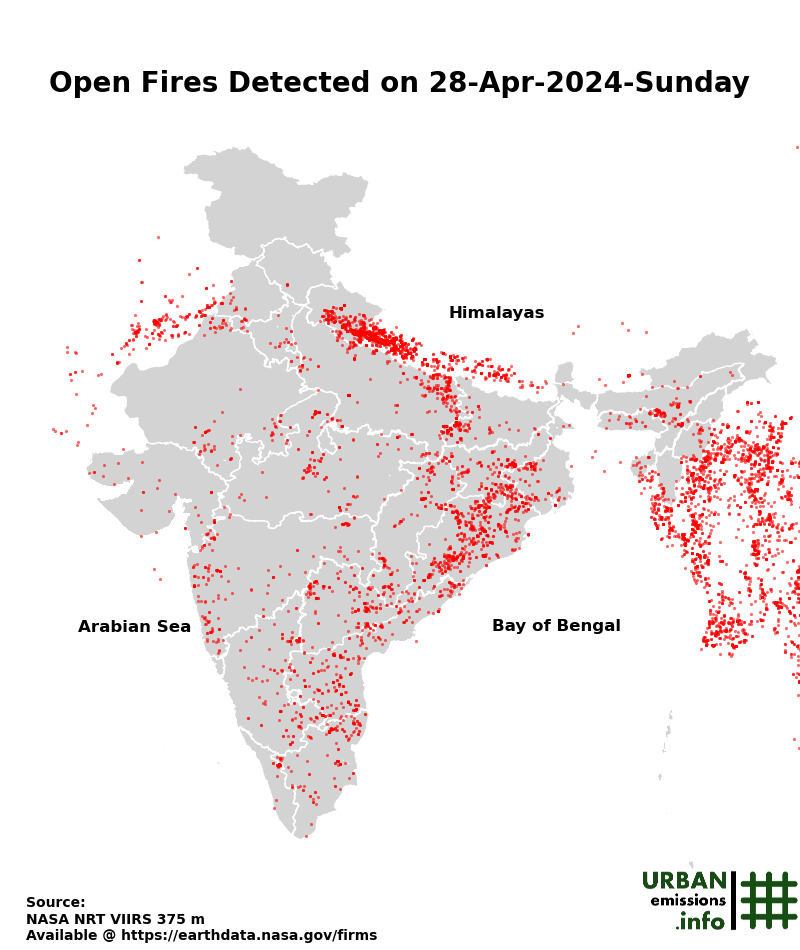
Fire Counts
24-hr Open fires map for the Indian Subcontinent (updated with VIIRS feed every 3 hours)
 |
 |
 |
 |
Dust Stroms
Simulated Dust Storm Zones for the Next Three Days
 |
 |
 |
 |
Reconstruction of meteorological fields using the WRF system and also used for urban and regional scale chemical transport modeling modeling.
Comprehensive emission inventory of anthropogenic and natural sources, as urban and regional scales. The regional emissions inventory is maintained at .
Simulation of air pollutants using the CAMx chemical transport model with outputs including
daily (24 hour) average concentrations (maps)
daily (24 hour) summaries by state – average PM2.5 concentrations (maps) and average source contributions (donuts)
animations of hourly average concentrations (maps)
hourly average concentrations for all the criteria pollutants by district (line graphs)
hourly average modeled source contributions to PM2.5 concentrations by district (bar graphs)