July, 2025
VizChitra, Bengaluru
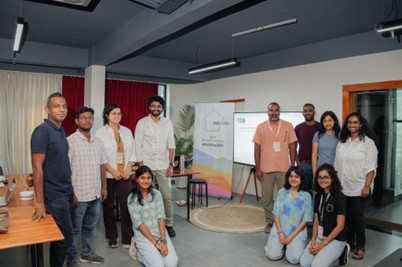
VizChitra is a community of interdisciplinary individuals with a shared interest in the practice of data visualization across India. On June 27-28, VizChitra conducted its first conference in Bengaluru to bring together designers, analysts, scientists, etc., who are interested in showing their data in more engaging, visceral ways.
UrbanEmissions.Info made several efforts in communicating the information and knowledge about air pollution in interesting ways. Comics, newer kinds of visuals, tools, interactive charts, and scrolly tales are some of the ways we explored to communicate air quality science to the public. We also wrote two working papers in this regard: How to visualize ambient monitoring data ; Fear of the Unknown: Communicating Air Quality Information to Public and Practitioners.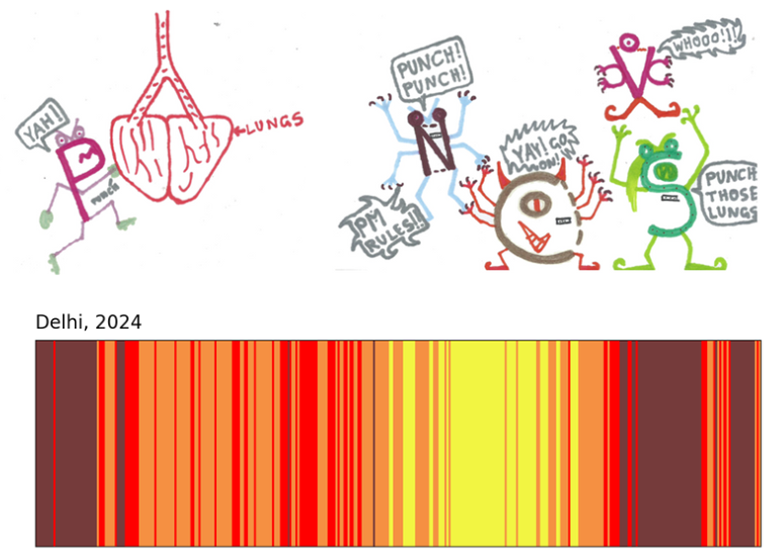
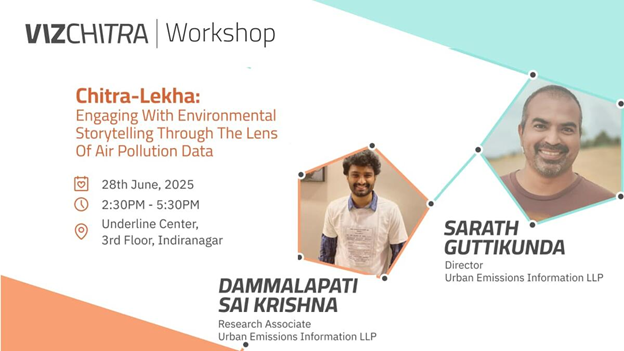
At VizChitra, we conducted a 3-hour workshop “Chitra-Lekha: Environmental Stories Through Air Pollution Data” to take our work to designers and analysts. The workshop started with the “find your partner” card game we designed to educate about pollutants playfully. We then introduced our primers on air quality and tools and shared the daily AQI data for participants to work with and create visuals that tell the pollution story of their city.
 |
 |