 |
 |
 |
 |
As the capital of the state of Bihar, Patna is the largest city in the state with ~4.0 million inhabitants. The municipality of Patna (Patna Nagar Nigam) consisting of 72 wards, administers the city. The state of Bihar is part of the rich Indo-Gangetic plain, largely supported by agricultural activities and is among the states with the highest population density. There is one coal-fired power plant, located 100km west of the city.
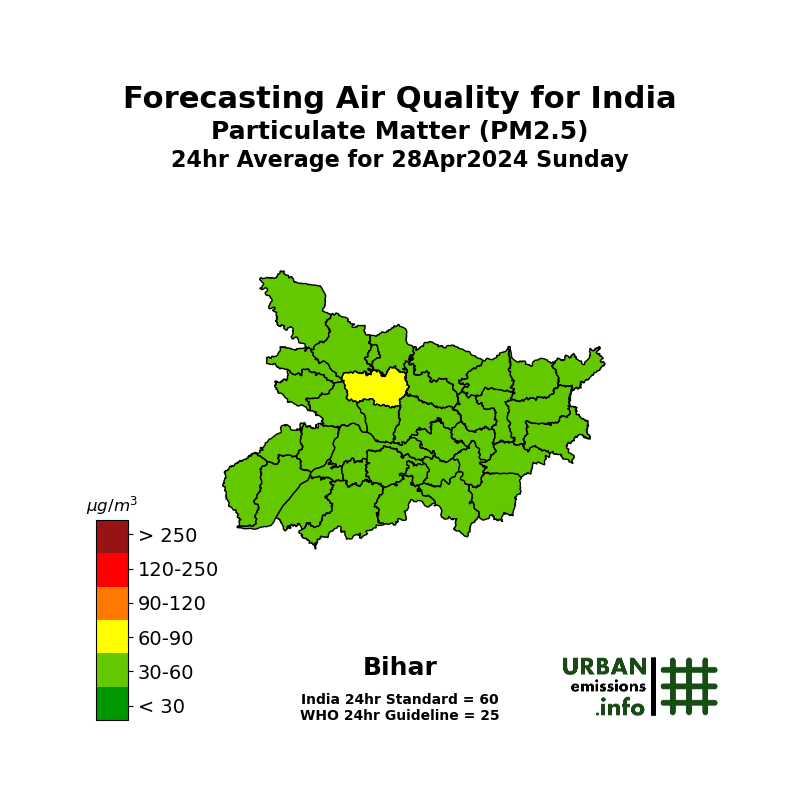
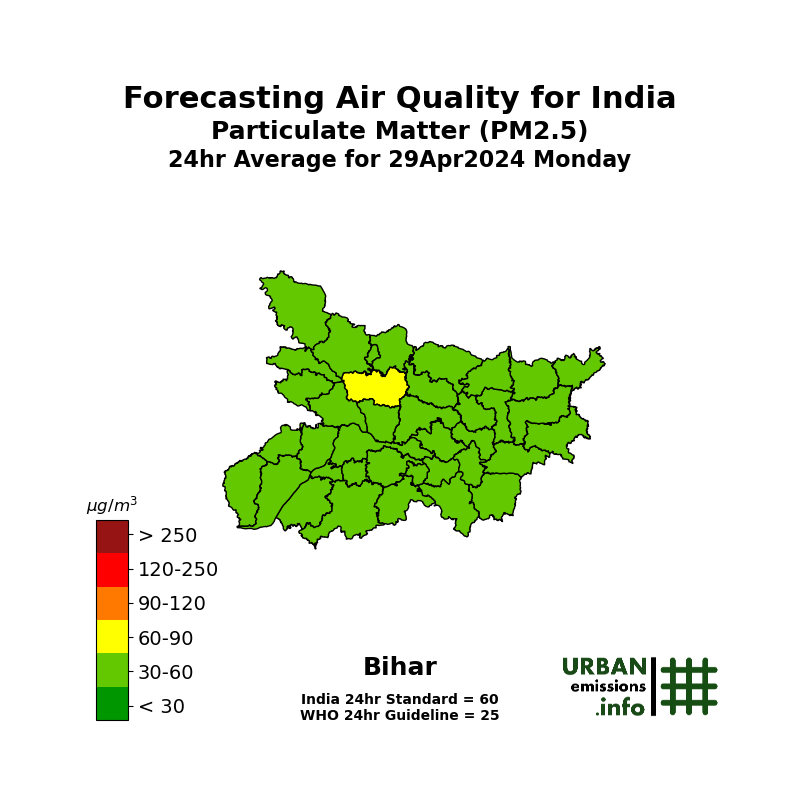
![]() To assess Patna’s air quality, we selected an airshed covering 60km x 30km, which includes most of the industrial estates and brick kiln clusters in and around Patna. This domain is further segregated into 1km grids, to study the spatial variations in the emission and the pollution loads.
To assess Patna’s air quality, we selected an airshed covering 60km x 30km, which includes most of the industrial estates and brick kiln clusters in and around Patna. This domain is further segregated into 1km grids, to study the spatial variations in the emission and the pollution loads.
Publications from this study:
- Comprehensive clean air action plan for the city of Patna (2019) [Download] [Press release by ADRI]
- Characterizing Patna’s ambient air quality and assessing opportunities for policy intervention (2014) [Download] [Press release by SSEF]. A re-recording of a presentation delivered at the Bihar State Pollution Control Board (BSPCB) in 2015, to support their endeavor to improve Patna’s air quality.
We present below a summary of the ambient monitoring data available under the National Ambient Monitoring Program (NAMP), operated and maintained by the Central Pollution Control Board (CPCB, New Delhi, India). In Patna, there is 1 continuous monitoring station reporting data for all the criteria pollutants and 5 manual stations reporting data on PM10, SO2, and NO2.
Satellite Data Derived Surface PM2.5 Concentrations:
The results of satellite data derived concentrations are useful for evaluating annual trends in pollution levels and are not a proxy for on-ground monitoring networks. This data is estimated using satellite feeds and global chemical transport models. Satellites are not measuring one location all the time, instead, a combination of satellites provide a cache of measurements that are interpreted using global chemical transport models (GEOS-Chem) to represent the vertical mix of pollution and estimate ground-based concentrations with the help of previous ground-based measurements. The global transport models rely on gridded emission estimates for multiple sectors to establish a relationship with satellite observations over multiple years. These databases were also used to study the global burden of disease, which estimated air pollution as the top 10 causes of premature mortality and morbidity in India. A summary of PM2.5 concentrations from this exercise, for the city of Patna is presented below. The global PM2.5 files are available for download and further analysis @ Dalhousie University.
We compiled an emissions inventory for the Greater Patna region for the following pollutants – sulfur dioxide (SO2), nitrogen oxides (NOx), carbon monoxide (CO), non-methane volatile organic compounds (NMVOCs), carbon dioxide (CO2); and particulate matter (PM) in four bins (a) coarse PM with size fraction between 2.5 and 10 μm (b) fine PM with size fraction less than 2.5 μm (c) black carbon (BC) and (d) organic carbon (OC), for year 2015 and projected to 2030.
We customized the SIM-air family of tools to fit the base information collated from the central pollution control board, state pollution control board, census bureau, national sample survey office, ministry of road transport and highways, annual survey of industries, central electrical authority, ministry of heavy industries, municipal waste management, geographical information systems, meteorological department, and publications from academic and non-governmental institutions.
This emissions inventory is based on the available local activity and fuel consumption estimates for the selected urban airshed (presented in the grid above) and does not include natural emission sources (like dust storms, lightning) and seasonal open (agricultural and forest) fires; which can only be included in a regional scale simulation. These emission sources are accounted in the concentration calculation as an external (also known as boundary or long-range) contribution to the city’s air quality.
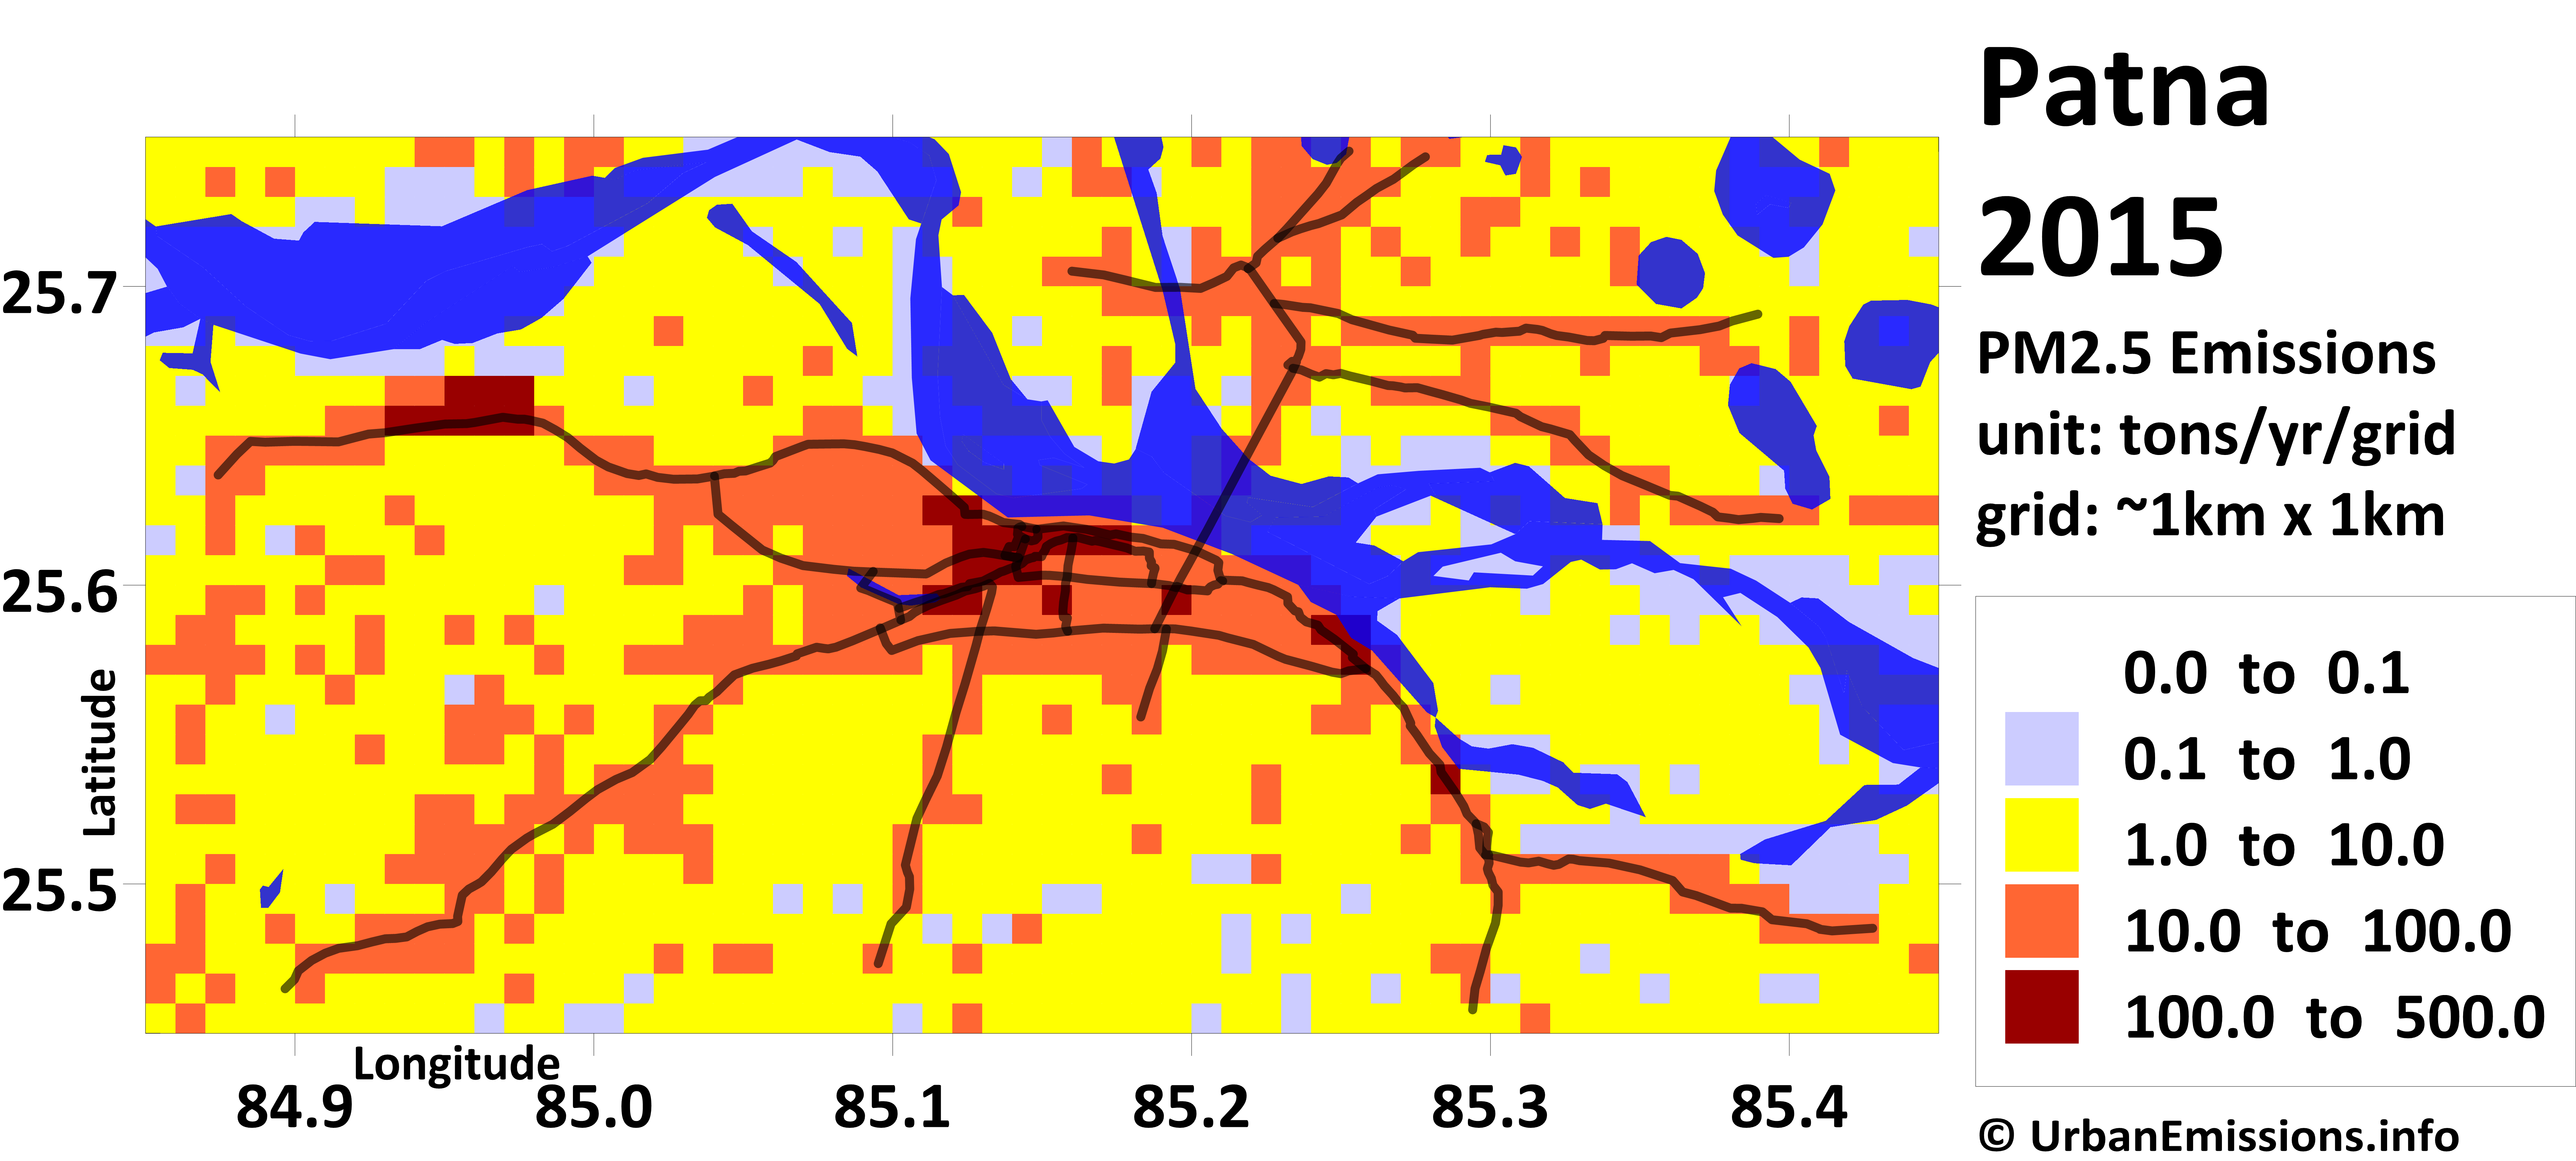
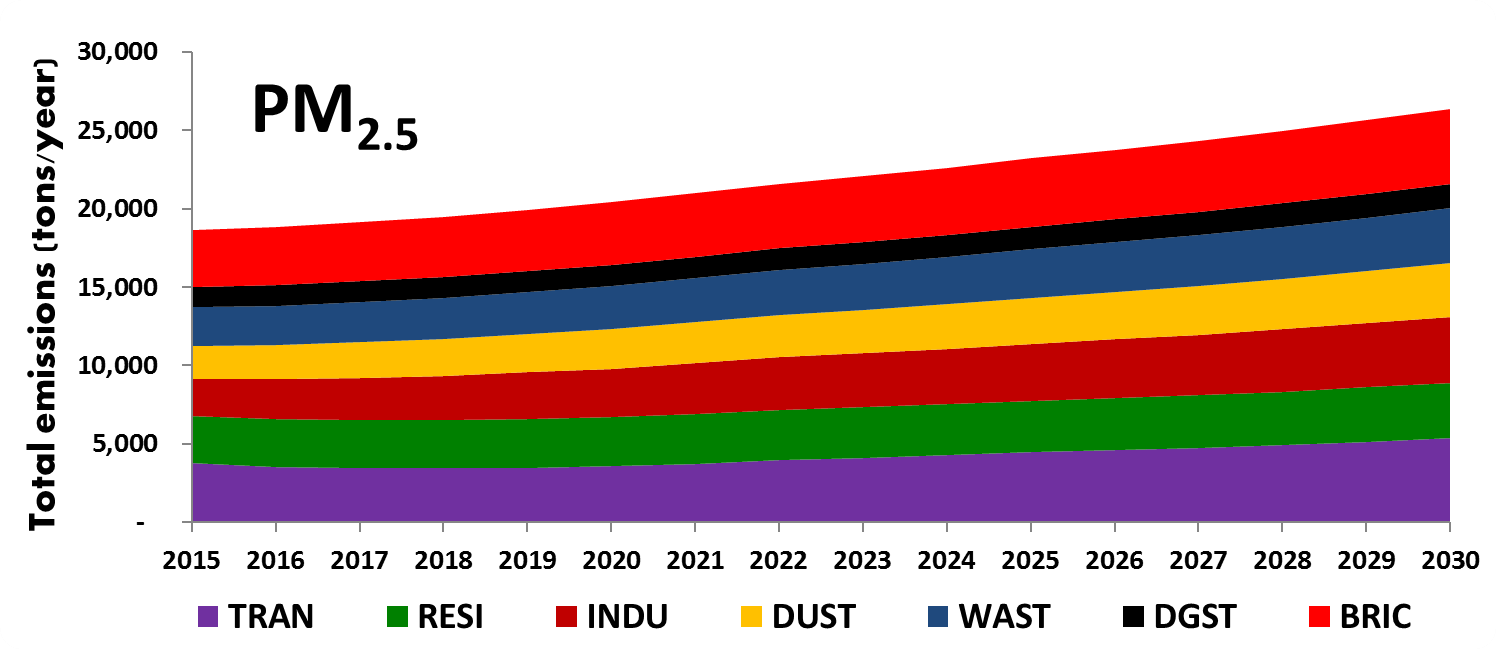
The emissions inventory was then spatially segregated at a 0.01° grid resolution in longitude and latitude (equivalent of 1 km) to create a spatial map of emissions for each pollutant (PM2.5, PM10, SO2, NOx, CO and VOCs). The gridded PM2.5 emissions and the total (shares by sector) emissions are presented below.
Gridded PM2.5 Emissions (2015)
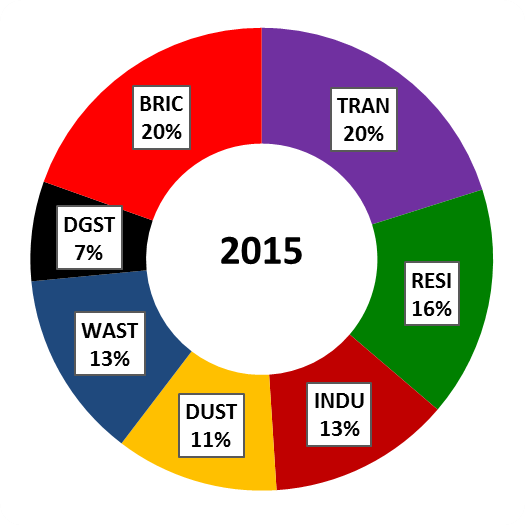
Total PM2.5 Emissions by Sector 2015-2030
 |
 |
 |
Total Estimated Emissions by Sector for 2015 (units – mil.tons/year for CO2 and tons/year for the rest)
| PM2.5 | PM10 | BC | OC | NOx | CO | VOC | SO2 | CO2 | |
|---|---|---|---|---|---|---|---|---|---|
| TRAN | 3,750 | 3,950 | 1,600 | 1,250 | 6,600 | 59,750 | 14,650 | 250 | 1.44 |
| RESI | 3,000 | 3,050 | 750 | 1,450 | 850 | 45,000 | 5,550 | 700 | 0.43 |
| INDU | 2,350 | 2,400 | 850 | 450 | 1,900 | 3,600 | 300 | 650 | 0.21 |
| DUST | 2,100 | 13,050 | - | - | - | - | - | - | - |
| WAST | 2,450 | 2,550 | 200 | 1,450 | 50 | 11,750 | 2,350 | 50 | 0.02 |
| DGST | 750 | 800 | 450 | 150 | 7,250 | 1,900 | 200 | 50 | 0.33 |
| BRIC | 3,650 | 3,700 | 950 | 1,400 | 1,700 | 49,450 | 4,600 | 2,150 | 0.43 |
| 18,050 | 29,500 | 4,800 | 6,150 | 18,350 | 171,450 | 27,650 | 3,850 | 2.86 |
TRAN = transport emissions from road, rail, aviation, and shipping (for coastal cities); RESI = residential emissions from cooking, heating, and lighting activities; INDU = industrial emissions from small, medium, and heavy industries (including power generation); DUST = dust emissions from road re-suspension and construction activities; WAST = open waste burning emissions; DGST = diesel generator set emissions; BRIC = brick kiln emissions (not included in the industrial emissions)
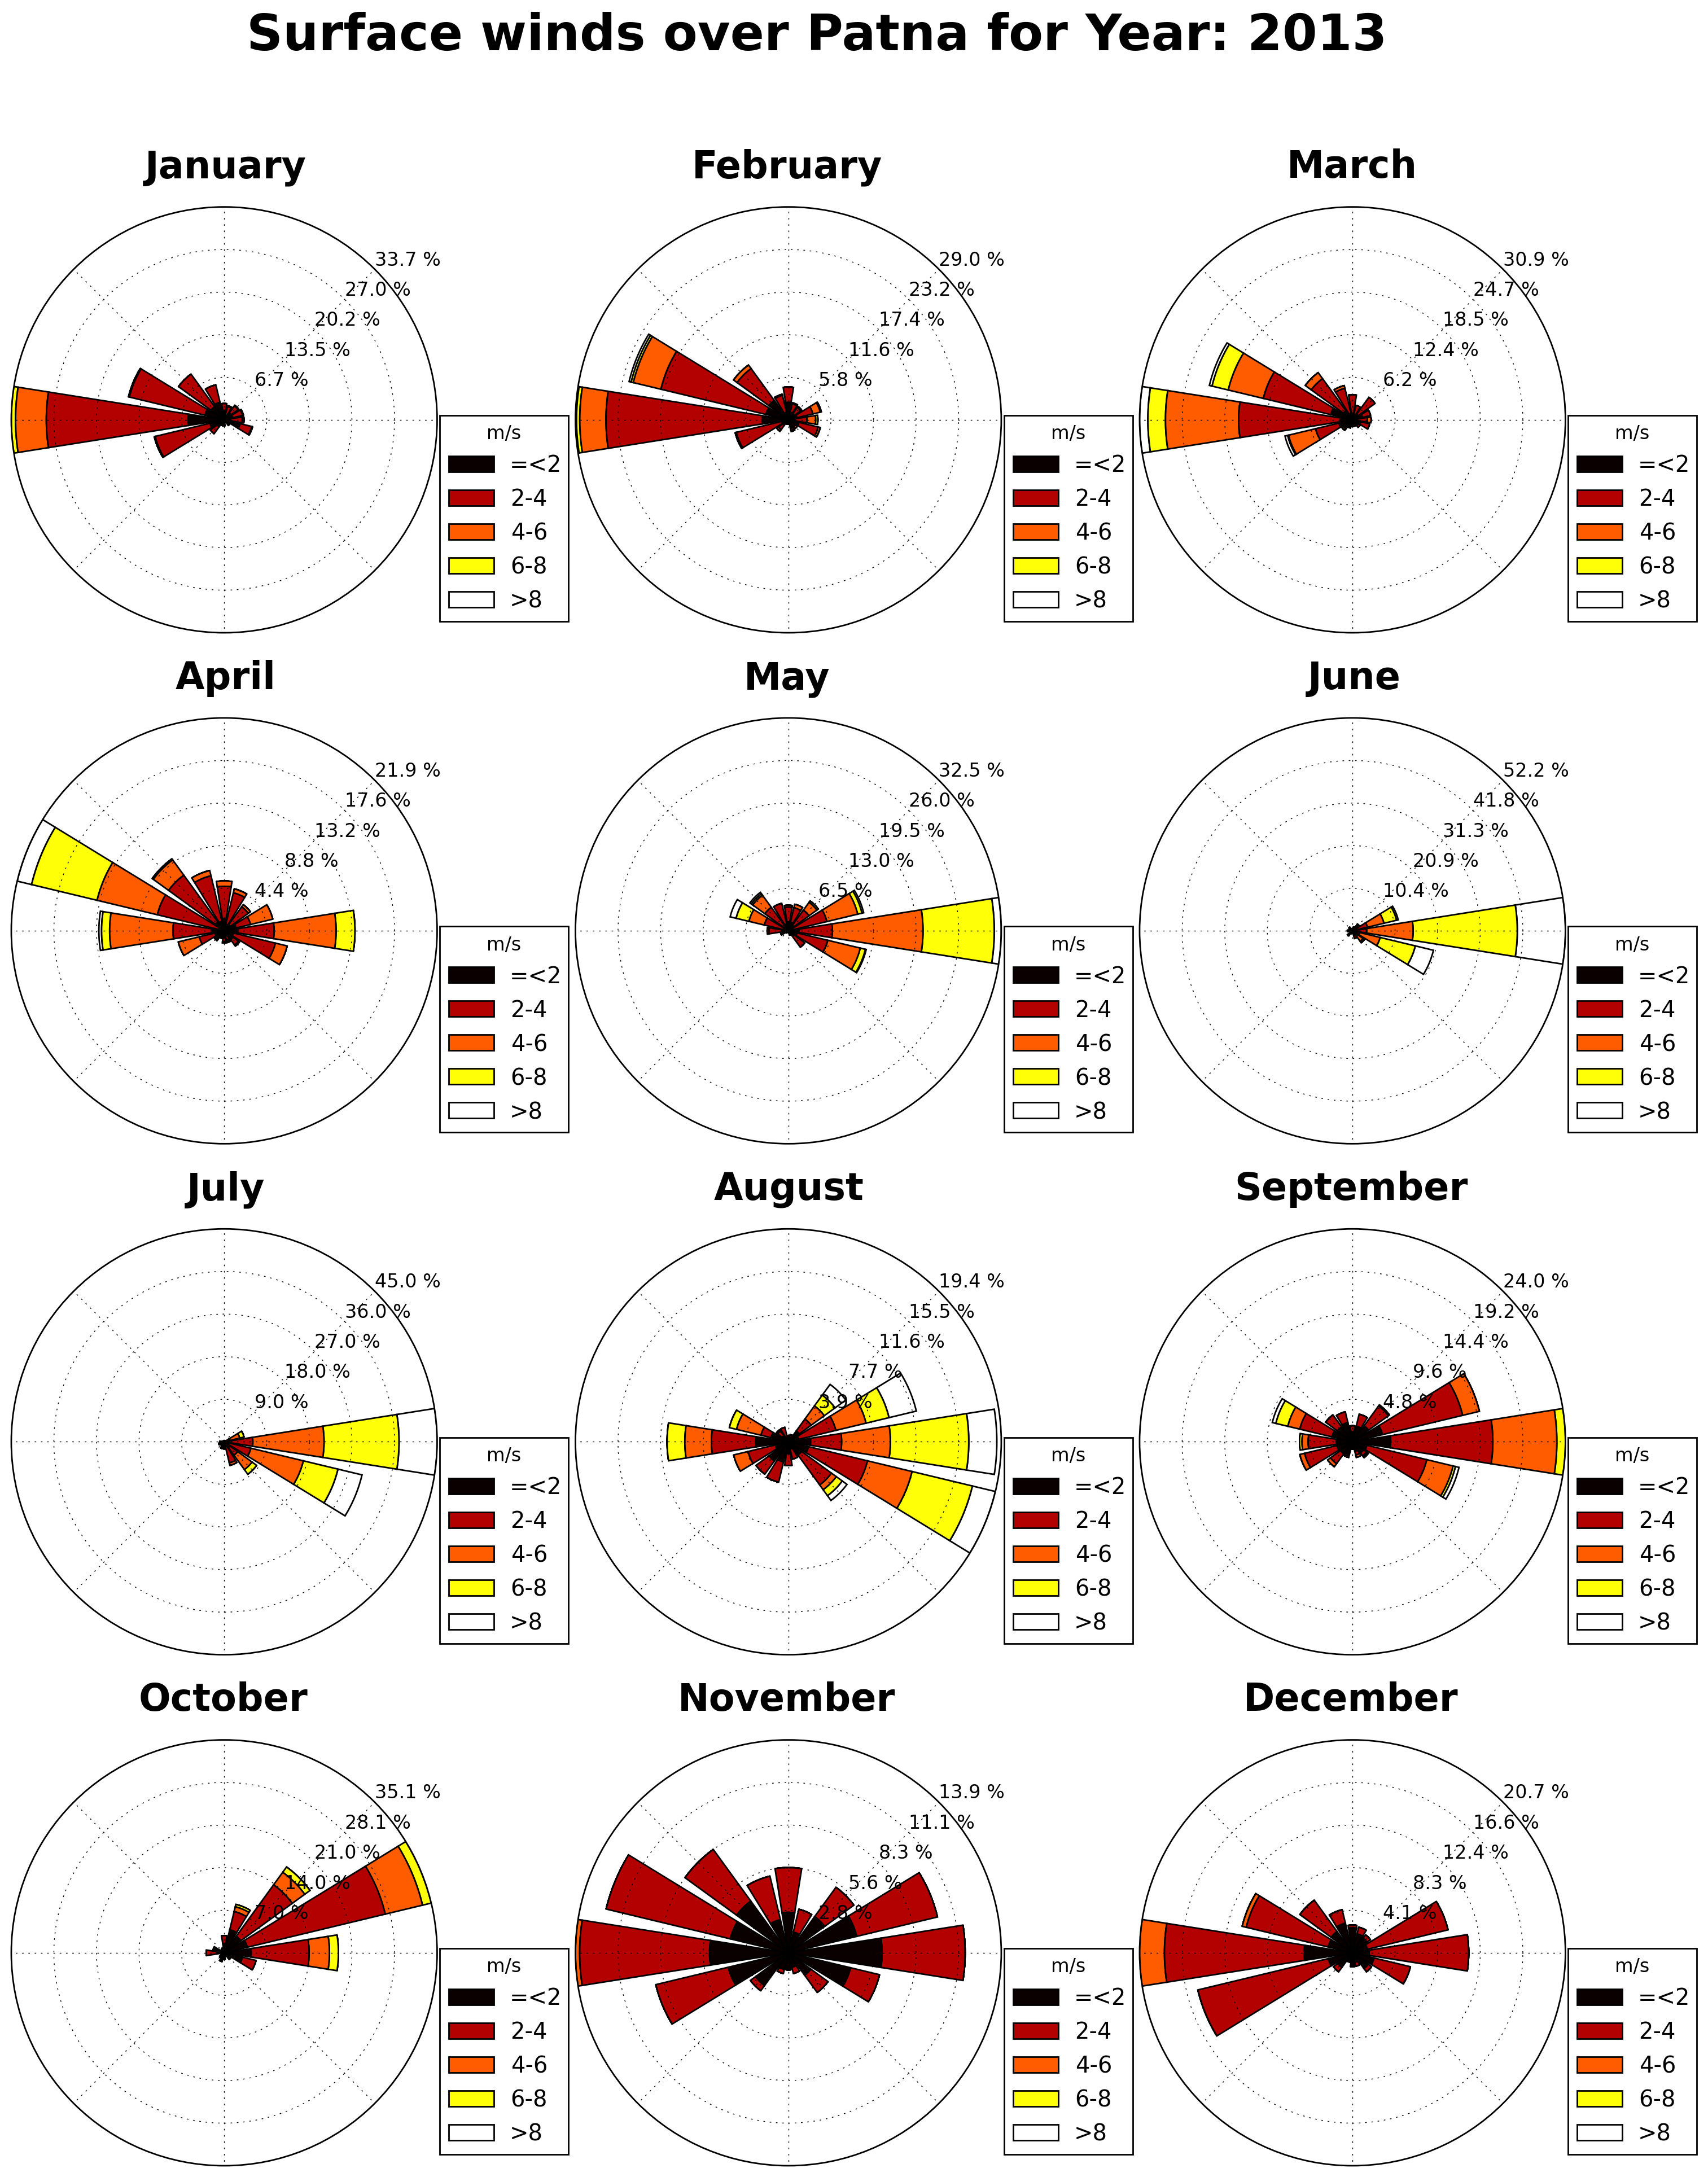
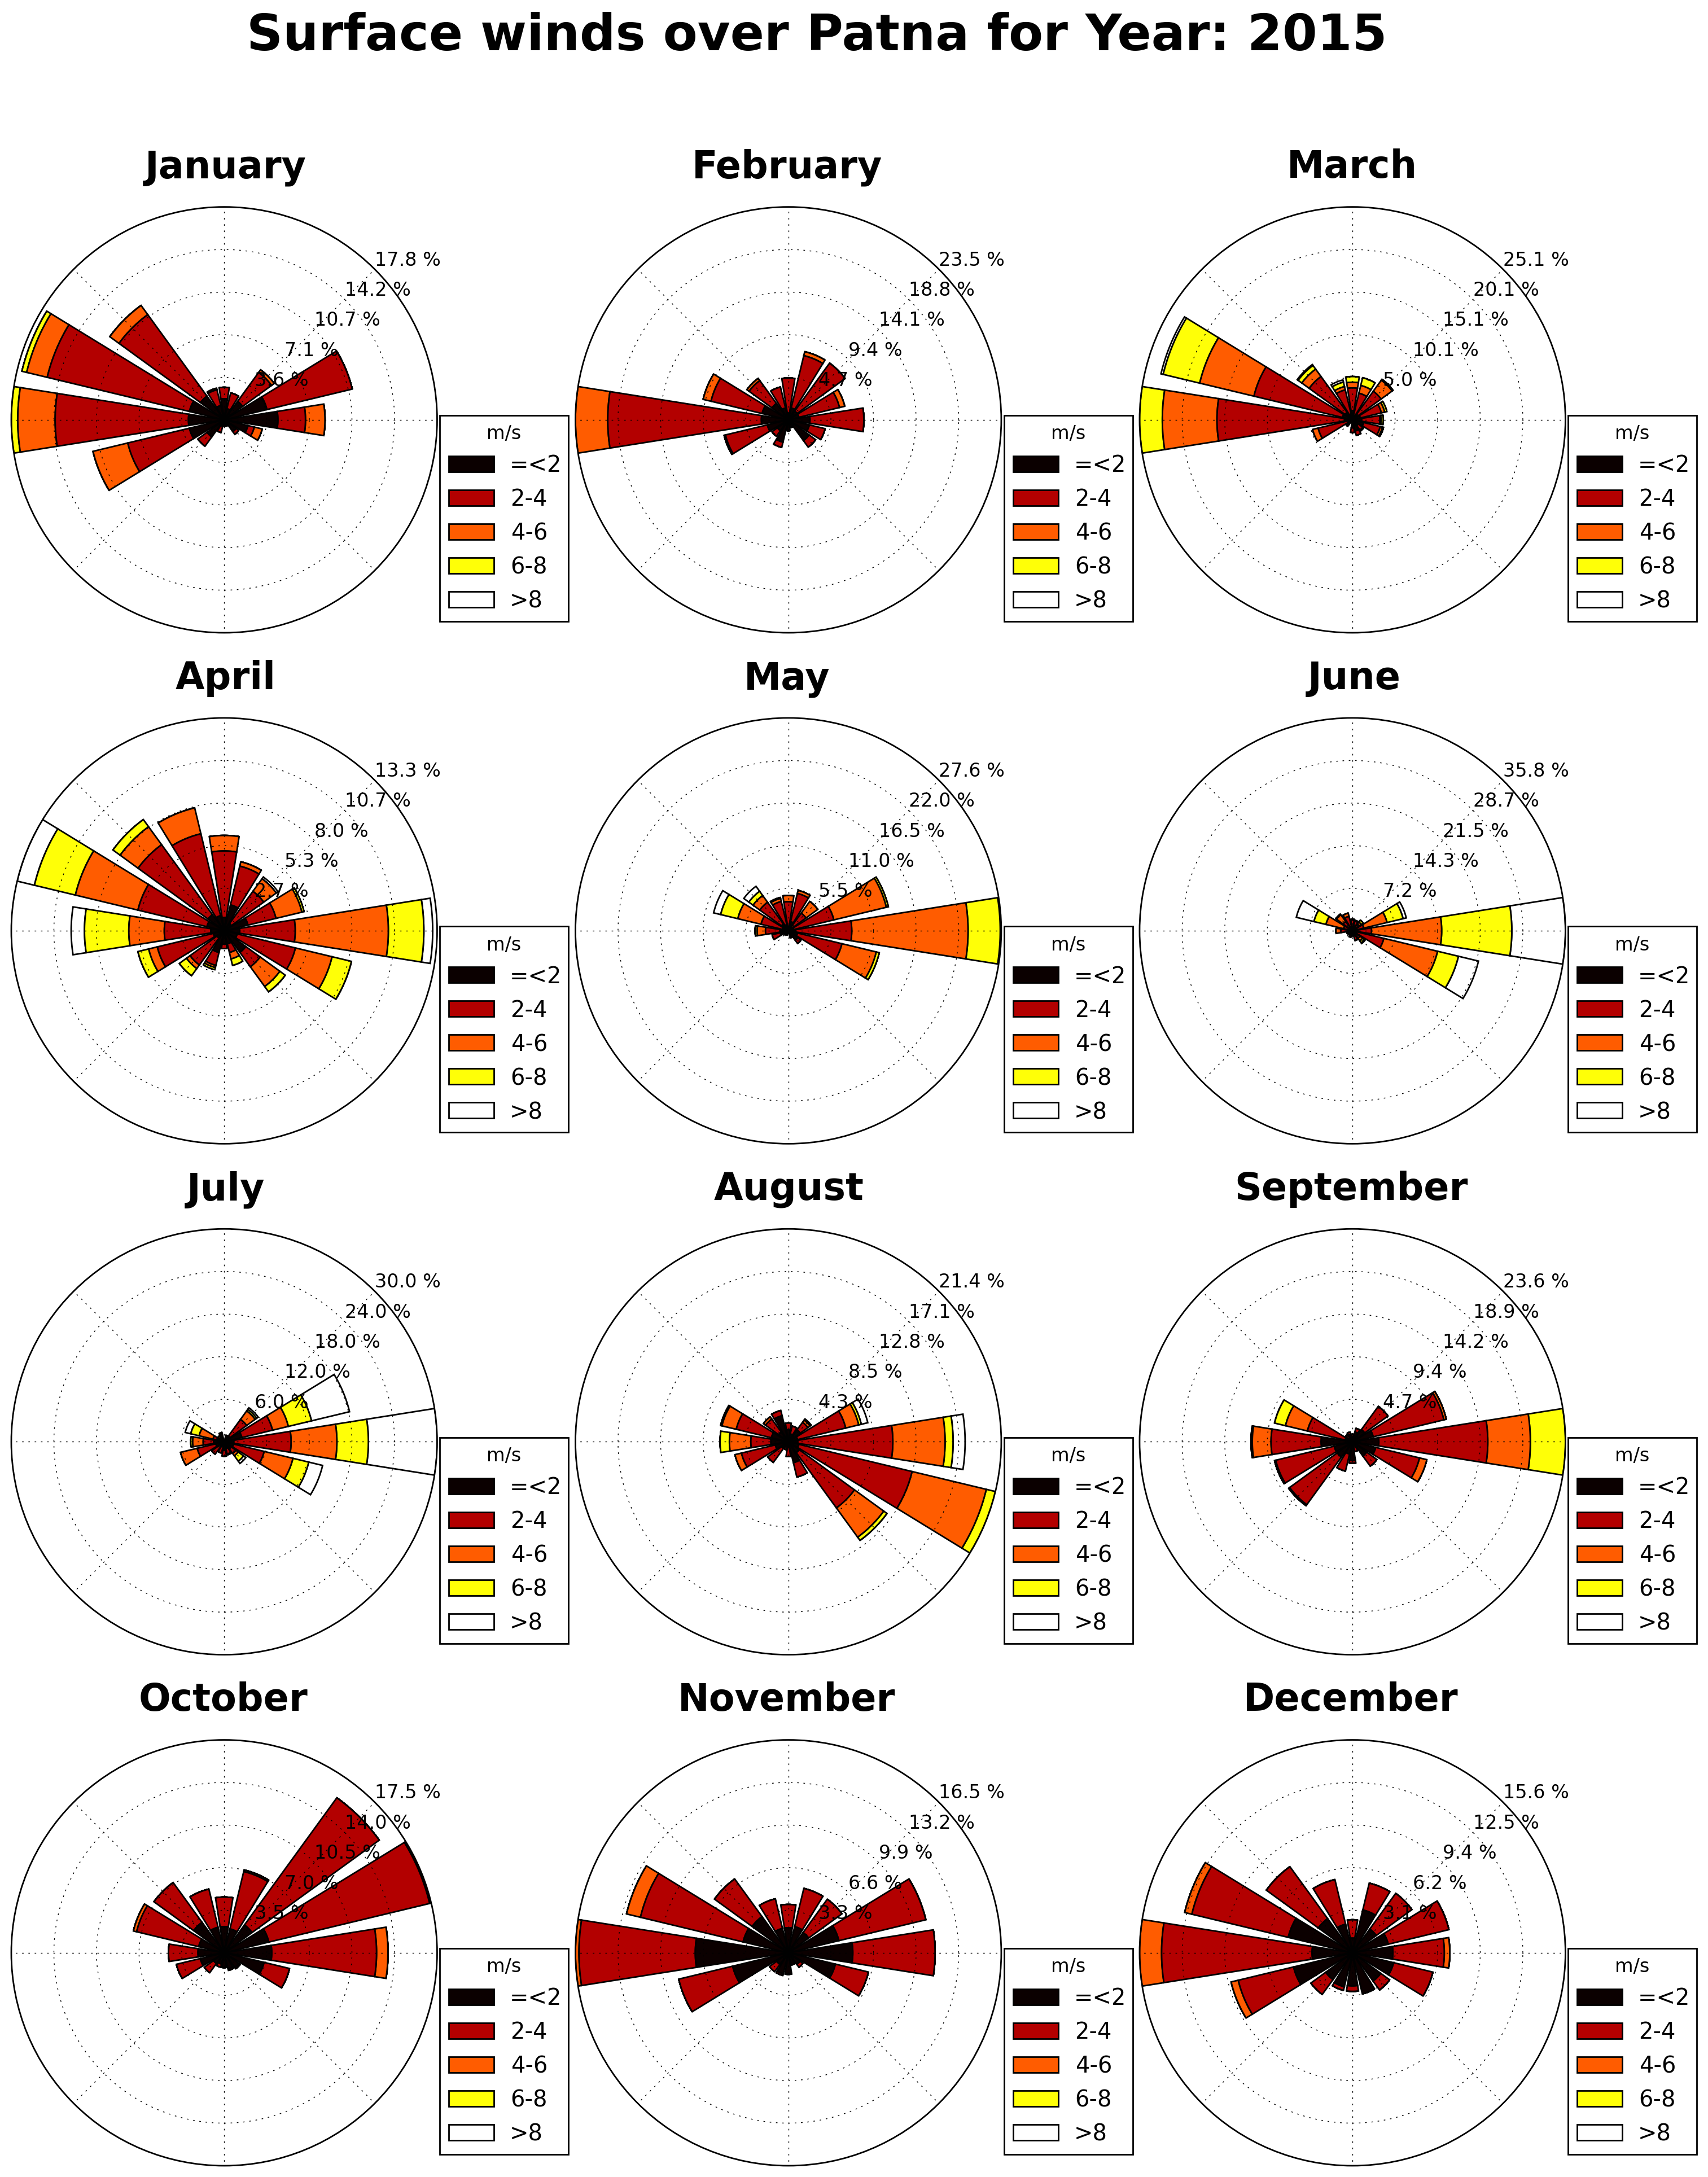
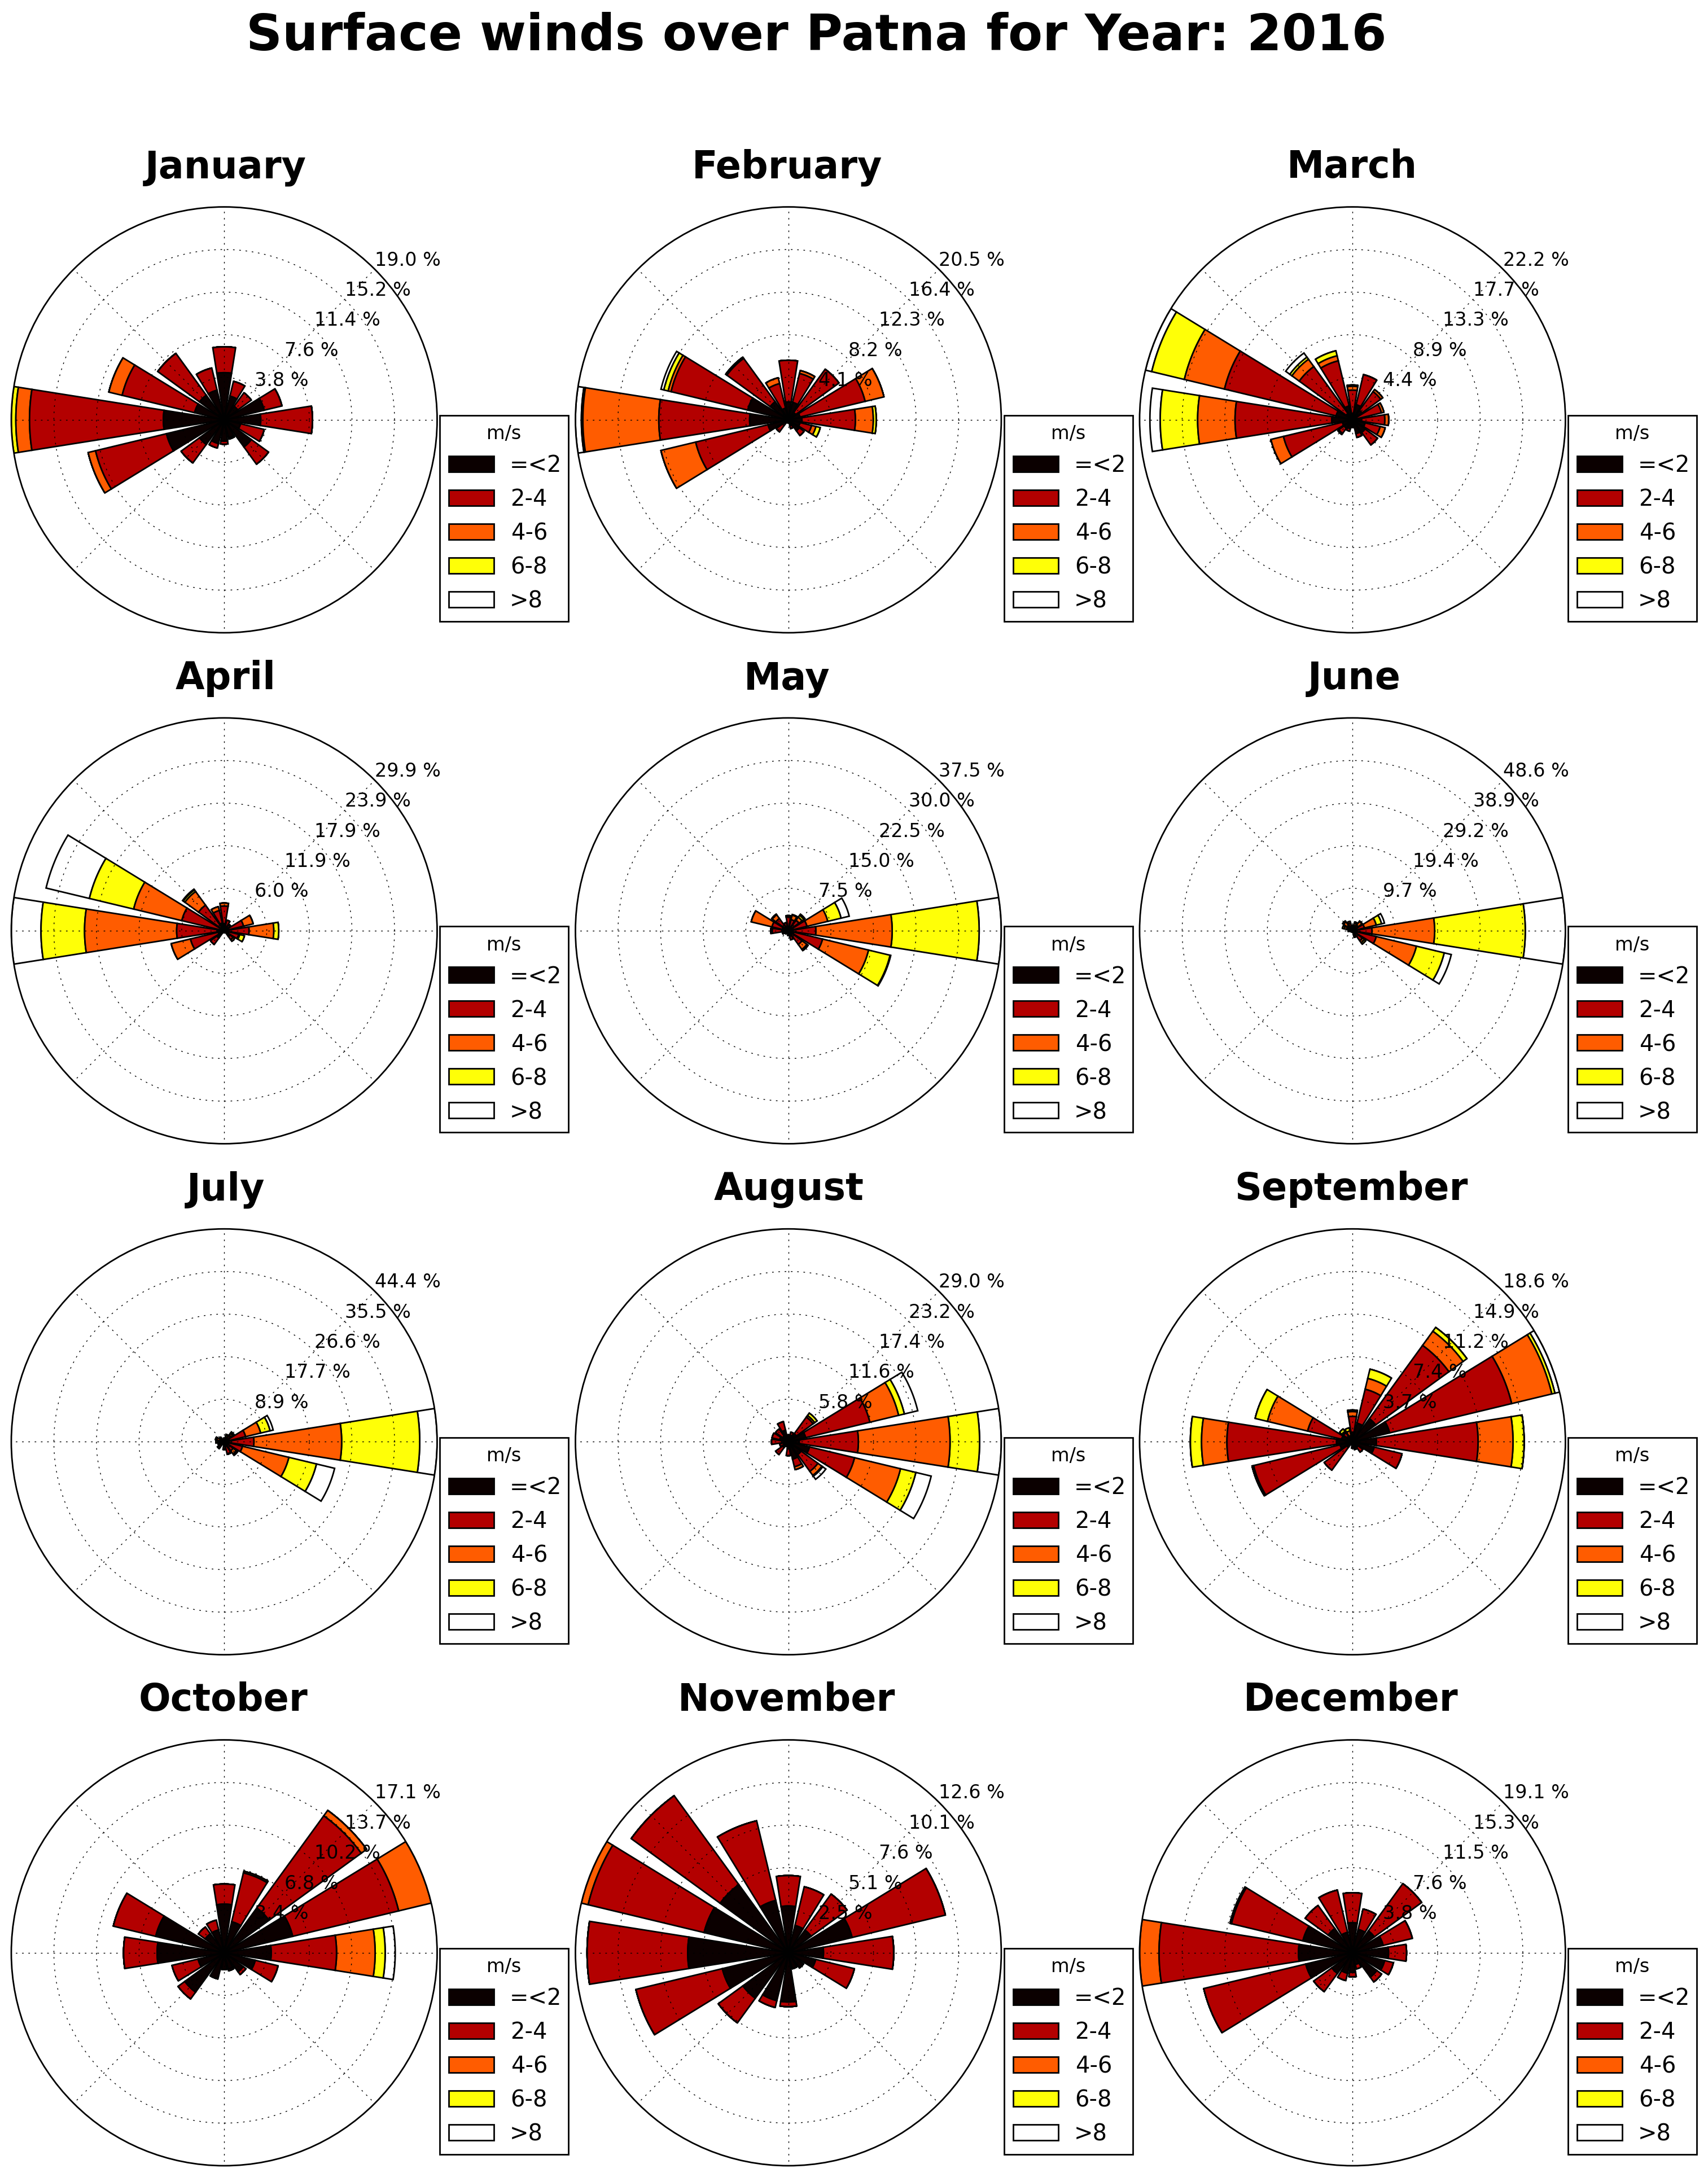
We processed the NCEP Reanalysis global meteorological fields from 2010 to 2016 through the 3D-WRF meteorological model. A summary of the data for year 2015, averaged for the district of Patna is presented below. Download the processed data which includes information on year, month, day, hour, precipitation (mm/hour), mixing height (m), temperature (C), wind speed (m/sec), and wind direction (degrees) – key parameters which determine the intensity of dispersion of emissions.
Windrose Functions for 2013-2016
 |
 |
 |
 |
We calculated the ambient PM2.5 concentrations and the source contributions, using gridded emissions inventory, 3D meteorological data (from WRF), and the CAMx regional chemical transport model. The model simulates concentrations at 0.01° grid resolution and includes contributions from primary emissions, secondary sources via chemical reactions, and long range transport via boundary conditions (represented as “outside” in the pie graph below).
 |
 |
 |
- Modeled urban average ambient PM2.5 concentration is 122.2 ± 23.1 μg/m3 – is more than 3 times the national standard (40) and more than 12 times the WHO guideline (10)
- The city requires at least 26 continuous air monitoring stations to statistically, spatially, and temporally, represent the mix of sources and range of pollution in the city (current status – 2 manual and 1 continuous)
- The modeled source contributions present an even share of transport (including on road dust), domestic cooking and heating, industries, open waste burning, and influence of outside sources, as the key air pollution sources in the urban area
- The city has an estimated 19% of the ambient annual PM2.5 pollution (in 2015) originating outside the urban airshed, which suggests that some regional interventions could reduce the pollution loads. This contribution is mostly stemming from coal-fired power plants, large (metal and non-metal processing) industries, and brick kilns located outside the urban airshed
- The city needs to aggressively promote public and non-motorized transport as part of the city’s urban development plan, along with the improvement of the road infrastructure to reduce on-road dust re-suspension
- By 2030, the share of emissions from residential cooking and lighting is expected to decrease with a greater share of LPG, residential electrification, and increasing urbanization. However, biomass and coal burning to provide warmth in the winter will still be an issue
- By 2030, the vehicle exhaust emissions are expected to remain constant, if and only if, Bharat 6 fuel standards are introduced nationally in 2020, as recommended by the Auto Fuel Policy
- The 300 brick kilns in the urban airshed (and more outside) are fueled mostly by coal, agri-waste, and other biomass. These kilns can benefit from a technology upgrade from the current fixed chimney and clamp style baking to (for example) zig-zag, in order to improve their overall energy efficiency
- Most of the small and the medium industry needs an energy efficiency management plan to address the emissions from coal, heavy fuel oil, and gas combustion or shift towards using electricity
- Open waste burning is dispersed across the city and requires stricter regulations for addressing the issue, as the city generates ever more garbage, with limited capacity to sort and dispose of it.
Back to the APnA page.
All the analysis and results are sole responsibility of the authors @ UrbanEmissions.Info. Please send you comments and questions to simair@urbanemissions.info