Updated: February, 2022
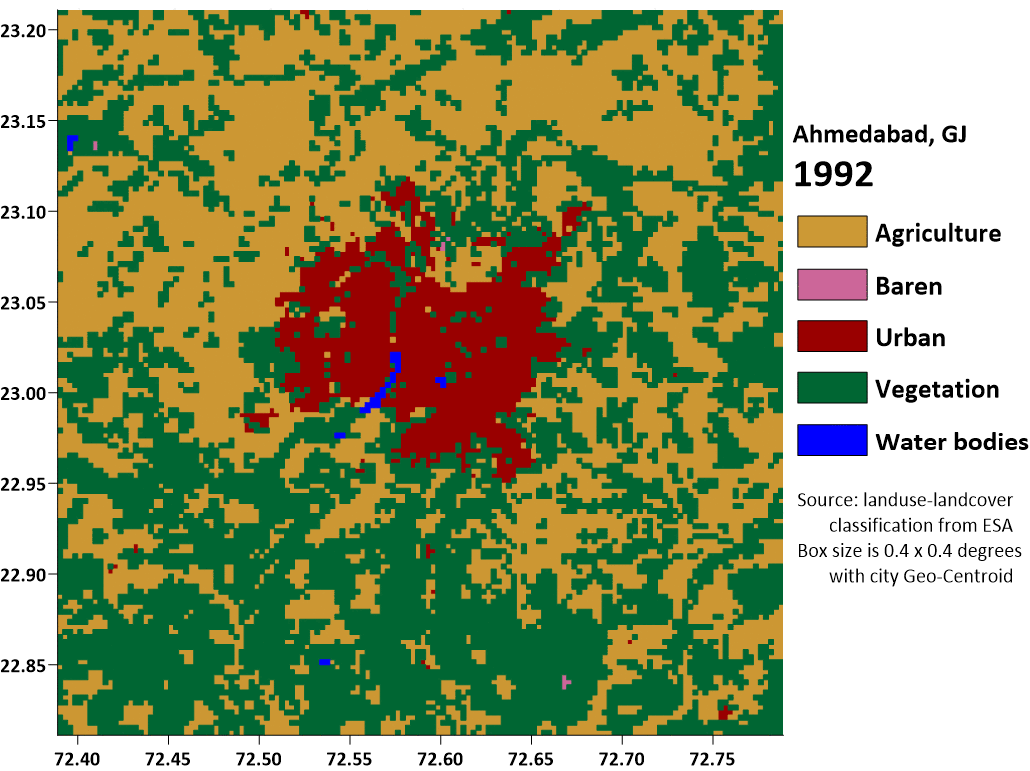
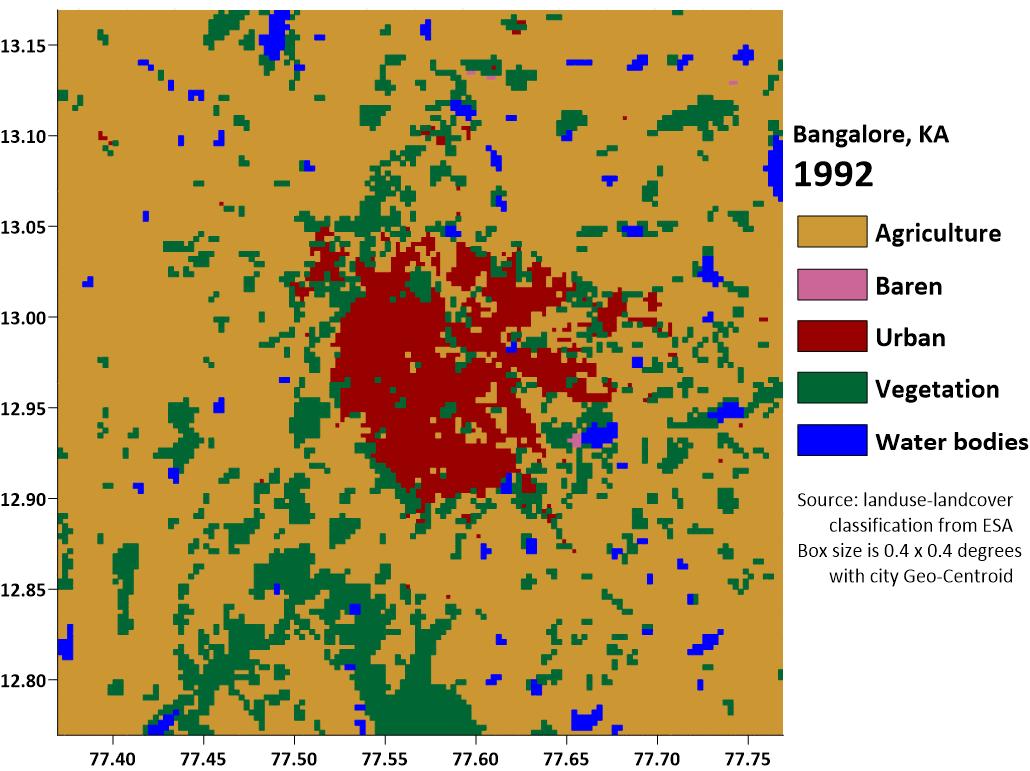
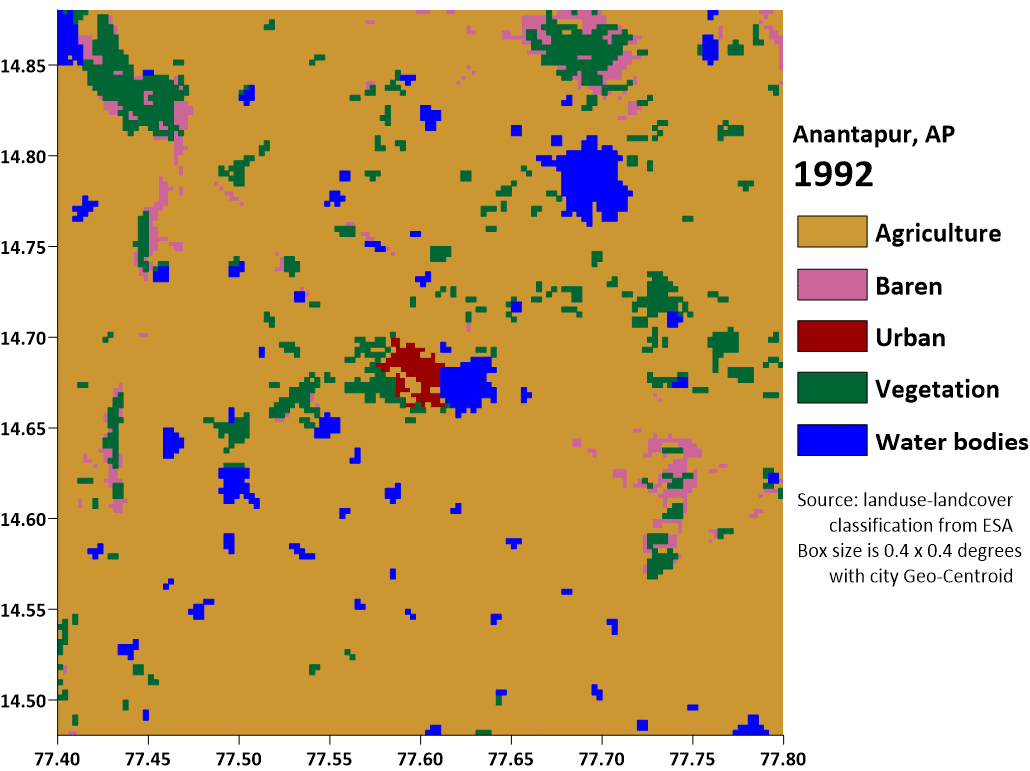
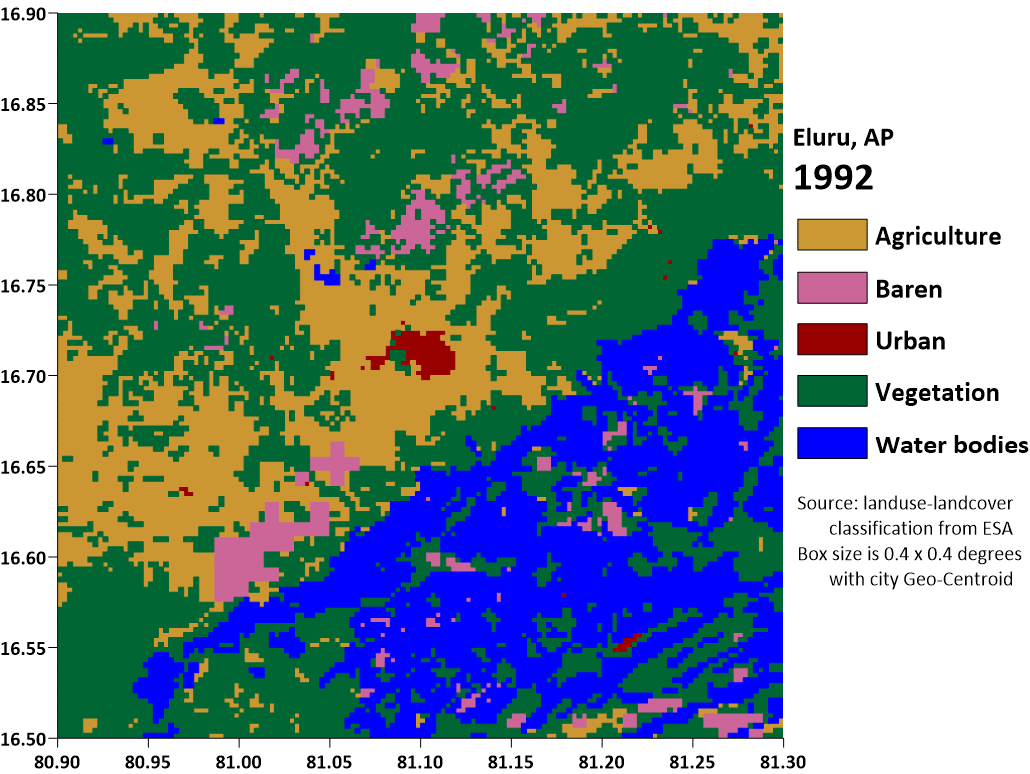
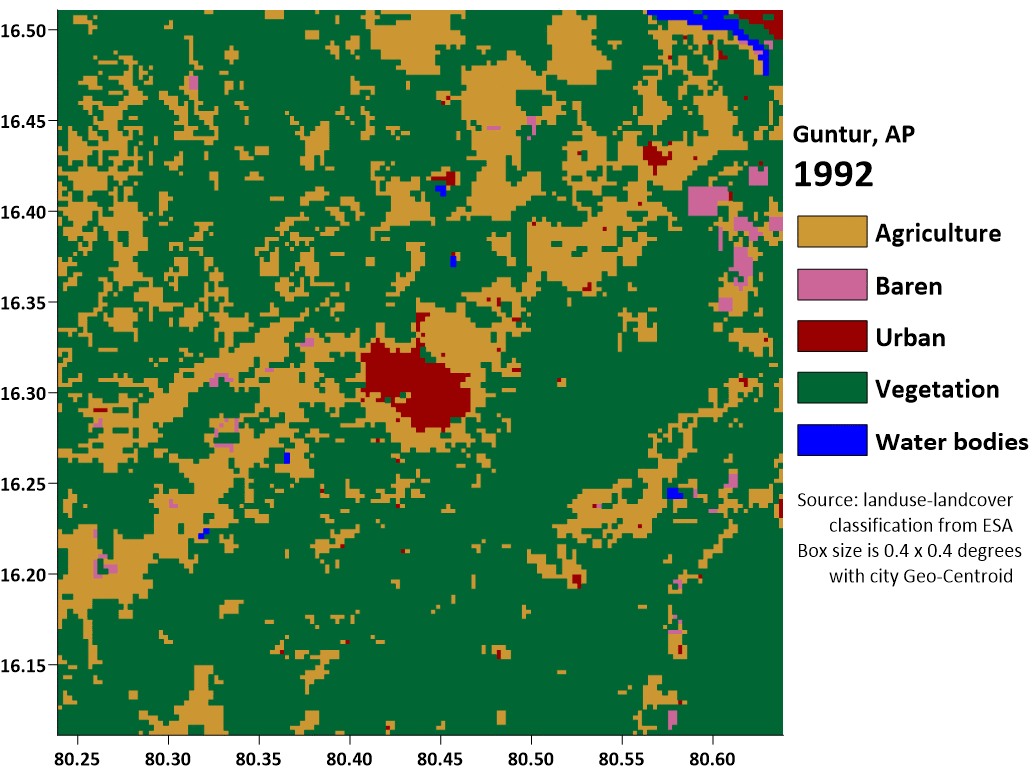
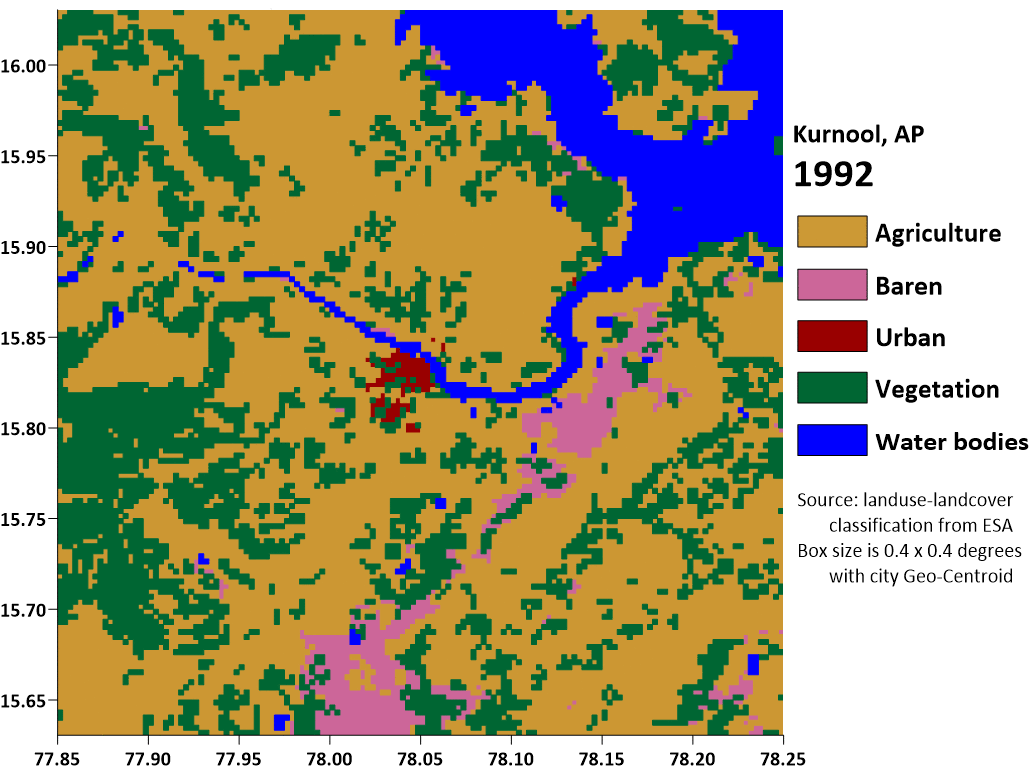
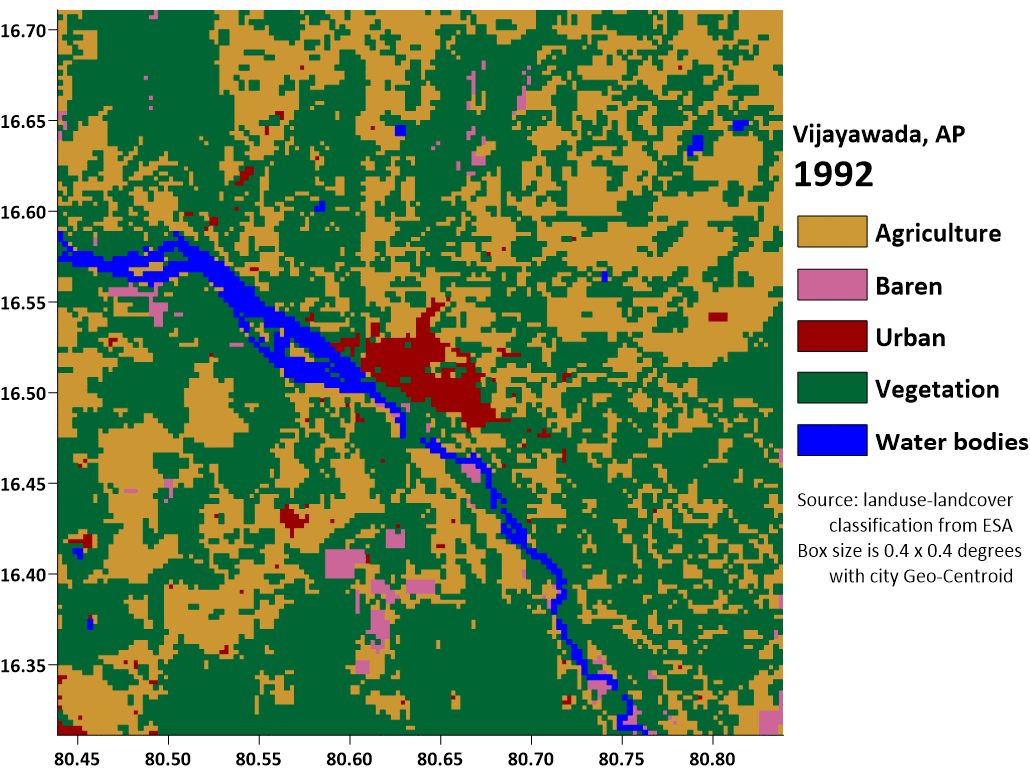
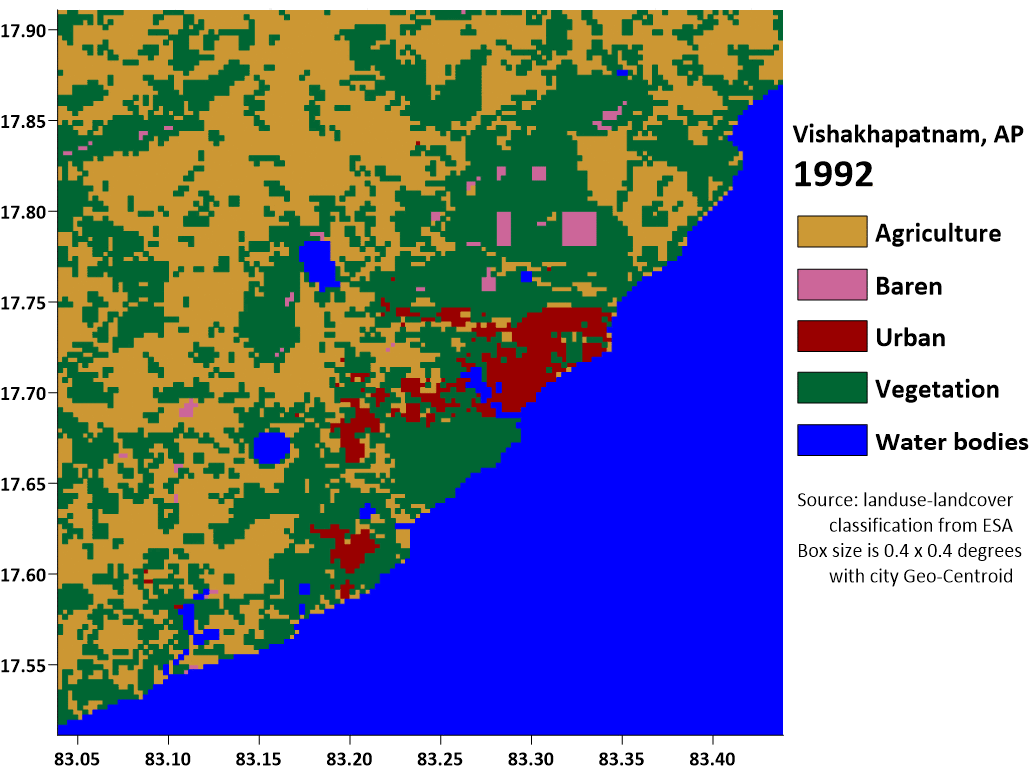
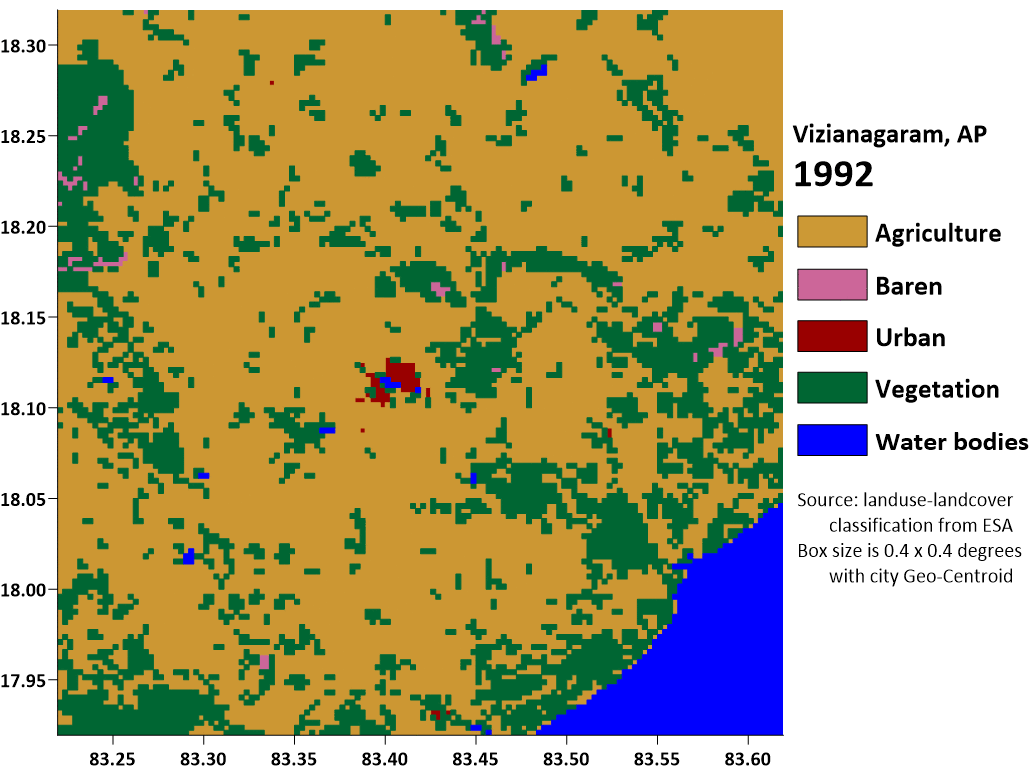
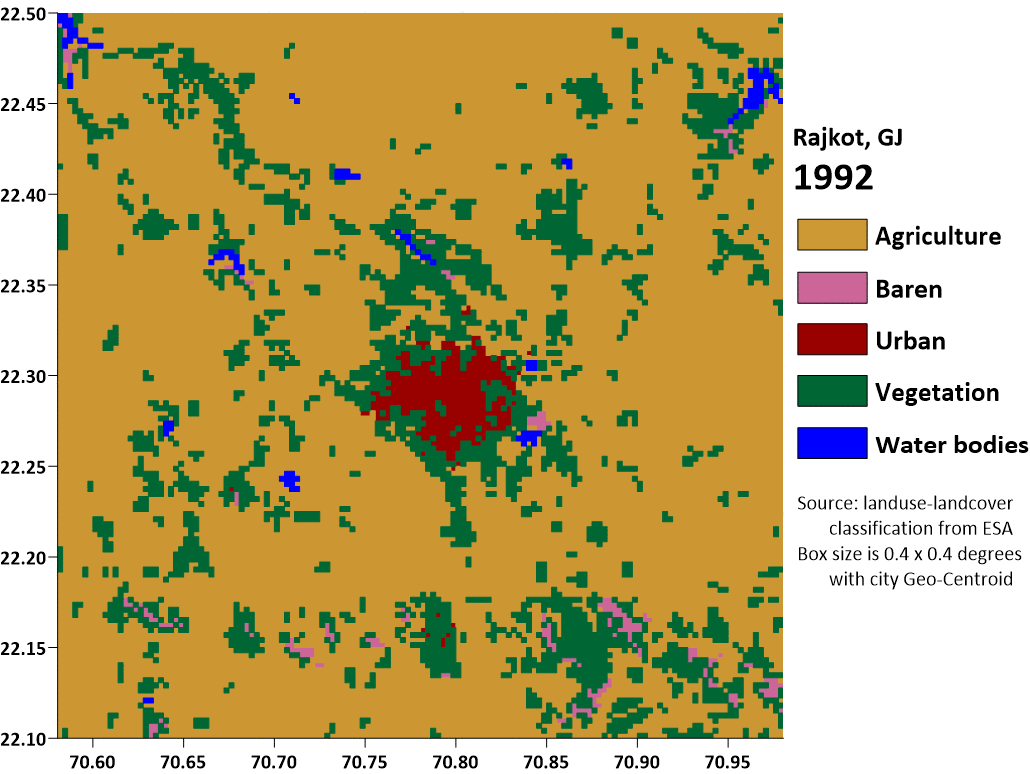
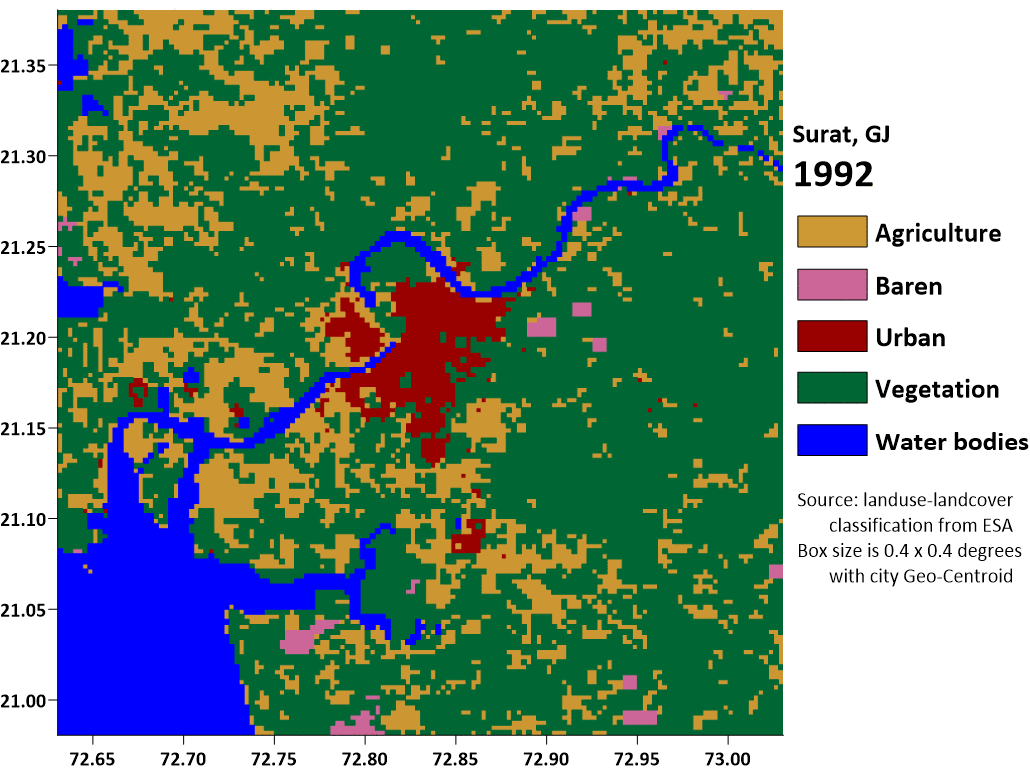
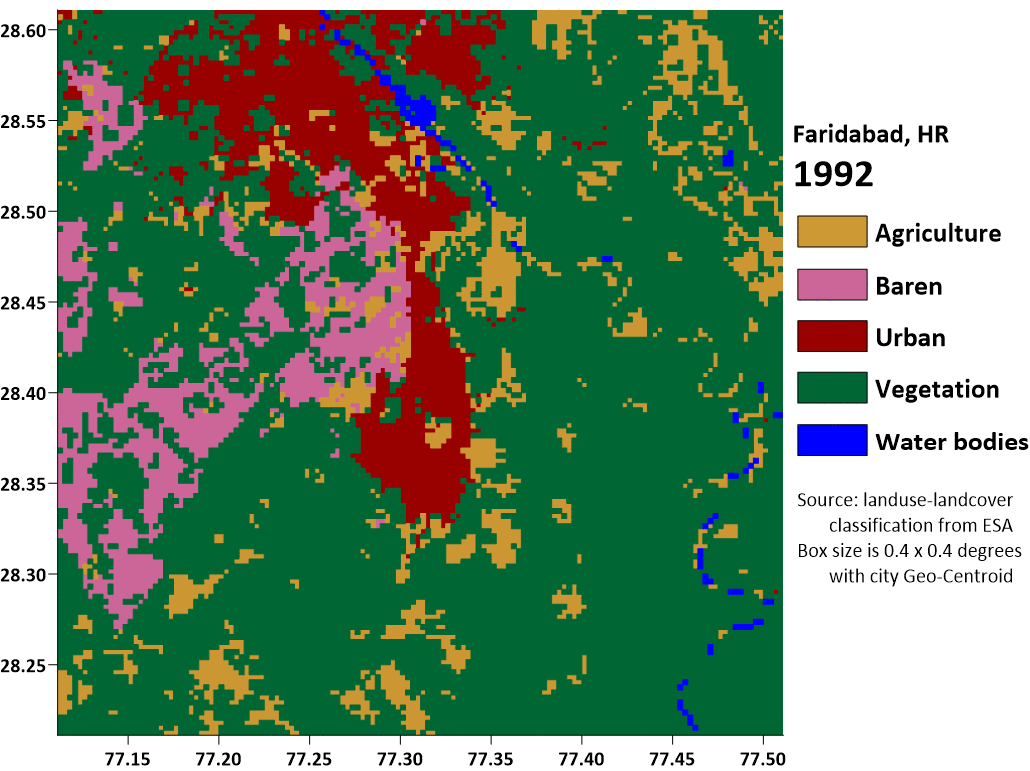
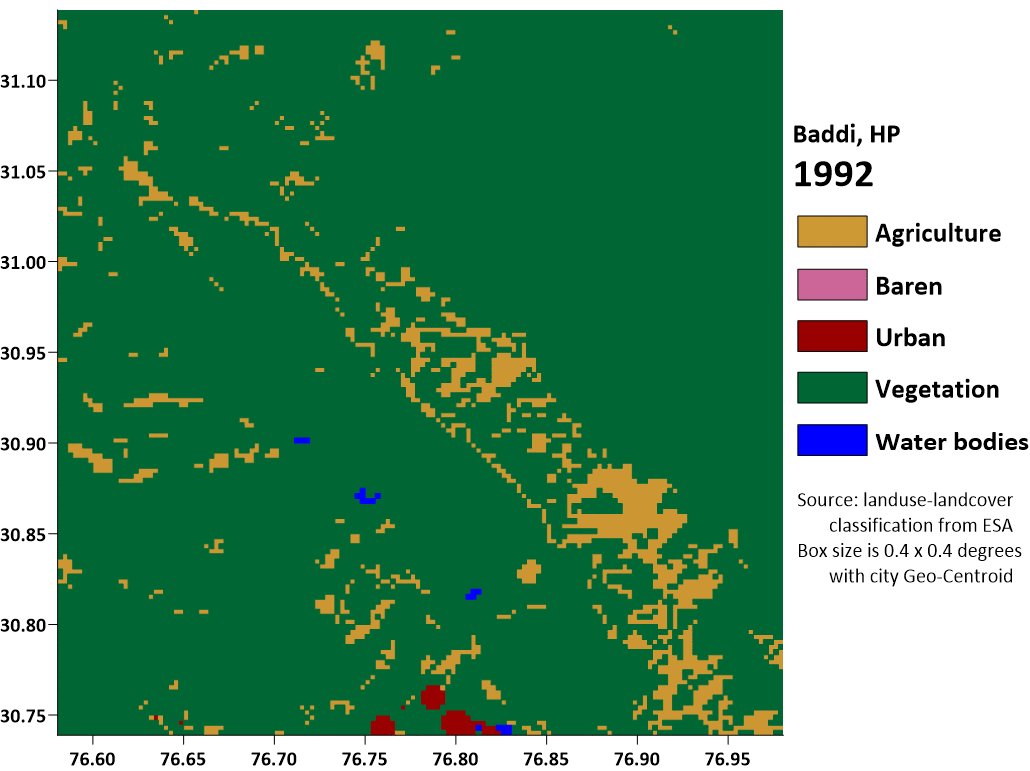
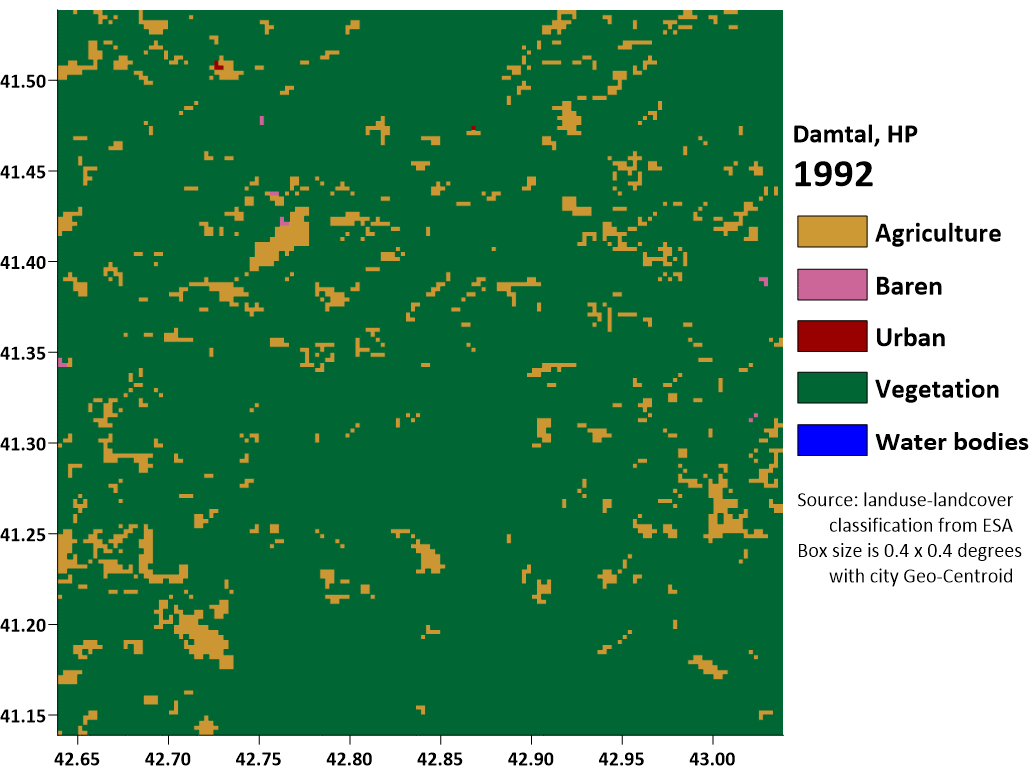
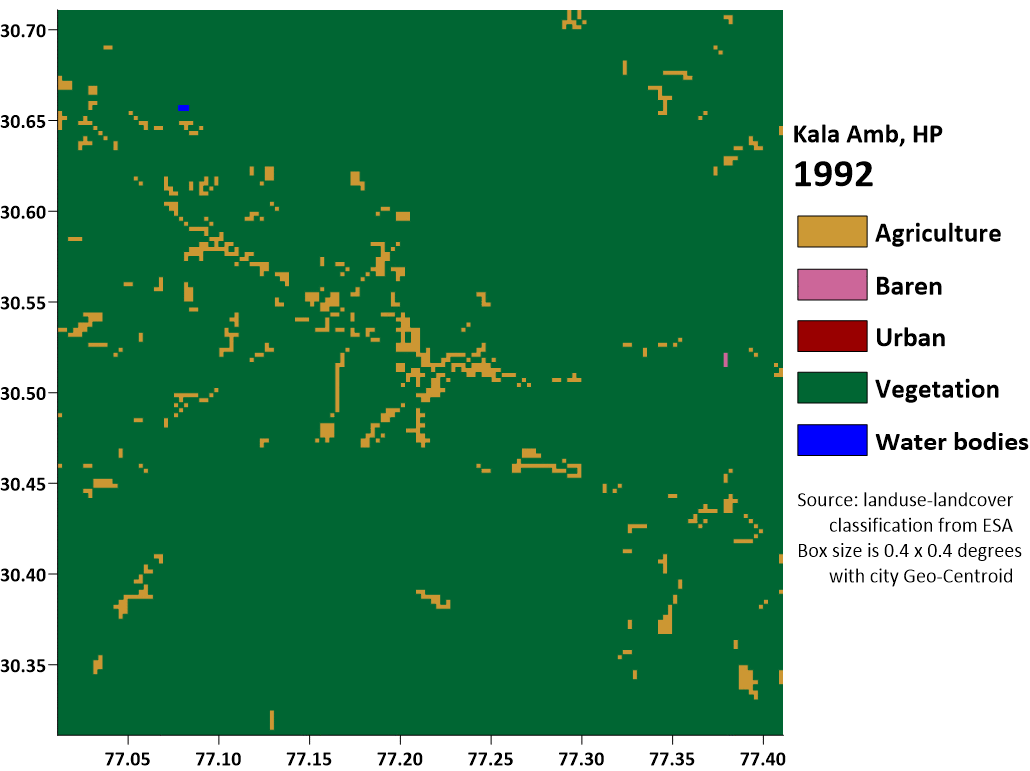
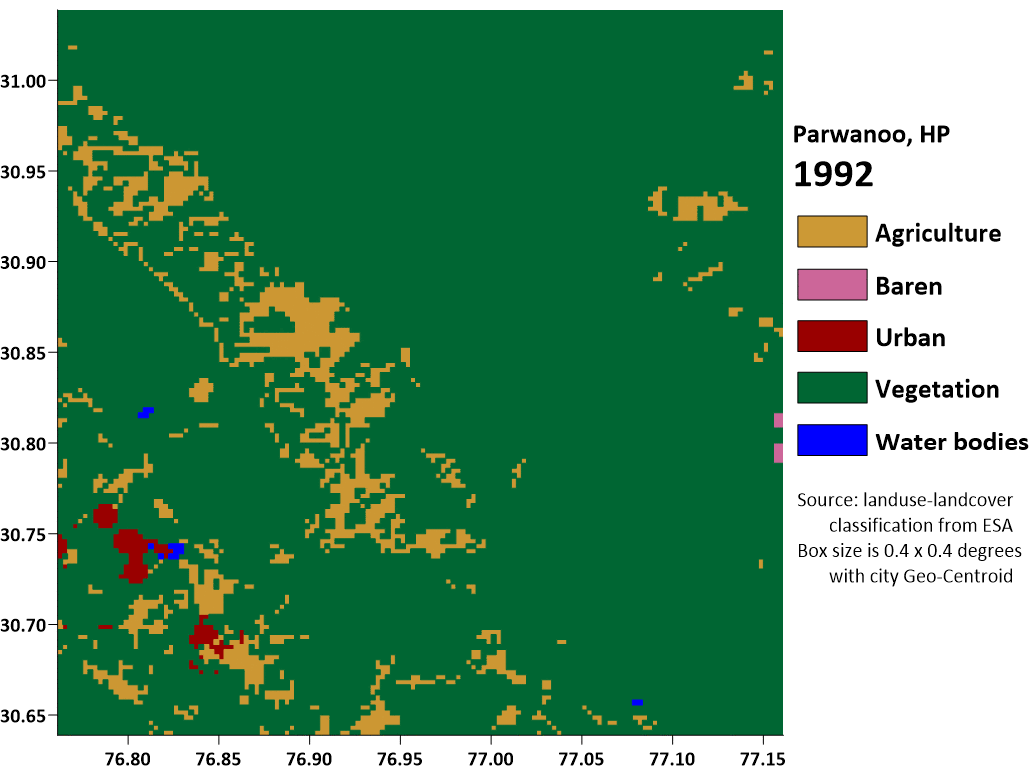
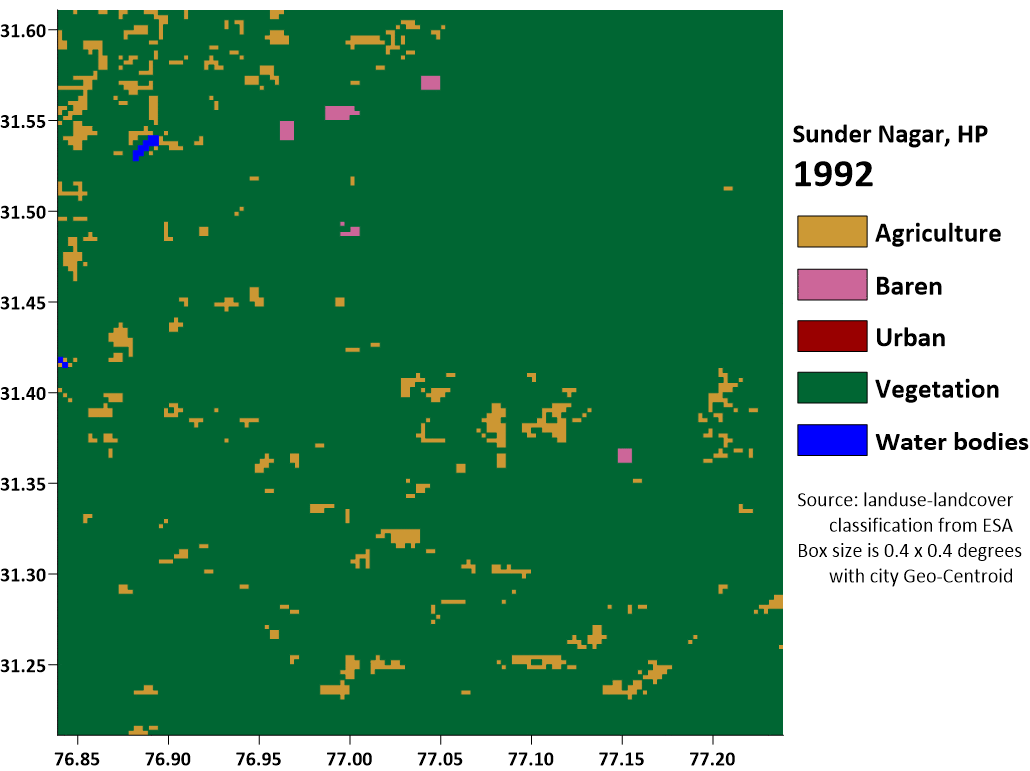
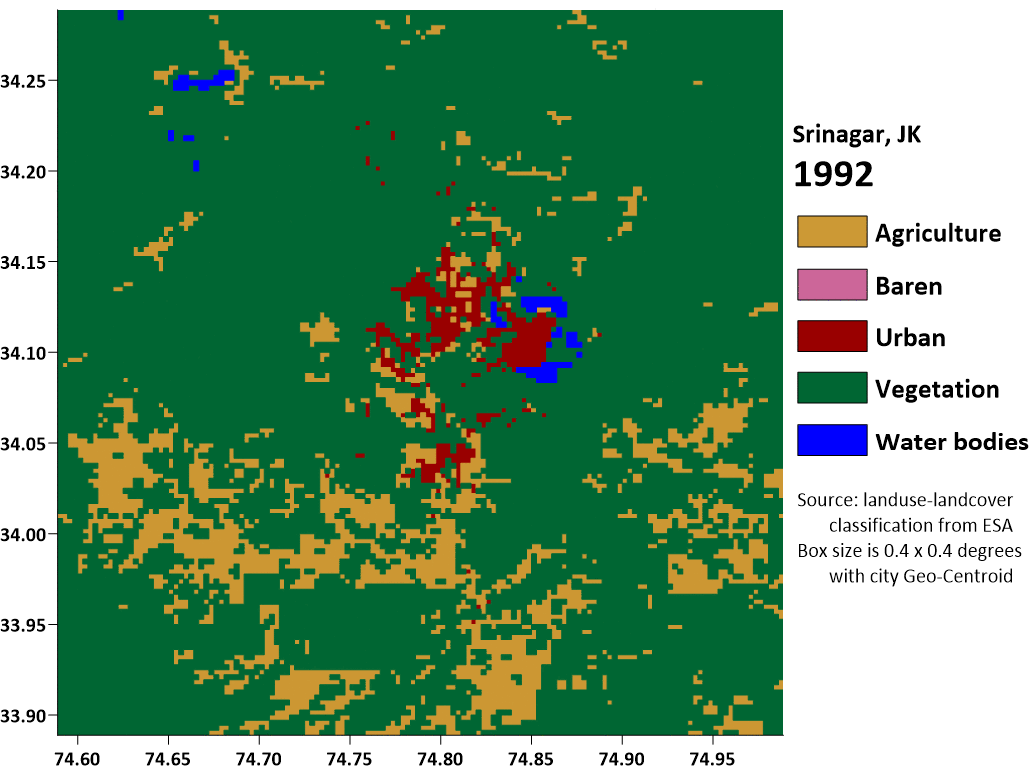
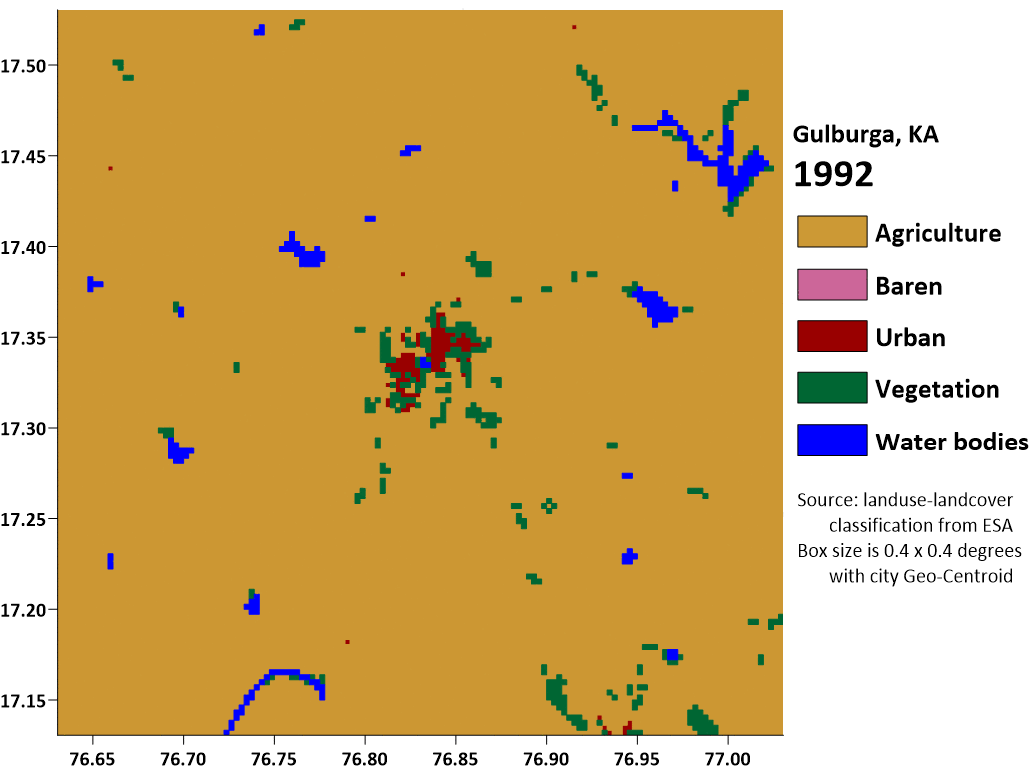
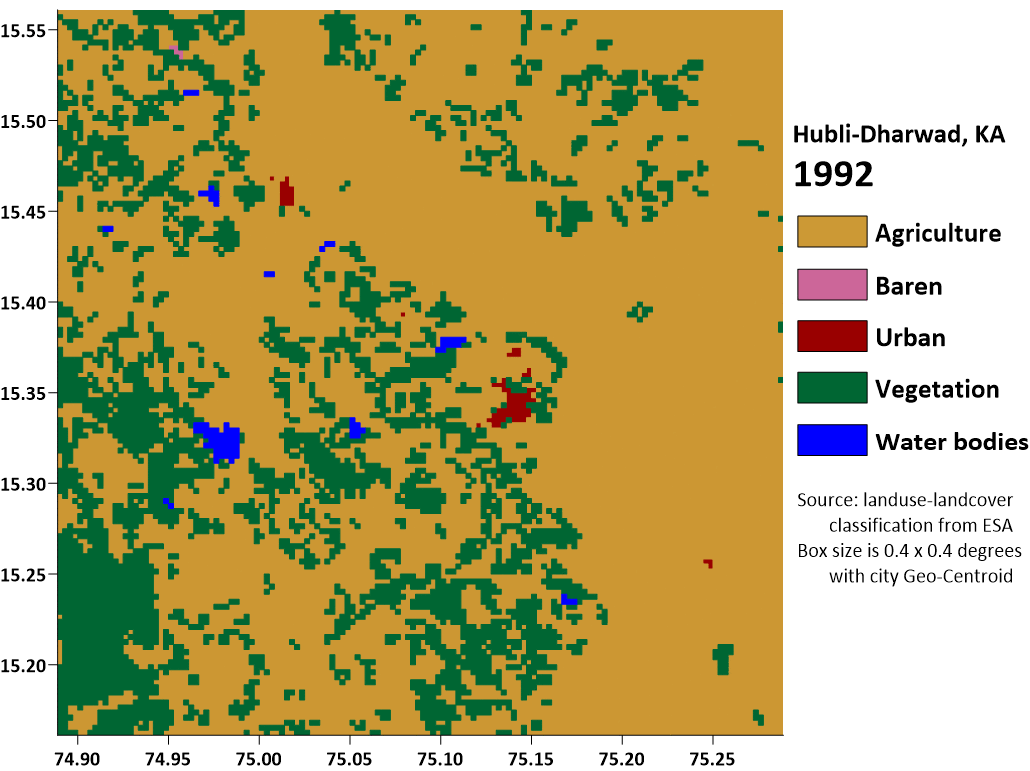
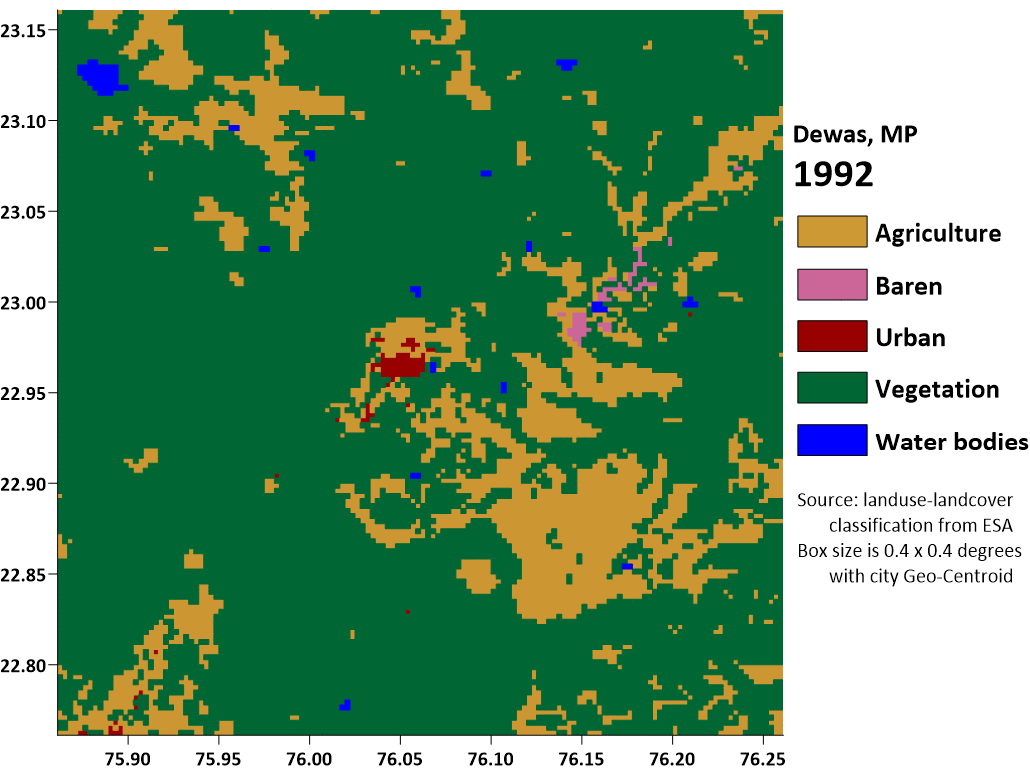
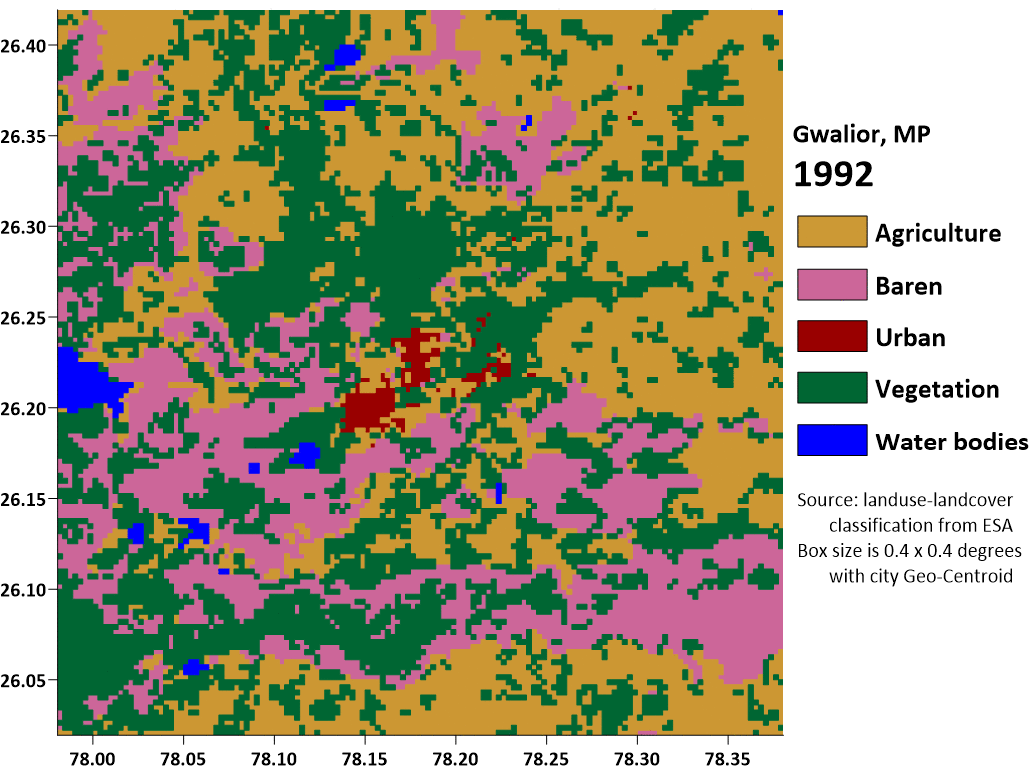
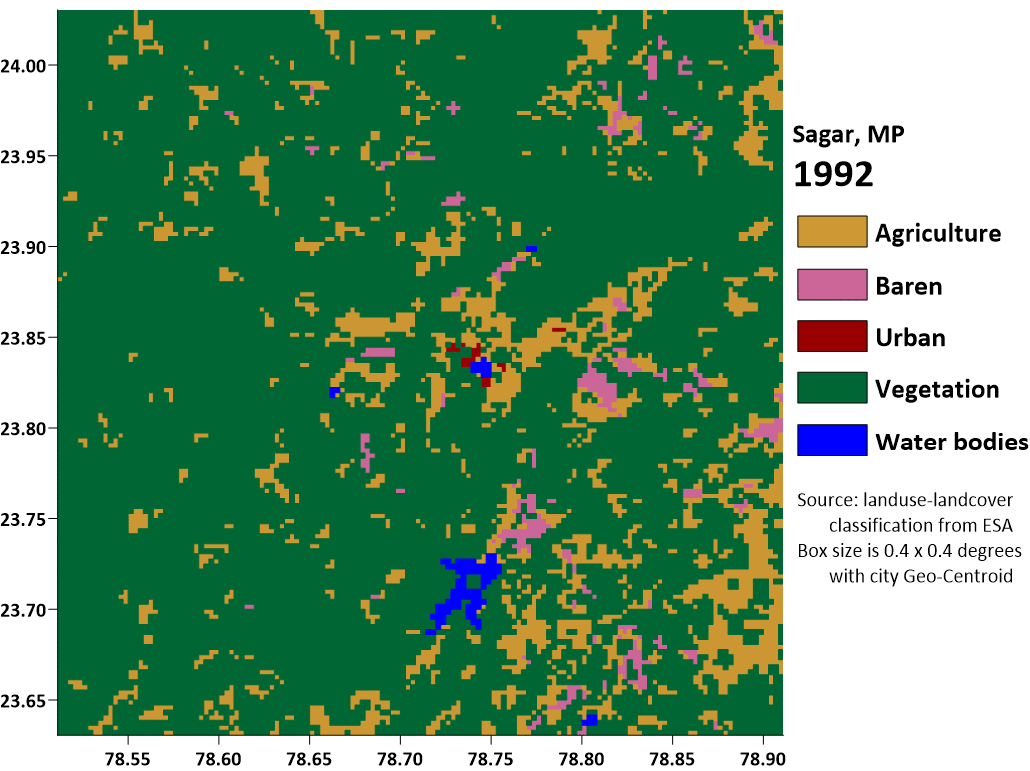
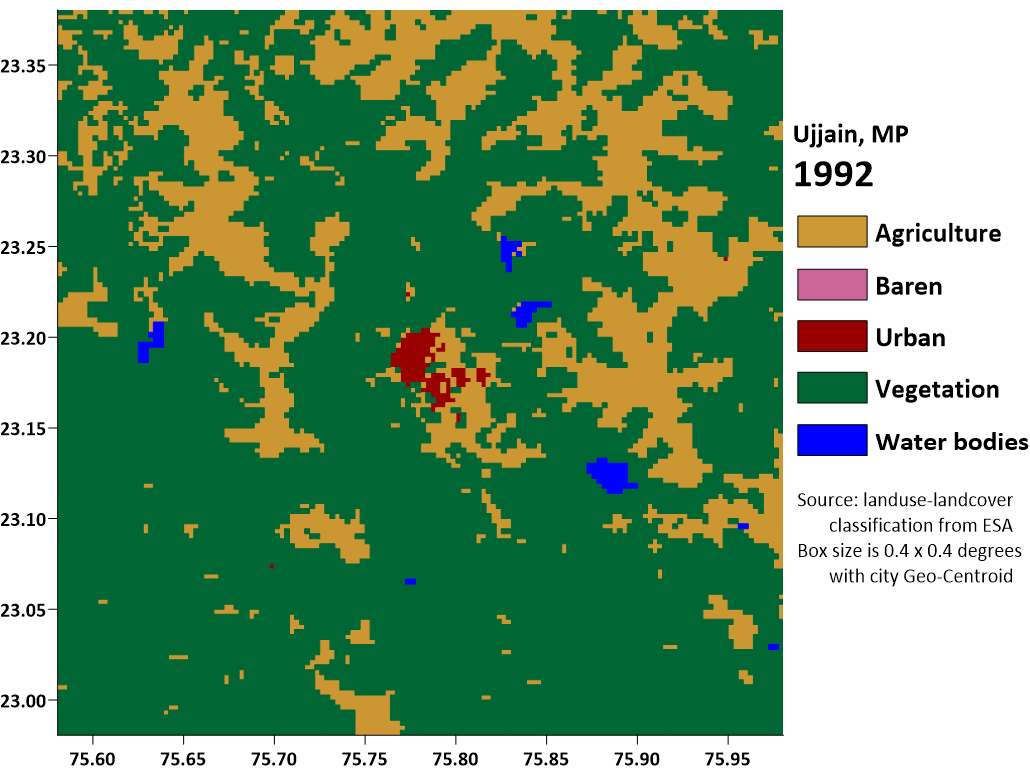
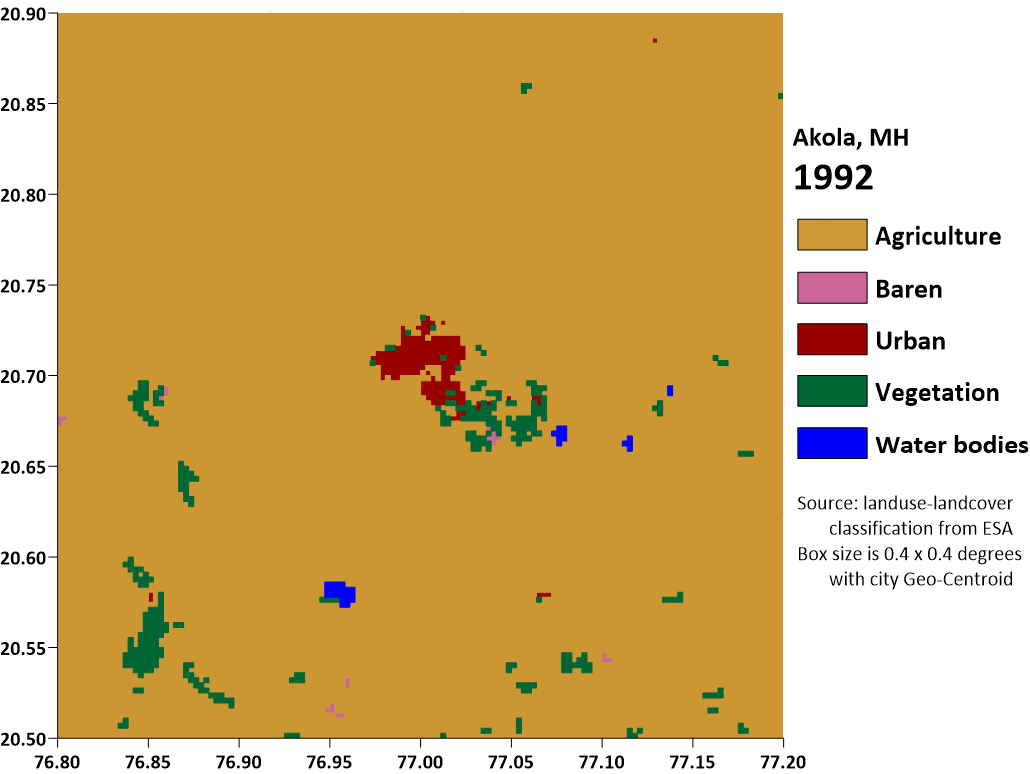
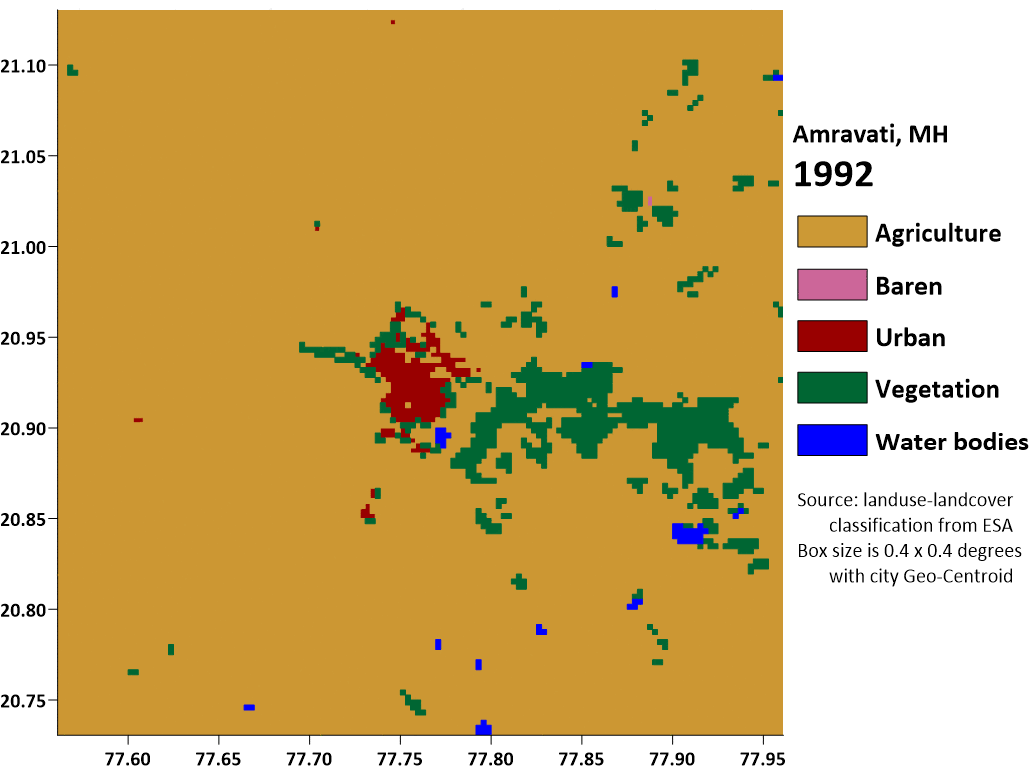
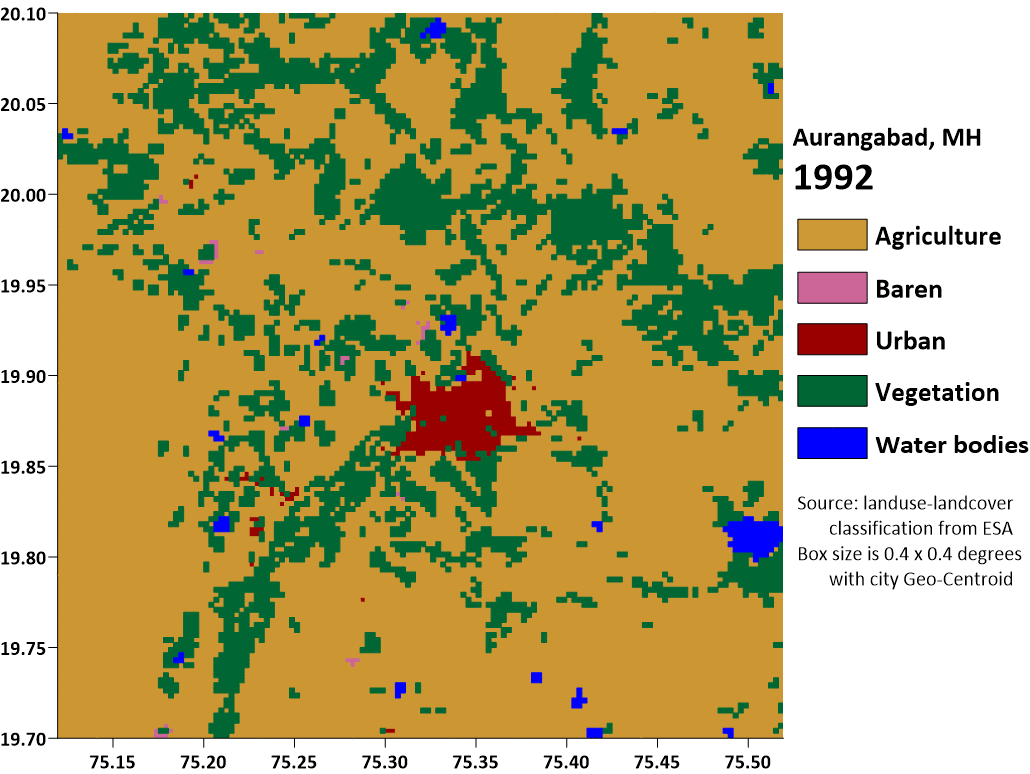
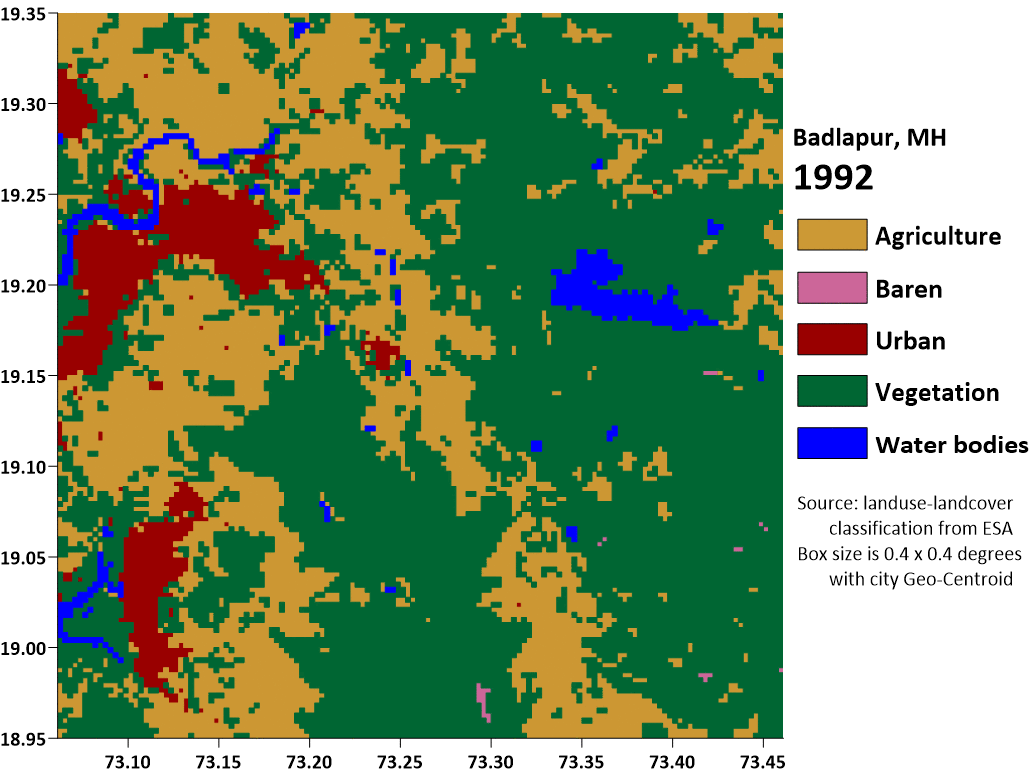
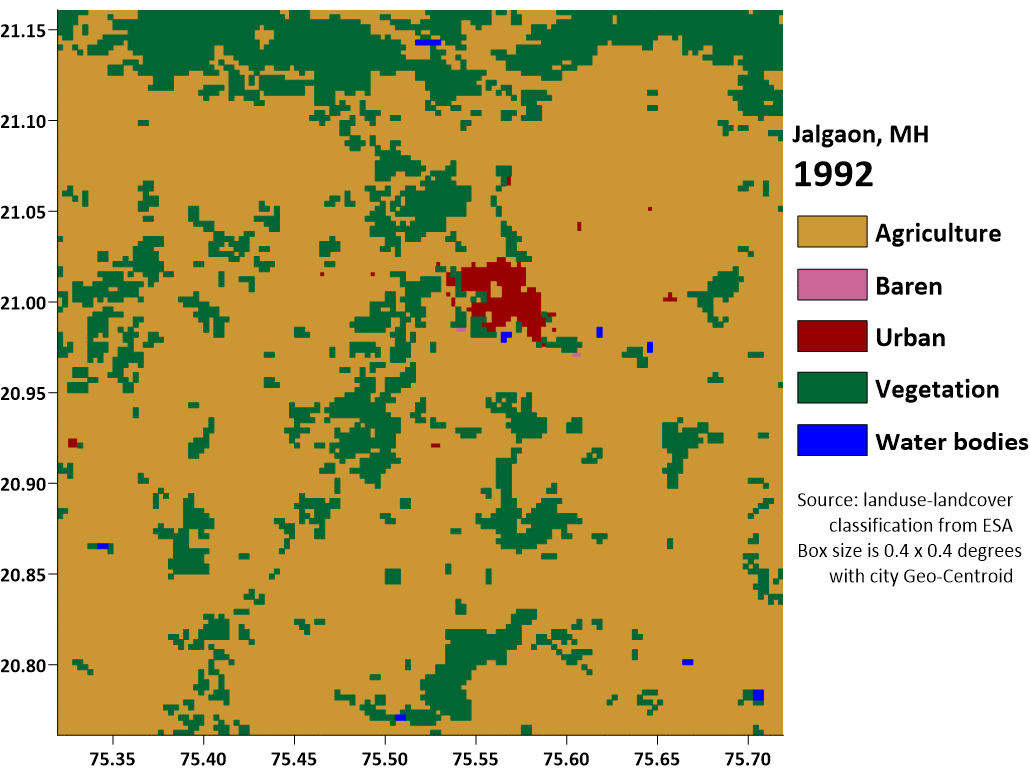
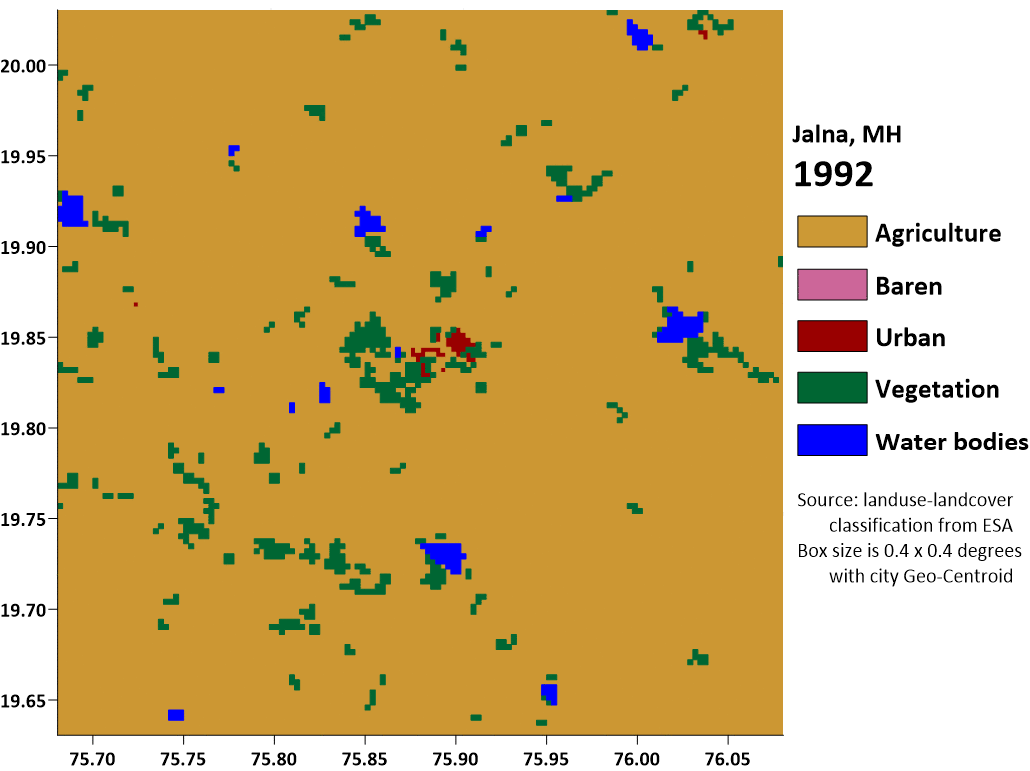
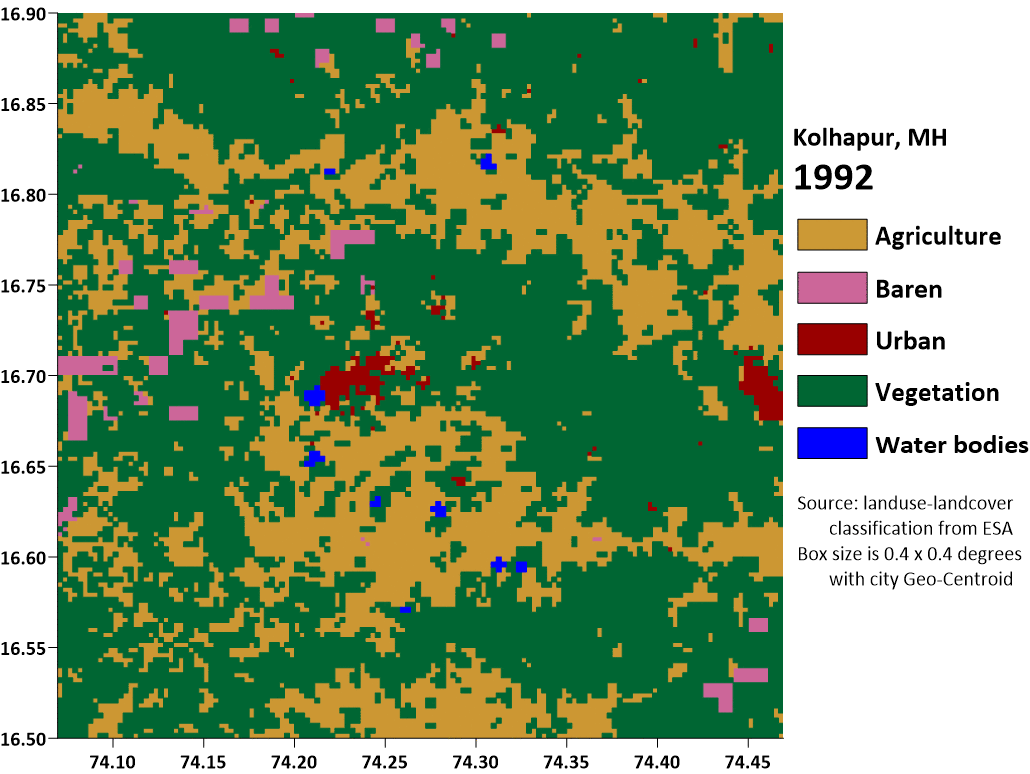
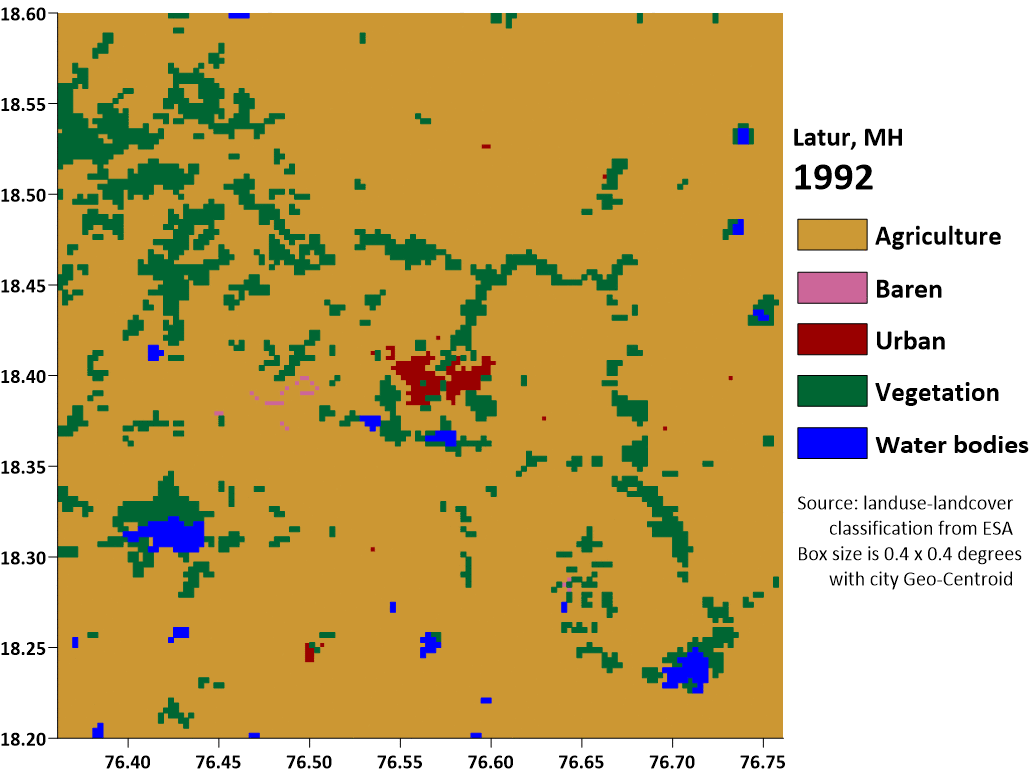
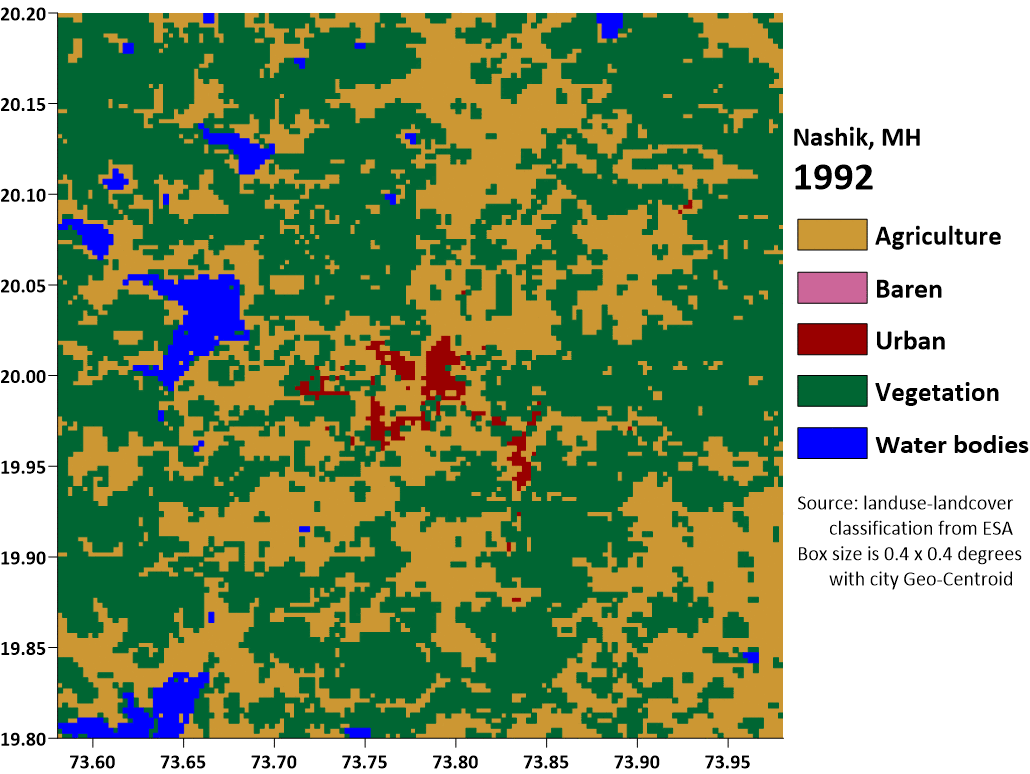
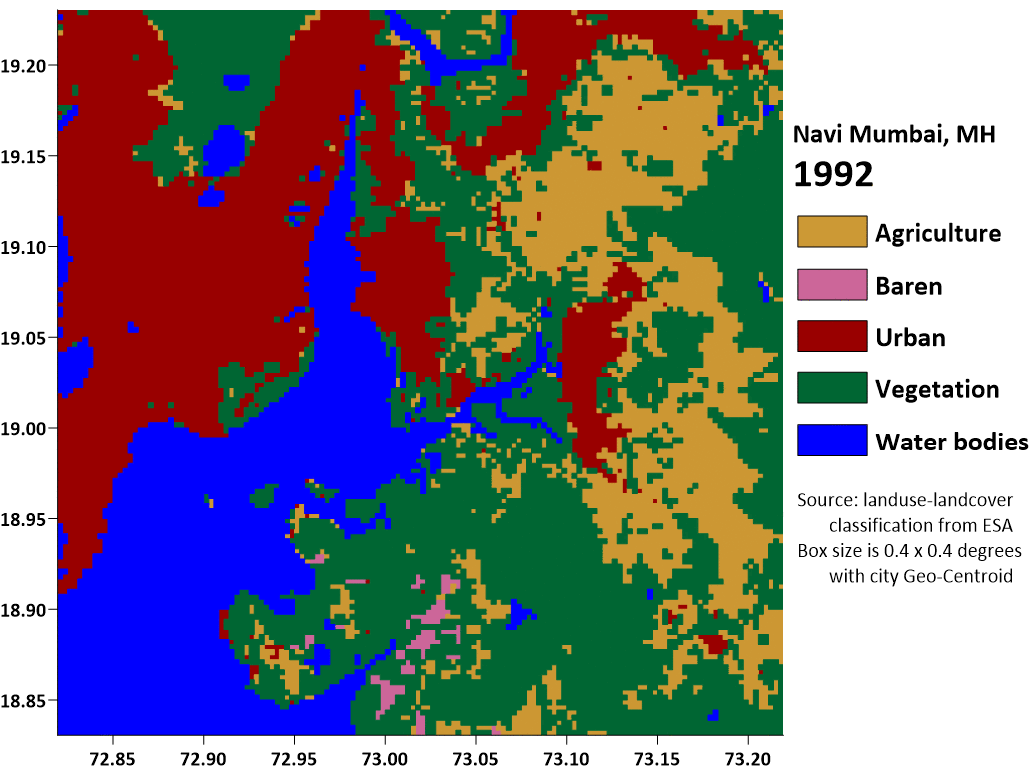
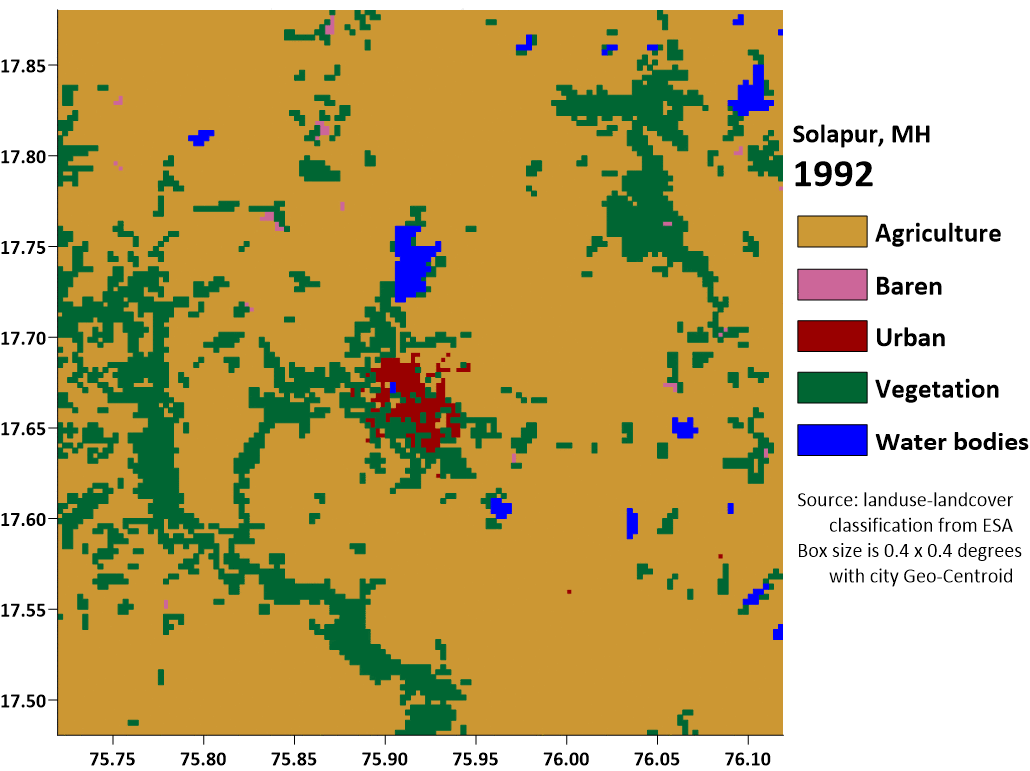
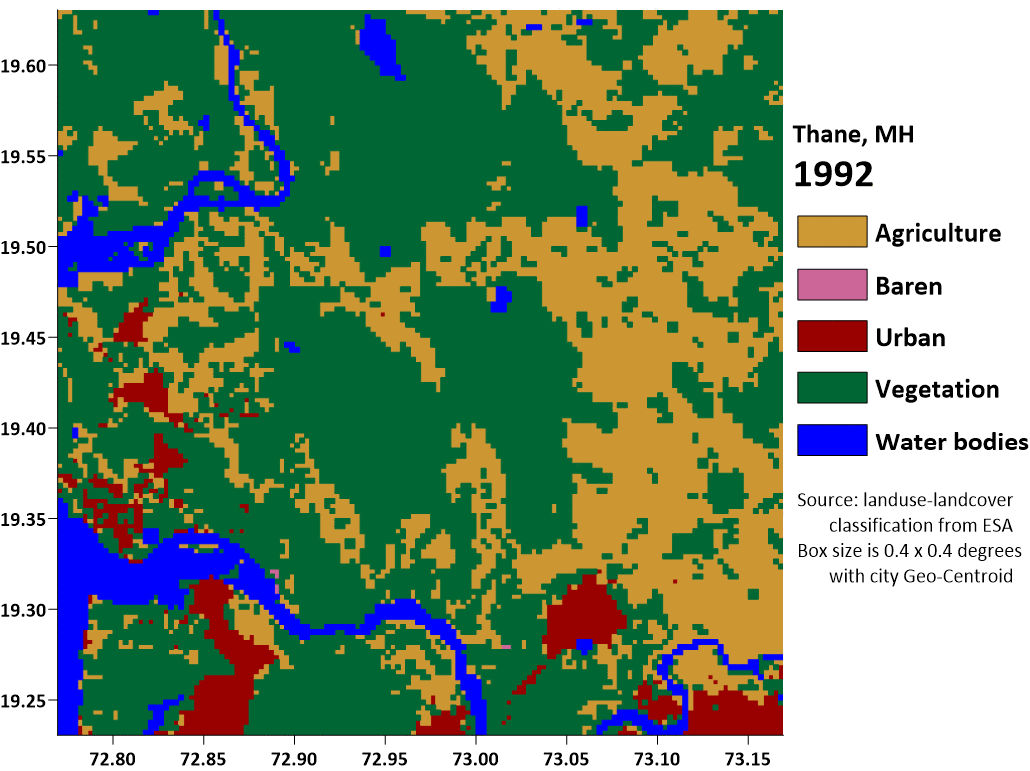
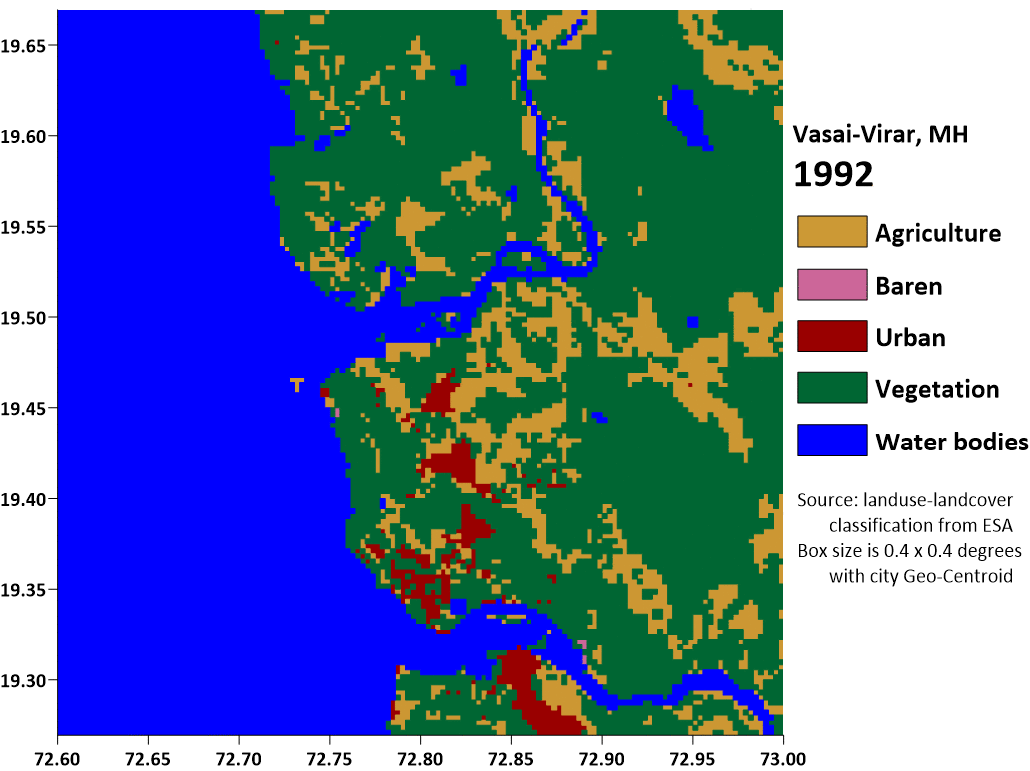
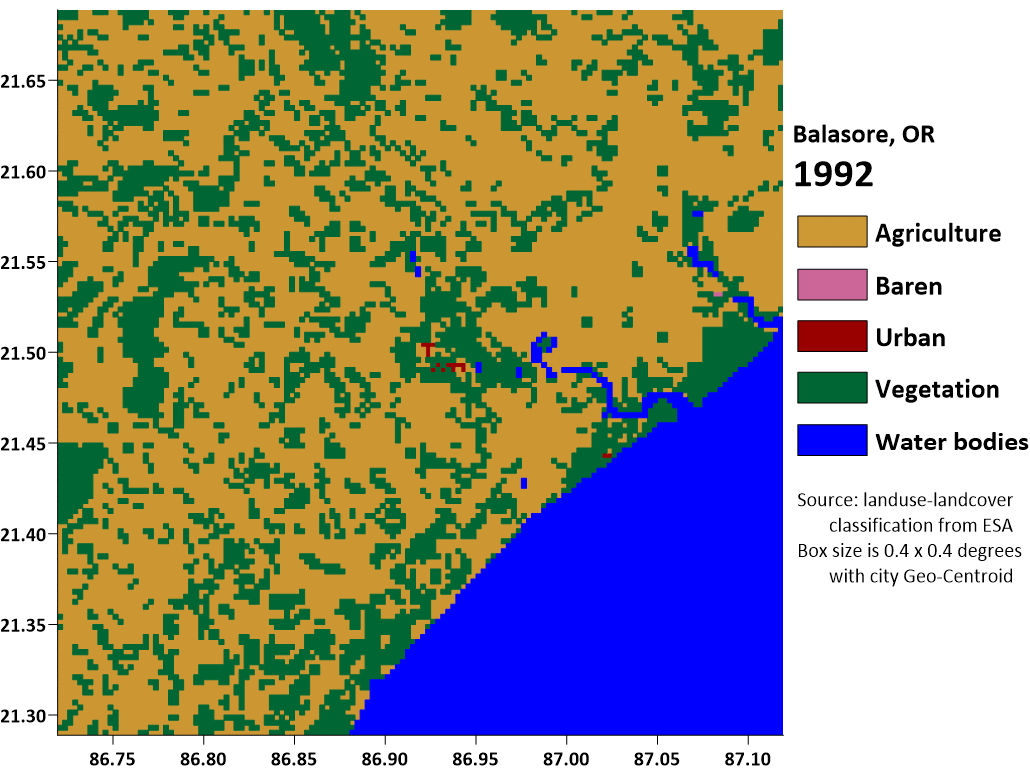
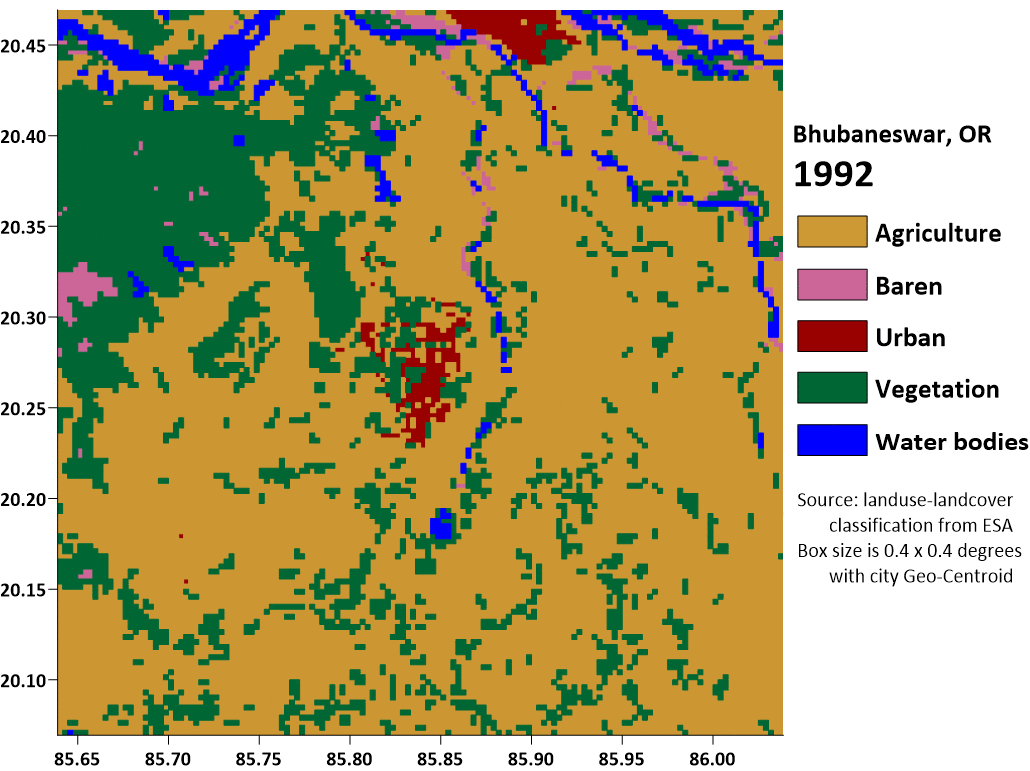
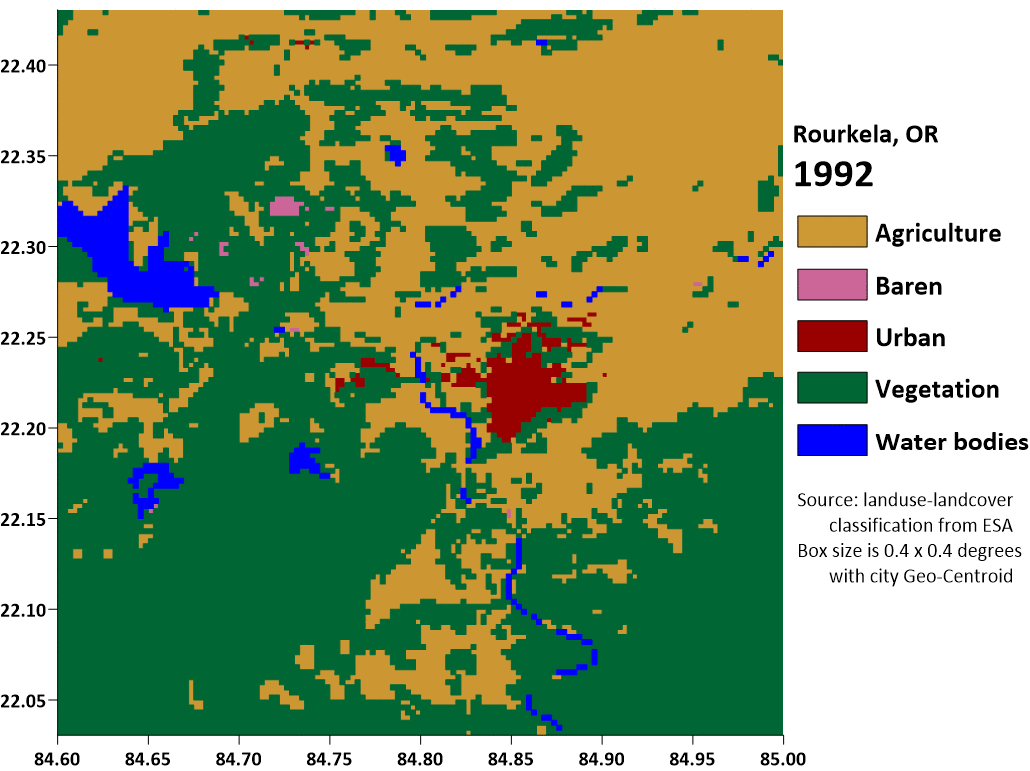
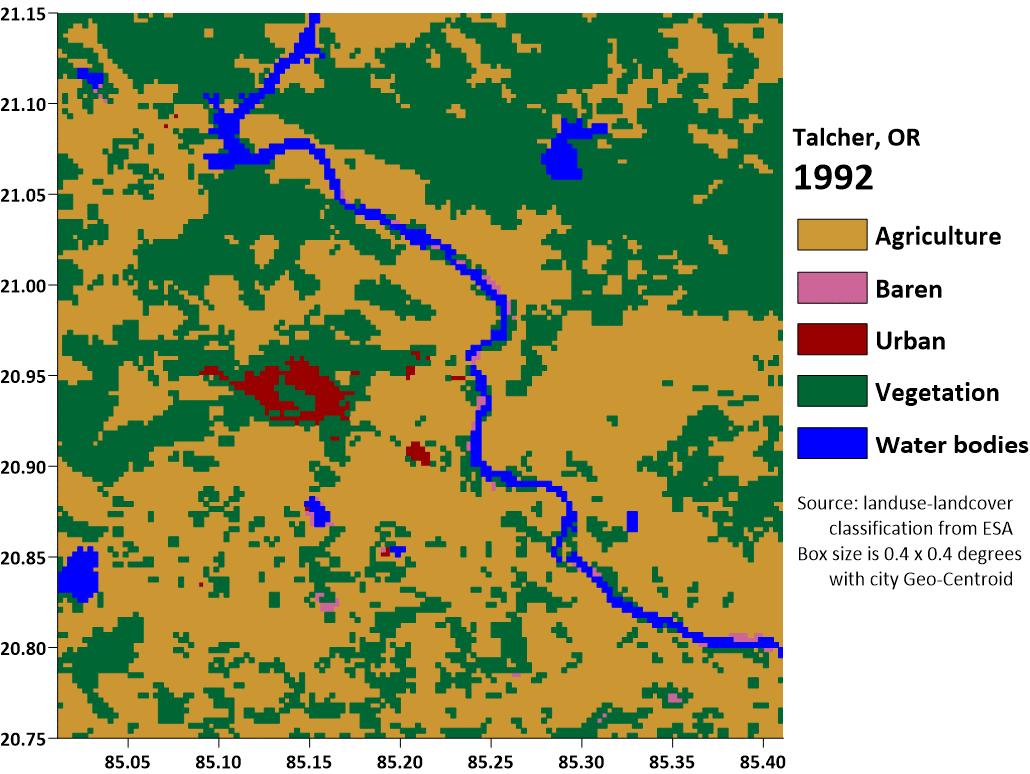
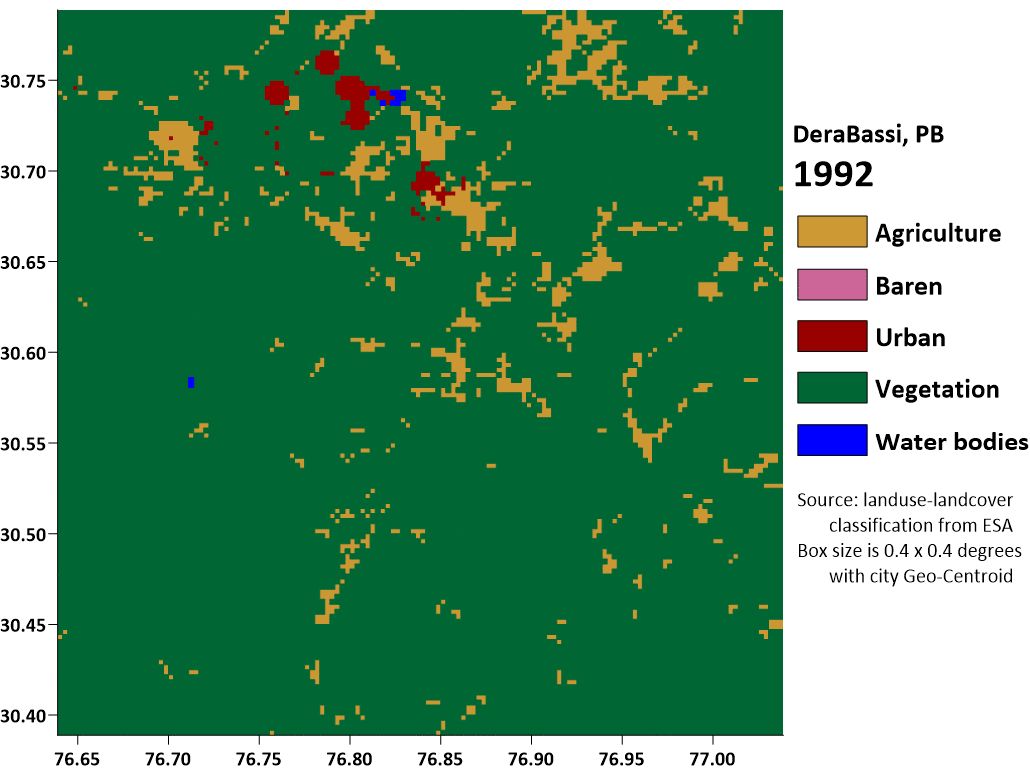
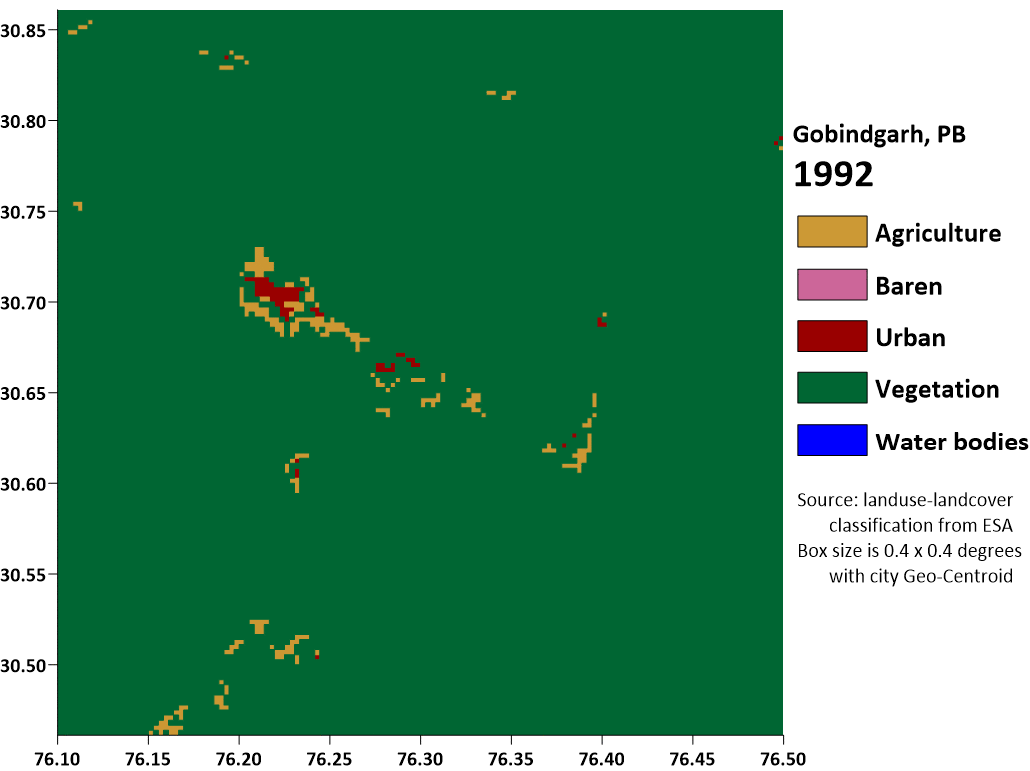
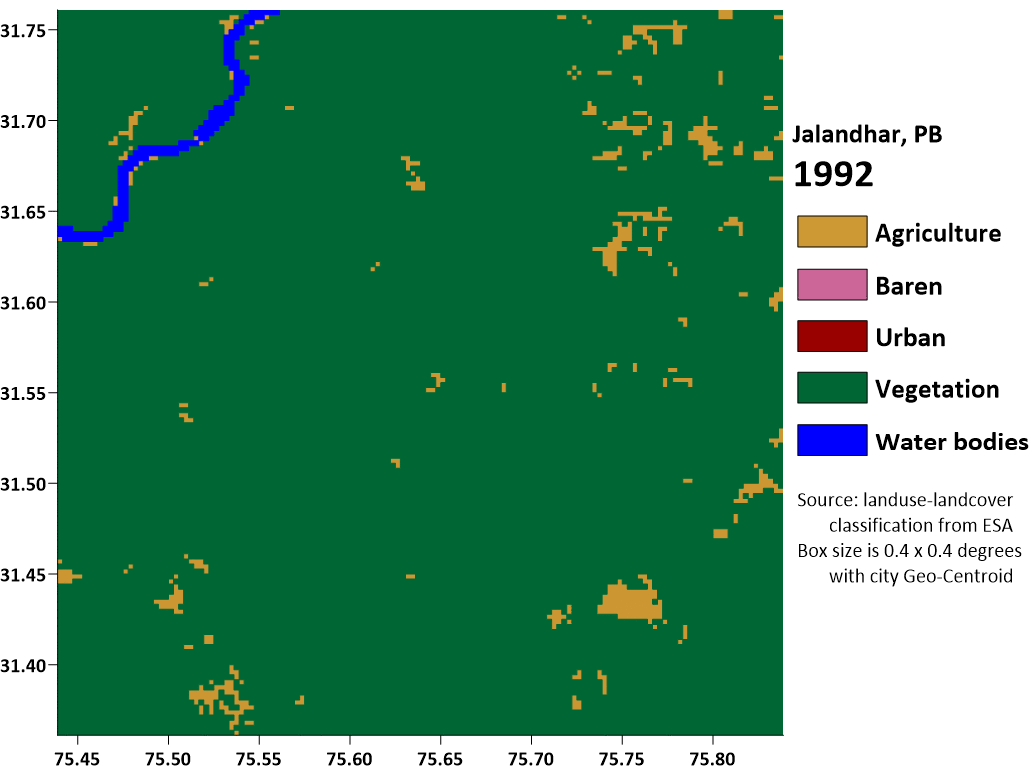
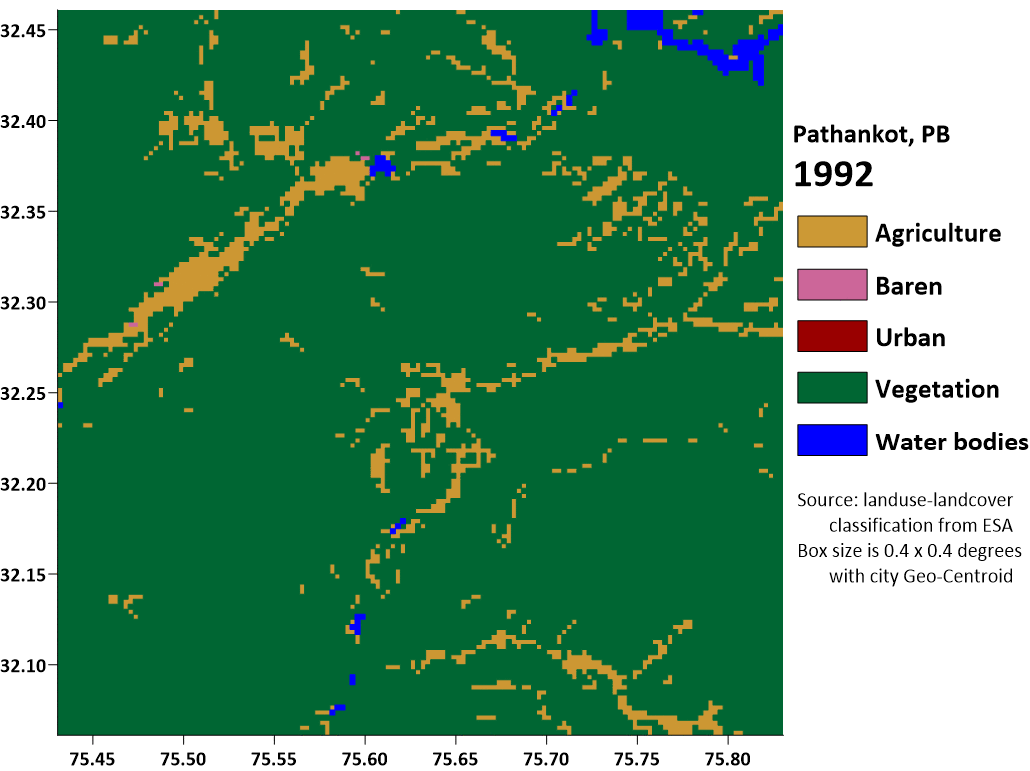
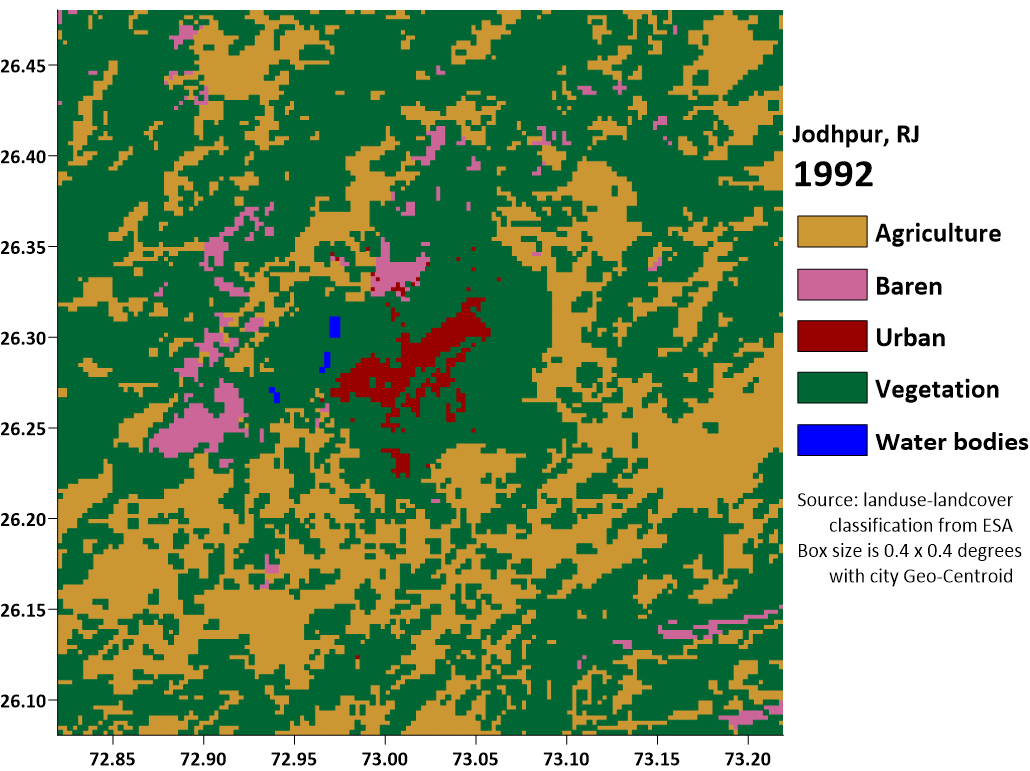
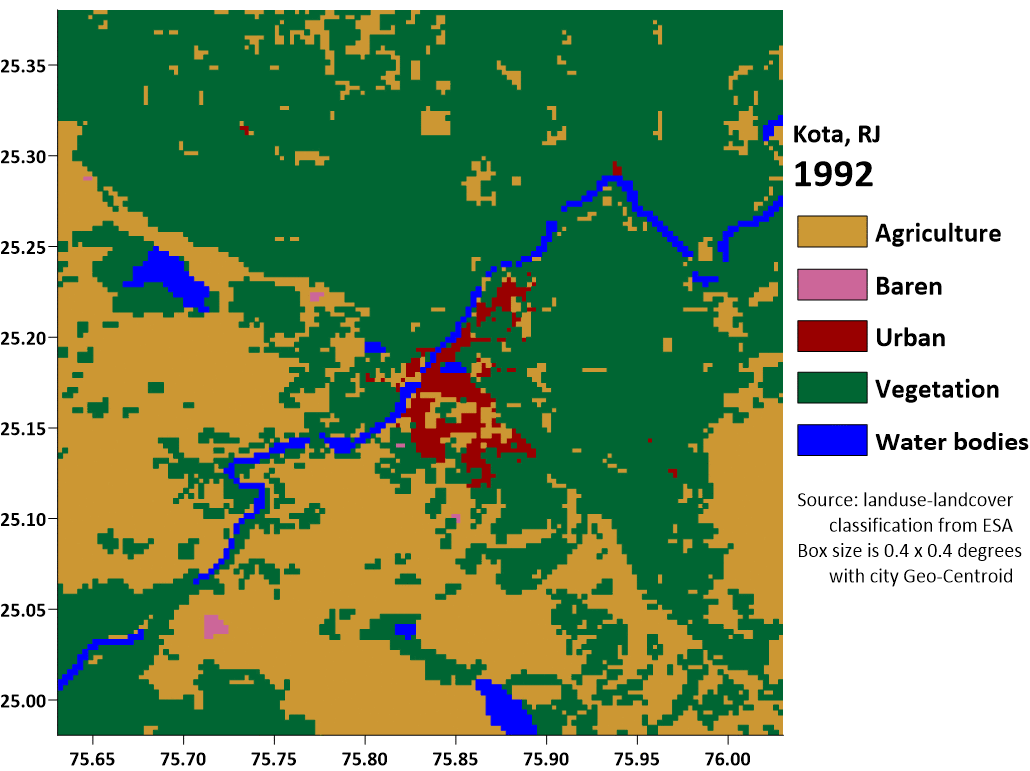
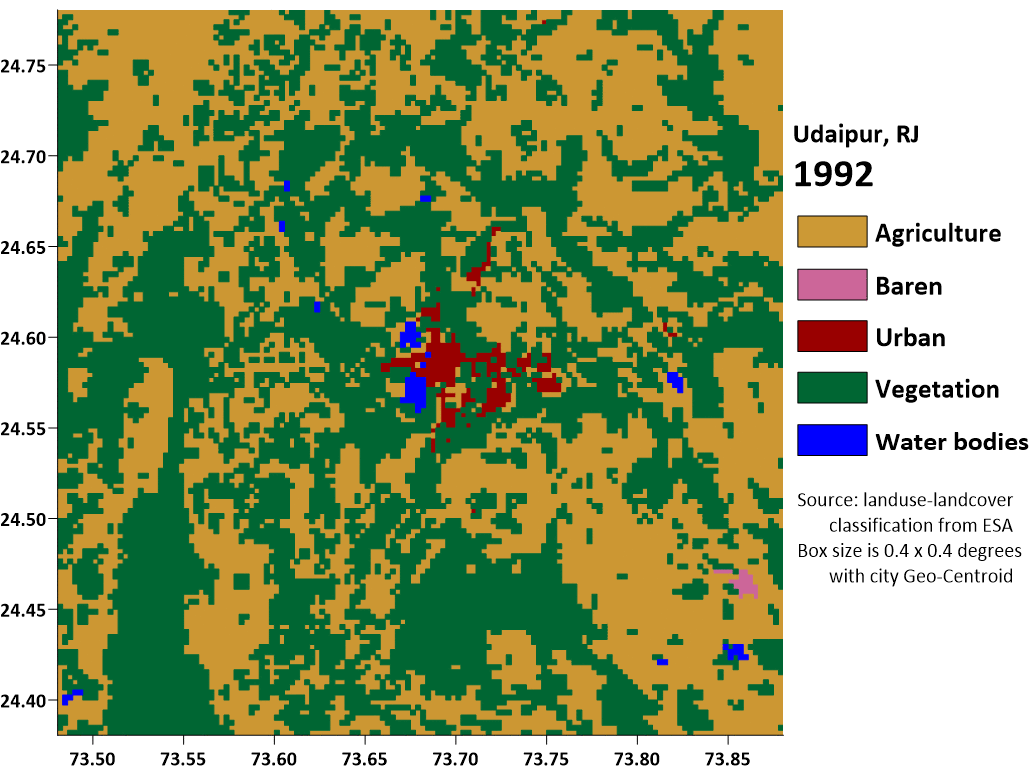
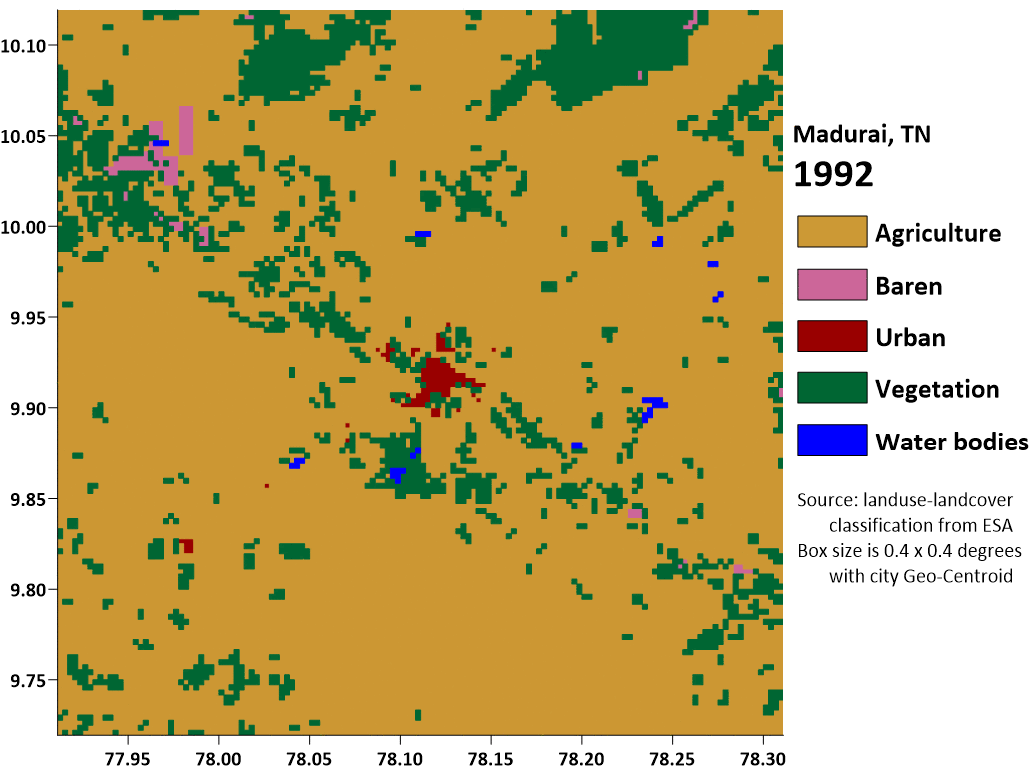
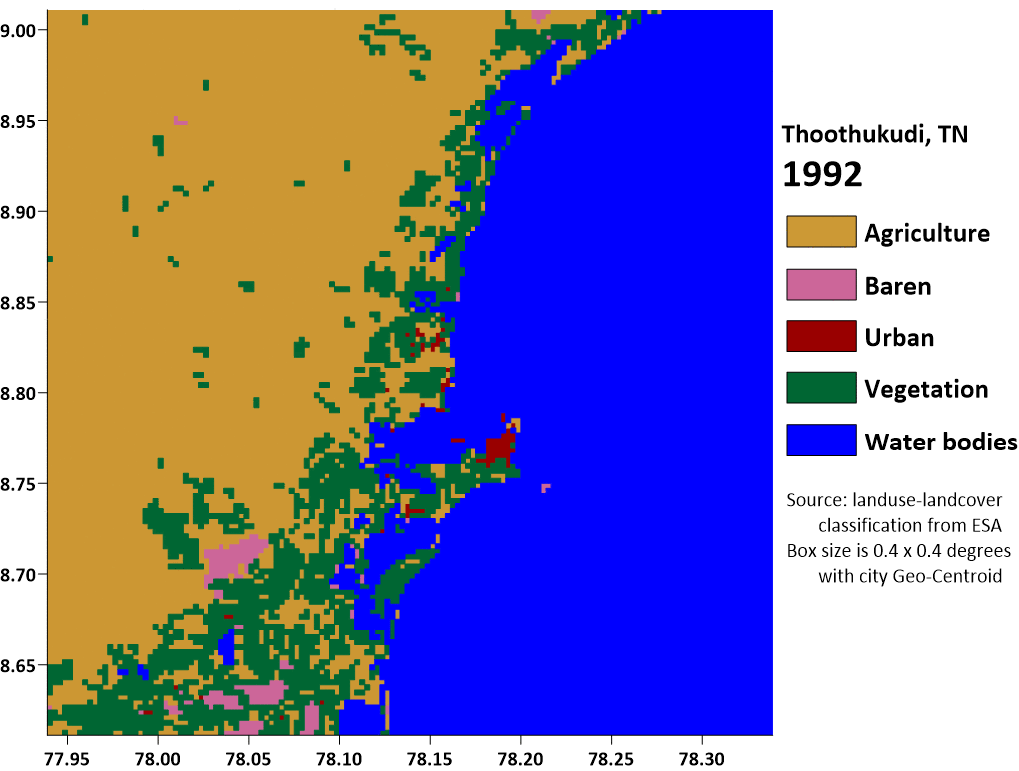
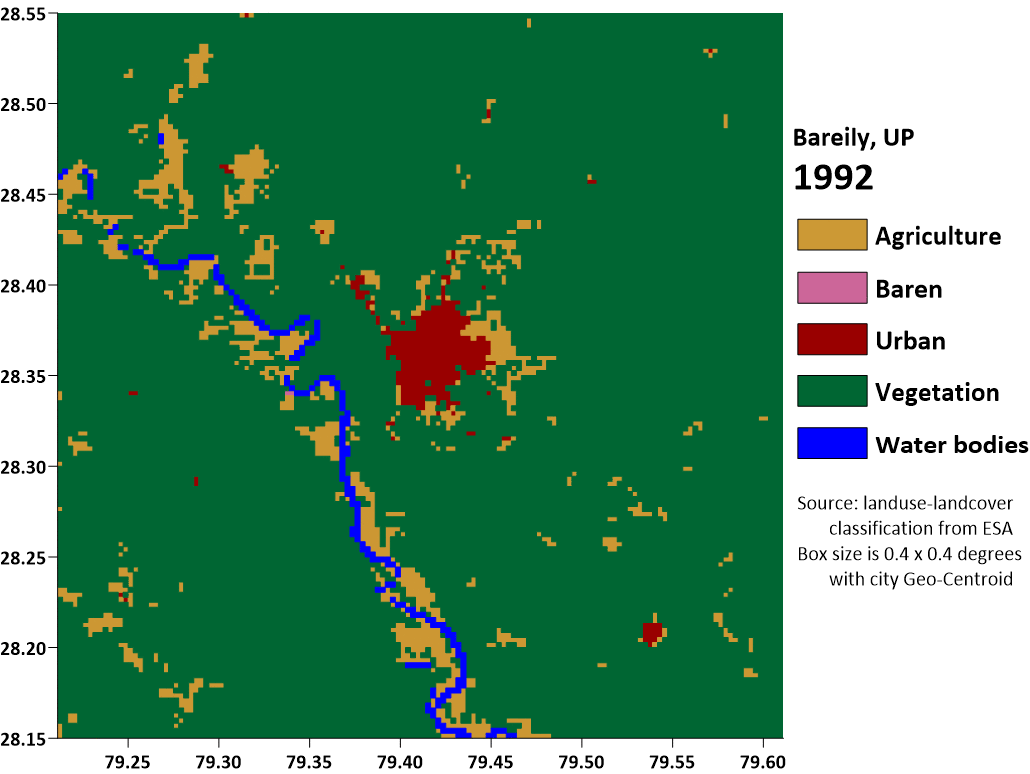
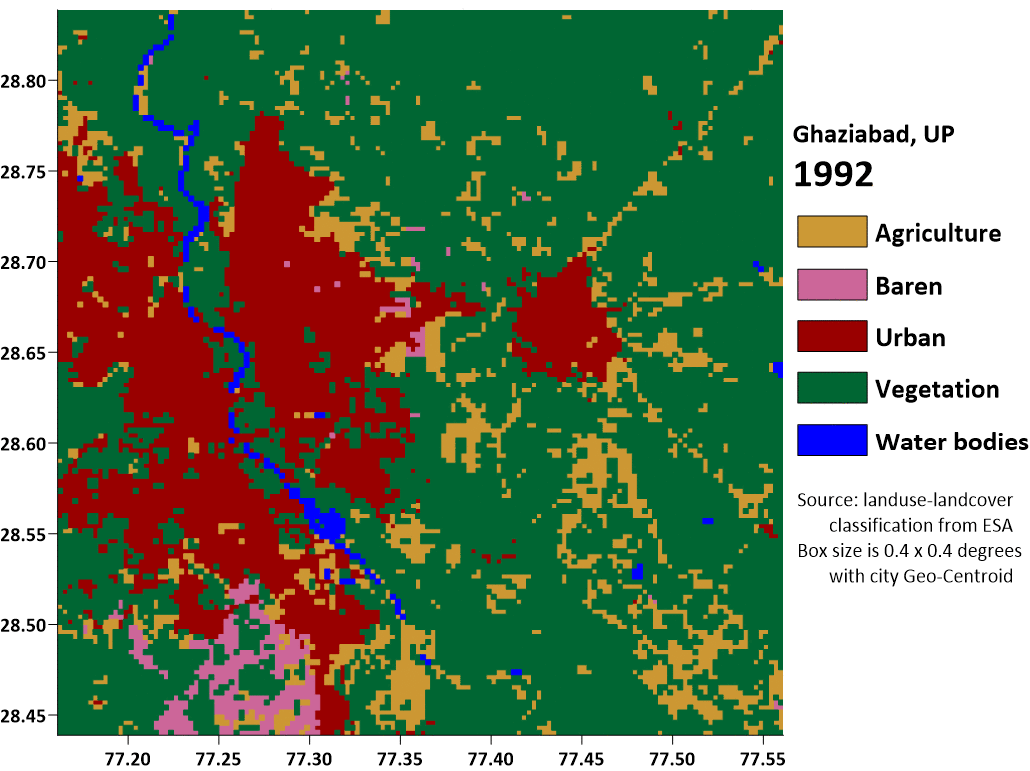
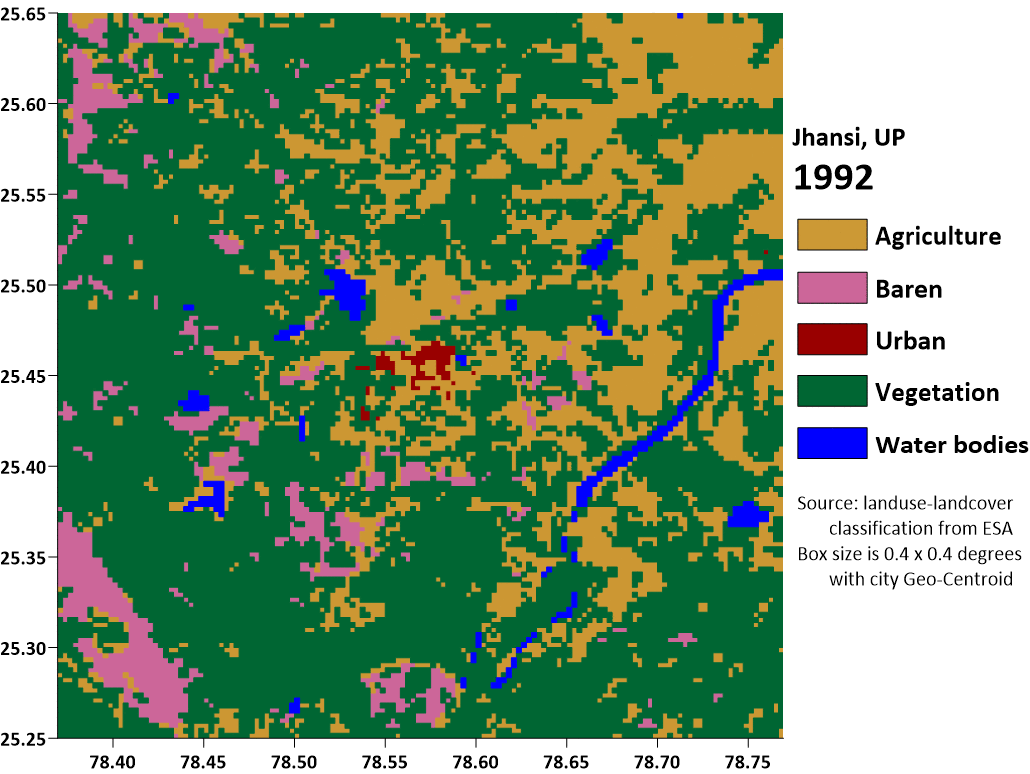
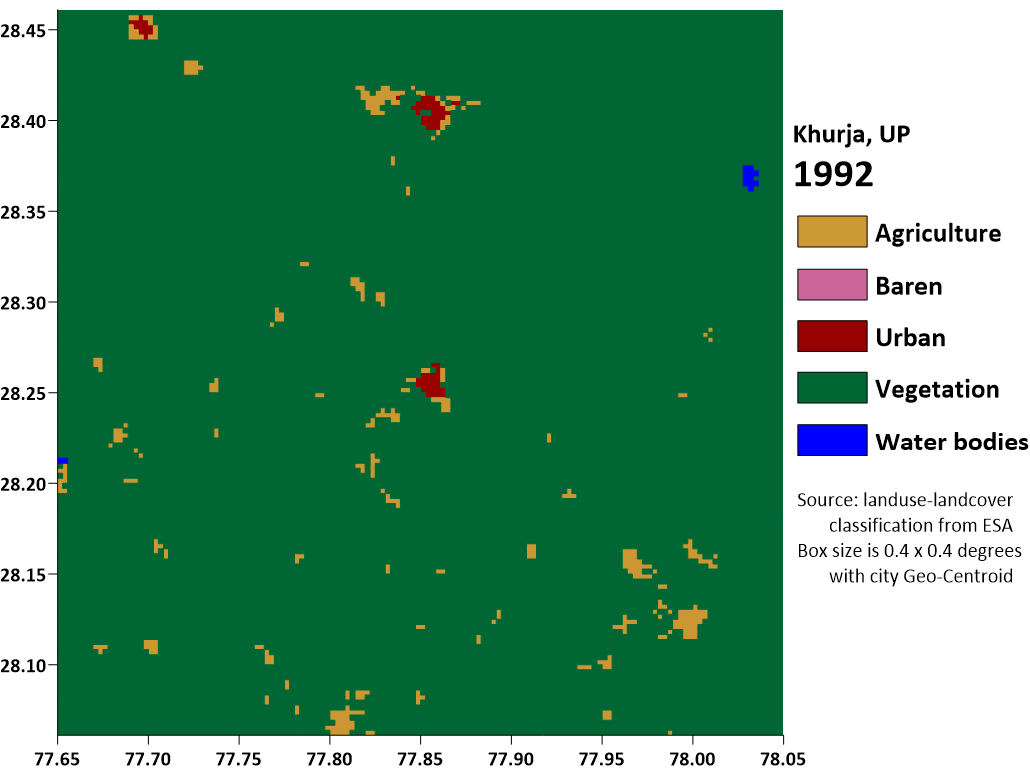
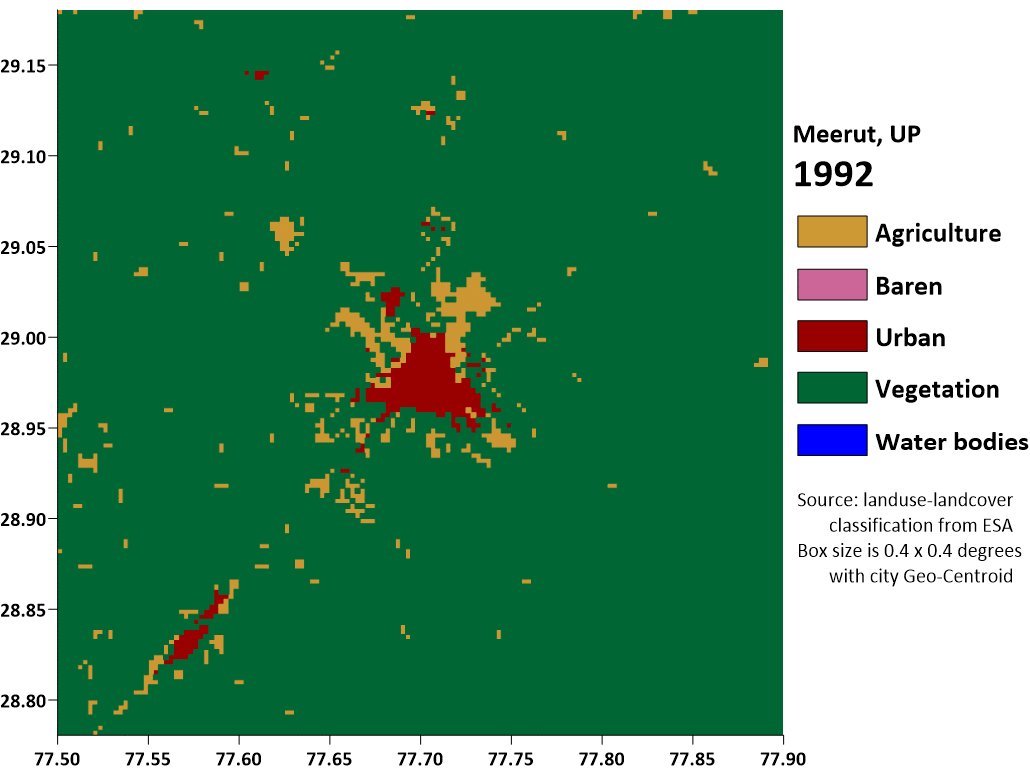
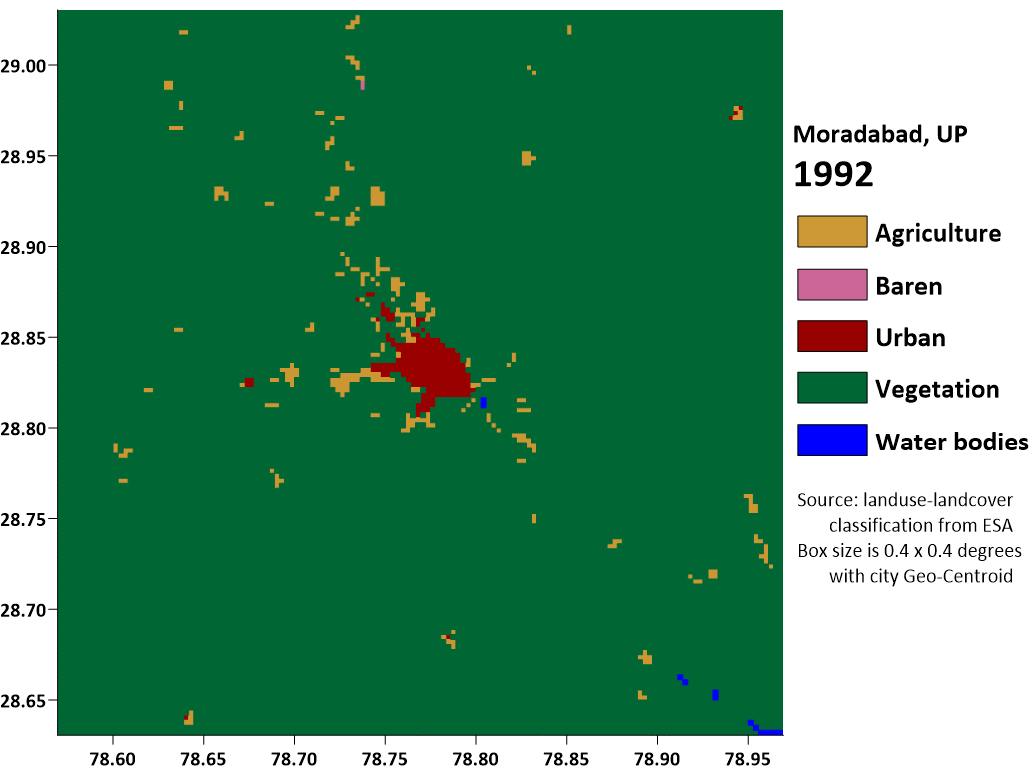
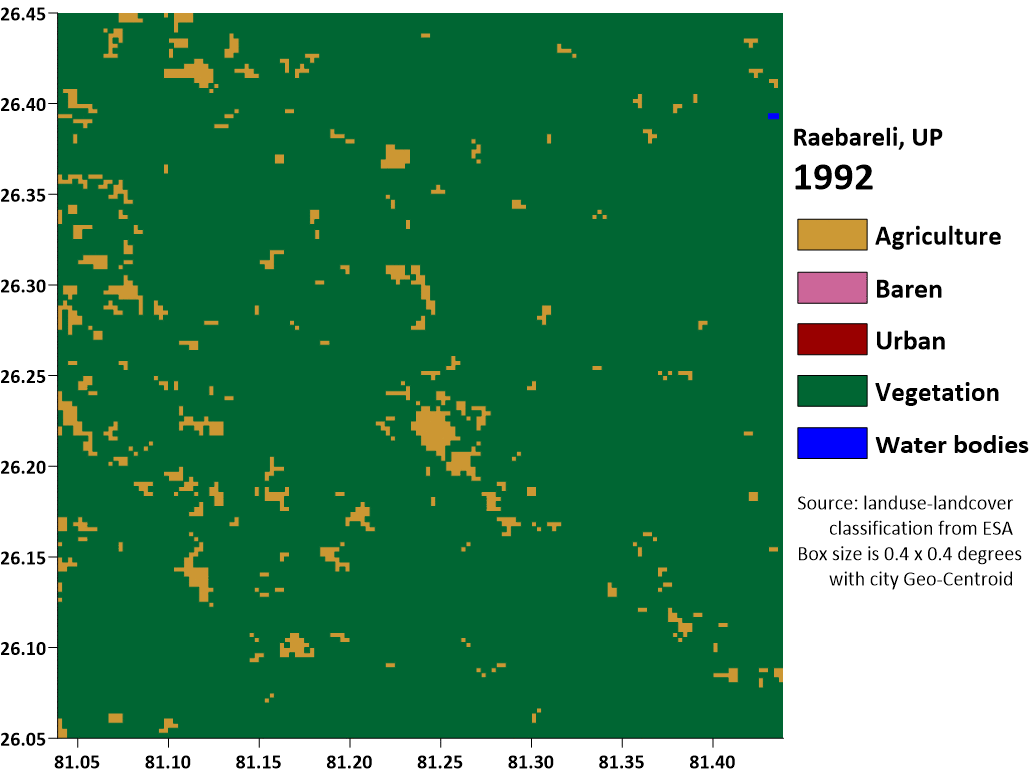
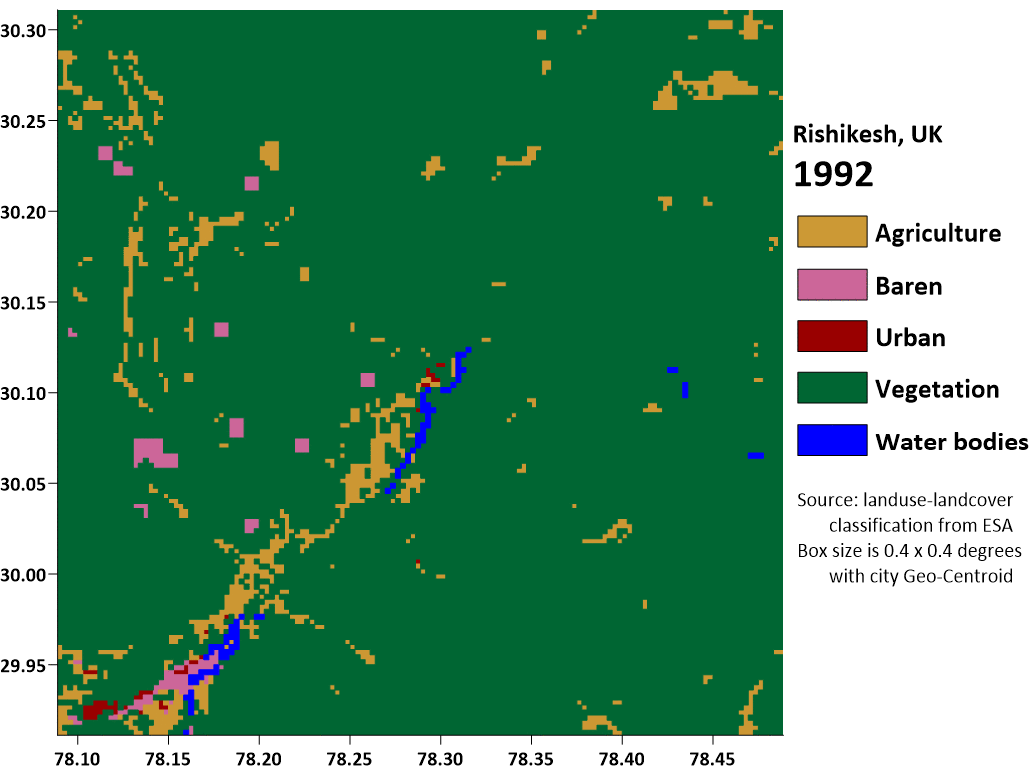
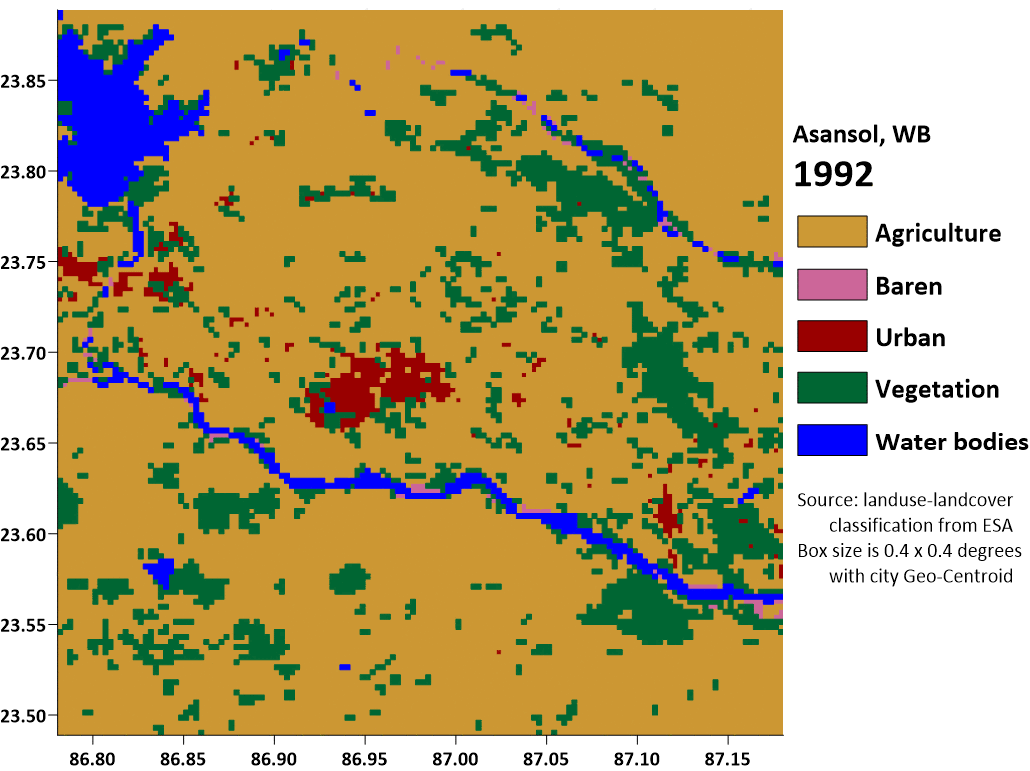
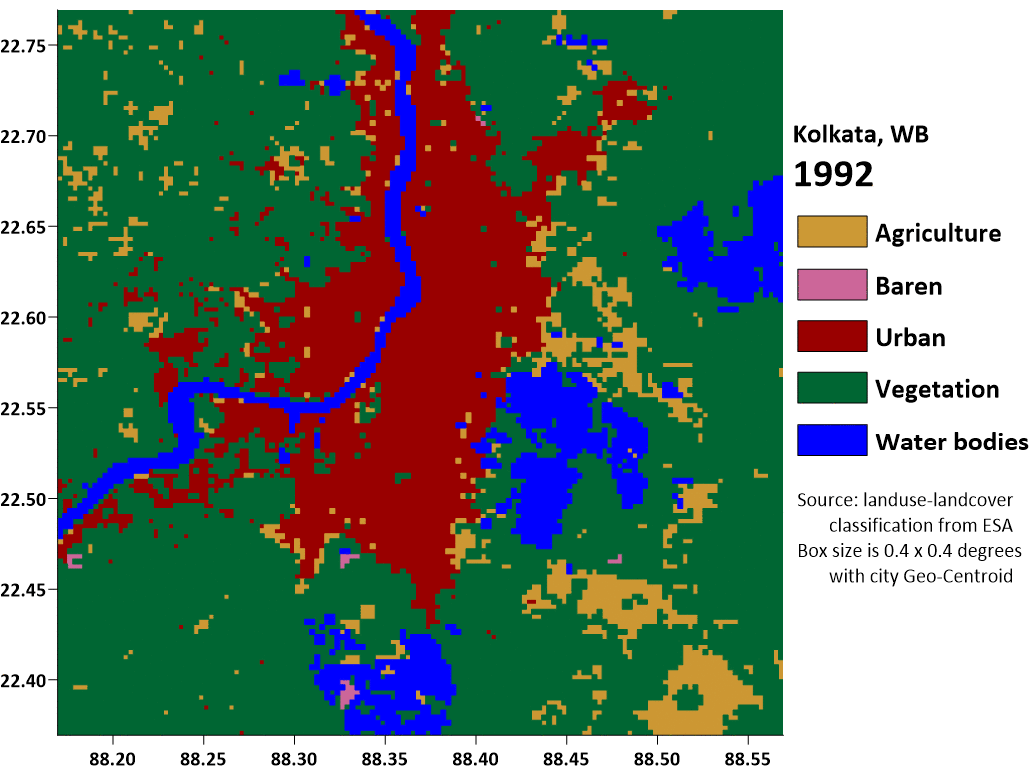
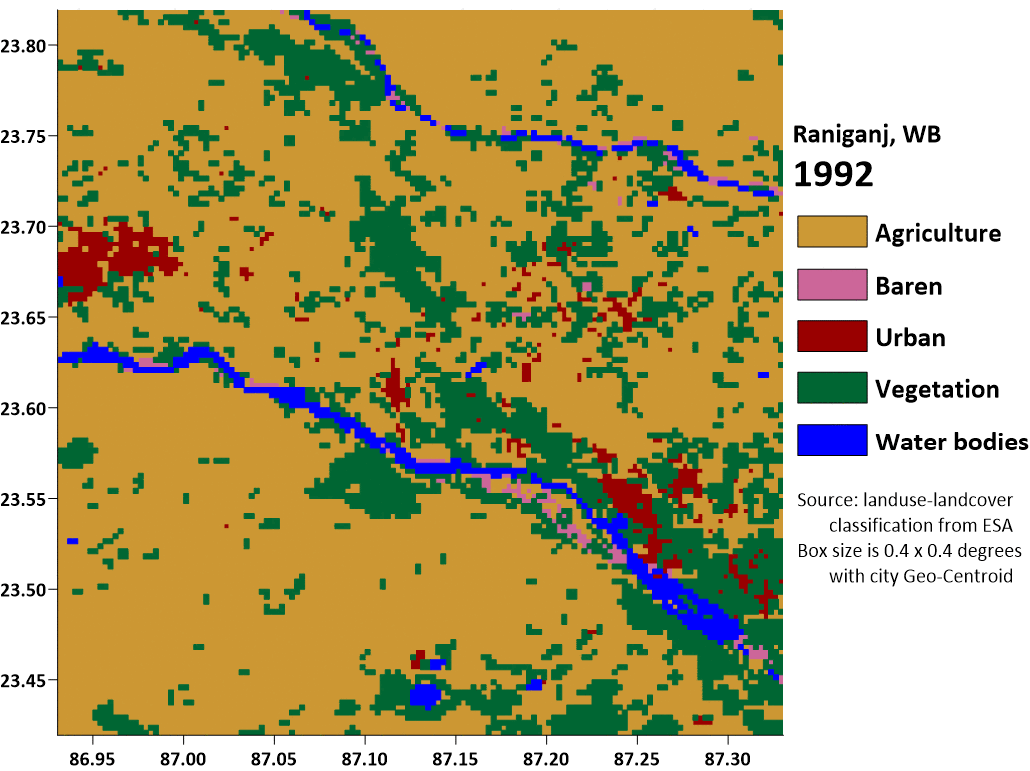
This repository presents a summary of landcover (LC) classification for Indian cities. The raw data is available from European Space Agency (ESA)’s Climate Change Initiative (CCI) program, which delivers a new time series of 24 consistent classification maps at 300 m spatial resolution on an annual basis for 1992-2020. In the animations (below) for Ahmedabad, Delhi, Durgapur, and Bengaluru, 24 classes were clubbed into 5 categories for simplification. Global database can be viewed here and downloaded here.
For all the cities under NCAP, data is extracted for a box of 0.4 x 0.4 degrees (~40km x 40km) with the city’s GIS centroid in the middle, to demonstrate the change in the major landcover classifications. This data acts as a proxy for (a) the rate of urbanization (b) the growing demand for construction material and (c) the growing demand for commercial and residential amenities.
 |
 |
 |
 |
The table below presents landcover animation of 1992-2020 for 132 non-attainment cities. To view the animation, click on the link and to save the animation, right click and save.
| S.No. | State | City | GIF Animations | GIS Shapefiles |
|---|---|---|---|---|
| 1 | Andhra Pradesh | Anantapur | GIF anime | Shapefiles |
| 2 | Andhra Pradesh | Chitoor | GIF anime | Shapefiles |
| 3 | Andhra Pradesh | Eluru | GIF anime | Shapefiles |
| 4 | Andhra Pradesh | Guntur | GIF anime | Shapefiles |
| 5 | Andhra Pradesh | Kadapa | GIF anime | Shapefiles |
| 6 | Andhra Pradesh | Kurnool | GIF anime | Shapefiles |
| 7 | Andhra Pradesh | Nellore | GIF anime | Shapefiles |
| 8 | Andhra Pradesh | Ongole | GIF anime | Shapefiles |
| 9 | Andhra Pradesh | Rajahmundry | GIF anime | Shapefiles |
| 10 | Andhra Pradesh | Srikakulam | GIF anime | Shapefiles |
| 11 | Andhra Pradesh | Vijayawada | GIF anime | Shapefiles |
| 12 | Andhra Pradesh | Vishakhapatnam | GIF anime | Shapefiles |
| 13 | Andhra Pradesh | Vizianagaram | GIF anime | Shapefiles |
| 14 | Assam | Guwahati | GIF anime | Shapefiles |
| 15 | Assam | Nagaon | GIF anime | Shapefiles |
| 16 | Assam | Nalbari | GIF anime | Shapefiles |
| 17 | Assam | Sibsagar | GIF anime | Shapefiles |
| 18 | Assam | Silchar | GIF anime | Shapefiles |
| 19 | Bihar | Gaya | GIF anime | Shapefiles |
| 20 | Bihar | Muzaffarpur | GIF anime | Shapefiles |
| 21 | Bihar | Patna | GIF anime | Shapefiles |
| 22 | Chandigarh | Chandigarh | GIF anime | Shapefiles |
| 23 | Chhattisgarh | Bhilai | GIF anime | Shapefiles |
| 24 | Chhattisgarh | Korba | GIF anime | Shapefiles |
| 25 | Chhattisgarh | Raipur | GIF anime | Shapefiles |
| 26 | Delhi | Delhi | GIF anime | Shapefiles |
| 27 | Gujarat | Ahmedabad | GIF anime | Shapefiles |
| 28 | Gujarat | Rajkot | GIF anime | Shapefiles |
| 29 | Gujarat | Surat | GIF anime | Shapefiles |
| 30 | Gujarat | Vadodara | GIF anime | Shapefiles |
| 31 | Haryana | Faridabad | GIF anime | Shapefiles |
| 32 | Himachal Pradesh | Baddi | GIF anime | Shapefiles |
| 33 | Himachal Pradesh | Damtal | GIF anime | Shapefiles |
| 34 | Himachal Pradesh | KalaAmb | GIF anime | Shapefiles |
| 35 | Himachal Pradesh | Nalagarh | GIF anime | Shapefiles |
| 36 | Himachal Pradesh | Paonta Sahib | GIF anime | Shapefiles |
| 37 | Himachal Pradesh | Parwanoo | GIF anime | Shapefiles |
| 38 | Himachal Pradesh | SunderNagar | GIF anime | Shapefiles |
| 39 | Jammu | Jammu | GIF anime | Shapefiles |
| 40 | Jammu | Srinagar | GIF anime | Shapefiles |
| 41 | Jharkhand | Dhanbad | GIF anime | Shapefiles |
| 42 | Jharkhand | Jamshedpur | GIF anime | Shapefiles |
| 43 | Jharkhand | Ranchi | GIF anime | Shapefiles |
| 44 | Karnataka | Bangalore | GIF anime | Shapefiles |
| 45 | Karnataka | Devanagere | GIF anime | Shapefiles |
| 46 | Karnataka | Gulburga | GIF anime | Shapefiles |
| 47 | Karnataka | Hubli-Dharwad | GIF anime | Shapefiles |
| 48 | Madhya Pradesh | Bhopal | GIF anime | Shapefiles |
| 49 | Madhya Pradesh | Dewas | GIF anime | Shapefiles |
| 50 | Madhya Pradesh | Gwalior | GIF anime | Shapefiles |
| 51 | Madhya Pradesh | Indore | GIF anime | Shapefiles |
| 52 | Madhya Pradesh | Jabalpur | GIF anime | Shapefiles |
| 53 | Madhya Pradesh | Sagar | GIF anime | Shapefiles |
| 54 | Madhya Pradesh | Ujjain | GIF anime | Shapefiles |
| 55 | Maharashtra | Akola | GIF anime | Shapefiles |
| 56 | Maharashtra | Amravati | GIF anime | Shapefiles |
| 57 | Maharashtra | Aurangabad | GIF anime | Shapefiles |
| 58 | Maharashtra | Badlapur | GIF anime | Shapefiles |
| 59 | Maharashtra | Chandrapur | GIF anime | Shapefiles |
| 60 | Maharashtra | Jalgaon | GIF anime | Shapefiles |
| 61 | Maharashtra | Jalna | GIF anime | Shapefiles |
| 62 | Maharashtra | Kolhapur | GIF anime | Shapefiles |
| 63 | Maharashtra | Latur | GIF anime | Shapefiles |
| 64 | Maharashtra | Mumbai | GIF anime | Shapefiles |
| 65 | Maharashtra | Nagpur | GIF anime | Shapefiles |
| 66 | Maharashtra | Nashik | GIF anime | Shapefiles |
| 67 | Maharashtra | Navi Mumbai | GIF anime | Shapefiles |
| 68 | Maharashtra | Pune | GIF anime | Shapefiles |
| 69 | Maharashtra | Sangli | GIF anime | Shapefiles |
| 70 | Maharashtra | Solapur | GIF anime | Shapefiles |
| 71 | Maharashtra | Thane | GIF anime | Shapefiles |
| 72 | Maharashtra | Ulhasnagar | GIF anime | Shapefiles |
| 73 | Maharashtra | Vasai Virar | GIF anime | Shapefiles |
| 74 | Meghalaya | Byrnihat | GIF anime | Shapefiles |
| 75 | Nagaland | Dimapur | GIF anime | Shapefiles |
| 76 | Nagaland | Kohima | GIF anime | Shapefiles |
| 77 | Orissa | Angul | GIF anime | Shapefiles |
| 78 | Orissa | Balasore | GIF anime | Shapefiles |
| 79 | Orissa | Bhubaneswar | GIF anime | Shapefiles |
| 80 | Orissa | Cuttack | GIF anime | Shapefiles |
| 81 | Orissa | Kalinga Nagar | GIF anime | Shapefiles |
| 82 | Orissa | Rourkela | GIF anime | Shapefiles |
| 83 | Orissa | Talcher | GIF anime | Shapefiles |
| 84 | Punjab | Amritsar | GIF anime | Shapefiles |
| 85 | Punjab | DeraBassi | GIF anime | Shapefiles |
| 86 | Punjab | Gobindgarh | GIF anime | Shapefiles |
| 87 | Punjab | Jalandhar | GIF anime | Shapefiles |
| 88 | Punjab | Khanna | GIF anime | Shapefiles |
| 89 | Punjab | Ludhiana | GIF anime | Shapefiles |
| 90 | Punjab | Naya Nangal | GIF anime | Shapefiles |
| 91 | Punjab | Pathankot | GIF anime | Shapefiles |
| 92 | Punjab | Patiala | GIF anime | Shapefiles |
| 93 | Rajasthan | Alwar | GIF anime | Shapefiles |
| 94 | Rajasthan | Jaipur | GIF anime | Shapefiles |
| 95 | Rajasthan | Jodhpur | GIF anime | Shapefiles |
| 96 | Rajasthan | Kota | GIF anime | Shapefiles |
| 97 | Rajasthan | Udaipur | GIF anime | Shapefiles |
| 98 | Tamilnadu | Chennai | GIF anime | Shapefiles |
| 99 | Tamilnadu | Madurai | GIF anime | Shapefiles |
| 100 | Tamilnadu | Thoothukudi | GIF anime | Shapefiles |
| 101 | Tamilnadu | Trichy | GIF anime | Shapefiles |
| 102 | Telangana | Hyderabad | GIF anime | Shapefiles |
| 103 | Telangana | Nalgonda | GIF anime | Shapefiles |
| 104 | Telangana | Patancheruvu | GIF anime | Shapefiles |
| 105 | Telangana | Sangareddy | GIF anime | Shapefiles |
| 106 | Uttar Pradesh | Agra | GIF anime | Shapefiles |
| 107 | Uttar Pradesh | Allahabad | GIF anime | Shapefiles |
| 108 | Uttar Pradesh | Anpara | GIF anime | Shapefiles |
| 109 | Uttar Pradesh | Bareily | GIF anime | Shapefiles |
| 110 | Uttar Pradesh | Firozabad | GIF anime | Shapefiles |
| 111 | Uttar Pradesh | Gajraula | GIF anime | Shapefiles |
| 112 | Uttar Pradesh | Ghaziabad | GIF anime | Shapefiles |
| 113 | Uttar Pradesh | Gorakhpur | GIF anime | Shapefiles |
| 114 | Uttar Pradesh | Jhansi | GIF anime | Shapefiles |
| 115 | Uttar Pradesh | Kanpur | GIF anime | Shapefiles |
| 116 | Uttar Pradesh | Khurja | GIF anime | Shapefiles |
| 117 | Uttar Pradesh | Lucknow | GIF anime | Shapefiles |
| 118 | Uttar Pradesh | Meerut | GIF anime | Shapefiles |
| 119 | Uttar Pradesh | Moradabad | GIF anime | Shapefiles |
| 120 | Uttar Pradesh | Noida | GIF anime | Shapefiles |
| 121 | Uttar Pradesh | Raebareli | GIF anime | Shapefiles |
| 122 | Uttar Pradesh | Varanasi | GIF anime | Shapefiles |
| 123 | Uttarakhand | Dehradun | GIF anime | Shapefiles |
| 124 | Uttarakhand | Kashipur | GIF anime | Shapefiles |
| 125 | Uttarakhand | Rishikesh | GIF anime | Shapefiles |
| 126 | West Bengal | Asansol | GIF anime | Shapefiles |
| 127 | West Bengal | Barrackpore | GIF anime | Shapefiles |
| 128 | West Bengal | Durgapur | GIF anime | Shapefiles |
| 129 | West Bengal | Haldia | GIF anime | Shapefiles |
| 130 | West Bengal | Howrah | GIF anime | Shapefiles |
| 131 | West Bengal | Kolkata | GIF anime | Shapefiles |
| 132 | West Bengal | Raniganj | GIF anime | Shapefiles |