 Click on the image or here to download the full document.
[Citation: https://dx.doi.org/10.2139/ssrn.5005495]
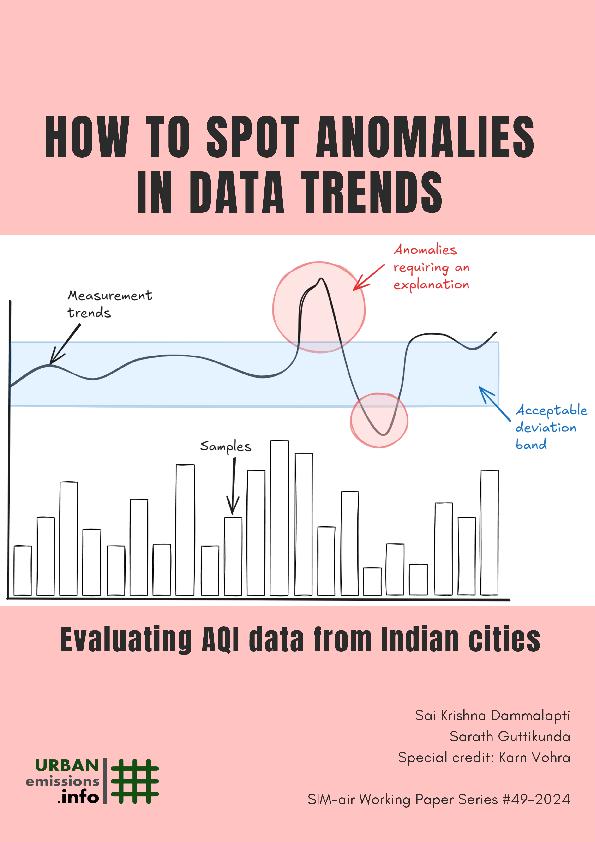
SIM-air No. 61-2025: How to spot anomalies in data trends: Evaluating AQI data from Indian cities
Sometimes, there is a suspicion that air quality numbers are misreported, or an instrument is misbehaving or one of the many instruments in a cluster is out of order. This can be because of technical reasons (monitoring instrument malfunctioning or operational error), statistical reasons (selection bias of monitoring locations), or political reasons (selection bias on data openness).
Is it possible to detect anomalies (deviations) in the data patterns from average air quality values or from an instrument on a day-to-day basis or from a cluster of instruments operating in an area?
Typically, data analysis among the air quality monitoring community studying the patterns, identify the deviations and flag the extreme unknowns, after the field experiments are completed or after a certain volume of data is collected. If the identification can be conducted in advance or in real-time, these deviations can be used to flag instances for scrutiny, and help provide better explanations (later in the presentations or when writing articles).
In this working paper, we are presenting a 2-step method to identify anomalies in data trends – Benford’s law with Euclidian distance and two sample Kolmogorov-Smirnov (K-S) test with non-overlapping area. The methods are applied over India’s daily average air quality index (AQI) dataset for years 2018 to 2023.
Researchers have leveraged Benford’s law in identifying anomalies. Relevant to this study, one such application was for the quality of official air quality numbers reported in Beijing, China [1] [2]. Other applications include an instance flagging likely misreporting in the fields of accounting, economics, and with CO2 emissions data. According to Benford’s law, also called First Digit Law, the distribution of the leading digit of any naturally occurring data is a logarithmic distribution. Deviation from this are flagged as anomalies. The goal of these investigative methods is only to identify the unexplainable statistical deviations and seek justification, if there are any. The methods do not answer the question of why the deviations occurred.
In India, cities with denser and consistent networks of monitors deviated less from Benford’s law. Deviation only means that additional information is necessary to explain the change in the city’s data patterns. In Indian cities, we suspect “small sample sizes” and “heterogeneity among the locations” as the main reason to explain the deviations.
The methods can be extended to other sectors. For example, electricity generation and transmission rates to flag the surges in supply and demand. A year-on-year comparison can reveal the changes in consumption patterns. Similar inferences can be made on data from fuel sales at a fuel station or fuel sales in a city – is the consumption distribution reflecting the push for electric vehicles.
The methodologies employed in this study are documented under publications. These methodologies explainers are included in our primers, presentations, plug and play tools, benchmarking notes, instructional videos and more, openly available @ https://urbanemissions.info/tools.
Our working papers describe case studies where we applied the SIM-air family of tools, document general notes on emissions and pollution modeling and present our reviews on various topics related to air pollution analysis.