 Jaipur is the capital of the state of Rajasthan with an urban population of about 4.0 million. It is located 260 km from New Delhi and forms a part of a popular tourist circuit along with Agra (240 km). Jaipur also serves as a gateway to other tourist destinations in Rajasthan such as Jodhpur (348 km), Jaisalmer (571 km), Udaipur (421 km) and Mount Abu (520 km). The Jaipur Municipal Corporation is responsible for maintaining the city’s civic infrastructure and carrying out associated administrative duties. The Jaipur Development Authority (JDA) is the nodal government agency responsible for the planning and development of Jaipur. In addition to its role as the provincial capital, educational, and administrative center, the economy of Jaipur is fueled by tourism, gemstone cutting, the manufacture of jewellery and luxury textiles, and information technology. During winter months, flights towards New Delhi airport are often diverted to Jaipur airport under foggy conditions.
Center for Science and Environment (CSE) released a citizens survey and study of air pollution in Jaipur in 2012. The perception among citizens that air pollution has increased is validated by data that shows that the levels of PM10 were almost 3 times the prescribed standard. The increase in private vehicular traffic is responsible for much of this according to the report. Jaipur has about 18 lakh vehicles and adds nearly 400 vehicles a day to its existing fleet. Vehicles are growing at a rate of about 10 per cent per annum with cars increasing at a faster rate than two-wheelers. A point of note is that Jaipur has 551 vehicles per 1,000 people compared to Delhi at 332 vehicles. Another telling statistic that illustrates the level of traffic congestion in Jaipur is that 60 percent of the cities roads are used for parking – the highest in any city in India.
To assess Jaipur’s air quality, we selected 40km x 40km domain. This domain is further segregated into 1km grids, to study the spatial variations in the emission and the pollution loads.
Monitoring
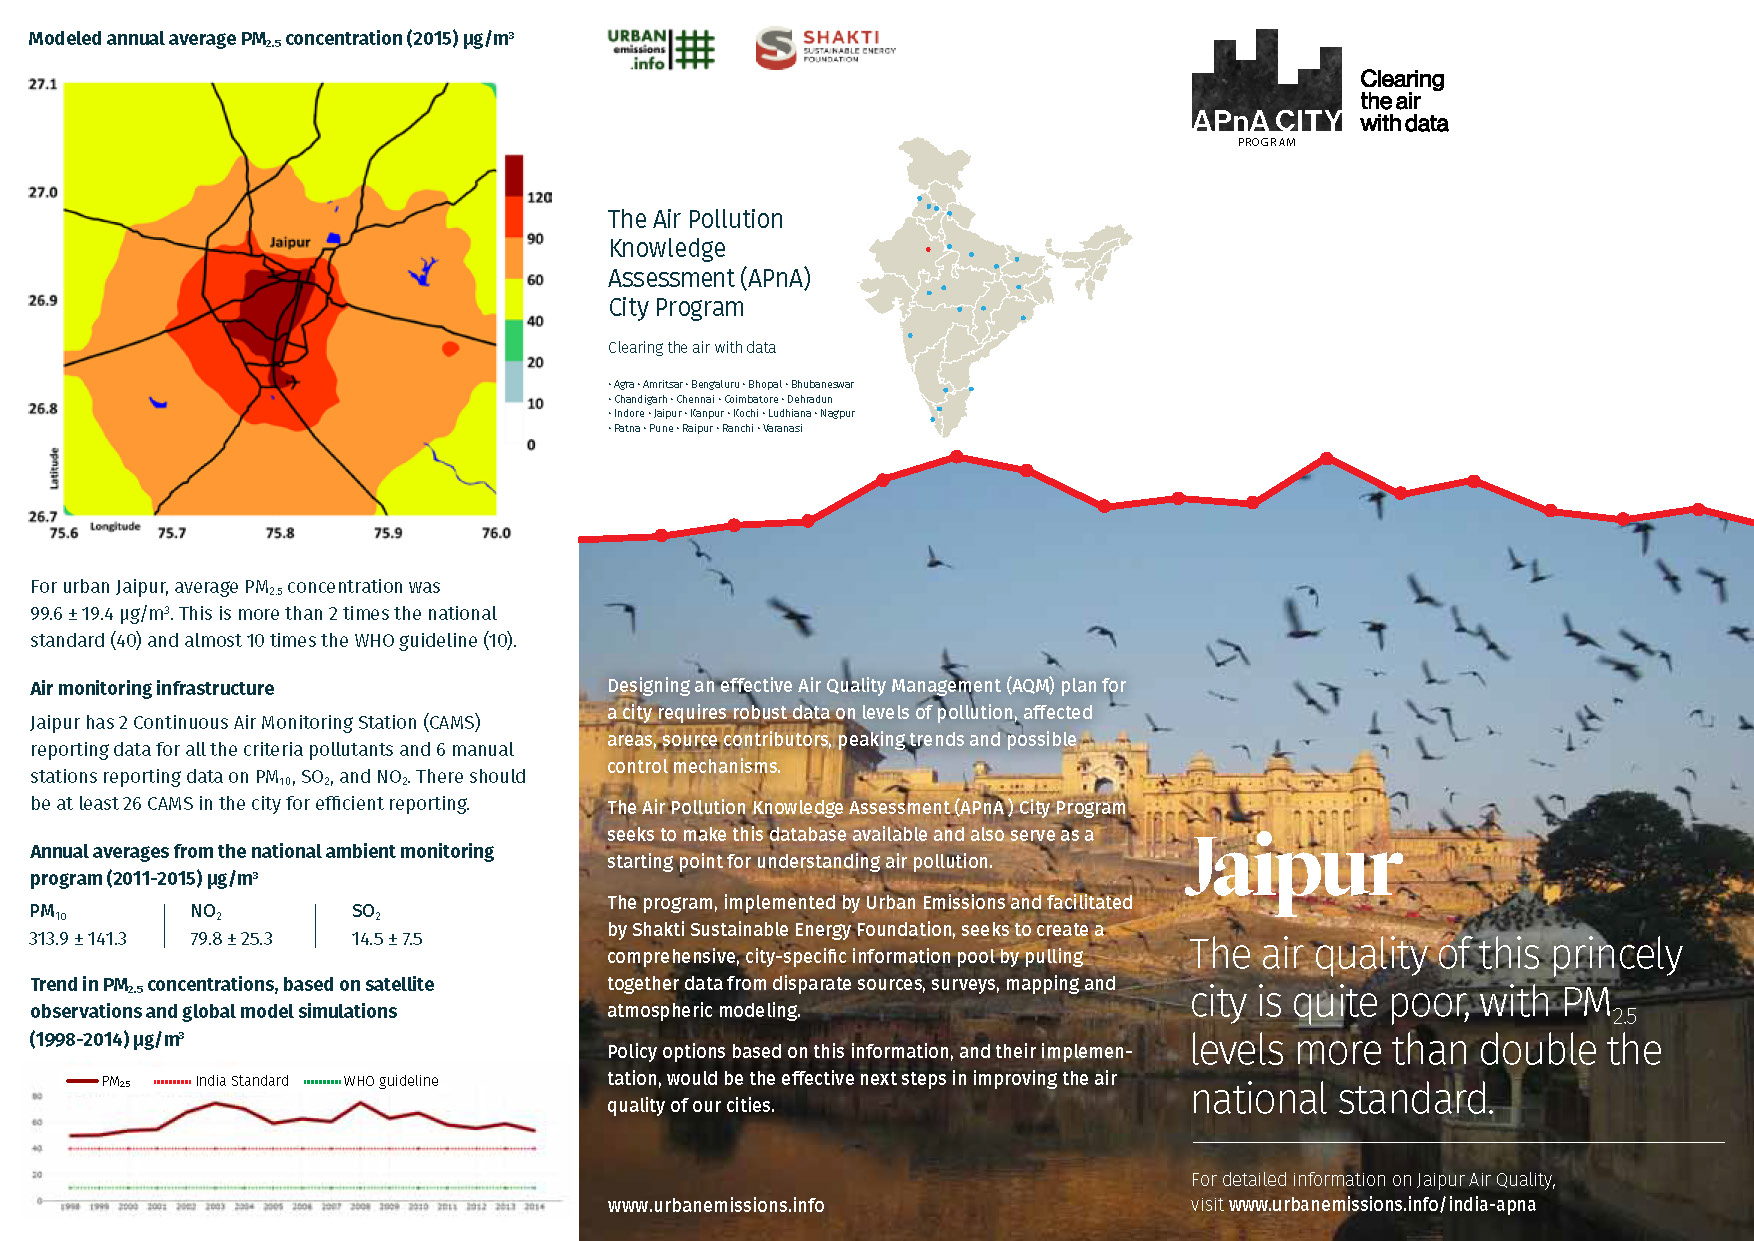
We present below a summary of the ambient monitoring data available under the National Ambient Monitoring Program (NAMP), operated and maintained by the Central Pollution Control Board (CPCB, New Delhi, India). In Jaipur, there are 2 continuous air monitoring stations (CAMS) reporting data for all the criteria pollutants and 6 manual stations reporting data on PM10, SO2, and NO2.
Satellite Data Derived Surface PM2.5 Concentrations:
The results of satellite data derived concentrations are useful for evaluating annual trends in pollution levels and are not a proxy for on-ground monitoring networks. This data is estimated using satellite feeds and global chemical transport models. Satellites are not measuring one location all the time, instead, a combination of satellites provide a cache of measurements that are interpreted using global chemical transport models (GEOS-Chem) to represent the vertical mix of pollution and estimate ground-based concentrations with the help of previous ground-based measurements. The global transport models rely on gridded emission estimates for multiple sectors to establish a relationship with satellite observations over multiple years. These databases were also used to study the global burden of disease, which estimated air pollution as the top 10 causes of premature mortality and morbidity in India. A summary of PM2.5 concentrations from this exercise, for the city of Jaipur is presented below. The global PM2.5 files are available for download and further analysis @ Dalhousie University.
Emissions
We compiled an emissions inventory for the jaipur region for the following pollutants – sulfur dioxide (SO2), nitrogen oxides (NOx), carbon monoxide (CO), non-methane volatile organic compounds (NMVOCs), carbon dioxide (CO2); and particulate matter (PM) in four bins (a) coarse PM with size fraction between 2.5 and 10 μm (b) fine PM with size fraction less than 2.5 μm (c) black carbon (BC) and (d) organic carbon (OC), for year 2015 and projected to 2030.
We customized the SIM-air family of tools to fit the base information collated from the central pollution control board, state pollution control board, census bureau, national sample survey office, ministry of road transport and highways, annual survey of industries, central electrical authority, ministry of heavy industries, municipal waste management, geographical information systems, meteorological department, and publications from academic and non-governmental institutions.
This emissions inventory is based on the available local activity and fuel consumption estimates for the selected urban airshed (presented in the grid above) and does not include natural emission sources (like dust storms, lightning) and seasonal open (agricultural and forest) fires; which can only be included in a regional scale simulation. These emission sources are accounted in the concentration calculation as an external (also known as boundary or long-range) contribution to the city’s air quality.
The emissions inventory was then spatially segregated at a 0.01° grid resolution in longitude and latitude (equivalent of 1 km) to create a spatial map of emissions for each pollutant (PM2.5, PM10, SO2, NOx, CO and VOCs). Below is the gridded PM2.5 emissions and the total (shares by sector) emissions.
Gridded PM2.5 Emissions (2015)

Total PM2.5 Emissions by Sector 2015-2030
 |
 |
 |
Total Estimated Emissions by Sector for 2015 (units – mil.tons/year for CO2 and tons/year for the rest)
| PM2.5 | PM10 | BC | OC | NOx | CO | VOC | SO2 | CO2 | |
|---|---|---|---|---|---|---|---|---|---|
| TRAN | 6,500 | 6,850 | 3,000 | 2,000 | 9,500 | 69,000 | 22,700 | 450 | 2.35 |
| RESI | 2,400 | 2,450 | 450 | 1,250 | 700 | 32,400 | 3,750 | 500 | 0.45 |
| INDU | 1,300 | 1,350 | 300 | 250 | 3,000 | 2,800 | 900 | 800 | 0.54 |
| DUST | 3,100 | 20,050 | - | - | - | - | - | - | - |
| WAST | 1,550 | 1,650 | 100 | 950 | 50 | 7,450 | 1,500 | 50 | 0.01 |
| DGST | 600 | 650 | 350 | 100 | 5,700 | 1,500 | 150 | 50 | 0.26 |
| BRIC | 1,750 | 1,800 | 500 | 700 | 1,450 | 24,450 | 2,550 | 800 | 0.19 |
| 17,200 | 34,800 | 4,700 | 5,250 | 20,400 | 137,600 | 31,550 | 2,650 | 3.79 |
TRAN = transport emissions from road, rail, aviation, and shipping (for coastal cities); RESI = residential emissions from cooking, heating, and lighting activities; INDU = industrial emissions from small, medium, and heavy industries (including power generation); DUST = dust emissions from road re-suspension and construction activities; WAST = open waste burning emissions; DGST = diesel generator set emissions; BRIC = brick kiln emissions (not included in the industrial emissions)
Meteorology
We processed the NCEP Reanalysis global meteorological fields from 2010 to 2016 through the 3D-WRF meteorological model. A summary of the data for year 2015, averaged for jaipur is presented below. Download the processed data which includes information on year, month, day, hour, precipitation (mm/hour), mixing height (m), temperature (C), wind speed (m/sec), and wind direction (degrees) – key parameters which determine the intensity of dispersion of emissions.
Dispersion Modeling
We calculated the ambient PM2.5 concentrations and the source contributions, using gridded emissions inventory, 3D meteorological data (from WRF), and the CAMx regional chemical transport model. The model simulates concentrations at 0.01° grid resolution and sector contributions, which include contributions from primary emissions, secondary sources via chemical reactions, and long range transport via boundary conditions (represented as “outside” in the pie graph below).
 |
 |
 |
Findings and Recommendations
- Modeled urban average ambient PM2.5 concentration is 99.6 ± 19.4 μg/m3 – is more than 2 times the national standard (40) and ~10 times the WHO guideline (10)
- The city requires at least 26 continuous air monitoring stations to statistically, spatially, and temporally, represent the mix of sources and range of pollution in the city (current status – 6 manual and 2 continuous)
- The modeled source contributions highlight transport (including on road dust), domestic cooking and heating, and open waste burning as the key air pollution sources in the urban areas
- The city has an estimated 30% of the ambient annual PM2.5 pollution (in 2015) originating outside the urban airshed, which strongly suggests that air pollution control policies in the Indo-Gangetic plain need a regional outlook
- The city needs to aggressively promote public and non-motorized transport as part of the city’s urban development plan, along with the improvement of the road infrastructure to reduce on-road dust re-suspension
- By 2030, the vehicle exhaust emissions are expected to remain constant, if and only if, Bharat 6 fuel standards are introduced nationally in 2020, as recommended by the Auto Fuel Policy
- By 2030, the share of emissions from residential cooking and lighting is expected to decrease with a greater share of LPG, residential electrification, and increasing urbanization. However, since the availability of biomass and coal in the region is high, a fair share of its use is expected to continue, unless an aggressive program is in place a 100% technology shift to cleaner options like LPG and electricity
- The 200 brick kilns in the urban airshed (and more through the state and the neighboring states), are fueled mostly by coal and agri-waste. These kilns can benefit from a technology upgrade from the current fixed chimney and clamp style baking to (for example) zig-zag, in order to improve their overall energy efficiency. Similarly, the coal-fired power plants need to practice and enforce stricter environmental standards for all the criteria pollutants
- Open waste burning is dispersed across the city and requires stricter regulations for addressing the issue, as the city generates ever more garbage, with limited capacity to sort and dispose of it.
Back to the APnA page.
All the analysis and results are sole responsibility of the authors @ UrbanEmissions.Info. Please send you comments and questions to simair@urbanemissions.info