Summary of PM2.5 Pollution and Meteorology Forecast for Today
(click here for today and next 3-days)
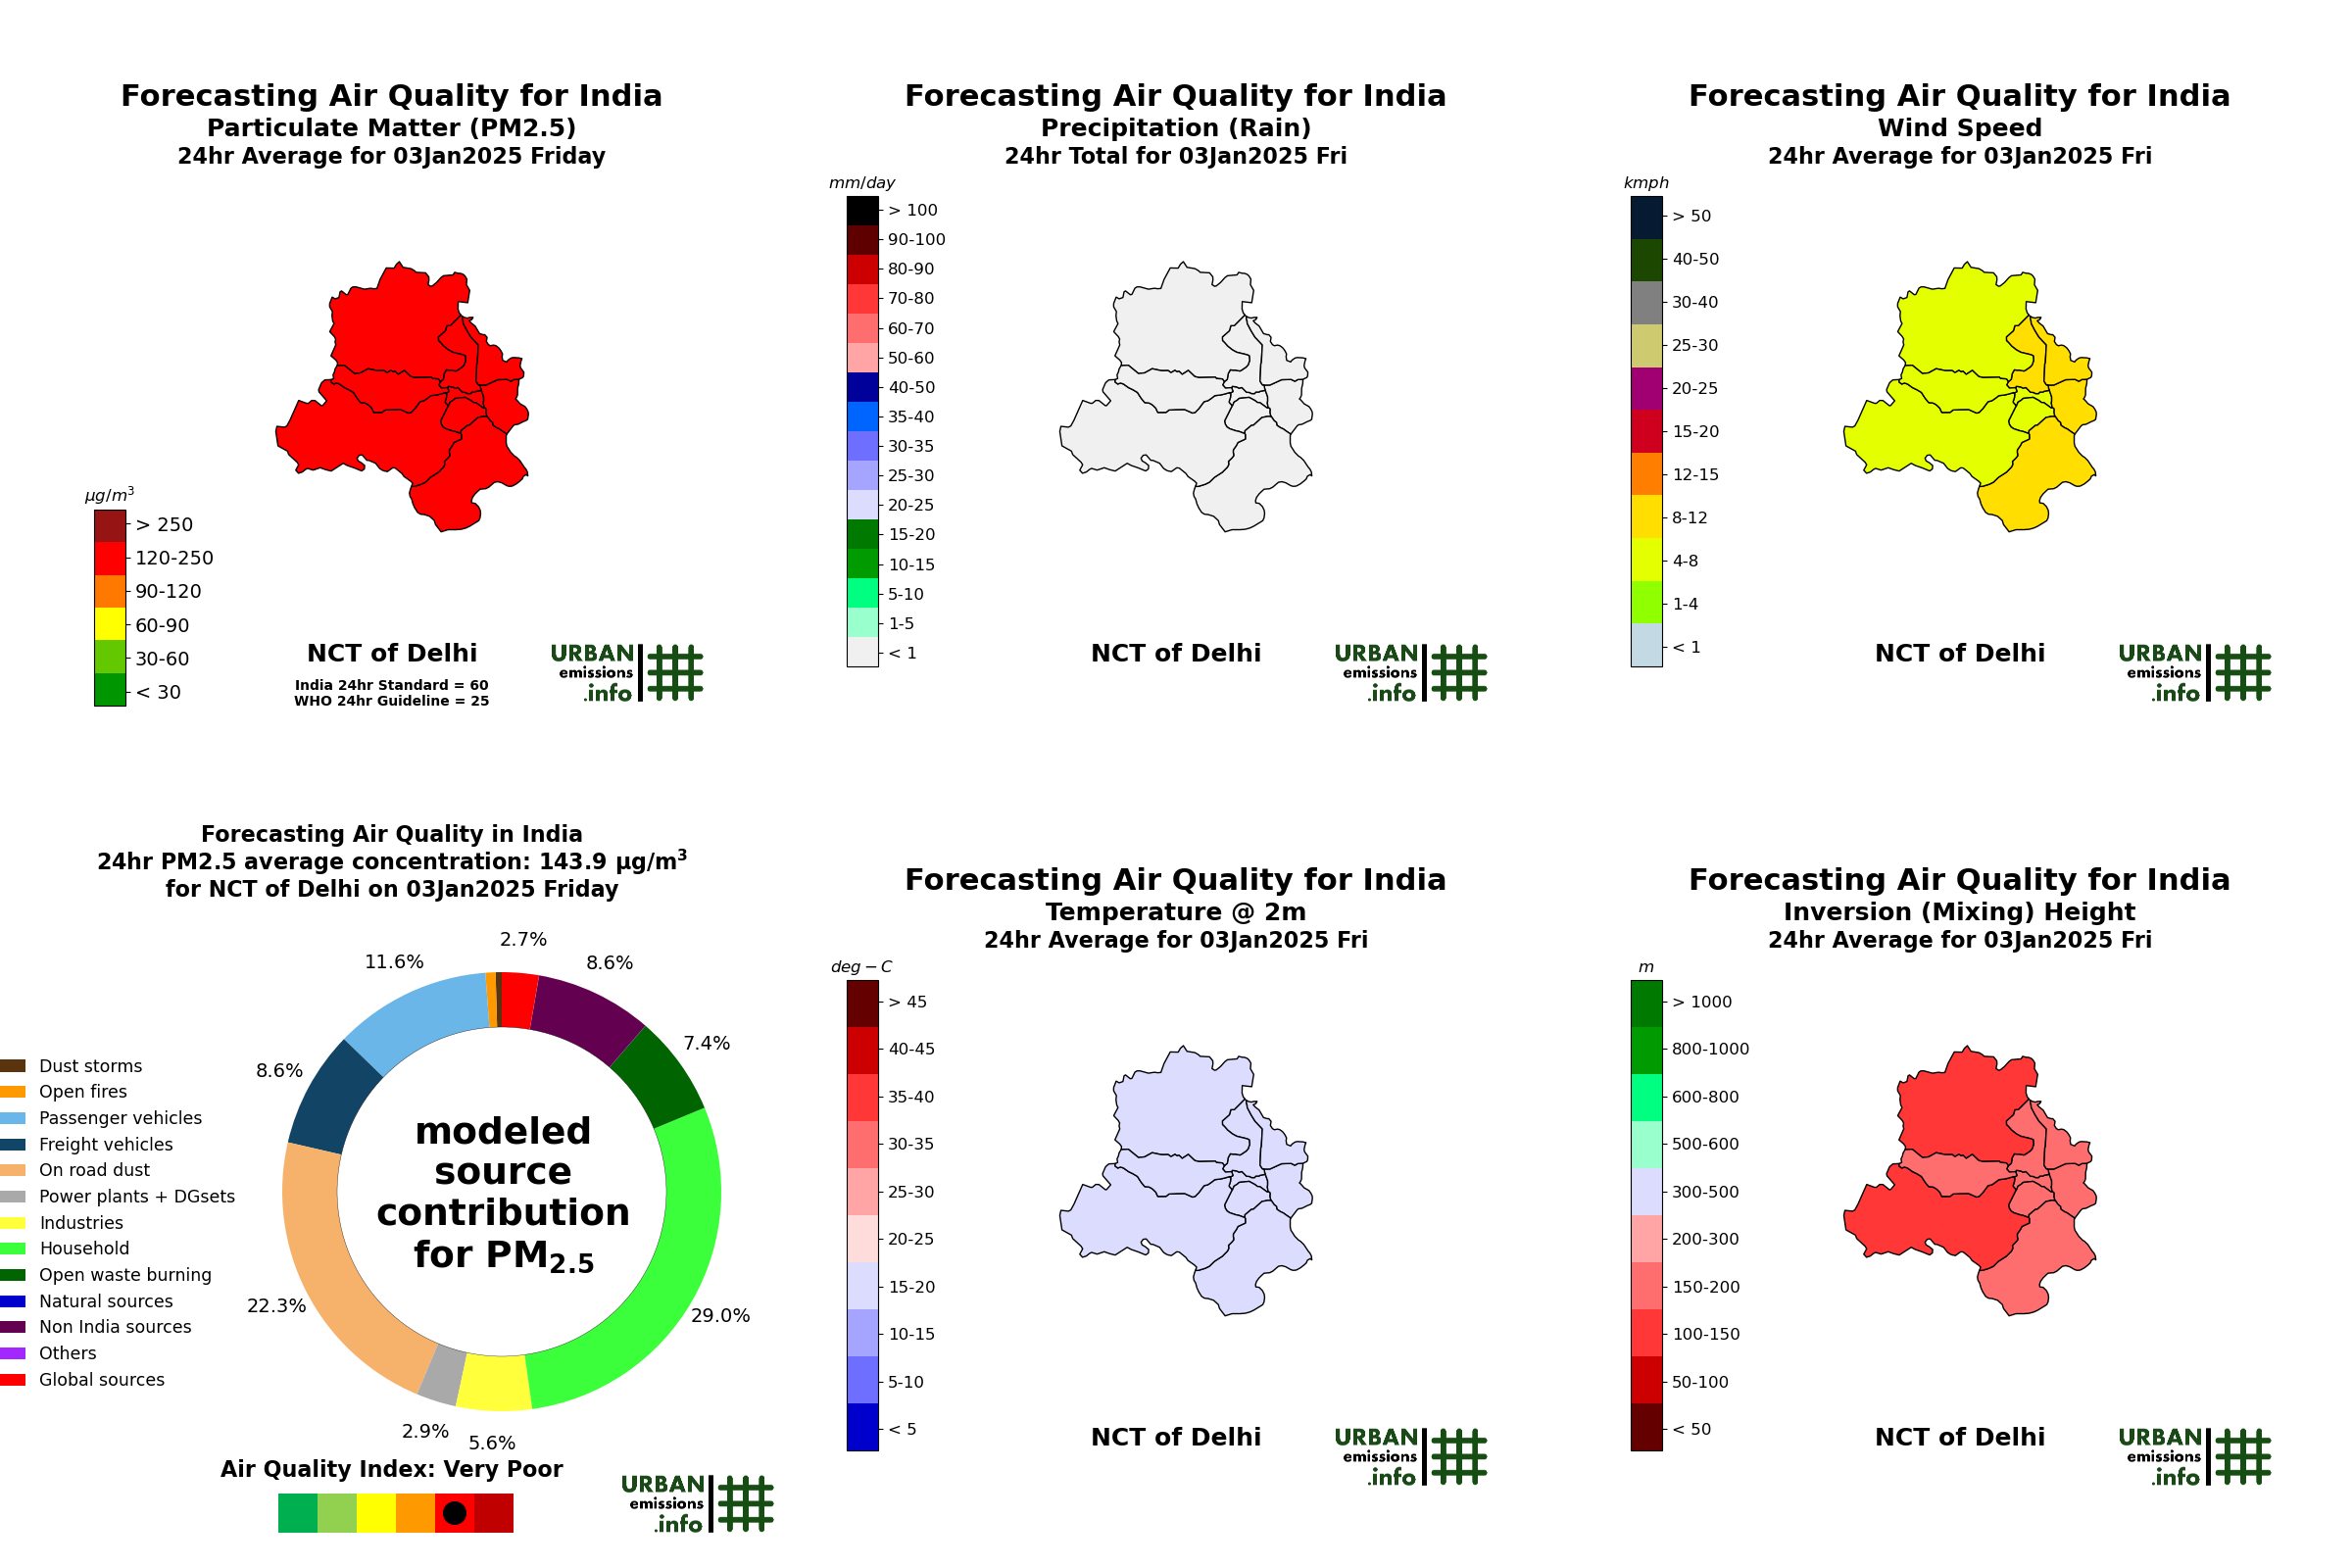
To support Delhi’s air pollution management, we forecast ambient concentrations for all the criteria pollutants for the next 72-hours. The modeling domain covering Delhi and its satellite cities, extends 80 km in North to South and 80 km West to East, with a spatial resolution of 0.01 degrees (~1 km) and a temporal resolution of 1 hour. The modeled meteorology and concentration data fields are updated everyday at ~7:00 PM IST.
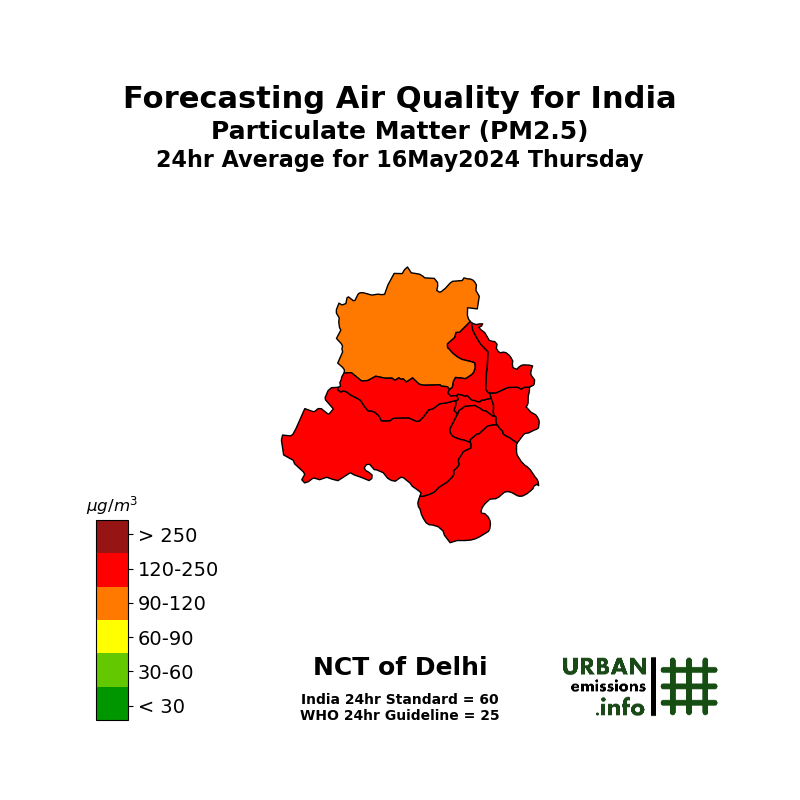
PM2.5
24-hr average Particulate Matter (< 2.5 micro-m)
 |
 |
 |
 |
Met Anime
Animations of meteorological parameters
 |
 |
 |
 |
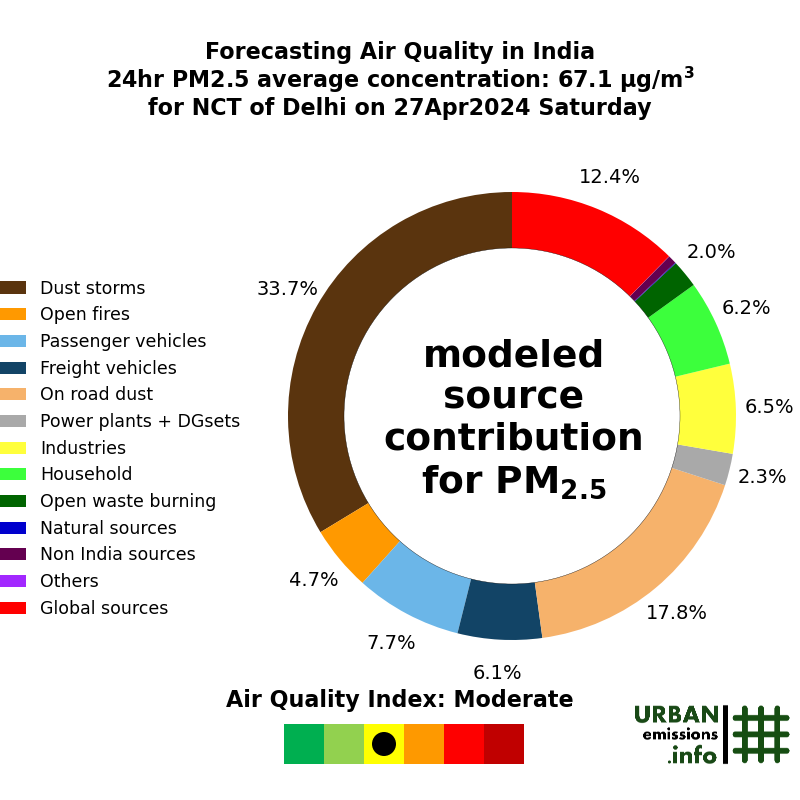
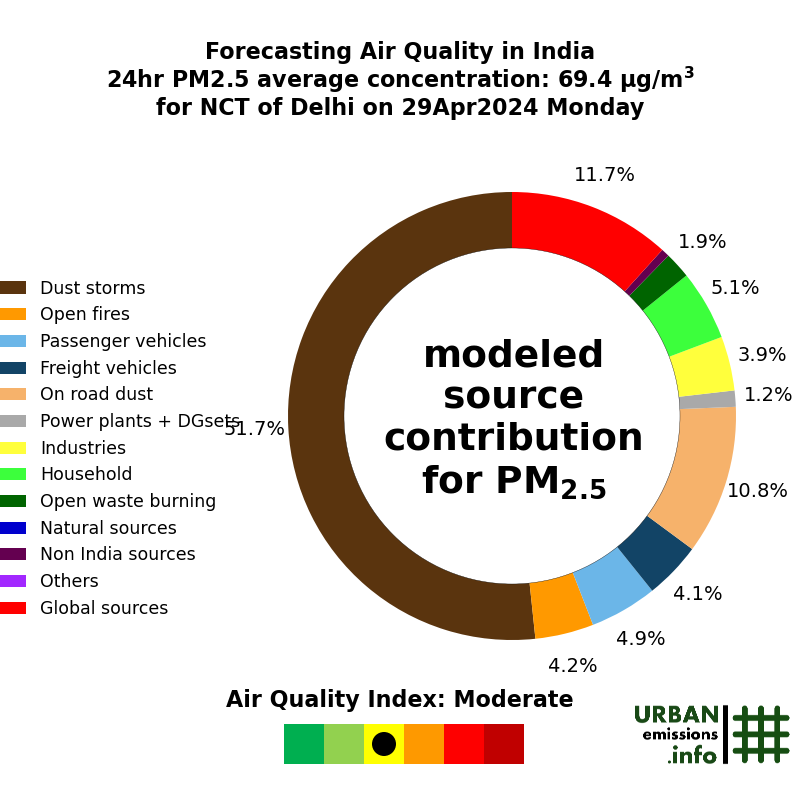
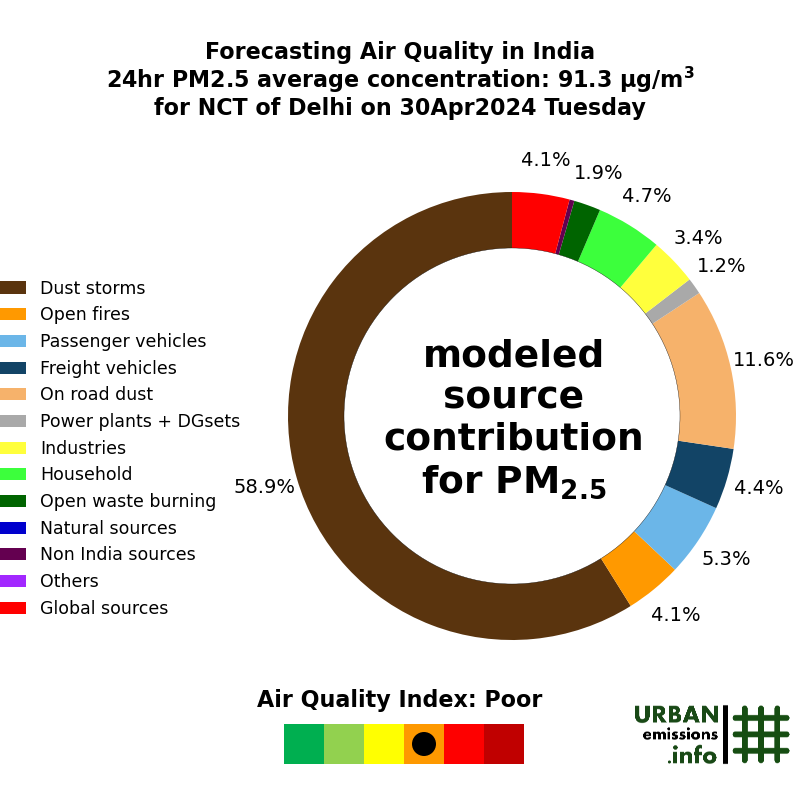
Modeled Source Contributions to PM2.5
 |
 |
 |
 |
Comparison plot below is updated once every 6-hours
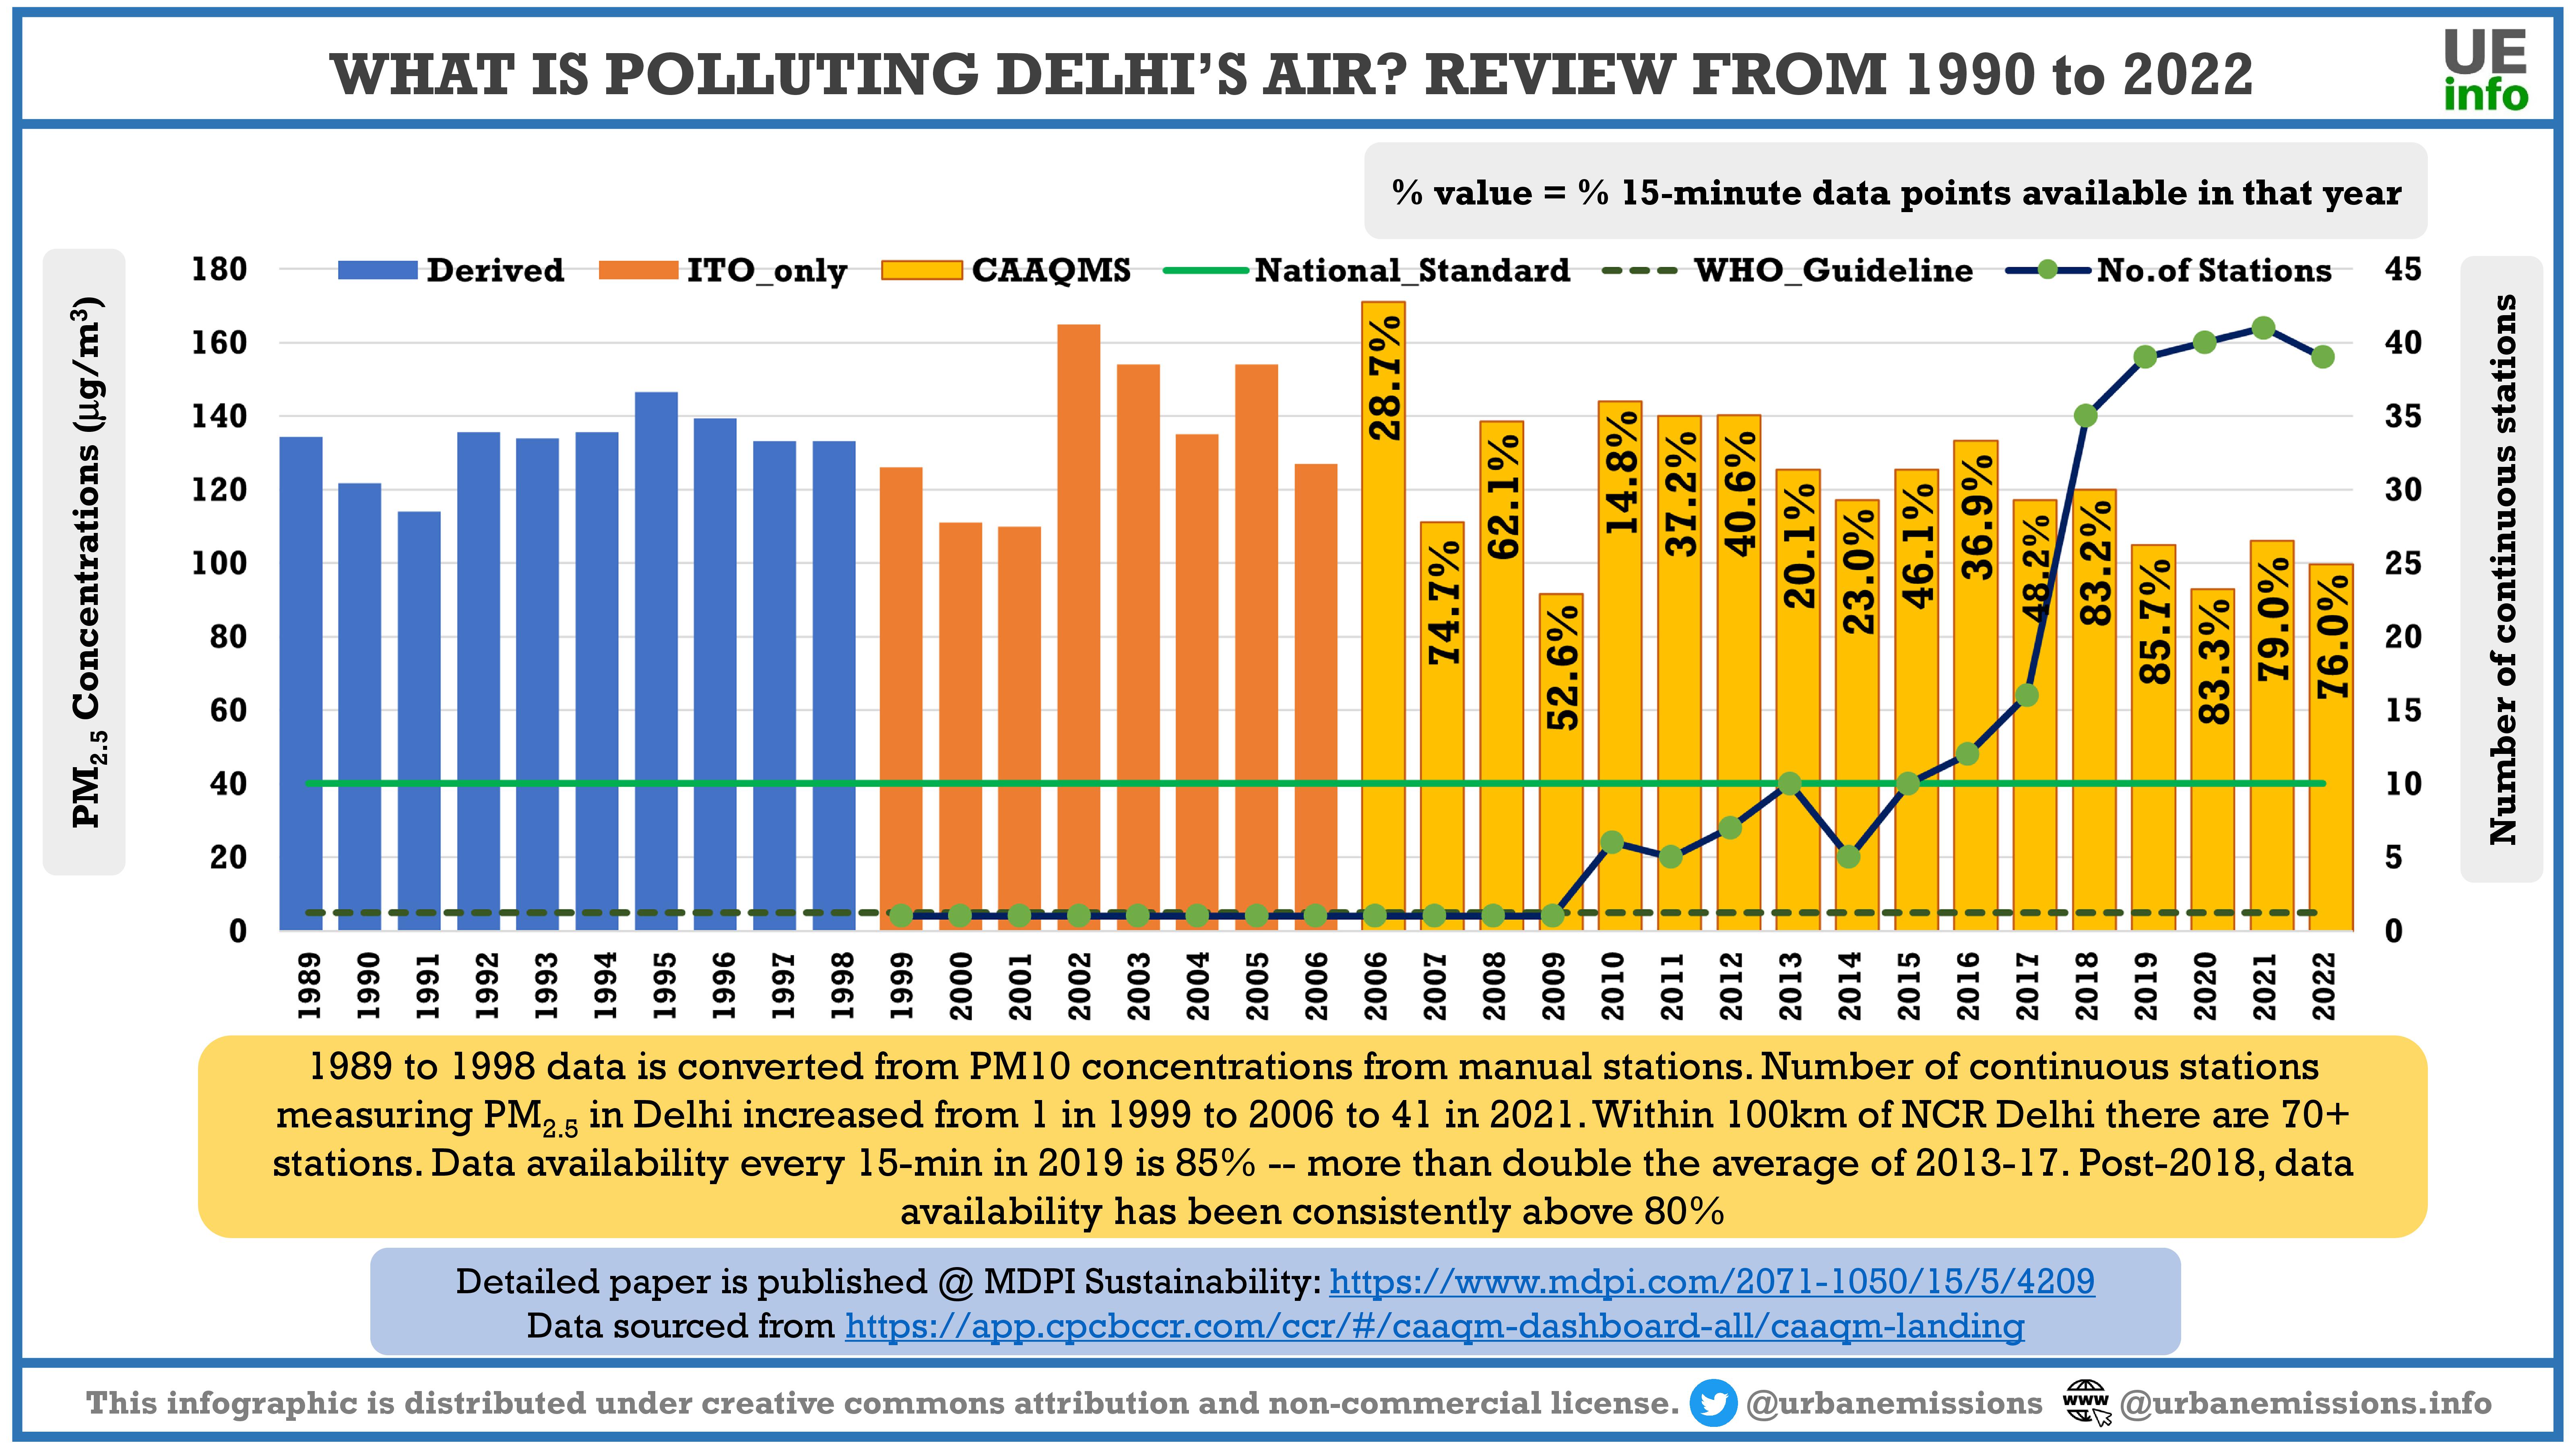
What is Polluting Delhi’s Air?
Air pollution in (urban and rural) India is a growing public concern, and city of Delhi (its capital) is one of the most studied city with a disproportionate share of media attention. Yet, we do not seem to have decisive answers to simple questions like how polluted is the city, what are the main sources, and where to start to control pollution in the city. A review of Delhi’s air quality from 1990 to 2022 from data, sectoral, judicial, and institutional perspectives was published as a journal article in 2023. All the data is included in the supplementary [main link].
 |
 |