 Particulate and gaseous emissions in two coastal cities – Chennai and Visakhapatnam, India
Journal article in Air Quality, Atmosphere, & Health (2015) Download
Application of SIM-air tools to assess air quality in Indian cities
Journal article in Atmospheric Environment (2012) Download
****
Chennai (capital of the state of Tamil Nadu) is one of four metropolitan cities of India, along with Delhi, Mumbai, and Kolkata. With its proximity to the Bay of Bengal and thus access to markets in East Asia, Chennai is also an important port city. Apart from trade and shipping, the automobile industry, chemical and petrochemical industry, software services, medical care, and manufacturing form the foundation of the economic base for Chennai. Manufacturers like Ford, Hyundai, Mitsubishi, Ashok Leyland, Massey Ferguson, Eicher, and other engineering and manufacturing units have taken advantage of the proximity to the port, as well as skilled labor in the region, to establish manufacturing centers in Chennai, thus accounting for 30 % of India’s auto industry.
The Greater Chennai region has a population of about 10 million. Thirteen percent of households own a car and 47% of households own a motorcycle. At US$219 billion, the Chennai metropolitan area is the fourth largest city by GDP in India.
The Ennore Port, the first major corporate port, handles coal (most of the supply is for the two thermal power plants with dedicated feeder lines running from the ports), iron ore, oil, and commercial commodities for the automobile and mineral industries. The annual capacity of 30 million tons of cargo in 2012–2013 is expected to triple by 2020, which is linked by road and rail transport, to most parts of South India.
To assess Chennai’s air quality, we selected 50km x 50km domain. This domain, including two large coal-fired power plants, heavy industries manufacturing cement, fertilizer, and petrochemical products, and a large brick kiln cluster, is further segregated into 1km grids, to study the spatial variations in the emission and the pollution loads.
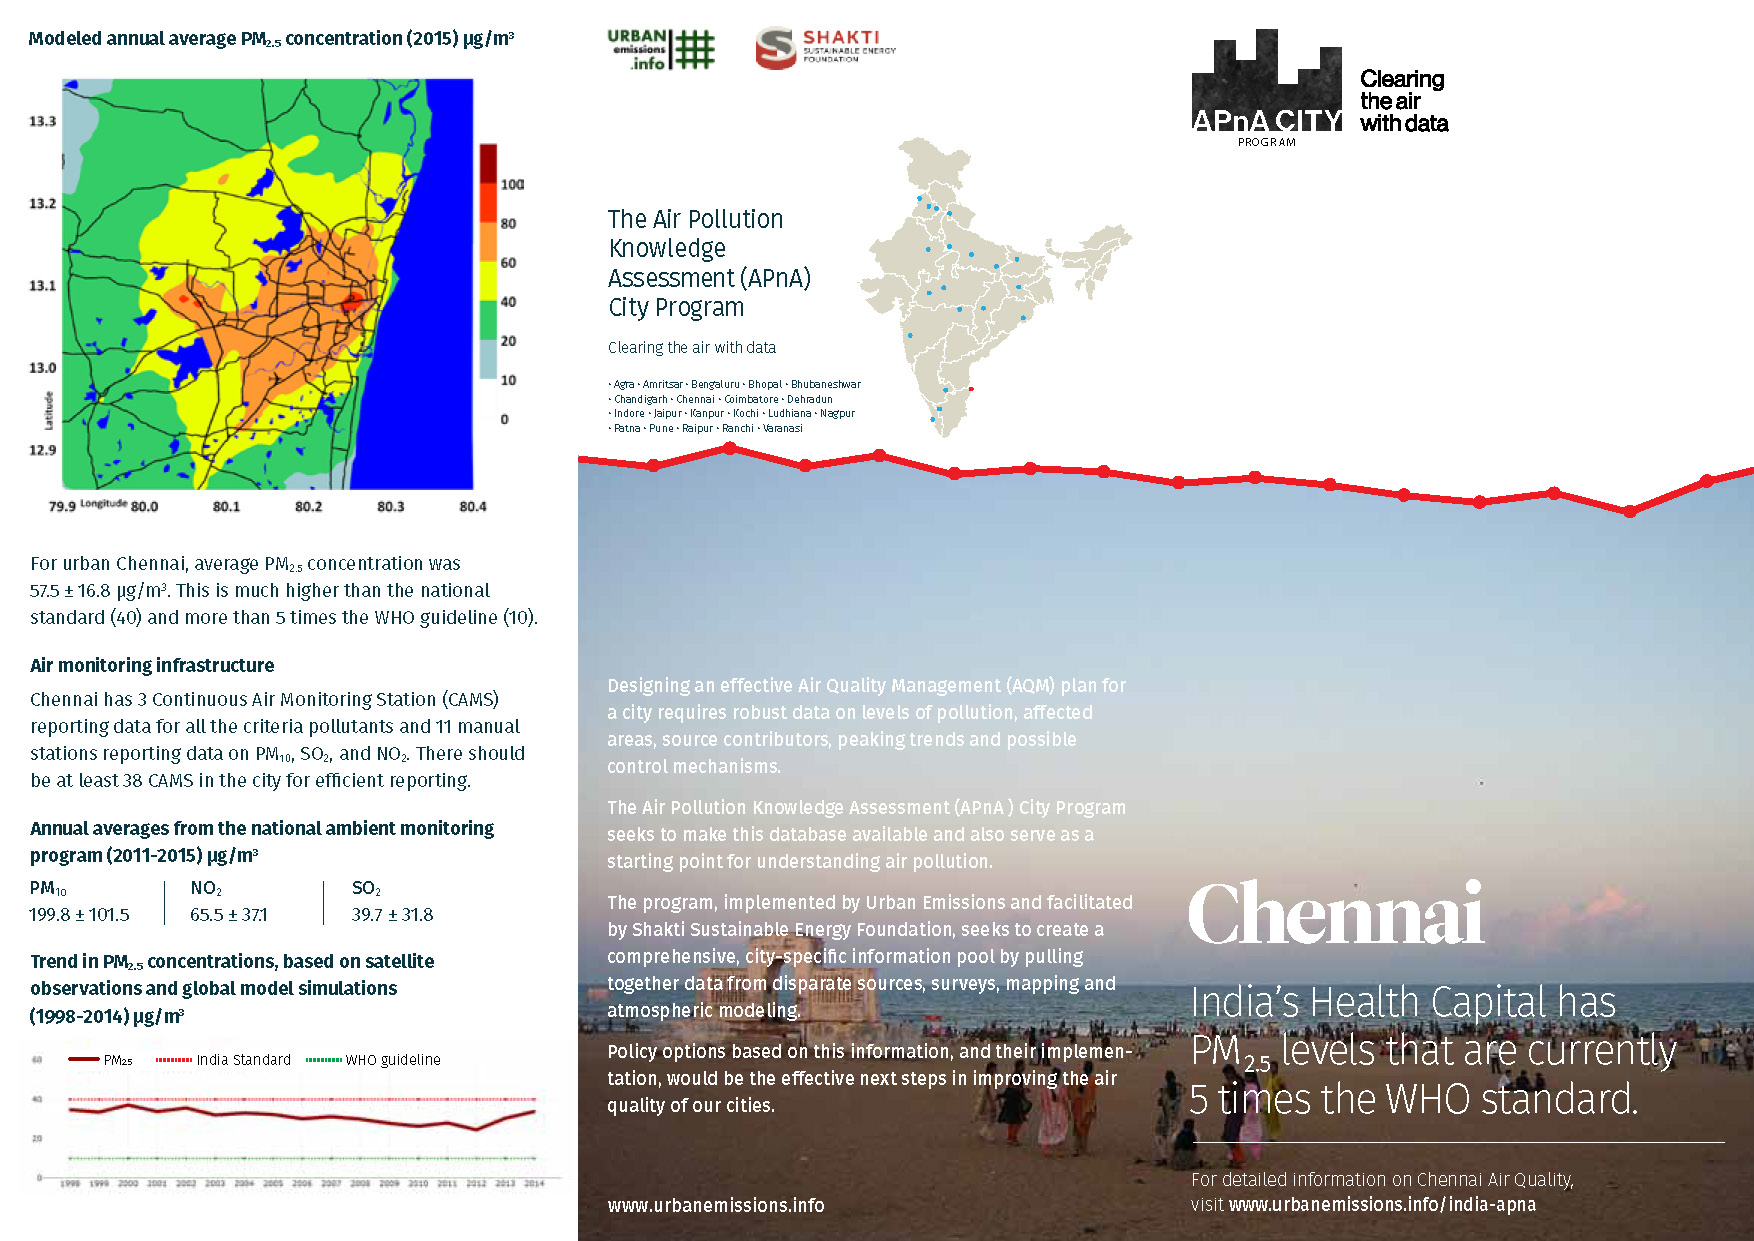
We present below a summary of the ambient monitoring data available under the National Ambient Monitoring Program (NAMP), operated and maintained by the Central Pollution Control Board (CPCB, New Delhi, India). In Chennai, there are 3 continuous air monitoring stations (CAMS) reporting data for all the criteria pollutants and 11 manual stations reporting data on PM10, SO2, and NO2.
Satellite Data Derived Surface PM2.5 Concentrations:
The results of satellite data derived concentrations are useful for evaluating annual trends in pollution levels and are not a proxy for on-ground monitoring networks. This data is estimated using satellite feeds and global chemical transport models. Satellites are not measuring one location all the time, instead, a combination of satellites provide a cache of measurements that are interpreted using global chemical transport models (GEOS-Chem) to represent the vertical mix of pollution and estimate ground-based concentrations with the help of previous ground-based measurements. The global transport models rely on gridded emission estimates for multiple sectors to establish a relationship with satellite observations over multiple years. These databases were also used to study the global burden of disease, which estimated air pollution as the top 10 causes of premature mortality and morbidity in India. A summary of PM2.5 concentrations from this exercise, for the city of Chennai is presented below. The global PM2.5 files are available for download and further analysis @ Dalhousie University.
We compiled an emissions inventory for the chennai region for the following pollutants – sulfur dioxide (SO2), nitrogen oxides (NOx), carbon monoxide (CO), non-methane volatile organic compounds (NMVOCs), carbon dioxide (CO2); and particulate matter (PM) in four bins (a) coarse PM with size fraction between 2.5 and 10 μm (b) fine PM with size fraction less than 2.5 μm (c) black carbon (BC) and (d) organic carbon (OC), for year 2015 and projected to 2030.
We customized the SIM-air family of tools to fit the base information collated from the central pollution control board, state pollution control board, census bureau, national sample survey office, ministry of road transport and highways, annual survey of industries, central electrical authority, ministry of heavy industries, municipal waste management, geographical information systems, meteorological department, and publications from academic and non-governmental institutions.
This emissions inventory is based on the available local activity and fuel consumption estimates for the selected urban airshed (presented in the grid above) and does not include natural emission sources (like dust storms, lightning) and seasonal open (agricultural and forest) fires; which can only be included in a regional scale simulation. These emission sources are accounted in the concentration calculation as an external (also known as boundary or long-range) contribution to the city’s air quality.
The emissions inventory was then spatially segregated at a 0.01° grid resolution in longitude and latitude (equivalent of 1 km) to create a spatial map of emissions for each pollutant (PM2.5, PM10, SO2, NOx, CO and VOCs). The gridded PM2.5 emissions and the total (shares by sector) emissions are presented below.
Gridded PM2.5 Emissions (2015)

Total PM2.5 Emissions by Sector 2015-2030
 |
 |
 |
Total Estimated Emissions by Sector for 2015 (units – mil.tons/year for CO2 and tons/year for the rest)
| PM2.5 | PM10 | BC | OC | NOx | CO | VOC | SO2 | CO2 | |
|---|---|---|---|---|---|---|---|---|---|
| TRAN | 11,800 | 12,400 | 5,000 | 3,750 | 20,900 | 176,750 | 56,950 | 1,050 | 5.40 |
| RESI | 1,450 | 1,450 | 550 | 550 | 1,300 | 13,750 | 1,700 | 450 | 1.53 |
| INDU | 65,700 | 71,600 | 7,150 | 2,350 | 174,900 | 81,100 | 24,150 | 23,350 | 2.10 |
| DUST | 5,750 | 37,200 | - | - | - | - | - | - | - |
| WAST | 5,100 | 5,350 | 400 | 3,050 | 100 | 24,450 | 4,950 | 150 | 0.03 |
| DGST | 800 | 850 | 450 | 150 | 7,350 | 1,950 | 200 | 50 | 0.33 |
| BRIC | 3,450 | 3,500 | 950 | 1,400 | 2,850 | 47,550 | 4,950 | 1,550 | 0.37 |
| 94,050 | 132,350 | 14,500 | 11,250 | 207,400 | 345,550 | 92,900 | 26,600 | 9.76 |
TRAN = transport emissions from road, rail, aviation, and shipping (for coastal cities); RESI = residential emissions from cooking, heating, and lighting activities; INDU = industrial emissions from small, medium, and heavy industries (including power generation); DUST = dust emissions from road re-suspension and construction activities; WAST = open waste burning emissions; DGST = diesel generator set emissions; BRIC = brick kiln emissions (not included in the industrial emissions)
We processed the NCEP Reanalysis global meteorological fields from 2010 to 2016 through the 3D-WRF meteorological model. A summary of the data for year 2015, averaged for chennai is presented below. Download the processed data which includes information on year, month, day, hour, precipitation (mm/hour), mixing height (m), temperature (C), wind speed (m/sec), and wind direction (degrees) – key parameters which determine the intensity of dispersion of emissions.
Dispersion Modeling
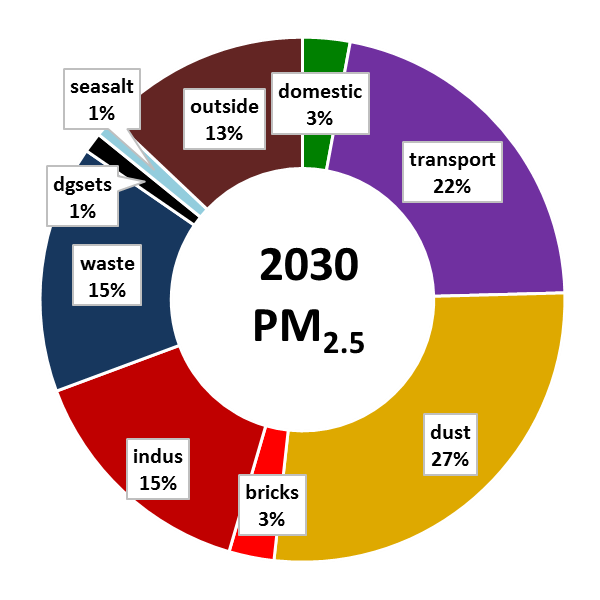
We calculated the ambient PM2.5 concentrations and the source contributions, using gridded emissions inventory, 3D meteorological data (from WRF), and the CAMx regional chemical transport model. The model simulates concentrations at 0.01° grid resolution and sector contributions to the urban area, which include contributions from primary emissions, secondary sources via chemical reactions, and long range transport via boundary conditions (represented as “outside” in the pie graph below).
 |
 |
 |
- Modeled urban average ambient PM2.5 concentration is 57.5 ± 16.8 μg/m3 – is above the national standard (40) and more than 5 times the WHO guideline (10)
- The city requires at least 38 continuous air monitoring stations to statistically, spatially, and temporally, represent the mix of sources and range of pollution in the city (current status – 11 manual and 3 continuous)
- The modeled source contributions highlight transport (including on road dust), industries (including the coal-fired power plants), and open waste burning as the key air pollution sources in the urban areas
- The city benefits from the land-sea breeze, limiting the contribution of sources outside the urban airshed to an estimated 13% of the ambient annual PM2.5 pollution (in 2015). This contribution is mostly stemming large (metal and non-metal processing) industries, and brick kilns located outside the urban airshed
- The city needs to aggressively promote public and non-motorized transport as part of the city’s urban development plan, along with the improvement of the road infrastructure to reduce on-road dust re-suspension
- Due to the presence of a large commercial port, the freight movement in and out on the city roads is among the highest in the country, which also leads to emissions from vehicles not registered in the city or the state. The city can benefit from a freight management program to reduce the footprint of emissions from these heavy duty and light duty vehicles, and associated port activities
- By 2030, the vehicle exhaust emissions are expected to remain constant, if and only if, Bharat 6 fuel standards are introduced nationally in 2020, as recommended by the Auto Fuel Policy
- By 2030, the share of emissions from residential cooking and lighting is expected to decrease with a greater share of LPG, residential electrification, and increasing urbanization
- The 430 brick kilns in the urban airshed are fueled mostly by coal, agri-waste, ship bunker fuel, and other biomass. These kilns can benefit from a technology upgrade from the current fixed chimney and clamp style baking to (for example) zig-zag, in order to improve their overall energy efficiency.
- The two coal-fired power plants need to practice and enforce stricter environmental standards for all the criteria pollutants to reduce their share of influence on urban air quality
- Open waste burning is dispersed across the city and requires stricter regulations for addressing the issue, as the city generates ever more garbage, with limited capacity to sort and dispose of it.
Back to the APnA page.
All the analysis and results are sole responsibility of the authors @ UrbanEmissions.Info. Please send you comments and questions to simair@urbanemissions.info